
 Open Access Article
 This Open Access Article is licensed under a Creative Commons Attribution-Non Commercial 3.0 Unported Licence
Carbon dot based nucleus targeted fluorescence imaging and detection of nuclear hydrogen peroxide in living cells
Kabyashree
Phukan
a,
Ritwick Ranjan
Sarma
a,
Somarani
Dash
b,
Rajlakshmi
Devi
 *b and
Devasish
Chowdhury
*a
*b and
Devasish
Chowdhury
*a
aMaterial Nanochemistry Laboratory, Physical Sciences Division, India. E-mail: devasish@iasst.gov.in; Tel: +91 3612270095
bLife Sciences Division, Institute of Advanced Study in Science and Technology, Paschim Boragaon, Garchuk, Guwahati-781035, India. E-mail: rajiasst@gmail.com
First published on 20th October 2021
Abstract
Investigation of the intracellular generation of H2O2, one of the most important reactive oxygen species (ROS), is crucial for preventing various diseases since it is closely linked with different physiological and complex cell signaling pathways. Despite the development of various fluorescent probes, the majority of the fluorescent probes cannot move across the nuclear membrane. However, detection of the nuclear level of H2O2 is very important since it can directly cause oxidative DNA damage which ultimately leads to various diseases. Therefore, in this study, p-phenylenediamine based carbon quantum dots (B-PPD CDs) have been synthesized and integrated with 4-formylbenzeneboronic acid as a doping agent for the detection of H2O2. The detection mechanism showed that, upon exposure to H2O2, the fluorescence of the B-PPD CDs was immediately quenched. Further investigation has been done in the in vitro RAW 264.7 cell line by both exogenous and endogenous exposure of H2O2 to demonstrate the feasibility of the method. It is shown successfully that the exogenous presence and endogenous generation of H2O2 in RAW 264.7 cells can be detected using B-PPD CDs. The limit of detection (LOD) was determined to be 0.242 μM. The development of such imaging probes using carbon quantum dots will lead to live-cell imaging as well as ROS detection.
1 Introduction
The term reactive oxygen species (ROS) is used for the partially reduced intermediate products of oxygen that are generated during the mitochondrial oxidative metabolism in a living organism.1–3 Among reactive oxygen species (ROS), H2O2 is considered as one of the major ROS that participate in cellular signal transduction, differentiation, cellular proliferation, immune systems, and various physiological processes.4–6 The major role of H2O2 in the body is that it acts as an oxidative stress marker and also plays an important role in the protection against invading pathogens.7 However the formation of high concentrations of H2O2 leads to the oxidation of various biomolecules such as DNA, enzymes, many proteins, and fatty acids which results in the disruption of a balanced cell redox mechanism and ultimately causes an increased risk of many diseases including cancer, stroke, Alzheimer's disease, etc.8–11 Unlike superoxide free radicals which are extremely short-lived since they undergo rapid reduction into hydrogen peroxide via an enzymatic reaction of superoxide dismutase (SOD),12 hydrogen peroxide exhibits a long life span.13 Due to its higher stability, it is considered to be a well-established cellular oxidative stress biomarker.14,15 Therefore, accurate detection of hydrogen peroxide expedites proper diagnosis and prevention of various relative diseases.There are various techniques for the measurement of ROS such as high-performance liquid chromatography,16,17 fluorescence,18 colorimetry,19 and electrochemistry,20,21 which have already been reported. Apart from such technologies, researchers are engaged in enzyme-based detection of H2O2.22,23 Drawbacks of such approaches involved specialized equipment and tiresome analysis as well as poor reproducibility and instability.24,25 Among various analytical approaches, fluorescence-based probe technology exhibits tremendous advantages in the detection of highly reactive oxygen species (hROS) because of its unique features such as excellent biocompatibility, rapid response, and high temporal and spatial resolution.26–29 Despite using several fluorescent probes, very few are practically applicable because of their photophysical limitations, i.e., relatively short excitation/emission wavelengths which limit their application in deep tissue penetration with a minimized background.30 There are some limitations of short emission wavelength probes. Some intrinsic biomolecules (such as NADH, folic acid, etc.), hemoglobin (Hb) and oxyhemoglobin (HbO2) can absorb a two-photon fluorescent probe at <550 nm emission which increases the background fluorescence by decreasing the collection efficiency in deep tissue imaging,31 which causes background fluorescence in the blue to green region.32 Therefore, preparation of such probes with emission in the red-emissive region (>600 nm) is advantageous since it can avoid cellular absorption of biomolecules and facilitates deeper into tissues (higher collection efficiency) by minimizing the background fluorescence noise.33
Carbon quantum dots (CDs) are an emerging nanomaterial and have been used as an alternative to conventional organic dyes in various applications including bioimaging, sensing, etc. due to their good biocompatibility,34 high photostability,35 high pH stability, etc.36–38
Moreover, the application of most of the reported CDs is usually restricted because their emission usually concentrates on the blue light region.39–41 Red emission CDs can be prepared by the precursor PPD (p-phenylenediamine) which shows an emission longer than 600 nm.42–44 Recently Wang et al. reported different PPD CDs where emissions based on solvent with QY for red emission approached 34%.45 Despite knowing this fact, the solvent-based tunable properties of CDs and red emission of PPD based CDs are still unclear.
The detection of ROS especially hydrogen peroxide has been explored by many researchers using various CDs via modification of their surface. Zheng et al.46 successfully achieved the colorimetric detection of H2O2 and glucose by CQDs via utilizing the peroxidase-like catalytic activity. Li et al.47 functionalized CQDs with boronic acid substituted bipyridinium salt to detect glucose via fluorescence quenching by the salt resulting in the recovery of glucose. Similarly, Qu et al.48 synthesized phenylboronic acid-functionalized CQDs as a glucose-sensing system.
The nucleus of eukaryotic cells plays a crucial role in various genomic regulatory processes including the generation of reactive oxygen species such as H2O2, HOCl, etc.49 Moreover, abnormal generation of ROS in nuclei triggers oxidative stress which ultimately leads to oxidative DNA damage, consequently linked with various disorders such as cancer, aging, Alzheimer's disease, and so on.8–11 Therefore, monitoring of nuclear ROS flux becomes very important in the diagnosis of such diseases. To address the issue, fluorescence tracking is a very influential tool that can detect several ROS species such as H2O2. Various types of fluorescence probe have been synthesized that are recognized for their high sensitivity and specific selectivity but most of them are capable of gathering only in the cytoplasm and cannot penetrate the nuclear envelope46–48 and therefore the limitation of diffusion from the cytoplasm to nucleoplasm sometimes prevents the status of the nuclear ROS level to be checked. However, at present, a very small number of nucleus-targeted probes have been developed.50
In the current work, we synthesized a nucleus targeted fluorescent CD-based sensing system for hydrogen peroxide detection by taking p-phenylenediamine (PPD) as a precursor doped with 4-formylbenzeneboronic acid via the microwave-assisted method. This one-pot solvothermal boronic acid-based PPD CD preparation has been reported for the first time for hydrogen peroxide detection without requiring any further functionalization. Moreover, among various biological ROS and other biomolecules, B-PPD CDs display high specificity and sensitivity to H2O2. Furthermore, B-PPD CDs have been exposed to murine macrophage cell line RAW 264.7 where the bright red fluorescence intensity of B-PPD CDs immediately decreases to a significant level after exposure to hydrogen peroxide. Such quenching effect is shown in both endogenous and exogenous H2O2 spikes in living RAW 264.7 cells without showing any marked cytotoxicity (Scheme 1).
 | ||
| Scheme 1 Schematic representation of the synthesis of B-PPD CDs and a fluorescent switch on–off sensor for H2O2 detection. | ||
2 Experimental
2.1 Reagents and materials
p-Phenylenediamine, 4-formylbenzeneboronic acid, and H2O2 were purchased from Sigma-Aldrich. The RAW 264.7 macrophage cell line was purchased from NCCS Pune. Lipopolysaccharide (LPS) was purchased from Sigma-Aldrich. ProLong Gold Antifade Mountant with DAPI was obtained from Thermo Fisher Scientific, and Fluoromount aqueous mounting medium and paraformaldehyde were from Merck. The other reagents for the experiments were of analytical grade and utilized as received. Ultrapure water was produced from a Millipore-Q water purification system.2.2 Instrumentation
The morphology of the carbon dots was examined using a TEM JEOL 2100 plus instrument. Samples were prepared by dropping ethanolic suspensions onto amorphous carbon film-coated Cu TEM grids and dried in an oven. The UV-vis spectrum was recorded using a Shimadzu UV 2600 UV-vis spectrophotometer. Fourier transform infrared spectroscopy (FTIR) analysis was carried out on a PerkinElmer instrument. Particle size and zeta potential measurements were performed on a Malvern Zetasizer Nano series Nano-ZS90. Fluorescence spectra were examined using a Jasco spectrofluorometer, FP-8300. Cell imaging was obtained using a Leica confocal laser scanning microscope (CLSM).2.3 Synthesis and characterization of B-doped p-phenylenediamine based carbon quantum dots (B-PPD CDs)
p-Phenylenediamine (0.25 mM) was mixed with 4-formylbenzeneboronic acid (2.7 mg) in 50 ml of ethanol and sonicated for 15 minutes. The fine mixture was introduced into a microwave reactor at 140 °C for 15 minutes. After that, the solution was kept at room temperature for cooling down and centrifuged at 10![[thin space (1/6-em)]](https://www.rsc.org/images/entities/char_2009.gif) 000 rpm for 15 minutes for exclusion of larger particles. Finally, the B-doped PPD CD solution was filtered through a 0.22 μm sterile syringe filter.
000 rpm for 15 minutes for exclusion of larger particles. Finally, the B-doped PPD CD solution was filtered through a 0.22 μm sterile syringe filter.
2.4 Quantum yield measurement
The quantum yield calculation was done using the following equation:| Q = QR × (I/IR × AR/A × η2/η2R) |
2.5 Fluorescence quenching of B-doped p-phenylenediamine based carbon quantum dots (B-PPD CDs) by H2O2
Different concentrations of H2O2 were added to the B-PPD CD solution by continuous stirring and the corresponding fluorescence spectrum was recorded.2.6 Calculation of the limit of detection (LOD)
The fluorescence emission spectrum of B-PPD CDs was measured 25 times (n = 25) and the standard deviation of the blank measurement was evaluated. The fluorescence intensity was measured at 606 nm plotted against the concentration of H2O2. The detection limit was calculated based on the formula 3σ/m, where σ is the standard deviation of the blank measurement, m is the slope between the fluorescence intensity and H2O2 concentration.2.7 Effect of pH
For efficient detection of H2O2 at physiological pH, the fluorescence intensity of B-PPD CDs was measured at different pH ranging from 4 to 9 to explore its fluorescence response at different pH. In this study, the PL intensity was checked at an excitation wavelength of 520 nm with various H2O2 concentrations.2.8 Selectivity and interference studies of interfering agents
Selectivity studies of B-PPD CDs (20 μg ml−1) towards H2O2 were performed, and testing species including reactive oxygen species (ROS) such as H2O2, tert-butoxy radical (˙OtBu), hypochlorite (OCl−), tertbutyl hydroperoxide (TBHP), hydroxyl radical (˙OH), singlet oxygen (1O2), and superoxide (O2˙−) (200 μM for each species), amino acids (Met, Leu, and Tryp), biomolecules (ascorbic acid and glucose), other ions (Fe2+, Ca2+, Mg2+, Cu2+, Cd2+, Na+, and K+) and several proteolytic enzymes such as pronase, proteinase k, proteinase 3, trypsin, and cathepsin G were investigated at different concentrations.2.9 Cell culture
The RAW 264.7 (macrophage) murine cell line was procured from the National Centre for Cell Sciences (NCCS), Pune, India. Cells were cultured and maintained in Dulbecco's Modified Eagle's Medium (DMEM) (4.5 g L−1) with 10% heat-inactivated fetal bovine serum (FBS), 1% antibiotic-antimycotic, cultured in a T-75 cm2 flask, and kept at 37 °C in an incubator with 5% atmospheric CO2 and observed daily using an inverted microscope, Leica DMi1.| Cell viability (%) = (Abs sample − Abs blank/Abs control − Abs blank) × 100 |
3 Results and discussion
3.1 Characterization of B-doped p-phenylenediamine based carbon quantum dots (B-PPD CDs)
The 4-formylbenzeneboronic acid doped PPD based carbon quantum dots were characterized by UV-visible absorption spectroscopy, fluorescence spectroscopy, Fourier transform infrared spectroscopy (FTIR), dynamic light scattering (DLS) technique, zeta potential analysis, and transmission electron microscopy (TEM). The quantum yield (QY) of B-PPD CDs was found to be 5.5% with the reference rhodamine B (31%).The optical properties of B-PPD CDs were analyzed by UV-vis absorption and fluorescence spectrum measurements. The UV-vis absorption spectra of the B-PPD CDs and undoped PPD CDs are shown in Fig. 1(A). B-PPD CDs showed two characteristic peaks at 266 and 285 nm due to the n–ơ* transition. In contrast, the undoped PPD CDs showed peaks at 224 nm and 285 nm due to ơ–ơ* and n–ơ* transitions, respectively. The photoluminescence (PL) properties of B-PPD CDs were studied by monitoring the emission of excitation wavelengths from 400 nm to 600 nm. The stacked emission observed for B-PPD CDs for different excitations is shown in Fig. 1(B). It is evident from the stacked emission spectra that the position of the emission peak did not show a marked obvious shift, indicating that B-PPD CDs exhibited excitation-independent photoluminescence properties. However, B-PPD CDs exhibit their maximum main emission peak at 606 nm when the excitation wavelength is 520 nm. It is to be noted that under a UV lamp B-PPD CDs show red fluorescence. The inset shows a photograph of B-PPD CDs under a UV lamp. Since the emission range is above 600 nm, B-PPD CDs can be targeted for live-cell imaging without any further damage to the cell by avoiding the quenching noise from other biomolecules. So, detection using B-PPD CDs through the imaging technique is demonstrated later on.
 | ||
| Fig. 1 (A) The UV-visible absorption spectra of B-PPD CDs and PPD CDs excited at 520 nm wavelength. (B) Fluorescence spectra of B-PPD CDs excited in the wavelength range from 400 nm to 600 nm. Inset: photograph of B-PPD CDs under a UV-visible lamp. (C) FTIR spectra of PPD CDs and B-PPD CDs. | ||
An FTIR study was carried out on the synthesized PPD CDs and B-PPD CDs. The stacked FTIR spectra of PPD CDs and B-PPD CDs are shown in Fig. 1(C). PPD CDs show peaks at 3346 cm−1 due to N–Hstr and 2917 cm−1 due to C–Hstr. The strong peak at 1061 cm−1 is due to C–Hdef out of plane for an aromatic ring. In addition, the characteristics peak at 1630 cm−1 is due to C![[double bond, length as m-dash]](https://www.rsc.org/images/entities/char_e001.gif) Cstr. On the other hand, for B-PPD CDs the peak due to N–Hstr is shifted to 3408 cm−1 as a result of hydrogen bonding between –NH2 and B. The C–Hstr peak is also shifted to 2924 cm−1. All other characteristic peaks of PPD CDs, viz. those at 1381 (well resolved) and 1630 cm−1 due to C–Nstr and C–Hdef out of plane, respectively, are present as well in B-PPD CDs. The size of the B-PPD CDs was measured by DLS and found to be ∼1.73 nm. The zeta potential of B-PPD CDs was evaluated and found to be +3.43 mV. The positive surface charge on B-PPD CDs is due to protonation of the –NH2 group under slightly acidic conditions (Fig. 2(A) and (B)). A representative TEM image of B-PPD CDs is shown in Fig. 2(C). It is evident from the TEM image that the synthesized B-PPD CDs are of sizes below 10 nm. In addition, the high-resolution transmission electron microscopy (HRTEM) image of one quantum dot particle in the inset clearly shows the crystal plane of carbon quantum dots, hence demonstrating the crystalline nature of B-PPD CDs.
Cstr. On the other hand, for B-PPD CDs the peak due to N–Hstr is shifted to 3408 cm−1 as a result of hydrogen bonding between –NH2 and B. The C–Hstr peak is also shifted to 2924 cm−1. All other characteristic peaks of PPD CDs, viz. those at 1381 (well resolved) and 1630 cm−1 due to C–Nstr and C–Hdef out of plane, respectively, are present as well in B-PPD CDs. The size of the B-PPD CDs was measured by DLS and found to be ∼1.73 nm. The zeta potential of B-PPD CDs was evaluated and found to be +3.43 mV. The positive surface charge on B-PPD CDs is due to protonation of the –NH2 group under slightly acidic conditions (Fig. 2(A) and (B)). A representative TEM image of B-PPD CDs is shown in Fig. 2(C). It is evident from the TEM image that the synthesized B-PPD CDs are of sizes below 10 nm. In addition, the high-resolution transmission electron microscopy (HRTEM) image of one quantum dot particle in the inset clearly shows the crystal plane of carbon quantum dots, hence demonstrating the crystalline nature of B-PPD CDs.
 | ||
| Fig. 2 (A) Particle size distribution and (B) zeta potential measured via dynamic light scattering (DLS) measurement of B-doped PPD CDs. (C) Representative TEM image of B-PPD CDs. Inset: high-resolution TEM (HRTEM) image of B-PPD CDs magnifying one quantum dot. | ||
3.2 Fluorescence quenching of B-doped p-phenylenediamine based carbon quantum dots (B-PPD CDs) by H2O2
The fluorescence response or sensitivity of B-PPD CDs towards H2O2 was investigated by employing the titration method with H2O2. The change in fluorescence intensity of B-PPD CDs was observed upon the addition of different concentrations of H2O2. Fig. 3(A) shows the stacked emission spectra of B-PPD CDs (excitation at 520 nm) where the addition of H2O2 leads to the gradual decrease in fluorescence intensity (at 606 nm) with the increase in the concentration of H2O2 (3–15 mM). Furthermore, Fig. 3(B) illustrates that there is a sequential increase of fluorescence quenching efficiency of B-PPD CDs corresponding to the concentrations of H2O2 in the range of 3–460 μM, and upon evaluating the H2O2 concentration in the range of 3–110 μM, the quenching efficiency showed a linear response (R2 = 0.94419) with the fluorescence intensities of B-PPD CDs at 606 nm. The limit of detection (LOD) was calculated using the formula LOD = 3σ/m and found to be 0.242 μM. The LOD has been verified experimentally (not shown). Therefore, the minimum amount (0.242 μM) of H2O2 is required to trigger fluorescence quenching in the system. Thus, the result demonstrates that B-PPD CDs have high sensitivity towards H2O2 detection in PBS (pH 7.4).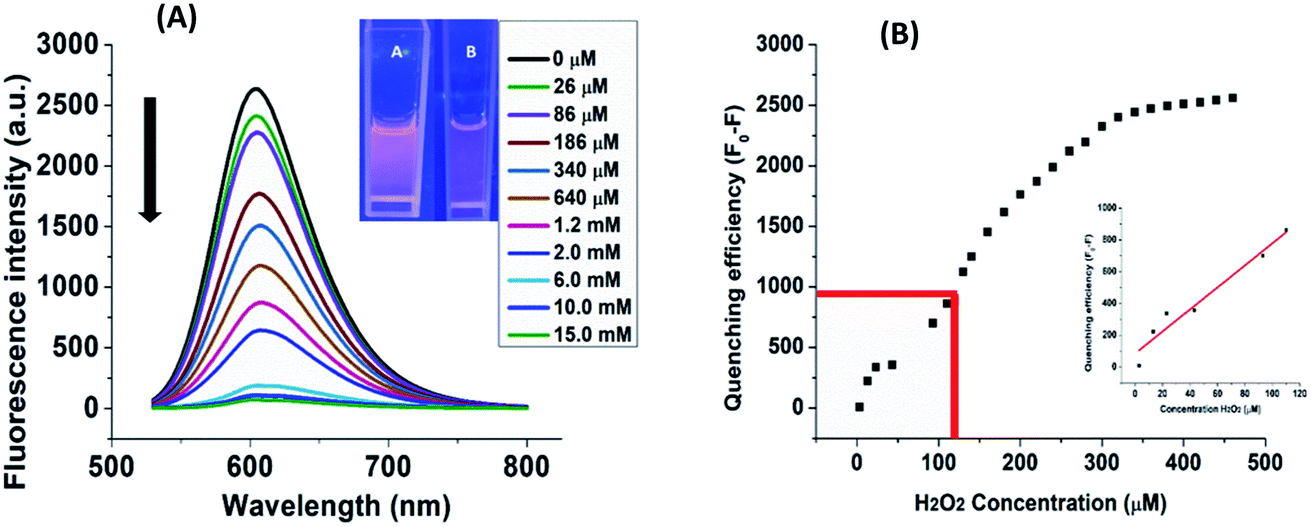 | ||
| Fig. 3 (A) Quantitative analysis of fluorescence emission spectra of B-PPD CDs (20.0 μg ml−1) for incubation with different concentrations of H2O2 at λex = 520 nm. (B) Fluorescence quenching efficiency (F0 − F) of B-PPD CDs (20.0 μg ml−1) versus various concentrations of H2O2, where F0 and F denote the fluorescence intensity without and with H2O2, respectively. Inset: the linear response of quenching efficiency of B-PPD CDs against 3–110 μM H2O2 concentration. | ||
3.3 Effect of pH
Furthermore, the applicability of B-PPD CDs was investigated by analyzing the effect of pH on the fluorescence properties of B-PPD CDs upon addition of H2O2. As evident from Fig. 4(A), the decrease in the fluorescence intensity at pH 5.0 and pH 6.0 is less after the addition of H2O2. At pH 4 (acidic) and pH 9 (basic) the change of fluorescence intensity is more pronounced. At pH 7 and pH 8 the change of fluorescence intensity is more or less the same.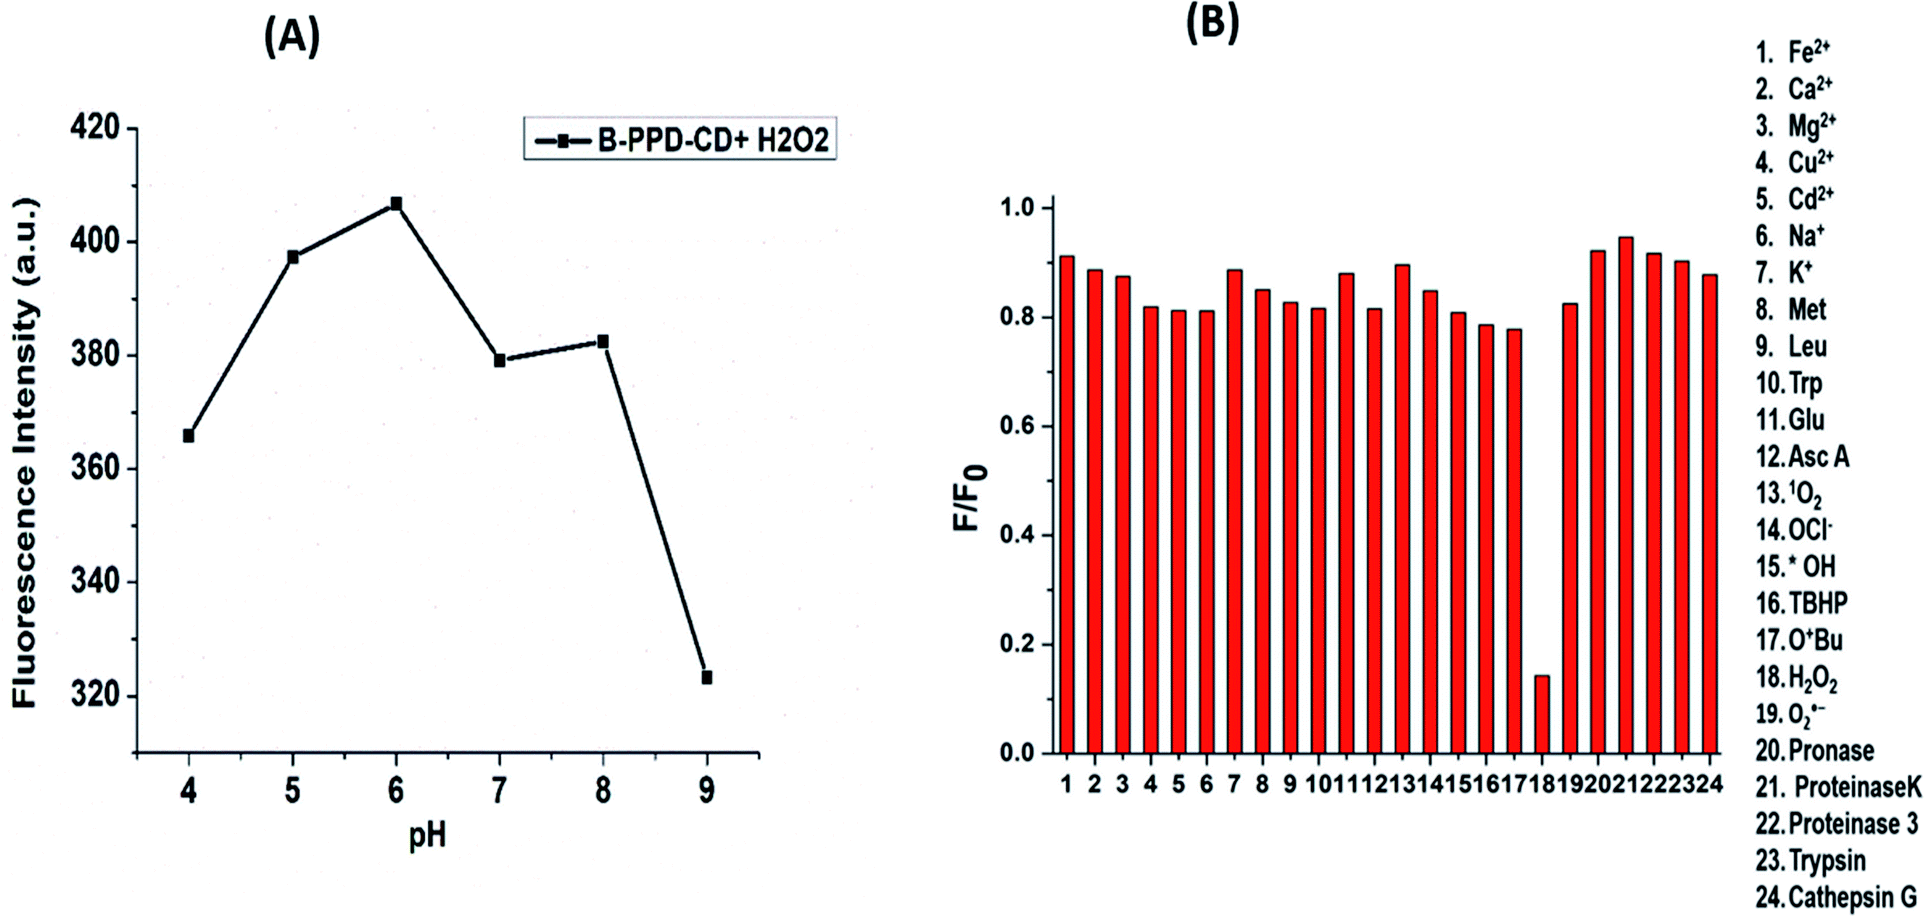 | ||
| Fig. 4 (A) Effect of pH on the fluorescence intensity of B-PPD CDs (20.0 μg ml−1) at an excitation wavelength of 520 nm in the presence of H2O2. (B) Selectivity and competitive studies of B-PPD CDs investigating the fluorescence intensity ratio (F/F0) of B-PPD CDs, where F and F0 are the fluorescence intensity of B-PPD CDs (20.0 μg ml−1) in the presence and absence of various relevant interfering species, each at 200 μM, including biomolecules (glucose and ascorbic acid), amino acids (Met, Trp, and Leu), different ions (Fe2+, Ca2+, Mg2+, Cu2+, Cd2+, Na+, and K+), various reactive oxygen species (ROS) (tert-butoxy radical (˙OtBu), hypochlorite (OCl−), tertbutyl hydroperoxide (TBHP), hydroxyl radical (˙OH), hydrogen peroxide (H2O2), singlet oxygen (1O2), and superoxide (O2˙−) at λex = 520 nm) and various proteolytic enzymes such as pronase, proteinase k, proteinase 3, trypsin and cathepsin G. | ||
This indicates that fluorescence intensity of B-PPD CDs in the presence of H2O2 is more pronounced at pH 4 and at pH 9. However, fluorescent B-PPD CDs can be used in the pH range 4 to 9 for detection of H2O2.
3.4 Selectivity and competitive studies of interfering agents
It is extremely necessary to demonstrate the selectivity of the PL response of B-PPD CDs towards other interfering agents. Subsequently, the B-PPD CDs (20.0 μg ml−1) were exposed to various relevant species ranging from biomolecules (glucose and ascorbic acid), amino acids (Met, Trp, and Leu), different ions (Fe2+, Ca2+, Mg2+, Cu2+, Cd2+, Na+, and K+), various reactive oxygen species (ROS) (tert-butoxy radical (˙OtBu), hypochlorite (OCl−), tertbutyl hydroperoxide (TBHP), hydroxyl radical (˙OH), hydrogen peroxide (H2O2), singlet oxygen (1O2), and superoxide (O2˙−)) and various proteolytic enzymes such as pronase, proteinase k, proteinase 3, trypsin and cathepsin G to evaluate their selectivity or fluorescence response towards the above-mentioned species.51–53 The change of fluorescence intensity ratio in the presence of interfering species is shown in Fig. 4(B); it has been found that the B-PPD CDs demonstrated negligible fluorescence changes upon the addition of the above-mentioned interfering agents. On the other hand, incorporation of H2O2 triggered a significant decrease in fluorescence emission of B-PPD CDs, from which it could be concluded that B-PPD CDs were successfully achieved to detect H2O2 with high selectivity without any effects of interfering agents.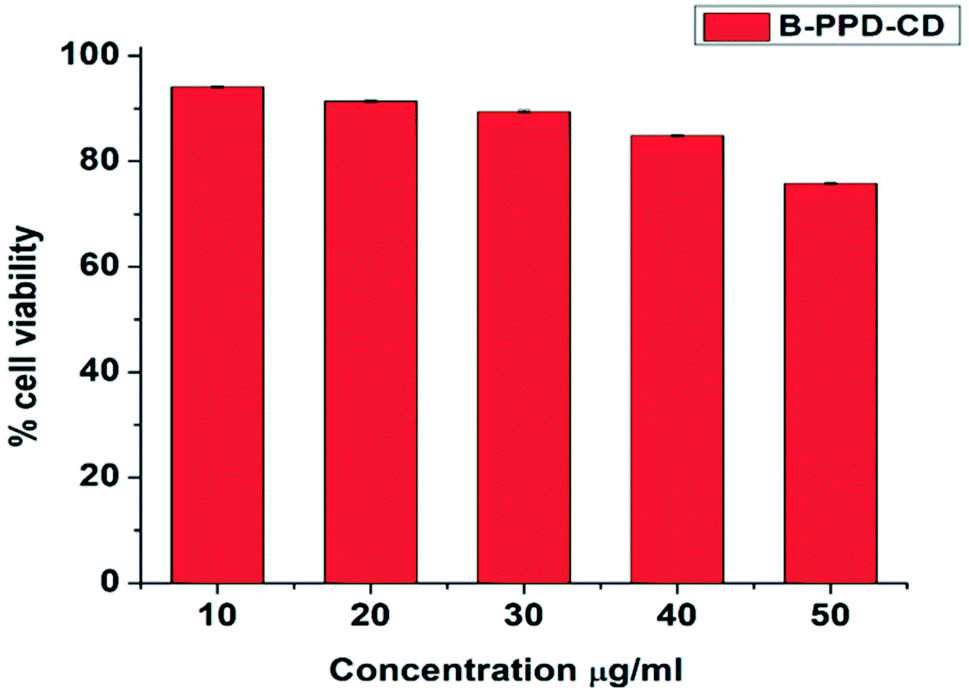 | ||
| Fig. 5 Cell viability percentage in RAW 264.7 cells after 12 h incubation of B-PPD CDs at different concentrations from 10 to 50 μg ml−1. | ||
3.5 Nuclear colocalization of B-PPD CDs with the commercially available nuclear dye
To examine the nuclear localization of B-PPD CDs, RAW 264.7 cells were co-incubated with B-PPD CDs for 30 minutes and a commercial prominent nuclear staining dye, DAPI, for fluorescence co-localization imaging. Fig. 6 shows that the co-stained RAW 264.7 cells exhibited blue fluorescence with DAPI and emitted red fluorescence with B-PPD CDs when excited at 405 nm and 514 nm, respectively. Furthermore, the merged images proved that incubation with B-PPD CDs for 30 minutes leads to strong fluorescence due to successful penetration of the nucleus and staining of the nucleus specifically, which indicated an excellent ability for targeted nucleus staining without showing any unspecific binding to the cytoplasm. The result hence suggested that by maintaining good biocompatibility and low cost, B-PPD CDs prepared by simple one-pot synthesis possessed excellent nuclear staining properties comparable to those of commercial nuclear stain DAPI.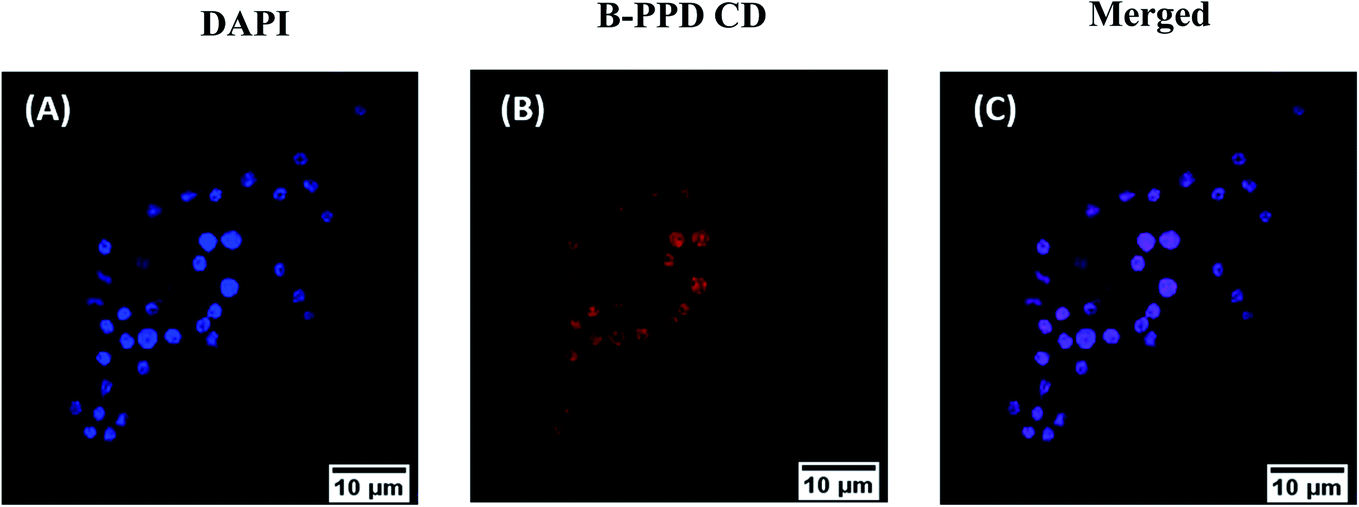 | ||
| Fig. 6 Confocal laser scanning microscopy (CLSM) images of RAW 264.7 cells co-stained with DAPI and B-PPD CDs. The RAW 264.7 cells were incubated with B-PPD CDs (20 μg ml−1) for 30 min and DAPI for 15 min at 37 °C. (A) DAPI, (B) B-PPD CDs and (C) merged image of (A) DAPI and (B) B-PPD CDs. The excitation and emission ranges for DAPI and B-PPD CDs were around 405–460 nm and 514–603 nm, respectively. Cells were observed under 63× magnification. | ||
3.6 Exogenous and endogenous detection of the nuclear H2O2 level in the RAW 264.7 cell
To confirm the sensing capacity of B-PPD CDs towards H2O2 in living cells, RAW 264.7 cells have been exposed to different concentrations (125 μM, 250 μM, and 500 μM) of exogenous H2O2 by separate incubation while maintaining 20 μg ml−1 concentration of B-PPD CDs (Fig. 7) and the result clearly showed that there is a concentration-wise gradual decrease in fluorescence intensity as compared to the control where the cells have been incubated with the B-PPD CDs alone (20 μg ml−1). Furthermore, inspired by the above results, we tried to perform endogenous generation of H2O2 by RAW 264.7 cells. | ||
| Fig. 7 Confocal fluorescence microscopy images of RAW 264.7 cells incubated with 20 μg ml−1 B-PPD CDs for 30 min. (A) Without H2O2 and (B) treated with 125 μM, (C) 250 μM and (D) 500 μM H2O2. Figure (E) presents the mean fluorescence intensity (MFI) of (A–D). Fluorescence intensities were measured using Image J software. The excitation and emission range for B-PPD CDs was around 514–603 nm. Cells were observed under 63× magnification. | ||
Since a previous report has suggested that LPS upregulated the production of H2O2,54 cells have been allowed to incubate with LPS of varying (25 ng ml−1, 50 ng ml−1 and 100 ng ml−1) concentrations and the fluorescence becomes quenched gradually with an increase in concentration in the LPS treated cells when compared with the control group (B-PPD CDs alone). The outcome of the study (Fig. 8) showed that B-PPD CDs not only crossed the cell membrane but could also invade and stain specifically the nucleus, thereby sensing the H2O2 level inside the nucleus by quenching the fluorescence of B-PPD CDs. There are some earlier reports which investigated the activity and levels of H2O2 in the nucleus that cause severe oxidative damage to DNA.8–11 Therefore, the result suggests that superior biocompatibility, targeted nucleus staining, and specific response to H2O2 makes B-PPD CDs a robust system for the detection of H2O2 in living cells.
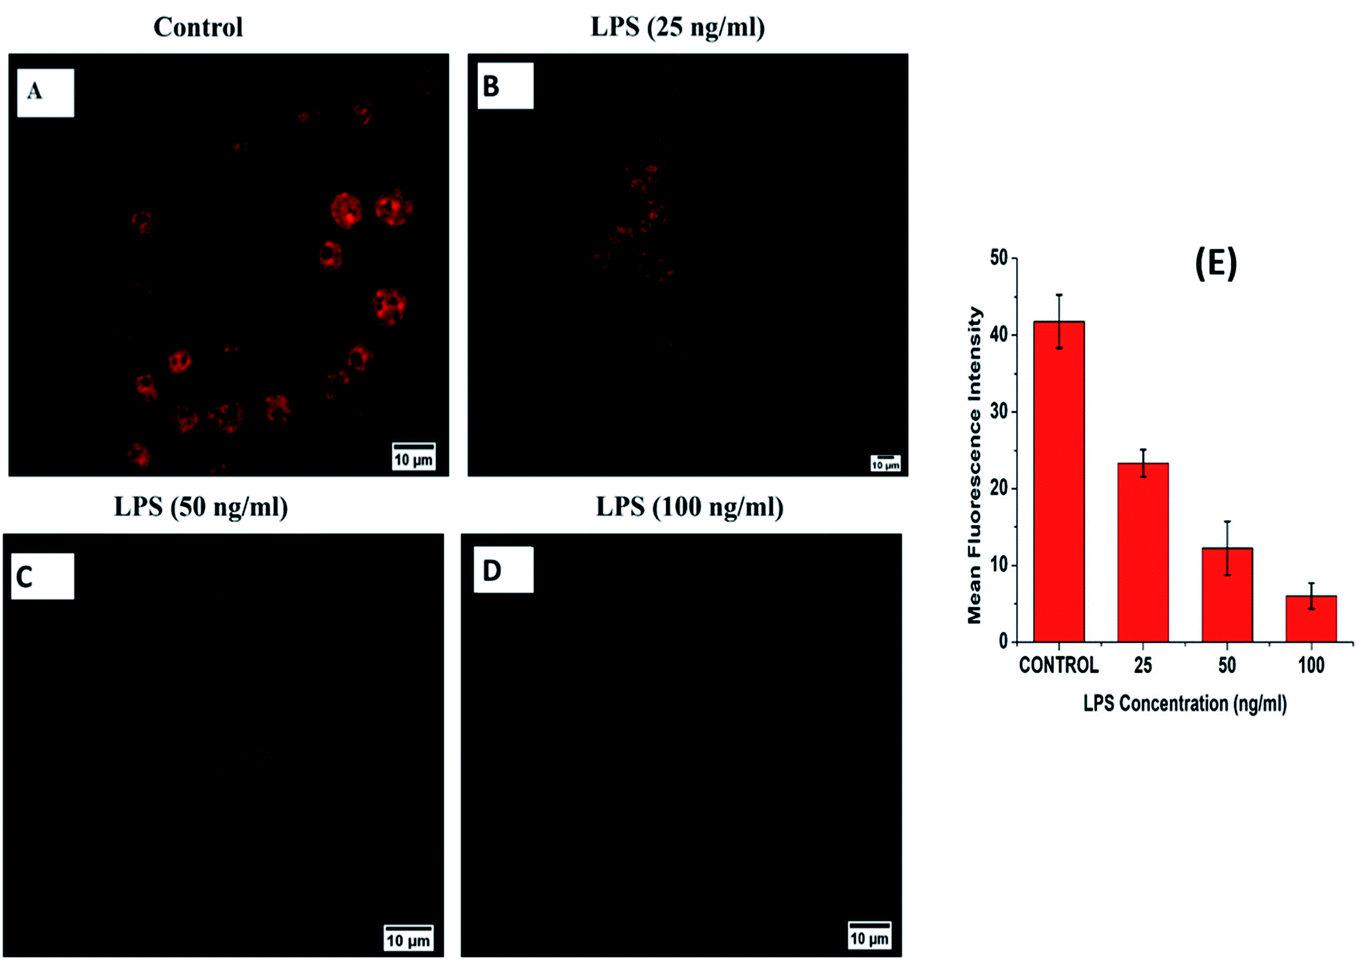 | ||
| Fig. 8 Confocal fluorescence microscopy images of RAW 264.7 cells incubated with 20 μg ml−1 B-PPD CDs for 30 min. (A) Without H2O2 and (B) treated with 25 ng ml−1, (C) 50 ng ml−1 and (D) 100 ng ml−1 LPS. Figure (E) shows the mean fluorescence intensity (MFI) of (A–D). Fluorescence intensities were measured using Image J software. The excitation and emission range for B-PPD CDs was around 514–603 nm. Cells were observed under 63× magnification. | ||
3.7 Mechanistic insight
In general, there is a lot of debate about the exact origin of PL in CDs. One PL model has been proposed for CDs based on the bandgap transitions in conjugated π-domains. Another model proposes that it could be related to surface defects on the CDs.55 The PL observed in PPD is believed to be due to surface states. The PL is due to the presence of different emissive traps due to various functionalities, excitons of carbon, etc. as well as due to electron–hole recombination pathways. Boron is known as a notable electron-deficient compound and it takes part in charge transfer especially in an excited state. When doped with the boron compound (4-formylbenzeneboronic acid), the higher energy electron of CDs can move to the electron-deficient part of the B thus enhancing the PL intensity. The observed increase in PL intensity can also be attributed to passivation with oxygenated functional groups, e.g., –CO and OH.56,57 B-PPD CDs have a positive zeta potential value, indicating the electron-deficient nature of the B-PPD CDs. An earlier report has suggested that the active oxygen species (AOS) commonly known as the reactive oxygen species, generated from H2O2 when it comes into contact with the quantum dots (QDs), readily captures electrons at the conduction bands of QDs, which results in inhibition of radiative recombination of the photoinduced electrons and holes and causes a decrease in fluorescence intensity.58
However, the quenching effect of different active oxygen species on B-PPD CDs is negligible in comparison with H2O2 as shown in Fig. 4(B). The selectivity to H2O2 can be explained by putting forward the charge transfer mechanism. It has been assumed that in the presence of H2O2 (analyte), there is a charge transfer from H2O2 to the electron-deficient boron atom of B-PPD CDs to form stable B–O coordination bonds leading to quenching of PL intensity.59 This implies that the doped boron played an important role in the charge transfer mechanism by functioning as a good electron acceptor.
What makes B-PPD CDs an effective nucleus-targeted staining reagent? Some well-known commercially available nuclear staining dyes such as DAPI, Hoechst 33258, and other DAPI analogs share a similar structure (that contains a phenyl ring) with B-PPD CDs. The structural resemblance of B-PPD CDs due to the phenyl ring and small size of the particles (∼1.73 nm) may assist them to enter into the nucleus through the nuclear pores which are about 10 nm in size as demonstrated by confocal microscopy. It has been reported that these nuclear staining dyes exhibited a strong affinity for binding into the minor groove side of the B-DNA molecule specifically in the A–T base region.60 This is due to the narrower A–T regions compared with G–C resulting in close-fitting of the flat aromatic ring within the groove; the positive charge of DAPI (+2)61 causes an electrostatic interaction with more electronegative potential in the minor groove of A–T regions allowing the dye to settle deeper into the groove.62 Although the actual mechanism of the nucleus-targeting ability of B-PPD CDs needs to be further investigated, it can be assumed that the positive zeta potential (ζ = +3.43 mV) of B-PPD CDs imparts a high affinity towards the electronegative region of DNA by electrostatic interactions.63 It may be presumed that the binding of B-PPD CDs with DNA causes the formation of hydrogen bonds between the amine group of B-PPD CDs and the oxygen atoms of thymine, while bifurcated hydrogen bond formation is found between the indole nitrogen of DAPI, netropsin, Hoechst 33258, and thymine oxygen atoms of the two central base pairs.64 Thus B-PPD CDs can be used as a nucleus-targeted staining reagent and as a good sensor for monitoring the level of H2O2 inside living cells (Scheme 2).
 | ||
| Scheme 2 (A) Fluorescence enhancement and quenching of B-PPD CDs. (B) Penetration of B-PPD CDs (Red) inside the nucleus (Blue). | ||
4 Conclusion
In summary, we have synthesized successfully boron-doped p-phenylenediamine based carbon quantum dots (B-PPD CDs) as a fluorescent probe in a single-step process. The B-PPD CDs exhibited good biocompatibility and high selectivity against H2O2. In vitro studies demonstrated that B-PPD CDs can detect the presence of H2O2. The limit of detection (LOD) was calculated to be 0.242 μM. The feasibility of B-PPD CDs as a fluorescent probe in in vivo studies on the detection of H2O2 in cells was also demonstrated successfully. Confocal laser scanning microscopy (CLSM) imaging of B-PPD CDs in the RAW 264.7 cell line showed their targeted nucleus staining and efficient detection of the H2O2 level in the nucleus by quenching the fluorescence signal. In addition, they can detect LPS upregulated production of H2O2 in cells showing the versatility of the method. Hence, the current study could impart an additional clue for further investigation of DNA damage by oxidative stress.Abbreviations
| ROS | Reactive oxygen species |
| B-PPD CDs | B-doped p-phenylenediamine based carbon quantum dots |
| CLSM | Confocal laser scanning microscope |
| LPS | Lipopolysaccharide |
Funding sources
Funding from an in-house project from IASST, Guwahati is acknowledged.Author contributions
KP: conceptualization, formal analysis, investigation, methodology, and writing – original draft, review and editing.RRS: formal analysis, investigation, and methodology.
SD: investigation and methodology.
RD: supervision and writing – original draft, review and editing.
DC: conceptualization, formal analysis, supervision, and writing – original draft, review and editing.
Conflicts of interest
The authors declare no competing financial interest.Acknowledgements
K. P. wants to thank the Council of Scientific and Industrial Research (CSIR), New Delhi for the fellowship. The authors thank IASST for the in-house project and SAIF, IASST for providing the instrumentation facility.References
- Z. Zhou, X. Yuan, D. Long, M. Liu, K. Li and Y. Xie, A pyridine-Si-rhodamine-based near-infrared fluorescent probe for visualizing reactive oxygen species in living cells, Spectrochim. Acta, Part A, 2021, 246, 1–5 CrossRef.
- C. Wang, Y. Wang., G. Wang., C. Huang and N. Jia, A new mitochondria-targeting fluorescent probe for ratiometric detection of H2O2 in live cells, Anal. Chim. Acta, 2020, 1097, 230–237 CrossRef CAS PubMed.
- V. Muhr, M. Buchner, T. Hirsch, D. J. Jovanović, S. D. Dolić, M. D. Dramićanin and O. S. Wolfbeis, Europium-doped GdVO4 nanocrystals as a luminescent probe for hydrogen peroxide and for enzymatic sensing of glucose, Sens. Actuators, B, 2017, 241, 349–356 CrossRef CAS.
- E. A. Veal, A. M. Day and B. A. Morgan, Hydrogen peroxide sensing and signaling, Mol. Cell, 2007, 26, 1–14 CrossRef CAS PubMed.
- S. G. Rhee, H2O2, a necessary evil for cell signaling, Science, 2006, 312, 1882–1883 CrossRef.
- Y. Xiao, X. Li, Y. Cui, J. Zhang, L. Liu, X. Xie, H. Hao, G. He, M. C. Kander, M. Chen, Z. Liu, C. M. Verfaillie, H. Zhu, M. Lei and Z. Liu, Hydrogen peroxide inhibits proliferation and endothelial differentiation of bone marrow stem cells partially via reactive oxygen species generation, Life Sci., 2014, 112, 33–40 CrossRef CAS.
- H. W. Choi, Y. J. Kim, S. C. Lee, J. K. Hong and B. K. Hwang, Hydrogen peroxide generation by the pepper extracellular peroxidase CaPO2 activates local and systemic cell death and defense response to bacterial pathogens, Plant Physiol., 2007, 145, 890–904 CrossRef CAS.
- T. Finkel and N. J. Holbrook, Oxidants, oxidative stress and the biology of ageing, Nature, 2000, 408, 239–247 CrossRef.
- M. T. Lin and M. F. Beal, Mitochondrial dysfunction and oxidative stress in neurodegenerative diseases, Nature, 2006, 443, 787–795 CrossRef CAS PubMed.
- D. Galaris, V. Skiada and A. Barbouti, Redox signaling and cancer: the role of "labile" iron, Cancer Lett., 2008, 266, 21–29 CrossRef CAS PubMed.
- W. R. Markesbery and M. A. Lovell, DNA oxidation in Alzheimer's disease, Antioxid. Redox Signaling, 2006, 8, 2039–2045 CrossRef CAS.
- F. Johnson and C. Giulivi, Superoxide dismutases and their impact upon human health, Mol. Aspects Med., 2005, 26, 340–352 CrossRef CAS PubMed.
- T. M. Paravicini and R. M. Touyz, NADPH oxidases, reactive oxygen species, and hypertension: clinical implications and therapeutic possibilities, Diabetes Care, 2008, 31, S170–S180 CrossRef CAS PubMed.
- Y. Sato, K. Ogino, N. Sakano, D. H. Wang, J. Yoshida, Y. Akazawa, S. Kanbara, K. Inoue, M. Kubo and H. Takahashi, Evaluation of urinary hydrogen peroxide as an oxidative stress biomarker in a healthy Japanese population, Free Radical Res., 2013, 47, 181–191 CrossRef CAS.
- B. Halliwell, M. V. Clement and L. H. Long, Hydrogen peroxide in the human body, FEBS Lett., 2000, 486, 10–13 CrossRef CAS.
- M. Tarvin, B. McCord, K. Mount, K. Sherlach and M. L. Miller, Optimization of two methods for the analysis of hydrogen peroxide: high performance liquid chromatography with fluorescence detection and high performance liquid chromatography with electrochemical detection in direct current mode, J. Chromatogr., 2010, 1217, 7564–7572 CrossRef CAS.
- A. S. Ivanova, A. D. Merkuleva, S. V. Andreev and K. A. Sakharov, Method for determination of hydrogen peroxide in adulterated milk using high performance liquid chromatography, Food Chem., 2019, 283, 431–436 CrossRef CAS.
- C. Benitez-Martin, J. A. Guadix, J. R. Pearson, F. Najera, J. M. Perez-Pomares and E. Perez-Inestrosa, A turn-on two-photon fluorescent probe for detecting lysosomal hydroxyl radicals in living cells, Sens. Actuators, B, 2019, 284, 744–750 CrossRef CAS.
- H. Han, X. He, M. Wu, Y. Huang, L. Zhao, L. Xu, P. Ma, Y. Sun, D. Song and X. Wang, A novel colorimetric and near-infrared fluorescent probe for detecting and imaging exogenous and endogenous hydrogen peroxide in living cells, Talanta, 2020, 217, 121000 CrossRef CAS PubMed.
- M. Baccarin, B. C. Janegitz, R. Berte, F. C. Vicentini, C. E. Banks, O. Fatibello-Filho and V. Zucolotto, Direct electrochemistry of hemoglobin and biosensing for hydrogen peroxide using a film containing silver nanoparticles and poly(amidoamine) dendrimer, Mater. Sci. Eng., C, 2016, 58, 97–102 CrossRef CAS.
- Y. Zhou, G. Yu, F. Chang, B. Hu and C. J. Zhong, Gold-platinum alloy nanowires as highly sensitive materials for electrochemical detection of hydrogen peroxide, Anal. Chim. Acta, 2012, 757, 56–62 CrossRef CAS.
- X. Chen, C. Fu, Y. Wang, W. Yang and D. G. Evans, Direct electrochemistry and electrocatalysis based on a film of horseradish peroxidase intercalated into Ni-Al layered double hydroxide nanosheets, Biosens. Bioelectron., 2008, 24, 356–361 CrossRef CAS.
- Z. Fan, Q. Lin, P. Gong, B. Liu, J. Wang and S. Yang, A new enzymatic immobilization carrier based on graphene capsule for hydrogen peroxide biosensors, Electrochim. Acta, 2015, 151, 186–194 CrossRef CAS.
- J. Chang, H. Li, T. Hou, W. Duan and F. Li, Paper-based fluorescent sensor via aggregation induced emission fluorogen for facile and sensitive visual detection of hydrogen peroxide and glucose, Biosens. Bioelectron., 2018, 104, 152–157 CrossRef CAS PubMed.
- X. Chen, G. Wu, Z. Cai, M. Oyama and X. Chen, Advances in enzyme-free electrochemical sensors for hydrogen peroxide, glucose, and uric acid, Microchim. Acta, 2013, 181, 689–705 CrossRef.
- Z. Li, Imaging of hydrogen peroxide (H2O2) during the ferroptosis process in living cancer cells with a practical fluorescent probe, Talanta, 2020, 212, 120804 CrossRef CAS.
- C. Gao, M. K. Hossain, L. Li, M. A. Wahab, J. Xiong and W. Li, A colorimetric and fluorescence turn-on probe for the highly selective detection of hydrogen peroxide in aqueous solution, J. Photochem. Photobiol., A, 2019, 368, 97–103 CrossRef CAS.
- Z. Zhou, L. Yang, L. Huang, Y. Liao, Y. Liu and Q. Xiao, A novel fluorescent probe for H2O2 detection based on CdSe@ZnS quantum dots/Ag nanocluster hybrid, Anal. Chim. Acta, 2020, 1106, 176–182 CrossRef CAS.
- X. Liu, H. Tian, L. Yang, Y. Su, M. Guo and X. Song, A sensitive and selective fluorescent probe for the detection of hydrogen peroxide with a red emission and a large Stokes shift, Sens. Actuators, B, 2018, 255, 1160–1165 CrossRef CAS.
- H. Kobayashi, M. Ogawa, R. Alford, P. L. Choyke and Y. Urano, New strategies for fluorescent probe design in medical diagnostic imaging, Chem. Rev., 2010, 110, 2620–2640 CrossRef CAS.
- A. Shao, Y. Xie, S. Zhu, Z. Guo, S. Zhu, J. Guo, P. Shi, T. D. James, H. Tian and W. H. Zhu, Far-Red and Near-IR AIE-Active Fluorescent Organic Nanoprobes with Enhanced Tumor-Targeting Efficacy: Shape-Specific Effects, Angew. Chem., Int. Ed., 2015, 54, 7275–7280 CrossRef CAS.
- D. Kim, H. Moon, S. H. Baik, S. Singha, Y. W. Jun, T. Wang, K. H. Kim, B. S. Park, J. Jung, I. Mook-Jung and K. H. Ahn, Two-Photon Absorbing Dyes with Minimal Autofluorescence in Tissue Imaging: Application to in Vivo Imaging of Amyloid-β Plaques with a Negligible Background Signal, J. Am. Chem. Soc., 2015, 137, 6781–6789 CrossRef CAS.
- Y.-Y. Ren, N.-W. Wu, J. Huang, Z. Xu, D.-D. Sun, C.-H. Wang and L. Xu, A neutral branched platinum–acetylide complex possessing a tetraphenylethylene core: preparation of a luminescent organometallic gelator and its unexpected spectroscopic behaviour during sol-to-gel transition, Chem. Commun., 2015, 51, 15153–15156 RSC.
- K. Jiang, S. Sun, L. Zhang, Y. Lu, A. Wu, C. Cai and H. Lin, Red, Green, and Blue Luminescence by Carbon Dots: Full-Color Emission Tuning and Multicolor Cellular Imaging, Angew. Chem., Int. Ed., 2015, 54, 5360–5363 CrossRef CAS.
- S. Lu, L. Sui, J. Liu, S. Zhu, A. Chen, M. Jin and B. Yang, NearInfrared Photoluminescent Polymer−Carbon Nanodots with TwoPhoton Fluorescence, Adv. Mater., 2017, 29, 1603443 CrossRef.
- F. Yuan, Z. Wang, X. Li, Y. Li, Z. Tan, L. Fan and S. Yang, Bright Multicolor Bandgap Fluorescent Carbon Quantum Dots for Electroluminescent Light-Emitting Diodes, Adv. Mater., 2017, 29, 1604436 CrossRef.
- Y. C. Chen, C. Y. Nien, K. Albert, C. C. Wen, Y. Z. Hsieh and H. Y. Hsu, Pseudo-Multicolor Carbon Dots Emission and the Dilution-Induced Reversible Fluorescence Shift, RSC Adv., 2016, 6, 44024–44028 RSC.
- F. Gao, S. Ma, J. Li, K. Dai, X. Xiao, D. Zhao and W. Gong, Rational Design of High Quality Citric Acid-Derived Carbon Dots by Selecting Efficient Chemical Structure Motifs, Carbon, 2017, 112, 131–141 CrossRef CAS.
- K. Hola, Y. Zhang, Y. Wang, E. P. Giannelis, R. Zboril and A. L. Rogach, Carbon dots-Emerging light emitters for bioimaging, cancer therapy and optoelectronics, Nano Today, 2014, 9, 590–603 CrossRef CAS.
- X. T. Zheng, A. Ananthanarayanan, K. Q. Luo and P. Chen, Glowing graphene quantum dots and carbon dots: properties, syntheses, and biological applications, Small, 2015, 11, 1620–1636 CrossRef CAS.
- J. L. Wang and J. J. Qiu, A review of carbon dots in biological applications, J. Mater. Sci., 2016, 51, 4728–4738 CrossRef CAS.
- S. K. Bhunia, A. Saha, A. R. Maity, S. C. Ray and N. R. Jana, Carbon nanoparticle-based fluorescent bioimaging probes, Sci. Rep., 2013, 3, 1473 CrossRef.
- A. Craciun, A. Diac, M. Focsan, C. Socaci, K. Magyari, D. Maniu, I. Mihalache, L. Veca, S. Astilean and A. Terec, Surface passivation of carbon nanoparticles with p-phenylenediamine towards photoluminescent carbon dots, RSC Adv., 2016, 6, 56944–56951 RSC.
- D. Chen, W. Wu, Y. Yuan, Y. Zhou, Z. Wan and P. Huang, Intense multi-state visible absorption and full-color luminescence of nitrogen-doped carbon quantum dots for blue-light-excitable solid-state-lighting, J. Mater. Chem. C, 2016, 4, 9027–9035 RSC.
- H. Wang, C. Sun, X. Chen, Y. Zhang, V. L. Colvin, Q. Rice, J. Seo, S. Feng, S. Wang and W. Y. William, Excitation wavelength-independent visible color emission of carbon dots, Nanoscale, 2017, 9, 1909–1915 RSC.
- A. Zheng, Z. Cong, J. Wang, J. Li, H. Yang and G. Chen, Highly-efficient peroxidase-like catalytic activity of graphene dots for biosensing, Biosens. Bioelectron., 2013, 49, 519–524 CrossRef CAS PubMed.
- Y. H. Li, L. Zhang, J. Huang, R. P. Liang and J. D. Qiu, Fluorescent graphenequantum dots with a boronic acid appended bipyridinium salt to sense monosaccharides in aqueous solution, Chem. Commun., 2013, 49, 5180–5182 RSC.
- Z. B. Qu, X. G. Zhou, L. Gu, R. M. Lan, D. D. Sun, D. J. Yu and G. Y. Shi, Boronic acid functionalized graphene quantum dots as a fluorescent probe for selective and sensitive glucose determination in microdialysate, Chem. Commun., 2013, 49, 9830–9832 RSC.
- D. Gorlich and U. Kutay, Transport between the cell nucleus and the cytoplasm, Annu. Rev. Cell Dev. Biol., 1999, 15, 607–660 CrossRef CAS PubMed.
- B. C. Dickinson, Y. Tang, Z. Chang and C. J. Chang, A nuclear-localized fluorescent hydrogen peroxide probe for monitoring sirtuin-mediated oxidative stress responses in vivo, Chem. Biol., 2011, 18, 943–948 CrossRef CAS.
- Z. Wang, X. Teng and C. Lu, Orderly arranged fluorescence dyes as a highly efficient chemiluminescence resonance energy transfer probe for peroxynitrite, Anal. Chem., 2015, 87, 3412–3418 CrossRef CAS.
- X. Teng, F. Li, C. Lu and B. Li, Carbon dot-assisted luminescence of singlet oxygen: the generation dynamics but not the cumulative amount of singlet oxygen is responsible for the photodynamic therapy efficacy, Nanoscale Horiz., 2020, 5, 978–985 RSC.
- W. Zhou, Y. Cao, D. Sui and C. Lu, Turn-On Luminescent Probes for the Real-Time Monitoring of Endogenous Hydroxyl Radicals in Living Cells, Angew. Chem., Int. Ed. Engl., 2016, 55, 4236–4241 CrossRef CAS PubMed.
- R. Kumar, J. Han, H. Lim, W. Ren, J. Lim, J. Kim and J. Kim, Mitochondrial Induced and Self-Monitored Intrinsic Apoptosis by Antitumor Theranostic Prodrug: In Vivo Imaging and Precise Cancer Treatment, J. Am. Chem. Soc., 2014, 136, 17836–17843 CrossRef CAS PubMed.
- H. Ding, S. B. Yu, J. S. Wei and H. M. Xiong, Full-Color Light-Emitting Carbon Dots with a Surface-State-Controlled Luminescence Mechanism, ACS Nano, 2016, 10, 484–491 CrossRef CAS.
- A. Deb, R. Saikia and D. Chowdhury, Nano-Bioconjugate Film from Aloe vera To Detect Hazardous Chemicals Used in Cosmetics, ACS Omega, 2019, 4, 20394–20401 CrossRef CAS.
- M. J. Deka, A. Dutta and D. Chowdhury, Tuning the wettability and photoluminescence of graphene quantum dots via covalent modification, New J. Chem., 2018, 42, 355–362 RSC.
- Y. Yi, J. Deng, Y. Zhang, H. Li and S. Yao, Label-free Si quantum dots as photoluminescence probes for glucose detection, Chem. Commun., 2013, 49, 612–614 RSC.
- S. Majumdar, T. Bhattacharjee, D. Thakur and D. Chowdhury, Carbon Dot based Fluorescence sensor for Retinoic acid, ChemistrySelect, 2018, 3, 673–677 CrossRef CAS.
- G. Manzini, M. L. Barcellona, M. Avitabile and F. Quadrifoglio, Interaction of diamidino-2-phenylindole (DAP) with natural and synthetic nucleic acids, Nucleic Acids Res., 1983, 11, 8861–8876 CrossRef CAS PubMed.
- A. Biancardi, T. Biver, F. Secco and B. Mennucci, An investigation of the photophysical properties of minor groove bound and intercalated DAPI through quantum-mechanical and spectroscopic tools, Phys. Chem. Chem. Phys., 2013, 15, 4596–4603 RSC.
- T. A. Larsen, D. S. Goodsell, D. Cascio, K. Grzeskowiak and R. E. Dickerson, The structure of DAPI bound to DNA, J. Biomol. Struct. Dyn., 1989, 7, 477–491 CrossRef CAS PubMed.
- W. Hao, L. F. Pang, N. Wei, X. F. Guo and H. Wang, Nucleus-targeted N-doped carbon dots via DNA-binding for imaging of hypochlorous in cells and zebrafish, Sens. Actuators, B, 2021, 333, 129626 CrossRef.
- J. Kapuscinski, DAPI: a DNA-specific fluorescent probe, Biotech. Histochem., 1995, 70, 220–233 CrossRef CAS.
| This journal is © The Royal Society of Chemistry 2022 |