
Engineering of flat bands and Dirac bands in two-dimensional covalent organic frameworks (COFs): relationships among molecular orbital symmetry, lattice symmetry, and electronic-structure characteristics†
Xiaojuan
Ni
 a,
Hong
Li
a,
Feng
Liu
b and
Jean-Luc
Brédas
*a
a,
Hong
Li
a,
Feng
Liu
b and
Jean-Luc
Brédas
*a
aDepartment of Chemistry and Biochemistry, The University of Arizona, Tucson, Arizona 85721-0088, USA. E-mail: jlbredas@arizona.edu
bDepartment of Materials Science and Engineering, University of Utah, Salt Lake City, Utah 84112, USA
First published on 29th November 2021
Abstract
Two-dimensional covalent organic frameworks (2D-COFs), also referred to as 2D polymer networks, display unusual electronic-structure characteristics, which can significantly enrich and broaden the fields of electronics and spintronics. In this Focus article, our objective is to lay the groundwork for the conceptual description of the fundamental relationships among the COF electronic structures, the symmetries of their 2D lattices, and the frontier molecular orbitals (MOs) of their core and linker components. We focus on monolayers of hexagonal COFs and use tight-binding model analyses to highlight the critical role of the frontier-MO symmetry, in addition to lattice symmetry, in determining the nature of the electronic bands near the Fermi level. We rationalize the intriguing feature that, when the core unit has degenerate highest occupied MOs [or lowest unoccupied MOs], the COF highest valence band [or lowest conduction band] is flat but degenerate with a dispersive band at a high-symmetry point of the Brillouin zone; the consequences of having such band characteristics are briefly described. Multi-layer and bulk 2D COFs are found to maintain the salient features of the monolayer electronic structures albeit with a reduced bandgap due to the interlayer coupling. This Focus article is thus meant to provide an effective framework for the engineering of flat and Dirac bands in 2D polymer networks.
 Xiaojuan Ni | Xiaojuan Ni graduated with BEng (2010) and MEng (2013) degrees in Chemical Engineering and Materials Science from Dalian University of Technology, China. She received her PhD degree (2020) in Materials Science and Engineering from the University of Utah. She is currently working as a postdoctoral research associate at the University of Arizona. Her research interests focus on the electronic, magnetic, and topological properties of metal- and covalent organic frameworks, and other low-dimensional materials. |
 Hong Li | Hong Li is currently an Associate Research Professor in the Bredas group at the University of Arizona. She received her PhD (1996) degree from Nankai University in China. She is an expert in first-principles modeling of the geometric and electronic structures of complex nanostructured materials and interfaces, especially the metal and defect-containing metal oxide surfaces and their interfaces with organic molecular layers as well as the chemical reactivity and charge-transfer processes at such interfaces. |
 Feng Liu | Feng Liu is an Ivan B. Cutler Professor of Materials Science and Engineering and an adjunct professor of Physics at the University of Utah, a Fellow of the American Physical Society. He received his PhD in Chemical Physics from Virginia Commonwealth University in 1990. His research interests lie in theoretical modeling and computational simulation, from the atomic to continuum scale, of properties of surface/interface and thin-film materials, with a recent focus on 2D topological and flat-band materials. |
 Jean-Luc Brédas | Jean-Luc Brédas received his BSc (1976) and PhD (1979) degrees from the University of Namur, Belgium. In 1988, he was appointed Professor at the University of Mons, Belgium, where he established the Laboratory for Chemistry of Novel Materials. While keeping an “Extraordinary Professorship” appointment in Mons, he joined the University of Arizona in 1999. In 2003, he moved to the Georgia Institute of Technology where he held the Vasser-Woolley and Georgia Research Alliance Chair in Molecular Design. Between 2014 and 2016, he joined King Abdullah University of Science and Technology (KAUST). He returned to Georgia Tech in 2017 before moving back to Arizona in 2020. |
I. Introduction
The field of covalent organic frameworks (COFs) has progressed rapidly over the past fifteen years, since its original development by Yaghi and co-workers.1–4 COFs do indeed offer a powerful molecular platform to integrate a variety of organic units into periodic hexagonal or tetragonal structures with high porosity and large internal surface area.2,5–10 Representative examples of hexagonal two-dimensional (2D) COF structures, also referred to as 2D polymer networks, are illustrated in Fig. 1. Our attention in this Focus article is on such hexagonal lattices as their electronic structures near the Fermi level have the peculiarity of combining flat bands, which result in an infinite effective mass for charge carriers, and Dirac-type bands, where the carriers have a vanishing effective mass. As detailed elsewhere,11,12 tetragonal lattices of π-conjugated COFs are also of interest in the quest for significant charge-carrier mobilities, as their top valence and/or bottom conduction bands can be highly dispersive.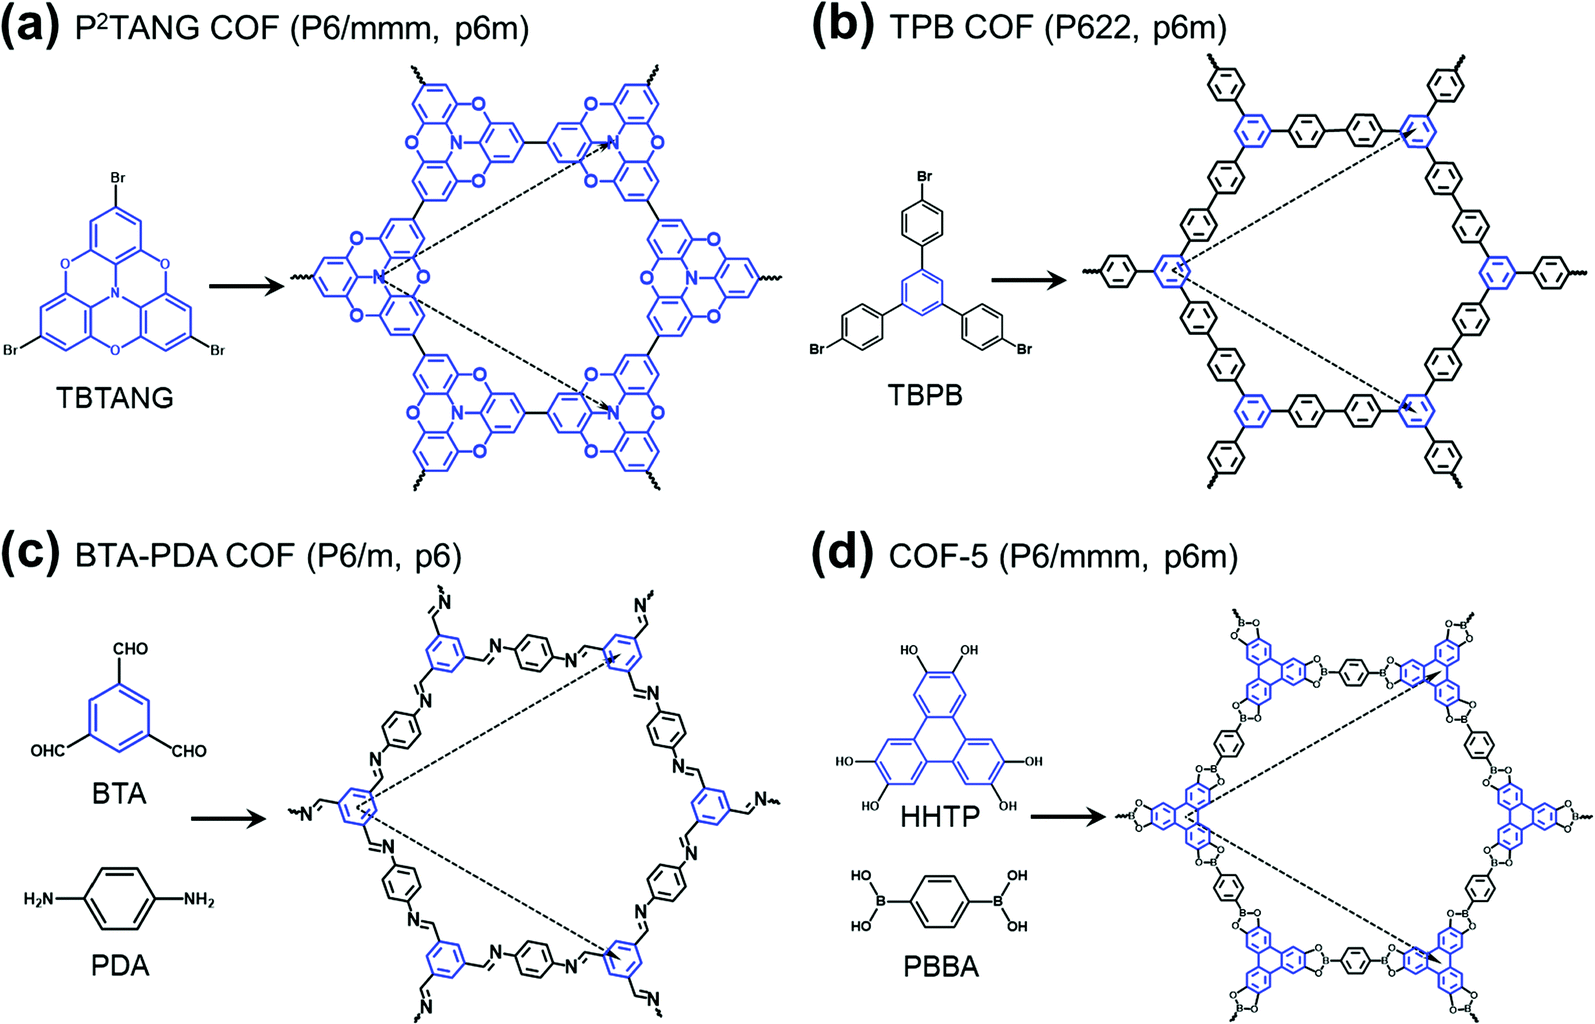 | ||
| Fig. 1 Schematic illustrations of the molecular building units and structures of representative hexagonal COFs: (a) tribromotrioxaazatriangulene (TBTANG) forming the P2TANG COF,18 (b) 1,3,5-tris(4-bromophenyl)benzene (TBPB) forming the TPB COF,23–25 (c) benzene-1,3,5-tricarbaldehyde (BTA) and p-phenylenediamine (PDA) forming the BTA-PDA COF,26–29 and (d) 2,3,6,7,10,11-hexahydroxytriphenylene (HHTP) and 1,4-phenylene-bis(boronic acid) (PBBA) forming COF-5.2,9,30 The three-arm cores are highlighted in blue while the lattice vectors are indicated by dashed arrows. The space group and plane group of each COF are given in parentheses. | ||
Except in the case of self-condensation (as, for instance, the P2TANG COF and the TPB COF in Fig. 1a and b), two different monomers constitute the building blocks of 2D polymer networks, with one functioning as a core and the other as a linker. The cores locate at the branching sites and connect via covalent bonds with the linkers to form the frameworks6,11,13–16 (we note that, in the TPB COF, the framework could also be viewed as formed from benzene cores and biphenyl linkers). Recent advances in the synthesis of π-conjugated 2D COFs8–10,17,18 have stimulated an ever-increasing interest in their potential applications in electronics and spintronics. Remarkably, in a recent study, angle-resolved photoelectron spectroscopy measurements revealed a Dirac cone feature in a heterotriangulene COF.18
As mentioned already, Dirac and flat bands are known to arise in COFs with specific lattice symmetries.11,19–21 In addition to lattice symmetry, the frontier molecular orbital (MO) symmetries of the individual core and linker components are also expected to be a key factor determining the nature of the electronic bands near the Fermi level.22 Benefiting from the diversity of cores and linkers available for COF formation, MO symmetry adds another degree of freedom to engineer the characteristics of the COF bands. However, the relationships among MO symmetry, lattice symmetry, and the nature of the COF electronic bands have not been discussed in-depth. It is the objective of this Focus article to describe these relationships in an illustrative manner.
To provide conceptual insight, we exploit tight-binding (TB) model analyses in tandem with density functional theory (DFT) calculations and consider four representative hexagonal COFs (Fig. 1). We highlight that MO symmetry does indeed play a critical role, in addition to lattice symmetry, in determining the nature of the electronic bands in monolayers of hexagonal COFs. We rationalize the interesting feature that, when the core unit has degenerate highest occupied MOs (HOMO) [or lowest unoccupied MOs (LUMO)], the highest valence band (VB) [or lowest conduction band (CB)] is flat but degenerate with a dispersive band at a high-symmetry point of the Brillouin zone. Such band characteristics are conducive to the appearance of fascinating quantum phenomena that will be briefly described. Multi-layer and bulk 2D COFs are found to maintain the salient features of the monolayer electronic structures albeit with a reduced bandgap due to interlayer coupling. We hope that, by describing the fundamental correlation among the COF electronic bands and the symmetries of the lattices and MOs of the core and linker components, this Focus article will provide an effective framework for the precise engineering of flat and Dirac bands in 2D COFs.
II. Setting the stage: the tight-binding models
Density functional theory has become the methodology of choice to derive the electronic structure of molecular and periodic systems. The key component of our approach in this Focus article is our ability to cast the DFT-calculated electronic structures in the light of tight-binding model analyses, which allows us: (i) to uncover the factors leading to specific band-structure characteristics; and (ii) based on that conceptual understanding, to engineer the nature of the bands appearing near the Fermi level. Thus, we provide below a simple account of the relevant TB models. The specifics of the DFT calculations and much more detailed information on the TB models can be found in the ESI.†(a) Parameters entering the tight-binding models
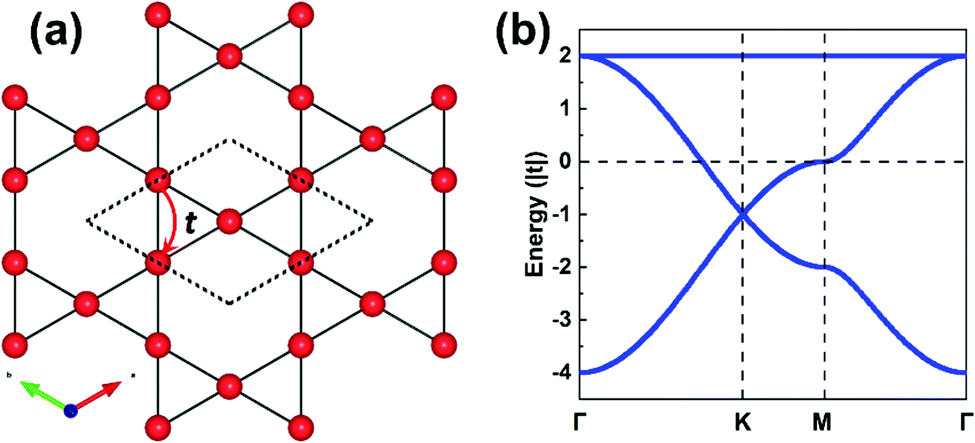
The parameters entering a TB model are the on-site energies ε and hopping integrals (also referred to as electronic couplings or transfer integrals) t;31 to place them in a more chemical context, these parameters correspond to the Coulomb integrals α and resonance integrals β of the Hückel method. While the Hückel method relies on a single-orbital basis (i.e., one orbital per site) and only considers nearest-neighbor hopping,32,33 the TB approach offers more flexibility as the orbital basis can be extended to multiple orbitals per site and the restriction of nearest-neighbor hopping can be removed. In fact, effectively adopting MOs instead of conventional atomic orbitals (AOs) to form the TB orbital basis is what will enable an in-depth understanding of the COF electronic states.As a starting point, however, we consider an extremely simple model based on single-orbital hopping in a honeycomb lattice, see Fig. 2a. We recall that a hexagonal lattice results in a honeycomb lattice when each site of the hexagonal lattice is replaced with two sites.11 Thus, this TB model, originally developed for graphene,34 yields two electronic bands, the so-called Dirac bands, with a bandwidth of 6|t|, as shown in Fig. 2b. An important feature of Dirac bands is the linear evolution of electron energy vs. momentum near their crossing point (Dirac point), which is what leads to the vanishing effective mass of the charge carriers in graphene. In marked contrast to graphene, however, the core sites in 2D hexagonal COFs are often much more complex as they consist of molecular units. It is thus critical to take this greater complexity into account if we wish to establish reliable relationships between the molecular building units and the COF electronic bands.
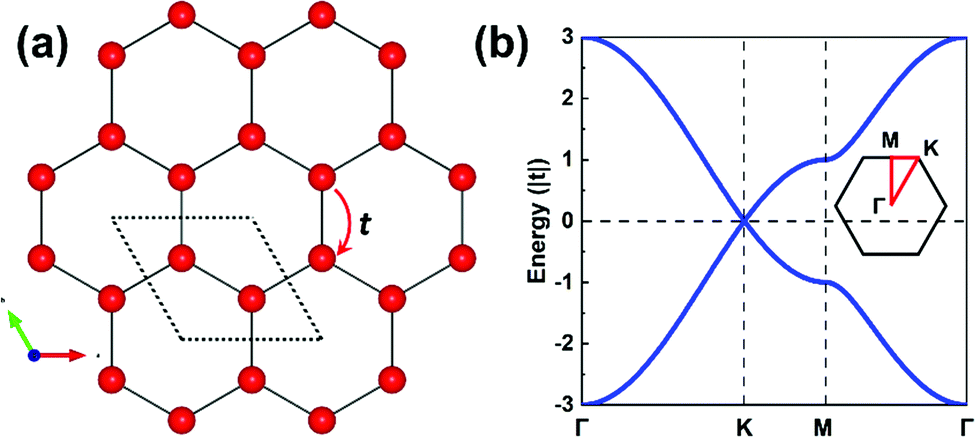 | ||
| Fig. 2 (a) Illustration of single-orbital hopping in a honeycomb lattice akin to graphene. The dashed rhombus indicates the unit cell. The nearest-neighbor hopping is indicated by t. (b) Band structure obtained from a TB model considering a single-orbital hopping in a honeycomb lattice with ε0 = 0 and t > 0; the inset depicts the first Brillouin zone. | ||
For the more theory-inclined reader, we detail in the ESI:† (i) how to generate a more complete and robust orbital basis for TB models by considering the frontier MOs of benzene as an example; and (ii) how to determine the hopping terms (see Fig. S2). Interestingly, the bottom line turns out to be rather simple:
• Doubly degenerate MO's can be effectively described as a combination of two (orthogonal) πx-like and πy-like diatomic orbitals, whose sites energies, denoted επ, are identical.
• A single level can be effectively described by a σ-type diatomic orbital with site energy εσ.
• Hopping integrals between effective σ orbitals are denoted ssσ; between σ and π orbitals, spσ; and between π orbitals, ppσ or ppπ, depending on whether the interaction takes place axially or laterally.
(b) Building the tight-binding models
We stress again that, in order to accurately interpret the COF electronic bands formed by the frontier MOs of the core and linker units, it is mandatory to apply TB models with a multi-orbital basis and not just a single orbital on each site. With a set of the (σ, πx, πy) basis functions we mentioned above in hand, we now turn to an illustration of how to pick the orbital basis and build the TB models. For illustrative purposes, we choose a honeycomb lattice formed by benzene-like cores directly connected to one another at the meta positions, see Fig. 3a.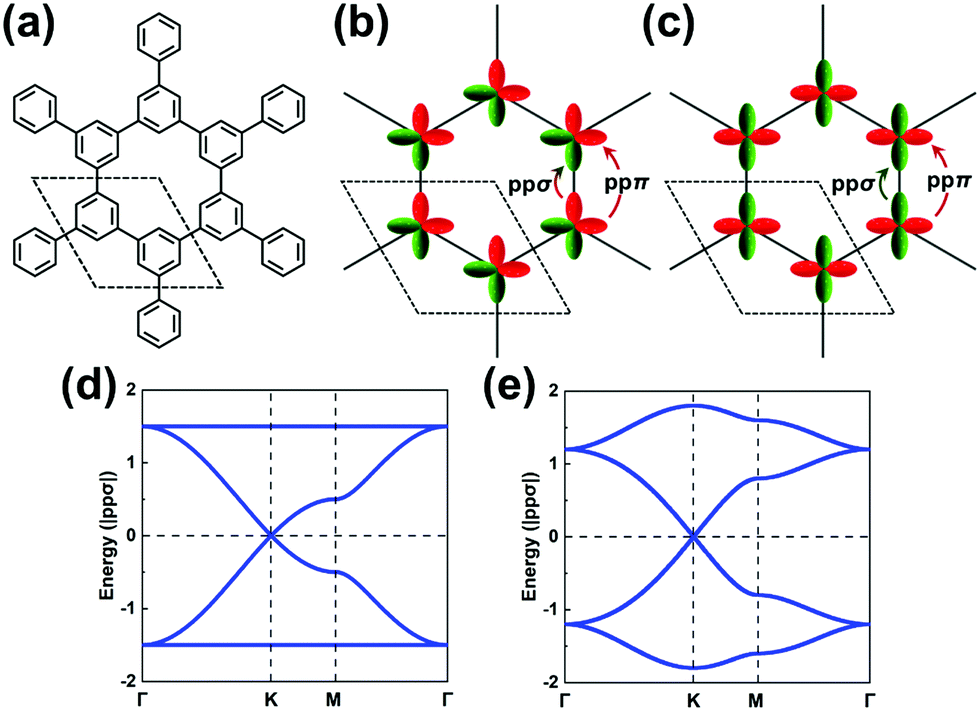 | ||
| Fig. 3 (a) A honeycomb lattice based on benzene cores. Illustrations of (b) bonding (occupied) and (c) antibonding (unoccupied) (πx, πy)-orbital hopping in a honeycomb lattice. The dashed rhombus indicates the unit cell. The ppσ and ppπ hopping integrals are indicated by arrows. Band structures obtained from the H-XY model with εp = 0 and (d) ppπ = 0 or (e) ppπ = −0.2|ppσ|. | ||
Let us consider the relevant occupied levels of benzene. Here, the on-site energy of the single level (π1 MO in Fig. S1, ESI†) is much lower in energy than that of the degenerate frontier levels (π2 and π3 MOs). Then, it is reasonable to consider a TB model with a (πx, πy)-orbital basis to describe the electronic bands of the COF honeycomb lattice;37–39 such a model is referred to as the H-XY model. In contrast, in instances where the σ-orbital energy is close to that of the degenerate π orbitals and the interaction between them is expected to be significant, one would have to apply a TB model with a (σ, πx, πy)-orbital basis, which is referred to as the H-SP2 model. We distinguish these two models below.
The H-XY model is illustrated in Fig. 3b and c in the case of occupied and unoccupied orbitals, respectively. Since the unit cell in such a honeycomb lattice consists of two sites, there are four orbitals per cell for the occupied [unoccupied] levels, which gives a total of four occupied [unoccupied] bands. When the ppπ hopping integral is negligible, the H-XY model leads to two Dirac bands sandwiched by two completely flat bands, see Fig. 3d.37–39 However, when ppπ is different from zero, the flat bands gain dispersion, as shown in Fig. 3e. The full bandwidth is 3|ppσ − ppπ| and 3|ppσ + ppπ| at the K and Γ points, respectively. For the unoccupied orbitals, the band structure displays the same characteristics as for the occupied orbitals.
It is remarkable to realize that, going from a single-carbon core in the case of graphene to a benzene core, the top valence band and bottom conduction band both become (nearly) totally flat. This is a first manifestation of the impact associated with a doubly degenerate character of the core HOMO and LUMO levels.
The H-SP2 model built from an (σ, πx, πy)-orbital basis for occupied levels is depicted in Fig. 4a for a honeycomb lattice. There are now six orbitals per unit cell (since each site has three orbitals), which thus generates six bands in the electronic structure.
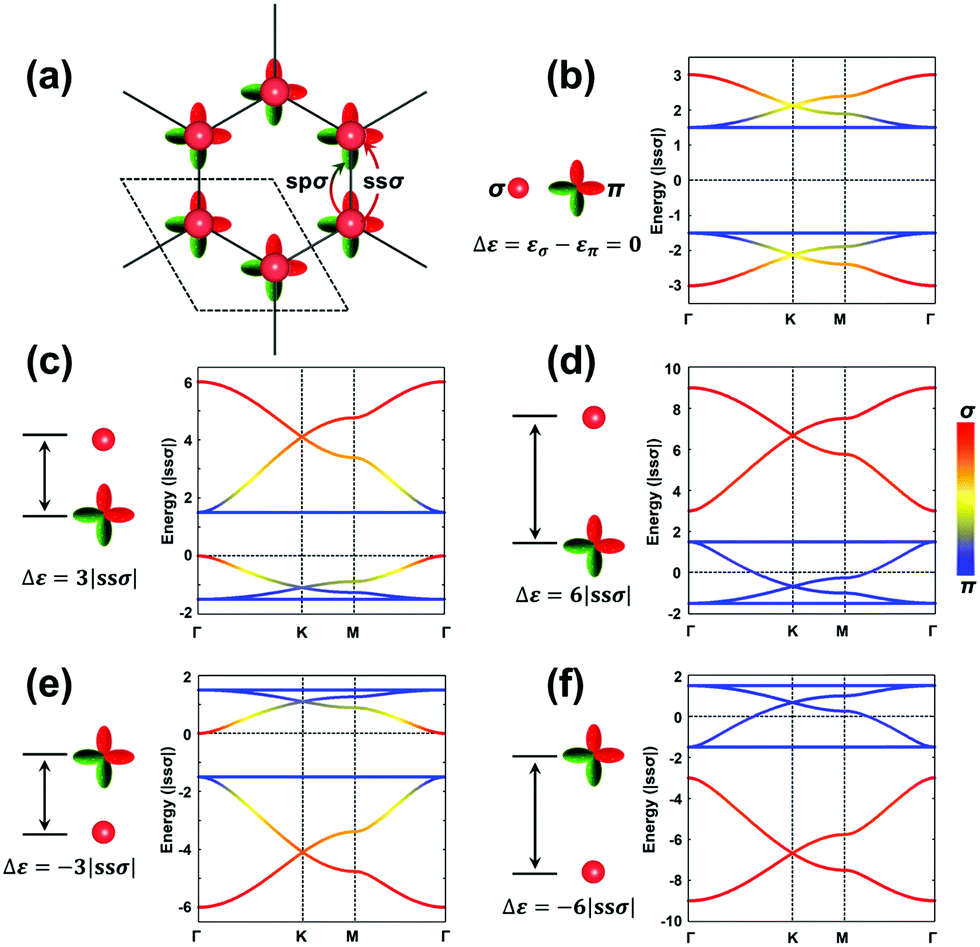 | ||
| Fig. 4 (a) Illustration of (σ, πx, πy)-orbital hopping in a honeycomb lattice. The dashed rhombus indicates the unit cell. The ssσ and spσ hopping integrals are indicated by the arrows. (b–f) Band structures obtained from H-SP2 models with επ = 0, spσ = −ssσ, ppσ = −ssσ, and ppπ = 0. Δε is defined as the energy difference between εσ and επ, (εσ − επ). (b) Δε = 0, (c) Δε = 3|ssσ|, (d) Δε = 6|ssσ|, (e) Δε = −3|ssσ|, and (f) Δε = −6|ssσ|. Red and blue represent the contributions from σ and π orbitals, respectively; see scale on the right side. | ||
Due to the increased complexity of the H-SP2 model, a variety of band-structure characteristics can be obtained depending on the relative magnitudes of the parameters.40 The hopping integrals, except for ppπ, are generally comparable in magnitude. Here, we take |ssσ| = |spσ| = |ppσ| and ppπ = 0 as an example to illustrate the typical band structures generated from an H-SP2 model, see Fig. 4b–f (in these figures, it is informative to pay attention to the σ or π nature of the bands, as indicated by the red/blue color coding). The gap between the two flat bands is 3|ppσ| when assuming zero ppπ. As in the case of the H-XY model, the dispersions of the flat bands are also tuned by non-zero ppπ hopping integrals.
As a starting point, we consider the limiting case where the σ and π orbitals have the same energy (εσ = 0 and επ = 0; Δε = εσ − επ = 0), as shown in Fig. 4b. There appear two sets of so-called kagome bands41 (where a set of kagome bands corresponds to two Dirac bands capped on one side by one flat band); here, it is the bottom band of the upper set and the top band of the bottom set that are flat bands. When εσ is higher in energy (less stable) than επ (e.g., Δε = 3|ssσ|), there also appear two sets of kagome bands but with the flat band appearing at the bottom of each set (see Fig. 4c); this is directly related to the fact that the σ-dominated bands of each set become less stable. A further increase in εσ leading to Δε = 6|ssσ| has the upper flat band down now touching the bottom set of kagome bands; at this point, the band structure appears as consisting, at lower energy, of the typical four bands from an H-XY model and, at higher energy, of two Dirac bands arising predominantly from single σ-orbital hopping in a hexagonal lattice (see Fig. 4d). When εσ is lower than επ, the band dispersions appear upside-down compared to the earlier case where εσ > επ, as shown in Fig. 4e and f.
Overall, Fig. 4 illustrates that a significant on-site energy difference between the σ and π orbitals separates the six bands into two groups: one dominated by the σ orbital, leading to two Dirac bands, and the other by π orbitals, leading to the typical four bands of the H-XY model. It is interesting to note that the energies of the two flat bands in the H-SP2 model of Fig. 4 remain at exactly the same values, irrespective of the on-site energy of the σ orbital, εσ; this again underlines that they essentially originate in the π orbitals, as indicated by the blue color of those bands in Fig. 4b–f.
More variations can be found in the band structures associated with an H-SP2 model and come from the modulation of the on-site energies (see Fig. S3, ESI†). We note that a flat band stays on top [bottom] of the other five bands when εσ is lower [higher] than επ; it corresponds to the highest VB [lowest CB] of the COFs when all the orbitals are occupied [unoccupied]. Importantly, the actual position of the Fermi level in the TB band structure does depend on the exact electron occupation of the sites, which is specific to each COF.
So far, we have dealt with a honeycomb lattice, which is formed by the COF cores. Now, we also consider the linkers, which form a kagome lattice, as depicted in Fig. 5a; a kagome lattice is obtained when each site of a hexagonal lattice is replaced with three sites.11 Thus, a COF consisting of both core and linker units forms a framework referred to as a honeycomb–kagome lattice, as illustrated in Fig. 6.
 | ||
| Fig. 5 (a) Illustration of single-orbital hopping in a kagome lattice. The dashed rhombus indicates the unit cell. The nearest-neighbor hopping is indicated by t. (b) Band structure obtained from a TB model considering single-orbital hopping in a kagome lattice with ε0 = 0 and t > 0. | ||
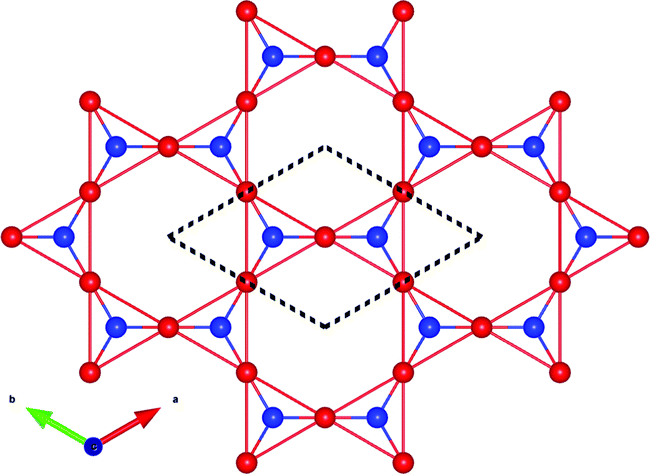 | ||
| Fig. 6 Illustration of a honeycomb–kagome framework where the cores (in blue) sit on the honeycomb sub-lattice and the linkers (in red) on the kagome sub-lattice. The dashed rhombus indicates the unit cell. | ||
Due to the absence of three-fold symmetry in the linkers, their MOs are not degenerate (even for benzene-derived linkers). As a result, to derive an appropriate TB model for the linkers, it is sufficient to consider a simple single-orbital hopping within a kagome lattice, as illustrated in Fig. 5a. Since each kagome unit cell has three sites with each carrying a single orbital, this gives rise to three bands with a total bandwidth of 6|t|. There is one flat band located either above or below two Dirac bands, as a function of the sign of the hopping term, as shown in Fig. 5b.41–44 We note that the flat band can gain dispersion when next-nearest neighbor interactions are significant;11,44 a discussion describing the position of the flat band as a function of the lattice hopping sign is provided in the ESI† (see Fig. S4).
As mentioned above, 2D COFs generally combine core units and linker units. Since the latter define a kagome sub-lattice and the former a honeycomb sub-lattice, the electronic bands are expected to embody the features of both lattices. From an evaluation of the frontier MOs of the isolated core and linker units (derived via simple molecular calculations at the DFT level), the corresponding 2D-COF electronic bands can be qualitatively predicted by taking advantage of the TB models we have described. The TB predictions can then be confirmed by performing DFT band-structure calculations, whose results then allow the quantitative determination of the on-site energies and hopping integral parameters entering the TB models. It should be borne in mind that, depending on the nature of the occupied and unoccupied frontier levels, the TB models needed to describe the top VBs and bottom CBs of a COF can be different. For instance, an H-SP2 model could be adopted to describe the VBs and an H-XY model for the CBs; also, the VBs could be confined on the linkers and the CBs on the cores, or vice versa. Considering the diversity of the core and linker units and the possible MO degeneracy in three-fold symmetric core units, our TB models can be readily applied to hexagonal COFs, which we demonstrate in Section III by considering four representative COFs. In Section IV, we propose the electronic band diagrams of hexagonal COFs based on the frontier MOs of their core and linker units. We end with a synopsis in Section V.
III. Application to representative COFs
(a) P2TANG COF
The chemical structure of this COF is displayed in Fig. 1a. We start by carrying out a molecular DFT calculation on the trioxaazatriangulene (TANG) core unit. As shown in the ESI† (see Fig. S5a), TANG has a doubly degenerate LUMO level, which is energetically well separated from the LUMO+1 level with ∼0.4 eV energy difference. This leads to the choice of a (πx, πy)-orbital basis within an H-XY model and results in the prediction that the bottom CB will be flat. In contrast, the HOMO corresponds to a single level, well-separated from the doubly degenerate HOMO−1 level. Thus, we can choose a graphene-type TB model for the valence band, which allows us to predict that there will appear two occupied Dirac VBs near the Fermi level. We note that the TB model for the occupied bands could also be extended to include the degenerate HOMO−1 level within an H-SP2 approach, which brings the prediction of top VBs looking like the band structure of Fig. 4d.The DFT band structure of the P2TANG COF is shown in Fig. 7a. The important feature is that it can be remarkably reproduced by the TB model, see Fig. 7b. The DFT-calculated bottom four CBs do indeed possess the typical features of the H-XY model, with two Dirac bands sandwiched between two (nearly) flat bands. In the case of the VBs, the DFT-calculated top six bands can be divided into the two groups represented in Fig. 4d, with the top group dominated by graphene-like σ-orbital hopping (two Dirac bands, denoted VB1) and the bottom group, by π-orbital hopping (four bands with two Dirac bands sandwiched between two flat bands, VB2). Focusing on the top two Dirac VB bands, the Dirac point appears about 0.5 eV below the valence band maximum and the total width of these bands (ca. 1 eV) is indicative of an electronic coupling (hopping integral) between the sites about 20 times as small as in graphene.
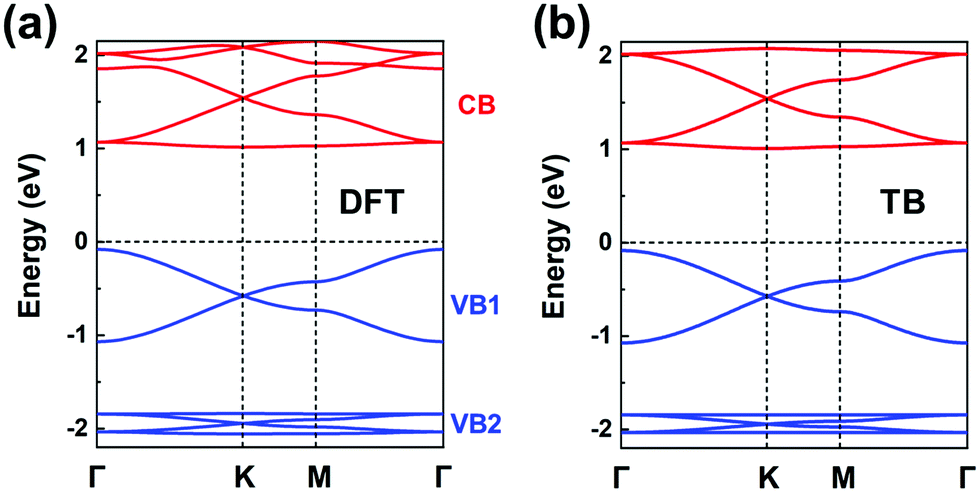 | ||
| Fig. 7 (a) DFT band structure of the P2TANG COF monolayer. (b) Band structure obtained from the TB models using the parameters listed in Table 1. The CBs (colored in red) and VBs (colored in blue) are fitted by an H-XY model and an H-SP2 model, respectively. | ||
The fitting parameters of the TB models are listed in Table 1. This description of the electronic structure of the P2TANG COF provides a first account of the underlying correlation among MO symmetry of the isolated units, lattice symmetry, and COF electronic bands.
| COF | ||||||||
|---|---|---|---|---|---|---|---|---|
| Parameters | P2TANG COF | TPB COF | BTA-PDA COF | COF-5 | ||||
| CB | VB | CB | VB | CB | VB | CB | VB | |
| ε σ (ε0) | — | −0.58 | 3.6 | −0.82 | 2.95 | −0.16 | 2.49 | — |
| ε π | 1.543 | −1.94 | 3.18 | −0.33 | 2.35 | — | — | −0.11 |
| ssσ (t) | — | −0.165 | −0.054 | −0.154 | −0.19 | 0.056 | 0.014 | — |
| spσ | — | 0.037 | 0.15 | 0.15 | 0.19 | — | — | — |
| ppσ | 0.337 | 0.063 | 0.193 | 0.193 | 0.23 | — | — | 0.039 |
| ppπ | −0.02 | 0 | 0 | 0 | 0 | — | — | 0 |
(b) TPB COF
Fig. 1b illustrates the chemical structure of the TPB COF. The DFT-calculated TPB LUMO (see Fig. S6a) is doubly degenerate and can serve as the orbital basis for an H-XY model or, with the additional consideration of the nondegenerate LUMO+1 level (located some 0.8 eV higher), for an H-SP2 model. Both the H-XY and H-SP2 models (in the latter case, the σ band is located above the πx, πy bands) lead to a flat lowest CB, in analogy to what was presented in Fig. 3d and 4c, d. The same analysis can be applied to the degenerate HOMO level and the HOMO−1 level, following either a H-XY or a H-SP2 model; here, the highest VB is flat since the σ band is located below the πx, πy bands. Thus, our prediction is that the TPB COF hosts a flat highest VB and a flat lowest CB, with two Dirac bands immediately below and above, respectively. These characteristics are fully confirmed by the DFT band-structure calculations, as shown in Fig. 8a.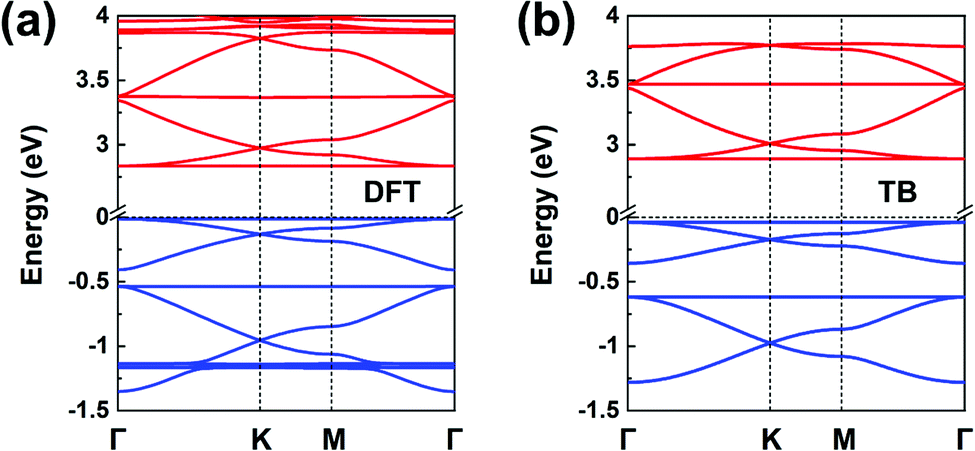 | ||
| Fig. 8 (a) DFT band structure of a TPB COF monolayer. (b) Band structure obtained from the TB models using the parameters listed in Table 1; the VBs and CBs are fitted by distinct H-SP2 models. The VBs and CBs are colored in blue and red, respectively. | ||
Since the CBs and VBs each carry two sets of three kagome bands, the H-SP2 model (which includes three orbitals per site) is a better choice to describe the overall band structure than the H-XY model, as seen from Fig. 8b. The DFT bands are reproduced very well by the distinct H-SP2 models applied for the CBs and the VBs, with the two sets of fitting parameters listed in Table 1. Again, these results confirm that the MO analyses of the COF building units provides a detailed understanding of the COF electronic bands.
We recall that the TPB COF can also be viewed as consisting of benzene cores and biphenyl linkers. However, considering the benzene molecule (with intrinsic six-fold symmetry) as the core unit fails to capture the actual three-fold symmetry it takes in the COF and turns out to prevent an accurate prediction of the COF band structure. Thus, the lesson we learn here is that the core and linker units used to perform the MO analysis must incorporate the basic characteristics of the corresponding COF structural symmetry; thus, considering TPB as the core is here a much better choice.
(c) BTA-PDA COF
In terms of MO analyses, in order to rely on an appropriate energy-level description of the MOs for both core and linker and to account accurately for their environments and symmetries in the COF, we have considered: (i) benzene-1,3,5-triyltrimethanimine (BTMA) to represent the core unit; and (ii) para-phenylenediamine (PDA) to represent the linker unit, see Fig. 9a. A first important aspect is that a comparison of the frontier MO energies in BTMA and PDA indicates that the bottom CBs should be dominated by BTMA and the top VBs by PDA. The BTMA LUMO is doubly degenerate and serves as the orbital basis for an H-XY model or, with the addition of the LUMO+1 level, for an H-SP2 model. In both instances, it can be predicted that the lowest CB will be flat and there appear two Dirac bands on top of it. The PDA HOMO is a single level very much separated energy-wise from the HOMO−1 level, which leads to the consideration of a TB model corresponding to single-orbital hopping in a kagome (sub)lattice. Here, the prediction is thus of a kagome-like VB structure. These predicted features are fully confirmed by the DFT bands displayed in Fig. 9b.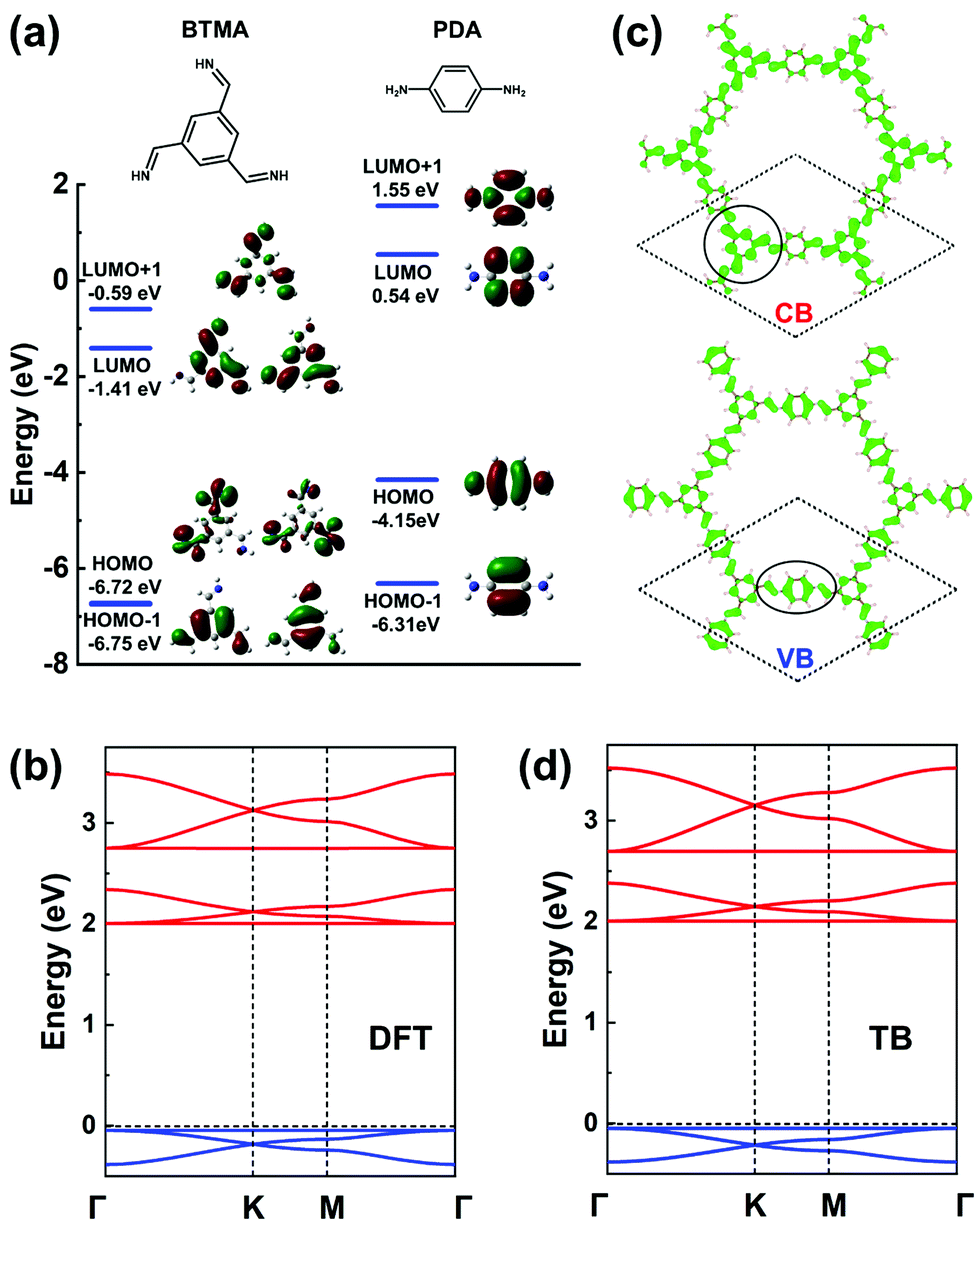 | ||
| Fig. 9 (a) DFT frontier MOs of isolated BTMA and PDA molecules. (b) DFT band structure of a BTA-PDA COF monolayer. (c) Partial charge distribution in the CBs and VBs; the dashed rhombus indicates the unit cell. The solid circles indicate the predominant contributions to the CBs and VBs. (d) Band structure obtained from the TB models using the parameters listed in Table 1. The VBs and CBs are fitted by a single-orbital kagome model and a H-SP2 model, respectively. The VBs and CBs are colored in blue and red, respectively. | ||
The BTA-PDA COF has dual flat bands as the top VB and bottom CB, with a large bandgap (over 2 eV at the DFT-PBE level). The bottom CBs and top VBs of the BTA-PDA COF have predominant contributions from the BTMA core and the PDA linker, respectively, which is consistent with the MO characteristics of Fig. 9a. The partial charge distributions in the CBs and VBs are shown in Fig. 9c. For the kagome-like VBs, the partial charge distribution is consistent with a major contribution coming from the PDA linker, while for the CBs the main contribution comes from the BTMA cores located on the honeycomb (sub)lattice sites. Fig. 9d highlights that the TB band structure with the fitting parameters listed in Table 1 reproduces the DFT bands remarkably well.
(d) COF-5
The frontier MOs of a triphenylene molecule, chosen as the model for the core unit, and a 1,4-phenylene-bis(boronic acid) (PBBA) molecule, chosen to represent the linker unit, are illustrated in Fig. 10a. Comparing the energies of the frontier MOs in the two isolated molecules, the PBBA unit is expected to dominate the bottom of the COF CB and the triphenylene unit, the top of the VB. The PBBA LUMO is pointing to the choice of a TB model considering single-orbital hopping in a kagome lattice. The triphenylene HOMO is doubly degenerate; given that the triphenylene cores sit on a honeycomb (sub)lattice, choosing for the VBs an H-XY model or (with the addition of the HOMO-1 level) an H-SP2 model will result in the top VB being flat, with two Dirac bands below it. The DFT band structure shown in Fig. 10b is fully consistent with these expectations and very well replicated by the TB models, see Fig. 10d.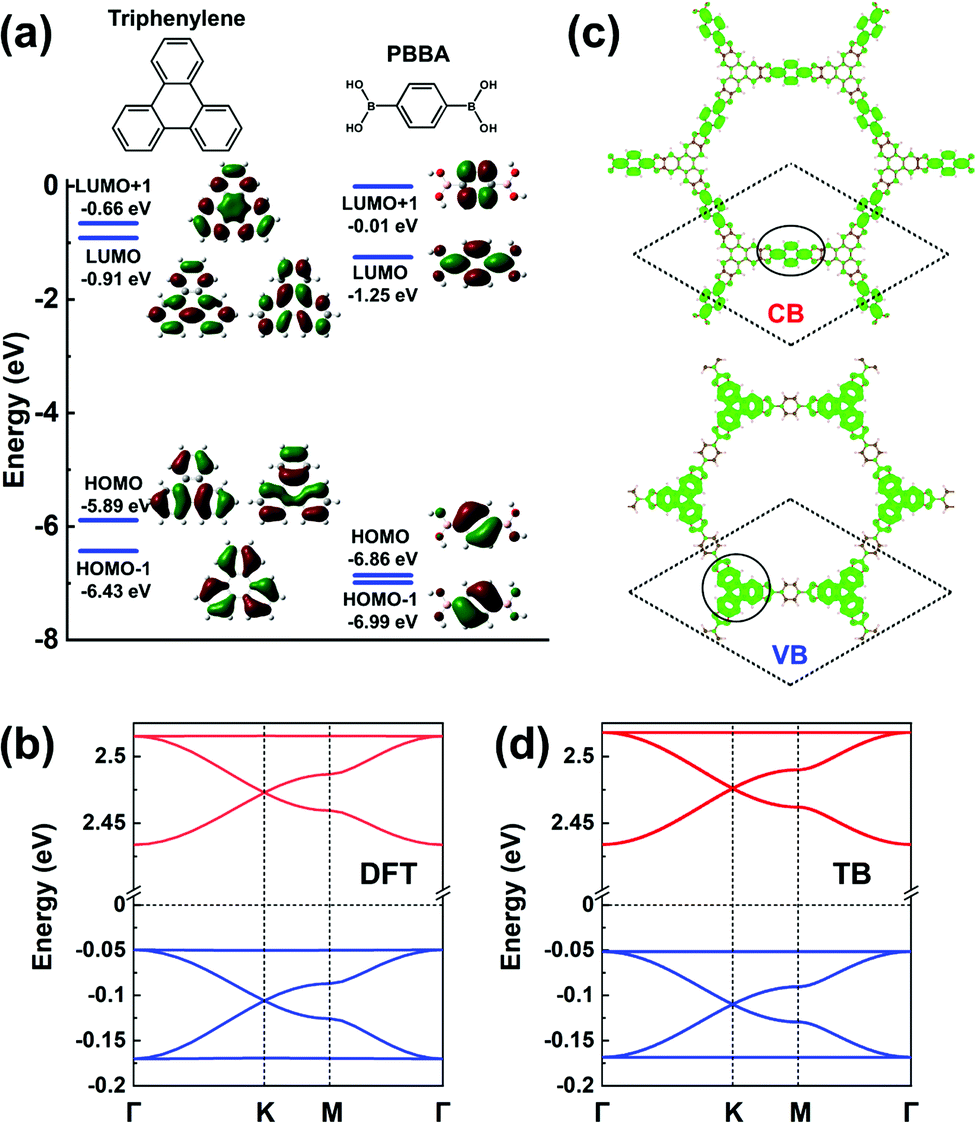 | ||
| Fig. 10 (a) DFT calculated frontier MOs of isolated triphenylene and PBBA molecules. (b) DFT band structure of a COF-5 monolayer. (c) Partial charge distribution in the CBs and VBs; the dashed rhombus indicates the unit cell. The solid circles indicate the predominant contributions to the CBs and VBs. (d) Band structure obtained from the TB models using the parameters listed in Table 1. The VBs and CBs are fitted by a TB model considering an H-XY model and a single-orbital hopping in a kagome lattice, respectively. The VBs and CBs are colored in blue and red, respectively. | ||
The partial charge distributions related to the CBs and VBs, see Fig. 10c, confirm the predominant contributions from the PBBA linker and the triphenylene core, respectively. Compared with the first three COFs we discussed, the conjugation in COF-5 is broken by the boronate ester, which leads to very small electronic couplings between the triphenylene cores and PBBA linkers. As a result, the bandwidths in COF-5 are very narrow, about 0.10 eV for the CBs and 0.13 eV for the VBs. Note that, except for COF-5, the other representative COFs are fully π-conjugated, which usually calls for on-surface synthesis as monolayers.18,23–28
Finally, since it has so far proven very challenging to produce 2D COF monolayers, it is useful to consider the impact on the electronic structure of having COF sheets interacting and forming a stack, see Fig. S8 (ESI†). The results show that the most salient features of the monolayer electronic structures do fully remain; the main difference is a reduced bandgap owing to interlayer electronic coupling. Thus, in bulk COFs with AA stacking pattern (see Fig. S9, ESI†), the in-plane bands (i.e., kz = 0: Γ–K–M–Γ and kz = 0.5: A–H–L–A) are nearly identical to those in the monolayer and there appears an out-of-plane dispersion (Γ to A).
For even more complex bulk stacking patterns, such as inclined and serrated, the interlayer couplings play an important role in determining the band dispersions, especially those in the out-of-plane direction. Thus, there can be instances where the electronic properties derived from the monolayer band structures need to be reassessed when addressing bulk and multi-layer structures as previously reported for COF-5,45 multi-layer graphene,46–51 and organic semiconductor molecular crystals.52 We stress that the in-plane band dispersions in bulk or thin films still derive from the monolayer band structure with some modulations due to the interlayer coupling. Therefore, studying the electronic structures of monolayers remains essential in order to better understand those in the bulk and thin films.
The conclusion that can be drawn is that the correspondence between the MOs of the core and linker units and the electronic bands remains valid for multi-layer and bulk COFs. We note that the calculated interlayer binding energies of our representative COFs (see Fig. S10, ESI†) point to the feasibility of exfoliating those COFs into 2D monolayers, which would facilitate the experimental characterization of these COFs as strictly 2D materials.
IV. Molecular orbitals vs. electronic bands
Our description of the electronic structure of hexagonal COFs underlines that the nature of the frontier MOs in the isolated building units, taken together with the lattice symmetry, directly informs the characteristics of the COF electronic bands, as depicted in Fig. 11. Consequently, by choosing the appropriate core and linker units, one can tune the dispersion of the top VBs and bottom CBs, i.e., whether they correspond to flat bands or dispersive Dirac bands, and modulate the COF bandgap in correspondence with the HOMO–LUMO gap of the building units.53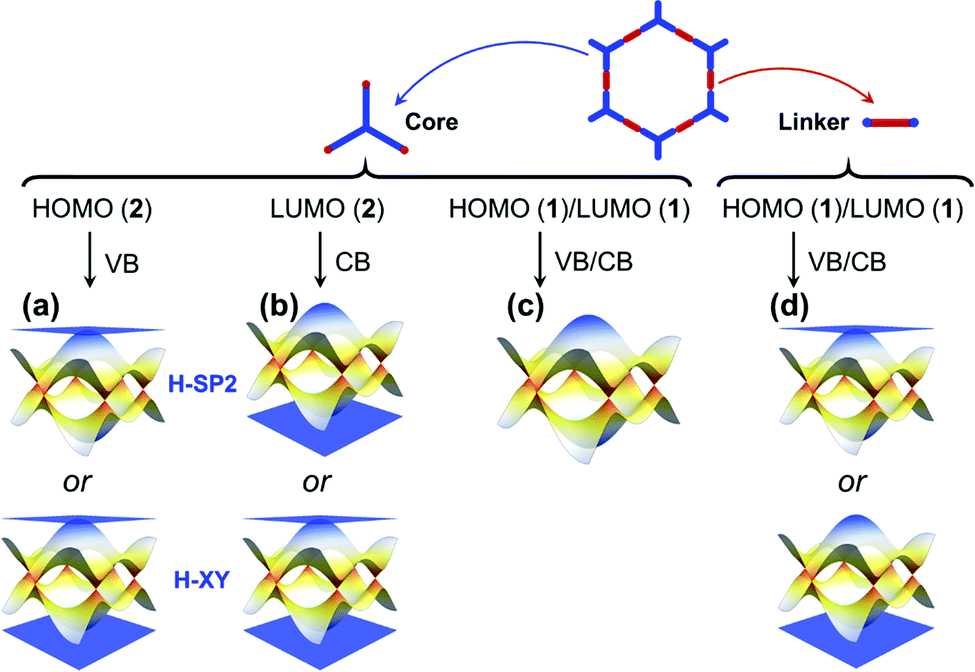 | ||
| Fig. 11 Schematic electronic band diagrams of 2D hexagonal COFs consisting of (blue) cores and (red) linkers. The nature of the VBs and CBs can be predicted according to the frontier MOs of the core and linker units. (a) A doubly degenerate HOMO level in the core unit leads to a flat highest VB with two Dirac bands below it, irrespective of whether an H-XY model or an H-SP2 model is chosen. (b) A doubly degenerate LUMO level in the core unit leads to a flat lowest CB with two Dirac band above it, irrespective of whether an H-XY model or an H-SP2 model is chosen. (c) A single (nondegenerate) HOMO [LUMO] level in the core unit leads to two Dirac bands, either following a TB model considering single-orbital hopping in a honeycomb (sub)lattice or following an H-SP2 model upon addition of a doubly degenerate HOMO−1 [LUMO+1] level. (d) A single (nondegenerate) HOMO or LUMO in the linker unit leads to kagome bands following a TB model considering single-orbital hopping in a kagome (sub)lattice. The numbers given in parentheses point to the MO degeneracy. | ||
Whether the HOMO and LUMO levels are dominated by the core and/or linker units is critical to the nature of the COF electronic bands. We recall that the cores form the sites of a honeycomb (sub)lattice and the linkers, those of a kagome (sub)lattice. For instance:
• When the HOMO [LUMO] is expected to be dominated by the core units and corresponds to a doubly degenerate level, we can predict that the top VB [bottom CB] is a flat band, degenerate with a dispersive band at the Γ point. We note that this prediction holds true whether we consider an H-XY model or an H-SP2 tight-binding model, as illustrated in Fig. 11a and b. Such features appear in the CBs of the P2TANG COF, the CBs and VBs of the TPB COF, the CBs of the BTA-PDA COF, and the VBs of COF-5.
• A single HOMO or LUMO level dominated by the core unit results in two Dirac bands (see Fig. 11c), such as in the case of the P2TANG COF VBs. Since such Dirac bands exist ubiquitously in hexagonal COFs, varying the electron filling (i.e., via a chemical redox reaction or modulating the heteroatom content or considering a radical-carrying building unit) can make the Fermi level shift to the Dirac bands.54–58 The substitution of carbon atoms with boron or nitrogen atoms in heterotriangulene COFs can effectively tune the electron filling and thus shift the Fermi level in such a way as to go from a semiconductor electronic structure to a semimetal electronic structure.54
In the case of the linkers, the HOMO and LUMO level are not degenerate since three-fold symmetry is not present. This leads to the formation of kagome bands with one flat band located above or below two Dirac bands, as displayed in Fig. 11d. The VBs of the BTA-PDA COF and the CBs of COF-5 fall into that category. The widths of kagome bands derived from linker units in π-conjugated COFs are generally wider than those in COFs that display no π-conjugation. Unfortunately, the relative position of the flat band above or below the Dirac bands is determined by the sign of the lattice hopping parameter, which cannot be directly determined from the type of MO analysis described above that involves isolated molecules to model the linker and core units. However, by expanding the size of the system from an isolated molecule to a small COF fragment (consisting of three linker units and one core unit), the MO analysis then provides clues to determine the sign of t (see Fig. S4 and S7 and related discussion in the ESI†).44
The most interesting topological features such as Dirac crossings often emerge away from the Fermi level and could be accessed via processes, such as doping/redox reactions, that usually lead to less stable materials. However, recent advances in the doping of organic semiconductors,59,60 and the development of more stable radical-carrying organic emitters61 give hope that experimental approaches to push the Fermi level towards the Dirac crossings can become viable.
It is worth stressing that the TPB COF and the BTA-PDA COF both present the distinctive feature of having flat bands directly above and below the Fermi level, see Fig. 8 and 9, which generally corresponds to a nontrivial electronic band topology.62 As a result, a plethora of fascinating quantum phenomena can potentially be derived, whose detailed description goes beyond the scope of this Focus article; we point the readers to recent relevant reviews.22,63,64 Flat-band derived intriguing phenomena have been extensively studied in systems ranging from kagome-lattice metals to twisted bilayer graphene,65–69 and the interest has been extended into other areas. For instance, the localized states related to flat bands have been observed in kagome and Lieb photonic lattices formed by coupled optical waveguide arrays.70–72 We can point, for example, to the excited-state quantum spin Hall effect;73,74 the excitonic insulator state, which can be achieved when the binding energy of the electron–hole pairs larger than the gap between the two flat bands;75–77 or magnetic properties in the absence of magnetic dopants, generated via partial doping of a highest VB or lowest CB that is flat and provides a high density of states.67,78
V. Synopsis
Via a combination of DFT molecular and band-structure calculations with tight-binding (TB) model analyses, we have conceptually illustrated the relationships in 2D hexagonal COFs among the symmetry of the frontier MOs in the core and linker units, the lattice symmetry, and the electronic-structure characteristics.A most interesting feature is to realize that the highest VB or lowest CB is always flat when it predominantly derives from the core unit and the core unit has doubly degenerate HOMO or LUMO levels; such band characteristics can give rise to intriguing quantum phenomena. A single (nondegenerate) frontier MO level in the core results in two Dirac bands, while a frontier MO derived from the linker forms a set of kagome bands (with the position of the flat band determined by the sign of the lattice hopping parameter).
By choosing the appropriate core and linker components, one can determine the dispersion of the COF electronic bands. Thus, the lessons learned in this Focus article provide an effective conceptual framework towards the engineering of flat and Dirac bands in hexagonal 2D COFs.
Conflicts of interest
There are no conflicts of interest to declare.Acknowledgements
The work at the University of Arizona was supported by the Army Research Office under the Multidisciplinary University Research Initiative (MURI) Award No. W911NF-15-1-0447 and under Award No. W911NF-17-1-03390, and by the College of Science of the University of Arizona. The work at the University of Utah was supported by the US Department of Energy (Award No. DE-FG02-04ER46148). The computing resources were provided by the Research Data Center (RDC) at the University of Arizona, the National Energy Research Scientific Computing Center (NERSC), and CHPC at the University of Utah.References
- A. P. Côté, A. I. Benin, N. W. Ockwig, M. Keeffe, A. J. Matzger and O. M. Yaghi, Science, 2005, 310, 1166–1170 CrossRef.
- A. P. Côté, H. M. El-Kaderi, H. Furukawa, J. R. Hunt and O. M. Yaghi, J. Am. Chem. Soc., 2007, 129, 12914–12915 CrossRef.
- S. S. Han, H. Furukawa, O. M. Yaghi and W. A. Goddard, J. Am. Chem. Soc., 2008, 130, 11580–11581 CrossRef CAS.
- C. J. Doonan, D. J. Tranchemontagne, T. G. Glover, J. R. Hunt and O. M. Yaghi, Nat. Chem., 2010, 2, 235–238 CrossRef CAS.
- E. L. Spitler, B. T. Koo, J. L. Novotney, J. W. Colson, F. J. Uribe-Romo, G. D. Gutierrez, P. Clancy and W. R. Dichtel, J. Am. Chem. Soc., 2011, 133, 19416–19421 CrossRef CAS.
- X. Feng, X. Ding and D. Jiang, Chem. Soc. Rev., 2012, 41, 6010–6022 RSC.
- J. W. Colson and W. R. Dichtel, Nat. Chem., 2013, 5, 453–465 CrossRef CAS.
- E. Jin, M. Asada, Q. Xu, S. Dalapati, M. A. Addicoat, M. A. Brady, H. Xu, T. Nakamura, T. Heine, Q. Chen and D. Jiang, Science, 2017, 357, 673–676 CrossRef CAS.
- A. M. Evans, L. R. Parent, N. C. Flanders, R. P. Bisbey, E. Vitaku, M. S. Kirschner, R. D. Schaller, L. X. Chen, N. C. Gianneschi and W. R. Dichtel, Science, 2018, 361, 52–57 CrossRef CAS.
- A. M. Evans, A. Giri, V. K. Sangwan, S. Xun, M. Bartnof, C. G. Torres-Castanedo, H. B. Balch, M. S. Rahn, N. P. Bradshaw, E. Vitaku, D. W. Burke, H. Li, M. J. Bedzyk, F. Wang, J.-L. Brédas, J. A. Malen, A. J. H. McGaughey, M. C. Hersam, W. R. Dichtel and P. E. Hopkins, Nat. Mater., 2021, 1142–1148 CrossRef CAS.
- S. Thomas, H. Li, C. Zhong, M. Matsumoto, W. R. Dichtel and J. L. Bredas, Chem. Mater., 2019, 31, 3051–3065 CrossRef CAS.
- S. Thomas, H. Li, R. R. Dasari, A. M. Evans, I. Castano, T. G. Allen, O. G. Reid, G. Rumbles, W. R. Dichtel, N. C. Gianneschi, S. R. Marder, V. Coropceanu and J.-L. Brédas, Mater. Horiz., 2019, 6, 1868–1876 RSC.
- S.-Y. Ding and W. Wang, Chem. Soc. Rev., 2013, 42, 548–568 RSC.
- P. J. Waller, F. Gándara and O. M. Yaghi, Acc. Chem. Res., 2015, 48, 3053–3063 CrossRef CAS.
- K. Geng, T. He, R. Liu, S. Dalapati, K. T. Tan, Z. Li, S. Tao, Y. Gong, Q. Jiang and D. Jiang, Chem. Rev., 2020, 120, 8814–8933 CrossRef CAS.
- R. Gutzler, Phys. Chem. Chem. Phys., 2016, 18, 29029–29100 RSC.
- H. S. Sasmal, H. B. Aiyappa, S. N. Bhange, S. Karak, A. Halder, S. Kurungot and R. Banerjee, Angew. Chem., Int. Ed., 2018, 57, 10894–10898 CrossRef CAS.
- G. Galeotti, F. De Marchi, E. Hamzehpoor, O. MacLean, M. Rajeswara Rao, Y. Chen, L. V. Besteiro, D. Dettmann, L. Ferrari, F. Frezza, P. M. Sheverdyaeva, R. Liu, A. K. Kundu, P. Moras, M. Ebrahimi, M. C. Gallagher, F. Rosei, D. F. Perepichka and G. Contini, Nat. Mater., 2020, 19, 874–880 CrossRef CAS.
- D. J. Rizzo, Q. Dai, C. Bronner, G. Veber, B. J. Smith, M. Matsumoto, S. Thomas, G. D. Nguyen, P. R. Forrester, W. Zhao, J. H. Jørgensen, W. R. Dichtel, F. R. Fischer, H. Li, J.-L. Bredas and M. F. Crommie, Nano Lett., 2020, 20, 963–970 CrossRef CAS.
- W. Jiang, H. Huang and F. Liu, Nat. Commun., 2019, 10, 2207 CrossRef.
- B. Cui, X. Zheng, J. Wang, D. Liu, S. Xie and B. Huang, Nat. Commun., 2020, 11, 66 CrossRef CAS.
- W. Jiang, X. Ni and F. Liu, Acc. Chem. Res., 2021, 54, 416–426 CrossRef CAS.
- R. Gutzler, H. Walch, G. Eder, S. Kloft, W. M. Heckl and M. Lackinger, Chem. Commun., 2009, 4456–4458 RSC.
- M. O. Blunt, J. C. Russell, N. R. Champness and P. H. Beton, Chem. Commun., 2010, 46, 7157–7159 RSC.
- M. Lackinger, Chem. Commun., 2017, 53, 7872–7885 RSC.
- L. Xu, X. Zhou, W. Q. Tian, T. Gao, Y. F. Zhang, S. Lei and Z. F. Liu, Angew. Chem., Int. Ed., 2014, 53, 9564–9568 CrossRef CAS.
- L. Xu, Y. Yu, J. Lin, X. Zhou, W. Q. Tian, D. Nieckarz, P. Szabelski and S. Lei, Nanoscale, 2016, 8, 8568–8574 RSC.
- J. Sun, X. Zhou and S. Lei, Chem. Commun., 2016, 52, 8691–8694 RSC.
- J. Liu, F. Yang, L. Cao, B. Li, K. Yuan, S. Lei and W. Hu, Adv. Mater., 2019, 31, 1902264 CrossRef.
- J. W. Colson, A. R. Woll, A. Mukherjee, M. P. Levendorf, E. L. Spitler, V. B. Shields, M. G. Spencer, J. Park and W. R. Dichtel, Science, 2011, 332, 228–231 CrossRef CAS.
- J. C. Slater and G. F. Koster, Phys. Rev., 1954, 94, 1498–1524 CrossRef CAS.
- E. Hückel, Z. Phys., 1931, 72, 310–337 CrossRef.
- R. Hoffmann, J. Chem. Phys., 1963, 39, 1397–1412 CrossRef CAS.
- P. R. Wallace, Phys. Rev., 1947, 71, 622–634 CrossRef CAS.
- J. W. Moskowitz and M. P. Barnet, J. Chem. Phys., 1963, 39, 1557–1560 CrossRef CAS.
- J. M. Schulman and J. W. Moskowitz, J. Chem. Phys., 1965, 43, 3287–3290 CrossRef CAS.
- M. Zhou, W. Ming, Z. Liu, Z. Wang, P. Li and F. Liu, Proc. Natl. Acad. Sci. U. S. A., 2014, 111, 14378–14381 CrossRef CAS.
- M. Zhou, W. Ming, Z. Liu, Z. Wang, Y. Yao and F. Liu, Sci. Rep., 2014, 4, 7102 CrossRef.
- X. Ni, H. Huang and F. Liu, Phys. Rev. B, 2020, 101, 125114 CrossRef CAS.
- Y. Zhou, G. Sethi, C. Zhang, X. Ni and F. Liu, Phys. Rev. B, 2020, 102, 125115 CrossRef CAS.
- E. Tang, J. W. Mei and X. G. Wen, Phys. Rev. Lett., 2011, 106, 236802 CrossRef.
- X. Ni, W. Jiang, H. Huang, K. H. Jin and F. Liu, Nanoscale, 2018, 10, 11901–11906 RSC.
- S. Zhang, M. Kang, H. Huang, W. Jiang, X. Ni, L. Kang, S. Zhang, H. Xu, Z. Liu and F. Liu, Phys. Rev. B, 2019, 99, 100404(R) CrossRef.
- X. Ni, Y. Zhou, G. Sethi and F. Liu, Phys. Chem. Chem. Phys., 2020, 22, 25827–25832 RSC.
- A. Kuc, M. A. Springer, K. Batra, R. Juarez-Mosqueda, C. Wöll and T. Heine, Adv. Funct. Mater., 2020, 30, 1908004 CrossRef CAS.
- M. S. Dresselhaus and G. Dresselhaus, Adv. Phys., 2002, 51, 1–186 CrossRef CAS.
- M. Aoki and H. Amawashi, Solid State Commun., 2007, 142, 123–127 CrossRef CAS.
- S. Latil and L. Henrard, Phys. Rev. Lett., 2006, 97, 36803 CrossRef.
- L. M. Malard, J. Nilsson, D. C. Elias, J. C. Brant, F. Plentz, E. S. Alves, A. H. Castro Neto and M. A. Pimenta, Phys. Rev. B, 2007, 76, 201401 CrossRef.
- A. H. Castro Neto, F. Guinea, N. M. R. Peres, K. S. Novoselov and A. K. Geim, Rev. Mod. Phys., 2009, 81, 109–162 CrossRef CAS.
- K. F. Mak, J. Shan and T. F. Heinz, Phys. Rev. Lett., 2010, 104, 176404 CrossRef.
- J. L. Brédas, J. P. Calbert, D. A. da Silva Filho and J. Cornil, Proc. Natl. Acad. Sci. U. S. A., 2002, 99, 5804 LP–5809 LP CrossRef.
- J.-L. Bredas, Mater. Horiz., 2014, 1, 17–19 RSC.
- Y. Jing and T. Heine, J. Am. Chem. Soc., 2019, 141, 743–747 CrossRef CAS.
- J.-J. Adjizian, P. Briddon, B. Humbert, J.-L. Duvail, P. Wagner, C. Adda and C. Ewels, Nat. Commun., 2014, 5, 5842 CrossRef CAS.
- V. Lakshmi, C.-H. Liu, M. Rajeswara Rao, Y. Chen, Y. Fang, A. Dadvand, E. Hamzehpoor, Y. Sakai-Otsuka, R. S. Stein and D. F. Perepichka, J. Am. Chem. Soc., 2020, 142, 2155–2160 CrossRef CAS.
- I. Alcón, F. Viñes, I. de, P. R. Moreira and S. T. Bromley, Nat. Commun., 2017, 8, 1957 CrossRef.
- S. Thomas, H. Li and J.-L. Bredas, Adv. Mater., 2019, 31, 1900355 CrossRef.
- M. Nikolka, I. Nasrallah, B. Rose, M. K. Ravva, K. Broch, A. Sadhanala, D. Harkin, J. Charmet, M. Hurhangee, A. Brown, S. Illig, P. Too, J. Jongman, I. McCulloch, J.-L. Bredas and H. Sirringhaus, Nat. Mater., 2017, 16, 356–362 CrossRef CAS.
- D. Kiefer, R. Kroon, A. I. Hofmann, H. Sun, X. Liu, A. Giovannitti, D. Stegerer, A. Cano, J. Hynynen, L. Yu, Y. Zhang, D. Nai, T. F. Harrelson, M. Sommer, A. J. Moulé, M. Kemerink, S. R. Marder, I. McCulloch, M. Fahlman, S. Fabiano and C. Müller, Nat. Mater., 2019, 18, 149–155 CrossRef CAS.
- H. Guo, Q. Peng, X.-K. Chen, Q. Gu, S. Dong, E. W. Evans, A. J. Gillett, X. Ai, M. Zhang, D. Credgington, V. Coropceanu, R. H. Friend, J.-L. Brédas and F. Li, Nat. Mater., 2019, 18, 977–984 CrossRef CAS.
- Z. Liu, F. Liu and Y. S. Wu, Chinese Phys. B, 2014, 23, 077308 CrossRef.
- L. M. Schoop, F. Pielnhofer and B. V. Lotsch, Chem. Mater., 2018, 30, 3155–3176 CrossRef CAS.
- N. Kumar, S. N. Guin, K. Manna, C. Shekhar and C. Felser, Chem. Rev., 2021, 121, 2780–2815 CrossRef CAS.
- Z. Liu, M. Li, Q. Wang, G. Wang, C. Wen, K. Jiang, X. Lu, S. Yan, Y. Huang, D. Shen, J.-X. Yin, Z. Wang, Z. Yin, H. Lei and S. Wang, Nat. Commun., 2020, 11, 4002 CrossRef CAS.
- M. Kang, L. Ye, S. Fang, J.-S. You, A. Levitan, M. Han, J. I. Facio, C. Jozwiak, A. Bostwick, E. Rotenberg, M. K. Chan, R. D. McDonald, D. Graf, K. Kaznatcheev, E. Vescovo, D. C. Bell, E. Kaxiras, J. van den Brink, M. Richter, M. Prasad Ghimire, J. G. Checkelsky and R. Comin, Nat. Mater., 2020, 19, 163–169 CrossRef CAS.
- J.-W. Rhim, K. Kim and B.-J. Yang, Nature, 2020, 584, 59–63 CrossRef CAS.
- Y. Cao, V. Fatemi, A. Demir, S. Fang, S. L. Tomarken, J. Y. Luo, J. D. Sanchez-Yamagishi, K. Watanabe, T. Taniguchi, E. Kaxiras, R. C. Ashoori and P. Jarillo-Herrero, Nature, 2018, 556, 80–84 CrossRef CAS.
- Y. Cao, V. Fatemi, S. Fang, K. Watanabe, T. Taniguchi, E. Kaxiras and P. Jarillo-Herrero, Nature, 2018, 556, 43–50 CrossRef CAS.
- S. Mukherjee, A. Spracklen, D. Choudhury, N. Goldman, P. Öhberg, E. Andersson and R. R. Thomson, Phys. Rev. Lett., 2015, 114, 245504 CrossRef.
- Y. Zong, S. Xia, L. Tang, D. Song, Y. Hu, Y. Pei, J. Su, Y. Li and Z. Chen, Opt. Express, 2016, 24, 8877–8885 CrossRef.
- S. Xia, A. Ramachandran, S. Xia, D. Li, X. Liu, L. Tang, Y. Hu, D. Song, J. Xu, D. Leykam, S. Flach and Z. Chen, Phys. Rev. Lett., 2018, 121, 263902 CrossRef.
- C. L. Kane and E. J. Mele, Phys. Rev. Lett., 2005, 95, 226801 CrossRef CAS.
- Y. Zhou, G. Sethi, H. Liu and F. Liu, arXiv:1908.03689, 2019.
- W. Kohn, Phys. Rev. Lett., 1967, 19, 439–442 CrossRef CAS.
- D. Jérome, T. M. Rice and W. Kohn, Phys. Rev., 1967, 158, 462–475 CrossRef.
- G. Sethi, Y. Zhou, L. Zhu, L. Yang and F. Liu, Phys. Rev. Lett., 2021, 126, 196403 CrossRef CAS.
- H. Tasaki, Phys. Rev. Lett., 1992, 69, 1608–1611 CrossRef.
Footnote |
| † Electronic supplementary information (ESI) available. See DOI: 10.1039/d1mh00935d |
| This journal is © The Royal Society of Chemistry 2022 |