 Open Access Article
Creative Commons Attribution 3.0 Unported Licence
Chiral nematic liquid crystal droplets as a basis for sensor systems†‡
Daniel A.
Paterson
 *ab,
Xiaoxue
Du
ac,
Peng
Bao
 a,
Adele A.
Parry
a,
Sally A.
Peyman
ad,
Jonathan A. T.
Sandoe
a,
Adele A.
Parry
a,
Sally A.
Peyman
ad,
Jonathan A. T.
Sandoe
 d,
Stephen D.
Evans
 a,
Dan
Luo
 c,
Richard J.
Bushby
 b,
J. Cliff
Jones
 a and
Helen F.
Gleeson
 *a
*a
aSchool of Physics and Astronomy, University of Leeds, Leeds, LS2 9JT, UK. E-mail: d.a.paterson@leeds.ac.uk; h.f.gleeson@leeds.ac.uk
bSchool of Chemistry, University of Leeds, Leeds, LS2 9JT, UK
cDepartment of Electrical and Electronic Engineering, Southern University of Science and Technology, Shenzhen, 518055, China
dLeeds Institute of Medical Research, University of Leeds, Leeds, LS2 9JT, UK
First published on 7th March 2022
Abstract
For a series of phospholipid coated calamitic nematic liquid crystal droplets (5CB, 6CB, 7CB, E7 and MLC7023) of diameter ∼18 μm, the addition of chiral dopant leaves the sign of surface anchoring unchanged. Herein we report that for these chiral nematic droplets an analyte induced transition from a Frank–Pryce structure (with planar anchoring) to a nested-cup structure (with perpendicular anchoring) is accompanied by changes in the intensity of reflected light. We propose this system as both a general scheme for understanding director fields in chiral nematic liquid crystal droplets with perpendicular anchoring and as an ideal candidate to be utilised as the basis for developing cheap, single use LC-based sensor devices.
Design, System, ApplicationPoint of care testing is becoming an ever more important aspect of modern healthcare. The need for a simple system whereby a diagnosis can be obtained without the need for complicated optical set-ups or read out devices is a crucial step in the design of these inexpensive usable sensor devices. Chiral nematic liquid crystal (LC) droplets are ideal candidates to solve this issue, however this type of system has not yet been utilised for this application. In order to explore this area and aid in the future design of LC based sensor devices we produced a series of monodisperse, surfactant coated, chiral nematic droplets via microfluidics. We demonstrate that a change in the surface alignment from planar aligned (Frank–Pryce) to perpendicular aligned (nested-cup) can be chemically induced. This results in a change in the intensity of reflected light. By controlling the LC and surfactant composition, a large degree of control can be extended over the alignment of the LC droplets. The incorporation of a chiral dopant enables the observation of a reflected light intensity change that signals the change in surface anchoring. We propose this as a system by which an LC sensor device can be based. |
Introduction
Most attempts to develop liquid crystal (LC) sensors1–16 rely on the fact that the sign of anchoring can be reversed by a very small change at the interface between the LC and surrounding medium, and on the way that this change propagates throughout the whole of a LC thin film, shell17–19 or droplet; either as free droplets, trapped droplets20 or droplets attached to a surface.21 It means that LC-based sensors are potentially very sensitive and naturally amplifying.6–8 However, these very attractive advantages need to be set against a number of significant challenges. One issue, specific to the important area of bio-sensing, is that commercial nematic liquid crystals are hydrophobic water-insoluble materials; they are immiscible with biological systems. This can be overcome by coating the interface with a monolayer of a natural or bio-compatible surfactant. Of the available candidates, phospholipids could make it possible to exploit some natural bio-membrane receptors.22 LC-based sensor technology also lends itself to point of care testing, meaning development of single-use devices that can be used without expensive polarizing microscopes or flow cytometry apparatus23 is viable. LCs can be used to make to very low-cost devices, the outstanding example being LC thermometers.24 These exploit droplets of chiral nematic LC dispersed in a polymer matrix and make use of the way in which the selective reflection of visible light (wavelength or colour) depends on temperature. Therefore, an attractive choice for practicable LC sensor systems could be one based on chiral nematic LC droplets that make use of changes in either the wavelength or intensity of the reflected light.25 This is the idea which is explored in the present paper using phospholipid-coated chiral nematic LC droplets.LC droplets show a rich science arising from the interplay between the energetic demands of surface anchoring and the need to minimise the elastic energy within the system. The surface anchoring energy26 depends on many factors including both the nature and the density of the surfactant coating. However, this surface anchoring energy is not simply a function of the interaction between the LC molecules and the surface layer. The interaction of LC molecules with each other is also critical; in particular the energy cost arising from the local smectic-like ordering22,27–29 imposed by perpendicular anchoring influences the interaction. Whereas the surface energy Fs scales as ∼ WR2, where W is an anchoring energy coefficient and R is the radius of the droplet, the elastic energy FE increases linearly with the radius ∼ KR. From this a critical radius can be determined RC ∼ K/W above which the surface anchoring energy dominates and below which the elastic energy dominates.30 Given typical magnitudes of the mean elastic constant K ∼ 10−11 N and 10−5 N m−1 < W < 10−4 N m−1, the critical radius is in the range 1 μm ≤ RC < 10 μm. In small droplets, where there is strong surface curvature, as well as the normal splay, twist and bend terms K11, K22 and K33, the saddle-splay term K24 can also be a significant contributor to the overall elastic energy.31
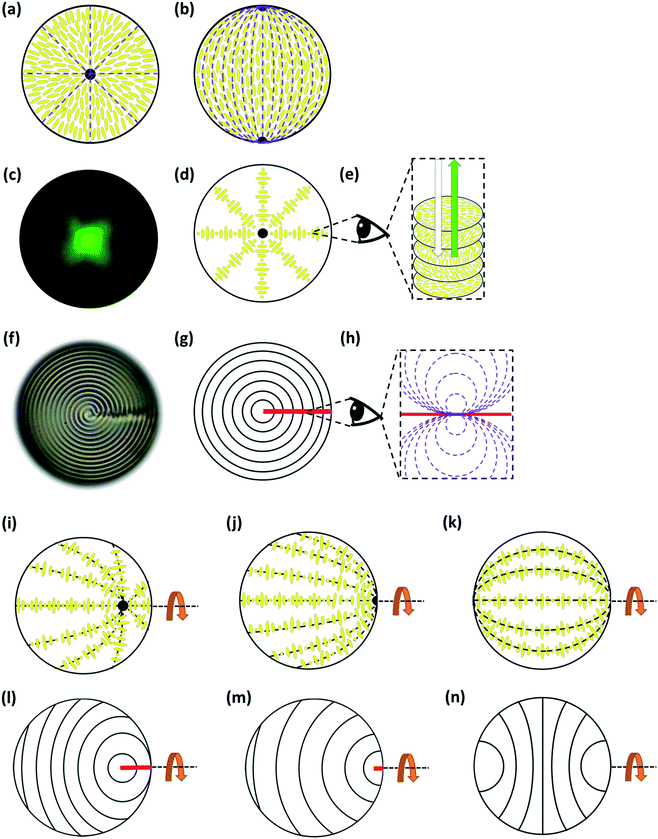
For droplets of (non-chiral) nematic LCs, there are several possible director fields including: radial; bipolar; twisted bipolar; escaped toroidal; toroidal etc.32 but, the commonest are radial (associated with perpendicular anchoring at the interface) and bipolar (associated with planar anchoring), Fig. 1a and b.
For chiral nematic LC droplets, when there is planar anchoring at the surface, provided the pitch p0 is less than the radius R, a Frank–Pryce structure results Fig. 1c–g. In this the helical axes are perpendicular and the isocline planes (the planes that share the same tilt of the director) are parallel to the surface.33–35 Because this has a radial distribution of the helical axes and because of the roughly spherical nature of the isocline layers, it is sometimes also referred to as a radial or spherulitic structure.36 When the pitch is in the wavelength range of visible light, these droplets are strongly reflective; the property that is exploited in liquid crystal thermometers. When such droplets are examined using a microscope operating in reflection-mode each droplet shows a bright spot (a ‘bullseye’) in its centre, Fig. 1c. This corresponds to the relatively small range of incidence/reflection angles where the helical axis is parallel (or almost parallel) to the viewing axis. Because it is an approximately spherically symmetric structure, the observed reflectance is not affected by tumbling motions of droplets in solution. In cases where the pitch is of the order of a few microns, when the droplets are viewed using transmission-mode microscopy the isocline layers can be visualised as a series of approximately concentric shells, Fig. 1f.
When surfactants are added that change the surface anchoring to (or towards) the perpendicular; more than one structure can result and the literature is not clear on how these relate to each other or why sometimes one structure is formed or another. Some of the most commonly observed director fields are shown in Fig. 1i–n.37–41 If the pitch is of the order of the wavelength of visible light and these droplets are observed in reflection-mode, most often what is seen is the so-called ‘flashlight’ structure; a single reflecting spot, which appears to be located on the surface of the droplet but which moves as the droplet tumbles in solution and periodically appears and disappears. These droplets are associated with ‘nested-cup’ director fields of the type shown in Fig. 1i, j, l, and m.37,39,41,42 Sometimes, however, so-called equatorial structures are observed Fig. 1k and m.37,39–42 As well as the nested cup and equatorial structures shown in Fig. 1, in which the focus of the helical axes is inside or at the edge of the droplet, examples are also seen in which it lies outside the droplet. The sequence 1i to 1j to 1k involves increasing alignment of the helical axes with the curved surface of the droplet.39 Where this process stops and which structure is finally obtained depends on the strength of the anchoring and the values of all three of the elastic constants; K11, K22, and K33. All represent states in which the helical axes align or begin to align with the curved surface of the droplet;43 states in which the surface alignment becomes increasingly biased towards the perpendicular.
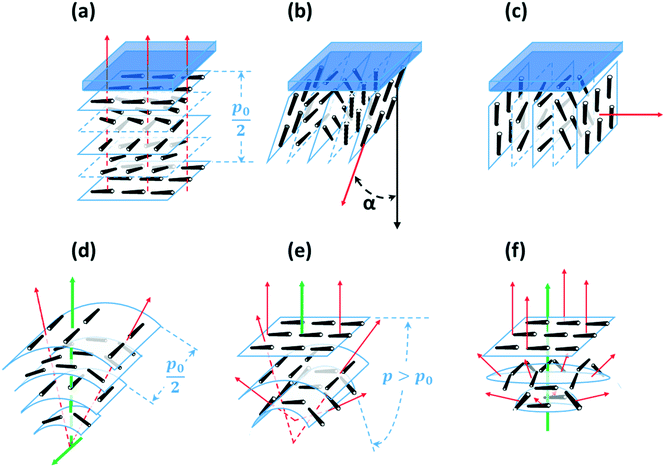
If the helical axis of a chiral nematic LC (i.e. the isocline normal) is at an angle α to a surface normal, the LC directors make an angle to the surface that lies in the range 0° to (90 − α)°, so that, if the helical axis is perpendicular to the surface (the isocline planes parallel to the surface) there is planar anchoring of n but, if the helical axis is parallel to the surface (the isocline planes perpendicular) the LC n directors are evenly distributed between 0° and 90° to the surface normal, Fig. 2.
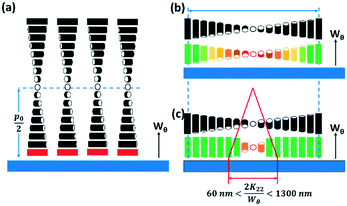
For a surface with perpendicular anchoring and with an anchoring energy Wθ, the surface energy density US is of the form;
 | (1) |
This paper is concerned with switching between Frank–Pryce and ‘nested-cup/flashlight’ structures caused by changing the surface anchoring from planar to perpendicular. In the Frank–Pryce structure the defect is locked into the centre of the droplet by the surface anchoring. However, once this constraint is relaxed by weakening or changing the sign of the anchoring it is free to migrate towards, to or even beyond the edge of the droplet. Even if the helical axes remain straight,37 this will stabilise the system because the total energy within the droplet is reduced (the proportion of highly curved isocline layers is reduced) and the isoclines now intercept the droplet surface (α ≠ 90°) which decreases the anchoring cost (eqn (1)). Straight helical axes imply that all of the isocline shells are equally spaced and all centred on the same focus as the helical axes. However, examination of transmission mode images for droplets with a long enough pitch to be visualised,40–42 shows that this is not the case. The focus of the second isocline shell is further out from the centre than the first, the third further still and so on. This corresponds to a flattening of the isocline layers, Fig. 2f, a progression away from strained curved isocline layers towards an unstrained state in which they are flat. Clearly this must be true for the ‘equatorial’ structure, Fig. 1k, and if it is also true for the nested cup structures then the trend from Fig. 1d to Fig. 1i to Fig. 1j to Fig. 1k corresponds to a sequence in which the helical axes are increasingly bent and increasingly align with the curved surface of the droplet. A consequence of this is that the isocline layers are no longer evenly spaced; the pitch is stretched and/or compressed. Certainly there should be a change in the spread of wavelengths of the reflected light and perhaps an overall red or blue shift.
In this study we have used cyanobiphenyl LCs (5CB, 6CB, 7CB, E7 and MLC7023)22 doped with S1011 or R5011, Fig. 4. The phospholipid coatings used were both natural (DOPC and DOPG) lipids and synthetic (DnPdPC, MFPC and DFPC)22 lipids shown in Fig. 4.
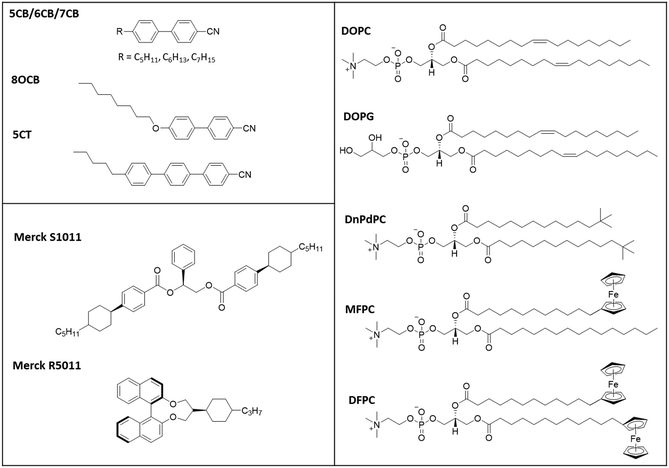 | ||
| Fig. 4 Chemical structures of the LCs, chiral dopant and lipids used (excluding the commercial mixture MLC7023). The composition of E7 is 51% 5CB, 25% 7CB, 16% 8OCB and 8% 5CT.20 The composition of MLC7023 is not published but its physical properties have been previously studied and reported.22 | ||
Since the focus of our work is droplets that are potentially relevant to biosensing applications we have concentrated on monodisperse phospholipid-coated droplets generated in a microfluidic device. However, we have also made use of the fact that strong planar anchoring can also be achieved by using polyvinyl alcohol (PVA) and strong perpendicular anchoring by using sodium dodecyl sulfate (SDS). In the first part of this paper, we establish that, the anchoring for the chiral-doped nematic LC droplets can be manipulated in exactly the same way as that for non-chiral nematic LC droplets.22 We then go on to study the effect of switching the sign of the anchoring on the optical properties of the droplets showing that, in the switch from Frank–Pryce to ‘flashlight’ droplets, there may be a shift in the wavelength of the reflected light but that the decrease in intensity is a much more marked and potentially the more useful phenomenon.
Experimental procedures
Materials
The LCs 4-cyano-4′-pentylbiphenyl (5CB), 4-cyano-4′-hexylbiphenyl (6CB), 4-cyano-4′-heptylbiphenyl (7CB) and the mixture E7 were purchased from Synthon Chemicals GmbH & Co. KG, Germany. The LC mixture MLC7023 and the chiral additives S1011 (helical twisting power, HTP, 34 ± 2 μm−1)44 and R5011 (HTP, 120 ± 10 μm−1)45 were provided by Merck Group, UK.1,2-Dioleoyl-sn-glycero-3-phosphocholine (DOPC) and 1,2-dioleoyl-sn-glycero-3-phospho-rac-(1-glycerol) sodium salt (DOPG), Texas Red-DHPE and HEPES (purity >99.5%) were purchased from Sigma-Aldrich. The lipids 1,2-di-neo-pentadecoyl-sn-glycero-3-phosphocholine (DnPdPC), 1-palmitoyl-2-(12′-ferrocenyl)-dodecoyl-sn-glycero-3-phosphocholine (MFPC), and 1,2-bis(12′-ferrocenyl)-dodecanoyl-sn-glycero-3-phosphocholine (DFPC) were prepared previously.22
Premium glass microscope slides and glycerol, were obtained from Fisher Scientific (Pittsburgh, PA). Sylgard 184 silicone elastomer was purchased from Farnell, UK. Polyvinyl alcohol (PVA) (MW 30–70 kg mol−1, hydrolysis 87–90%), sodium dodecyl sulfate (SDS) and dichloromethane (DCM) were purchased from Sigma Aldrich. All aqueous solutions were prepared using deionized water from a Milli-Q water purification system (Millipore, Bedford, MA).
Preparation of lipid liposomes
To make the phospholipid-coated LC droplets, a liposome solution was made by hydration and tip sonication of a dried lipid or mixture of lipids with 0.1 mol% Texas Red–DHPE, as described previously.34 The Texas Red-DHPE is included to allow fluorescence imaging of the lipid-coated droplets, thereby allowing confirmation of the presence (or absence) of a lipid monolayer coating to the droplet. The lipid mixture was dissolved in a chloroform/methanol 1![[thin space (1/6-em)]](https://www.rsc.org/images/entities/char_2009.gif) :
:![[thin space (1/6-em)]](https://www.rsc.org/images/entities/char_2009.gif) 1 mixture in a glass vial and dried under nitrogen flow for 1 h. Milli-Q H2O was then added, and the vial was vortex-mixed for 2 min to produce a suspension of the lipids. The suspension was tip-sonicated for 30 min at 4 °C until a clear solution could be observed and then centrifuged for 5 min at 5000 rpm. The resultant supernatant was decanted to remove metal sediment from the tip sonicator. The supernatant was diluted with H2O to give a concentration of lipid of 0.5 mg mL−1. 15% volume of glycerol was added to the liposome solution to increase the viscosity, optimizing the flow properties for microfluidic liquid crystal droplet production.
1 mixture in a glass vial and dried under nitrogen flow for 1 h. Milli-Q H2O was then added, and the vial was vortex-mixed for 2 min to produce a suspension of the lipids. The suspension was tip-sonicated for 30 min at 4 °C until a clear solution could be observed and then centrifuged for 5 min at 5000 rpm. The resultant supernatant was decanted to remove metal sediment from the tip sonicator. The supernatant was diluted with H2O to give a concentration of lipid of 0.5 mg mL−1. 15% volume of glycerol was added to the liposome solution to increase the viscosity, optimizing the flow properties for microfluidic liquid crystal droplet production.
Preparation of LC chiral mixtures
The mixtures listed in Table ST4 of the ESI† were prepared by co-dissolving weighed amounts of each component in DCM and allowing the solvent to evaporate until dry. The mixtures were further dried under vacuum for at least 24 h prior to characterisation. Mixtures were chose to give either low-pitch droplets (p0/2 ≈ 7.8 μm) in which the layered structure could be visualised or high-pitch droplets reflecting green/yellow light (p0 ∼ 350 nm).Microfluidic device fabrication
The detail of the fabrication of the polydimethylsiloxane (PDMS) devices used can be found in our previous paper.20 Briefly, the software “CleWin” was used for the design. An MW2 laser direct-write laser system (Durham Magneto Optics Ltd, Durham, UK) was used to pattern the SU8 (thickness of 25 μm) creating an SU8 on silicon master. A PDMS (PDMS monomer and curing agent used in a weight ratio of 10![[thin space (1/6-em)]](https://www.rsc.org/images/entities/char_2009.gif) :
:![[thin space (1/6-em)]](https://www.rsc.org/images/entities/char_2009.gif) 1) copy of this silicon master was cross-linked at 75 °C for 1 h. Afterwards, access holes were punched into the PDMS copy, which was then given O2 plasma treatment (100 W, O2 pressure 0.5 mbar, 1 min, Zepto Plasma Unit, Diener Electronic, Germany) and bonded onto a glass slide. Post-bonding baking in an oven at 75 °C for 30 min increased the bonding strength and resulted in a device ready for use. For the flow focus design used in our experiments, the width of nozzle is about 15 μm and the width and length of channel after the nozzle are 100 and 4000 μm, respectively. The depth of all the channels is 25 μm.
1) copy of this silicon master was cross-linked at 75 °C for 1 h. Afterwards, access holes were punched into the PDMS copy, which was then given O2 plasma treatment (100 W, O2 pressure 0.5 mbar, 1 min, Zepto Plasma Unit, Diener Electronic, Germany) and bonded onto a glass slide. Post-bonding baking in an oven at 75 °C for 30 min increased the bonding strength and resulted in a device ready for use. For the flow focus design used in our experiments, the width of nozzle is about 15 μm and the width and length of channel after the nozzle are 100 and 4000 μm, respectively. The depth of all the channels is 25 μm.
Thermal characterisation of the liquid crystals
The phase behaviour of the LC chiral mixtures was studied by differential scanning calorimetry (DSC) using a TA Instruments Q20 differential scanning calorimeter equipped with an AQ20 autosampler and a RCS90 refrigerated cooling system, calibrated by use of indium standards. The thermograms were obtained during heating and cooling scans at 10 °C min−1 with a 3 min isotherm between heating and cooling segments, under a nitrogen atmosphere. All samples were measured in duplicate. Transition temperatures and associated enthalpy changes were extracted from the third heat trace, and those listed in the ESI† are an average for both samples measured.Liquid crystal droplet production
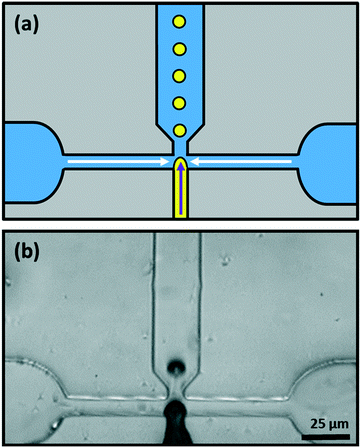
Monodisperse lipid-coated droplets (diameter either = 17 μm or 24 μm) were produced using a flow focus droplet microfluidic device.46 A schematic diagram of the droplet formation process in the device is shown in Fig. 5a. The droplet formation device had two inlets. One inlet supplied the two outer side channels, with buffer solution containing lipid in the form of small unilamellar liposomes. The middle inlet was used for the introduction of the LC. The LC and liposome solutions were pumped into the device through the two inlets using two PHD ULTRA advanced syringe pumps (Harvard Apparatus, USA). The flow rate used for LC droplet generation was 0.075 μL min−1 for LC and 10 μL min−1 for buffer with liposomes. The LC material entered the nozzle and was pinched-off by the buffer solution surrounding it due to shear force.35 Lipid vesicles in solution adsorbed and ruptured at the hydrophobic LC/water interface to form a monolayer on the surface, Fig. 5a and b.Polydisperse LC droplets were formed by using mechanical methods, as reported elsewhere,47 usually by deploying a combination of vortexing and agitation by hand. 2 μL of LC in 100 μL of continuous aqueous solution of lipids was enough to lead to a sufficiently dilute emulsion of LC droplets with minimal coalescence and a variety of droplet sizes.
Optical studies of surfactant-laden liquid crystal droplets
The LC droplets were suspended in aqueous solution and held between a glass microscope slide and a glass coverslip separated by a ∼400 μm deep polydimethylsiloxane (PDMS) well. To make the well, a PDMS thin film was formed by pouring 2 g of fully mixed elastomer and curing agent (weight ratio 10![[thin space (1/6-em)]](https://www.rsc.org/images/entities/char_2009.gif) :
:![[thin space (1/6-em)]](https://www.rsc.org/images/entities/char_2009.gif) 1) (Dow Corning Sylgard 184 kit) into a plastic Petri dish (100 mm in diameter) and leaving at room temperature for 48 h on a horizontal surface. Then, a piece of PDMS thin film (1.5 × 1.5 cm2) was cut from the PDMS film in the Petri dish. A hole of 9 mm in diameter was made using a homemade punch. The PDMS sheet was placed on the microscope slide. The LC droplet sample was deposited into the middle of the hole using a pipette, and the top was sealed with a coverslip (0.12 mm thick). Droplets were initially heated into the isotropic phase and then cooled to room temperature (25 °C) at 1 °C min−1. All subsequent studies were performed at room temperature except where stated. Optical characterization of the droplets was performed using a DM 2700 M (Leica Microsystems Ltd.) polarized light microscope equipped with a pair of linear polarizers and a Nikon D3000 camera, combined with a Linkam T95 Peltier hot stage. The fluorescence signal from the Texas Red-DHPE fluorophores included in the lipid layers was observed by using an epifluorescence microscope (Nikon Instruments Europe B. V., Kingston, UK) equipped with a Texas Red filter block. Fluorescence images were captured by using an Andor Zyla sCMOS camera (Oxford Instruments plc, UK).
1) (Dow Corning Sylgard 184 kit) into a plastic Petri dish (100 mm in diameter) and leaving at room temperature for 48 h on a horizontal surface. Then, a piece of PDMS thin film (1.5 × 1.5 cm2) was cut from the PDMS film in the Petri dish. A hole of 9 mm in diameter was made using a homemade punch. The PDMS sheet was placed on the microscope slide. The LC droplet sample was deposited into the middle of the hole using a pipette, and the top was sealed with a coverslip (0.12 mm thick). Droplets were initially heated into the isotropic phase and then cooled to room temperature (25 °C) at 1 °C min−1. All subsequent studies were performed at room temperature except where stated. Optical characterization of the droplets was performed using a DM 2700 M (Leica Microsystems Ltd.) polarized light microscope equipped with a pair of linear polarizers and a Nikon D3000 camera, combined with a Linkam T95 Peltier hot stage. The fluorescence signal from the Texas Red-DHPE fluorophores included in the lipid layers was observed by using an epifluorescence microscope (Nikon Instruments Europe B. V., Kingston, UK) equipped with a Texas Red filter block. Fluorescence images were captured by using an Andor Zyla sCMOS camera (Oxford Instruments plc, UK).
Results and discussion
Preparation of monodisperse chiral-doped LC droplets
Although we have made some use of LC droplets that were obtained by simply shaking a mixture of a LC and an aqueous solution of the surfactant (Fig. 6 and 11), most of the LC droplets were produced using a PDMS microfluidic device with a flow-focus configuration, Fig. 5.20,46 A schematic diagram of this device is shown in Fig. 5a and an image of the device in use is shown in Fig. 5b. The middle inlet channel was used to feed the LC to the pinch-off point where it meets the flow of the two channels either side that feed in aqueous solutions of PVA or of phospholipid liposomes (solution of liposomes ∼25–30 nm in diameter).48 Down-stream, the droplets formed at the nozzle become coated with PVA or with a lipid monolayer. This stabilizes the droplets and prevents them from coalescing with each other.There are several advantages in producing LC droplets using microfluidics, rather than by simply shaking or agitating a mixture of a LC and an aqueous solution of the surfactant. Firstly, the size of the droplets is easy to control by managing the flow-rates.20 Secondly, and more importantly, it produces droplets that are uniform in terms of their sizes. This monodisperse nature of the droplets is important in the present case because the director fields in chiral nematic droplets can be dependant on the ratio of the diameter to the chiral pitch. Also, as shown below, producing monodisperse droplets makes it possible to produce well-ordered colloidal crystal arrays. Furthermore, when droplets are produced by agitating a mixture of the LC and a solution of the surfactant, this not only produces an emulsion of LC in water but also an emulsion of water in LC; the LC droplets contain inclusions of small droplets of water that can affect their properties.22,49,50
Control of the director field in chiral-doped LC droplets
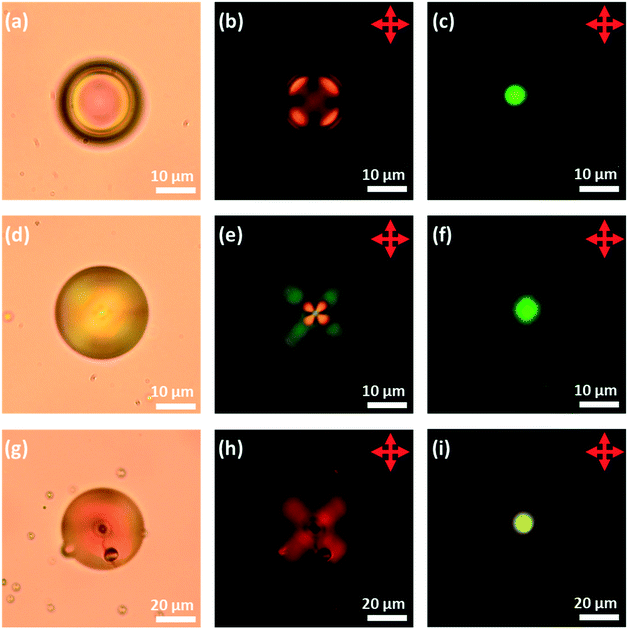
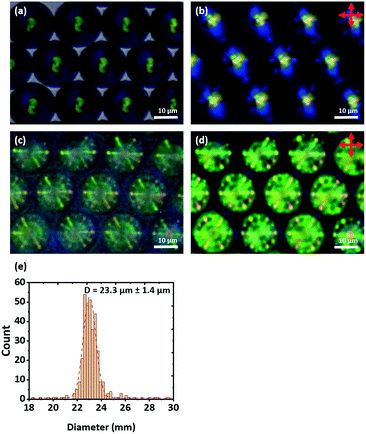
First, to obtain droplets with strong planar anchoring and a well-defined Frank–Pryce structure, a PVA coating was employed. The liquid crystals 5CB, 6CB, 7CB, E7 and S1011 were doped with sufficient S1011 to obtain a pitch giving a selective reflection in the yellow/green visible region of the spectrum. This could be done without significantly depressing the clearing point; the phase transitions of the LCs were found to be depressed by about 0.64 °C/wt%, corresponding to about 5 °C. It was also shown that, for these mixtures, between room temperature and the transition temperature, neither the wavelength of the reflected light nor the refractive indices of the LC changed significantly; the mean refractive index only changes by 0.01 across the whole temperature range. Room temperature, optical microscope images taken of isolated droplets of 5CB, 6CB and 7CB doped with S1011 and coated with PVA are shown in Fig. 6. These confirm that there is planar anchoring at the surface of the LC and that the droplets adopt the (expected) Frank–Pryce structure. In some of the bright-field transmission-mode images obtained, the s = 2 disclination line is clearly visible, Fig. 6g. When viewed in transmission between crossed polarizers, these droplets looked somewhat similar to non-chiral nematic droplets which have a radial director field, Fig. 6b, e and h. This is because the chiral nematic acts as a negative uniaxial material with the optic axis parallel to the helical axis, thereby giving a simple Maltese cross pattern when aligned parallel to the transmitted light. However, these chiral droplets look very different to non-chiral droplets when they are observed in reflection-mode. Each of them shows a single bright coloured reflected spot (a bullseye) in its centre, Fig. 6c, f and i.Since the droplets that were prepared using microfluidics were monodisperse, it was found that, for a high enough concentration, they tended to form well-ordered hexagonal monolayers, Fig. 7 and 8. When viewed in reflection-mode, although the isolated droplets of E7 doped with S1011 showed a single green bullseye in their centre, the optical properties of this hexagonal array of droplets are much more complex. This is because of photonic cross-communication between close-neighbour droplets. The way in which the various colours and patterns shown in Fig. 7c and d arise has been discussed in detail by Noh et al.51 Similar hexagonal arrays could also be produced for droplets of 5CB, 6CB and 7CB doped with of S1011.
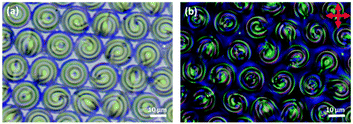 | ||
| Fig. 8 A monolayer of PVA coated 5CB droplets doped with 0.53 wt% of S1011 produced microfluidically. (a) Bright field transmission-mode image and (b) transmission-mode image with crossed polarizers. | ||
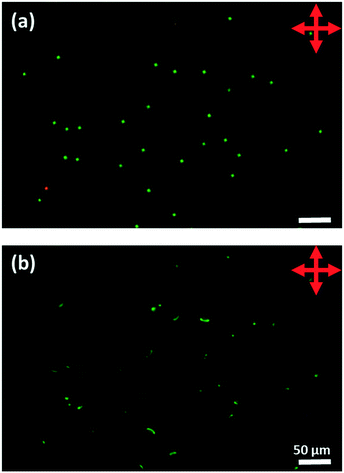
When the level of the chiral dopant is reduced approximately ten-fold (to obtain droplets in which the isoclines become visible) the presence of the dopant has almost no effect on the clearing temperature of the LC. Because of the much longer pitch, the repeating chiral structure within the Frank–Pryce structure can be resolved and easily seen using bright-field transmission-mode microscopy, Fig. 8. On heating the droplet solution, the Frank–Pryce structure becomes disordered and eventually there is a transition into the isotropic phase. On cooling back from isotropic phase, the well-ordered Frank–Pryce structure re-appears. The monodispersity of the droplets obtained for the sample shown in Fig. 8 was good (diameters 17.7 ± 0.5 μm) and, once again, hexagonal close-packed monolayers could be obtained, Fig. 8. However, because of the much longer pitch, there is no visible photonic cross-communication between droplets. The isoclines are resolved and can be clearly seen in Fig. 8. For some of the droplets (depending on their orientation) the s = 2 disclination line is also clearly visible.
These experiments using a PVA-coating, established that it is possible to prepare monodisperse Frank–Pryce droplets and to prepare well-ordered monolayers. However, PVA-coated droplets are unlikely to be useful in sensor applications and so equivalent droplets with phospholipid coatings were also investigated. Our previous work had established that director fields in non-chiral nematic LC droplets could be controlled either through choice of the LC or through choice of the phospholipid.22 Hence, when 5CB, 6CB and 7CB coated with 1![[thin space (1/6-em)]](https://www.rsc.org/images/entities/char_2009.gif) :
:![[thin space (1/6-em)]](https://www.rsc.org/images/entities/char_2009.gif) 1 DOPC
1 DOPC![[thin space (1/6-em)]](https://www.rsc.org/images/entities/char_2009.gif) :
:![[thin space (1/6-em)]](https://www.rsc.org/images/entities/char_2009.gif) DOPG or DnPdPC or MFPC perpendicular anchoring is observed (there is a radial director field, Fig. 1a) but when the coating is DFPC, it is planar (there is a bipolar director field, Fig. 1b). DFPC has two bulky terminal ferrocenyl residues at the ends of the acyl chains, which are expected to make interdigitation of the LC into the lipid chains more difficult. Perhaps for this reason, the usual preference for perpendicular anchoring is suppressed. Planar anchoring can also be achieved by changing the choice of LC to MLC7023 coated with DOPC
DOPG or DnPdPC or MFPC perpendicular anchoring is observed (there is a radial director field, Fig. 1a) but when the coating is DFPC, it is planar (there is a bipolar director field, Fig. 1b). DFPC has two bulky terminal ferrocenyl residues at the ends of the acyl chains, which are expected to make interdigitation of the LC into the lipid chains more difficult. Perhaps for this reason, the usual preference for perpendicular anchoring is suppressed. Planar anchoring can also be achieved by changing the choice of LC to MLC7023 coated with DOPC![[thin space (1/6-em)]](https://www.rsc.org/images/entities/char_2009.gif) :
:![[thin space (1/6-em)]](https://www.rsc.org/images/entities/char_2009.gif) DOPG. It has been shown for non-chiral LCs, that, for this system, anchoring is planar (there is a bipolar director field, Fig. 1b). This ability to reverse the normal anchoring of LCs on phospholipid monolayers is important for potential sensor applications. Potentially, a major problem in using phospholipid-coated droplets is that, for most LC/lipid combinations perpendicular anchoring is very strong and a very strong preference for this mode of anchoring creates difficulties in switching the anchoring to planar. Hence, it is important to demonstrate that, as in the non-chiral droplets, planar anchoring can also be achieved for these phospholipid-coated droplets. This was found to be the case and crucially anchoring in the chiral-doped LC droplets could be controlled in exactly the same way as in the case of their non-chiral counterparts. Fig. 9 shows isolated droplets of 5CB doped with ∼7.3 wt% of S1011 and the effect of changing the phospholipid monolayer (DOPC
DOPG. It has been shown for non-chiral LCs, that, for this system, anchoring is planar (there is a bipolar director field, Fig. 1b). This ability to reverse the normal anchoring of LCs on phospholipid monolayers is important for potential sensor applications. Potentially, a major problem in using phospholipid-coated droplets is that, for most LC/lipid combinations perpendicular anchoring is very strong and a very strong preference for this mode of anchoring creates difficulties in switching the anchoring to planar. Hence, it is important to demonstrate that, as in the non-chiral droplets, planar anchoring can also be achieved for these phospholipid-coated droplets. This was found to be the case and crucially anchoring in the chiral-doped LC droplets could be controlled in exactly the same way as in the case of their non-chiral counterparts. Fig. 9 shows isolated droplets of 5CB doped with ∼7.3 wt% of S1011 and the effect of changing the phospholipid monolayer (DOPC![[thin space (1/6-em)]](https://www.rsc.org/images/entities/char_2009.gif) :
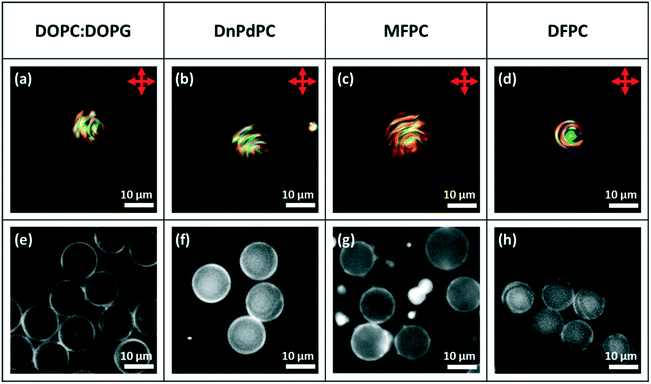
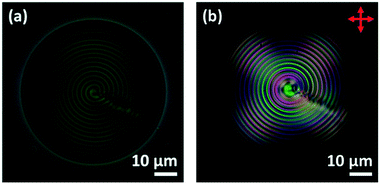
:![[thin space (1/6-em)]](https://www.rsc.org/images/entities/char_2009.gif) DOPG, DnPdPC MFPC or DFPC). In each case, to help establish that a lipid monolayer had formed, a small percentage of Texas Red-DHPE was added to the lipid. The fluorescence microscopy images of the droplets, Fig. 9e–h, show a fairly uniform bright ring around each droplet, confirming that this is indeed the case. In agreement with the previous findings for non-chiral nematic LC droplets, only the droplets coated with DFPC, showed planar anchoring and a Frank–Pryce director field Fig. 9a, and only in this case was a simple Maltese cross observed using transmission-mode microscopy between crossed polarizers. The other three lipids all promote strong perpendicular anchoring at the surface disfavouring a Frank–Pryce director field. In these cases, as expected, the observed textures are more complex, Fig. 9b–d. In the case of the MFPC droplets we found that the samples were ‘contaminated’ with very small highly fluorescent droplets; presumably excess liposomes that could not be removed. In the case of 5CB doped with 0.53 wt% S1011 a similar dependence of anchoring on the choice of LC was observed but, because the pitch is longer than the wavelength of the light, the distinction between Frank–Pryce and non-Frank–Pryce structures can be seen more directly, Fig. 10. Only the DFPC-coated droplets show a Frank–Pryce director field, Fig. 10d. The lipids MFPC, DnPdPC and DOPC
DOPG, DnPdPC MFPC or DFPC). In each case, to help establish that a lipid monolayer had formed, a small percentage of Texas Red-DHPE was added to the lipid. The fluorescence microscopy images of the droplets, Fig. 9e–h, show a fairly uniform bright ring around each droplet, confirming that this is indeed the case. In agreement with the previous findings for non-chiral nematic LC droplets, only the droplets coated with DFPC, showed planar anchoring and a Frank–Pryce director field Fig. 9a, and only in this case was a simple Maltese cross observed using transmission-mode microscopy between crossed polarizers. The other three lipids all promote strong perpendicular anchoring at the surface disfavouring a Frank–Pryce director field. In these cases, as expected, the observed textures are more complex, Fig. 9b–d. In the case of the MFPC droplets we found that the samples were ‘contaminated’ with very small highly fluorescent droplets; presumably excess liposomes that could not be removed. In the case of 5CB doped with 0.53 wt% S1011 a similar dependence of anchoring on the choice of LC was observed but, because the pitch is longer than the wavelength of the light, the distinction between Frank–Pryce and non-Frank–Pryce structures can be seen more directly, Fig. 10. Only the DFPC-coated droplets show a Frank–Pryce director field, Fig. 10d. The lipids MFPC, DnPdPC and DOPC![[thin space (1/6-em)]](https://www.rsc.org/images/entities/char_2009.gif) :
:![[thin space (1/6-em)]](https://www.rsc.org/images/entities/char_2009.gif) DOPG all promote perpendicular anchoring, giving a ‘nested-cup’ structure. With surfactants such as phospholipids it is known that the strength of anchoring and the stability of the droplets is dependant on the concentration of surfactant in the surrounding medium.2 If the concentration is too low, variable anchoring results are obtained and the droplets are unstable; they fuse with each other and with the walls of the container. Based on our previous work we have standardised on phospholipid concentrations that avoid these problems. In cases where the phospholipid concentration is too low we find that the ring observed in flurorescence studies is non-uniform. However, all four of the lipids give a uniform coating in this case, as shown in the fluorescence microscopy images, Fig. 10e–h, but, as before there were issues for the MFPC droplets where we found that the samples were ‘contaminated’ with very small highly fluorescent droplets that could not be removed.
DOPG all promote perpendicular anchoring, giving a ‘nested-cup’ structure. With surfactants such as phospholipids it is known that the strength of anchoring and the stability of the droplets is dependant on the concentration of surfactant in the surrounding medium.2 If the concentration is too low, variable anchoring results are obtained and the droplets are unstable; they fuse with each other and with the walls of the container. Based on our previous work we have standardised on phospholipid concentrations that avoid these problems. In cases where the phospholipid concentration is too low we find that the ring observed in flurorescence studies is non-uniform. However, all four of the lipids give a uniform coating in this case, as shown in the fluorescence microscopy images, Fig. 10e–h, but, as before there were issues for the MFPC droplets where we found that the samples were ‘contaminated’ with very small highly fluorescent droplets that could not be removed.
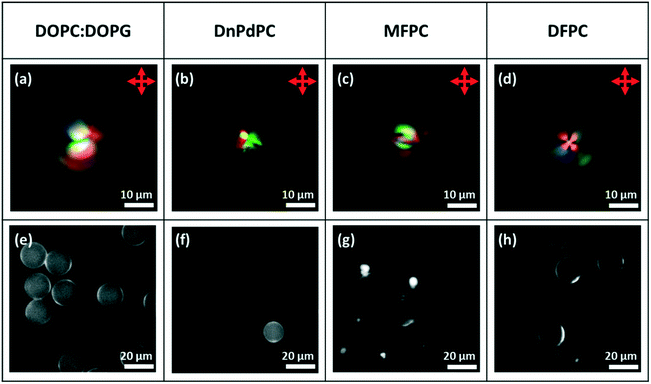 | ||
| Fig. 9 Microfluidically produced 5CB droplets doped with ∼7.3 wt% of S1011 and coated with the lipid surfactant type detailed in the top row. (a)–(d) Transmission-mode images between crossed polarizers; (e)–(h) fluorescence images.22 | ||
Hence, using these 5CB-based droplets, it is possible to control the director field using custom designed lipids in exactly the same way as for their non-chiral counterparts. At least qualitatively, the presence of the chiral dopant has no significant effect on the sign of the surface anchoring. However, there were problems in using the DFPC coated droplets in switching studies. Although the droplets coated with 1![[thin space (1/6-em)]](https://www.rsc.org/images/entities/char_2009.gif) :
:![[thin space (1/6-em)]](https://www.rsc.org/images/entities/char_2009.gif) 1 DOPC
1 DOPC![[thin space (1/6-em)]](https://www.rsc.org/images/entities/char_2009.gif) :
:![[thin space (1/6-em)]](https://www.rsc.org/images/entities/char_2009.gif) DOPG were stable, after a few days, the MFPC and DFPC droplets began to coalesce and imaging using fluorescence microscopy showed that fluorescent ‘pockets’ had developed in the layer around each droplet. Because of these issues of stability for the DFPC coated 5CB-based droplets, attention was switched to an alternative method of controlling the surface alignment: control through the choice of the LC rather than through the choice of the phospholipid. Once again it was found that the results for the chiral-doped droplets paralleled those for their non-chiral counterparts.22 Hence, droplets of MLC7023 doped with S1011 or R5011 and coated with 1
DOPG were stable, after a few days, the MFPC and DFPC droplets began to coalesce and imaging using fluorescence microscopy showed that fluorescent ‘pockets’ had developed in the layer around each droplet. Because of these issues of stability for the DFPC coated 5CB-based droplets, attention was switched to an alternative method of controlling the surface alignment: control through the choice of the LC rather than through the choice of the phospholipid. Once again it was found that the results for the chiral-doped droplets paralleled those for their non-chiral counterparts.22 Hence, droplets of MLC7023 doped with S1011 or R5011 and coated with 1![[thin space (1/6-em)]](https://www.rsc.org/images/entities/char_2009.gif) :
:![[thin space (1/6-em)]](https://www.rsc.org/images/entities/char_2009.gif) 1 DOPC
1 DOPC![[thin space (1/6-em)]](https://www.rsc.org/images/entities/char_2009.gif) :
:![[thin space (1/6-em)]](https://www.rsc.org/images/entities/char_2009.gif) DOPG showed planar anchoring and a Frank–Pryce director field. These droplets were much more stable and practicable to use in studies of switching of the director field. Overall, the results of these studies are summarised in Table 1. These show the same alignment as previously reported for achiral systems by Paterson et al.22 and that the effect of changing either the lipid or the LC can be explained in the same way.
DOPG showed planar anchoring and a Frank–Pryce director field. These droplets were much more stable and practicable to use in studies of switching of the director field. Overall, the results of these studies are summarised in Table 1. These show the same alignment as previously reported for achiral systems by Paterson et al.22 and that the effect of changing either the lipid or the LC can be explained in the same way.
| Material | PVA | SDS | DOPC![[thin space (1/6-em)]](https://www.rsc.org/images/entities/char_2009.gif) : :![[thin space (1/6-em)]](https://www.rsc.org/images/entities/char_2009.gif) DOPG DOPG |
DnPdPC | MFPC | DFPC |
|---|---|---|---|---|---|---|
| a Chirally doped LC droplets from this piece of work. b Undroped droplets from previous studies. c Predominantly perpendicular aligned droplets from previous studies.22 | ||||||
| E7 | Planara | — | Perpendicularb | Perpendicularb | Perpendicularb | Perpendicularb |
| 5CB | Planara | — | Perpendiculara,b | Perpendiculara,b | Perpendiculara,c | Planara,b |
| 6CB | Planara | — | Perpendicularb | Perpendicularb | Perpendicularb | Planarb |
| 7CB | Planara | — | — | — | — | — |
| MLC7023 | Planara | Perpendiculara | Planara,b | Planarb | Planarb | Planarb |
Analyte switching of the director field in chiral-doped LC droplets
In the studies of the switching of the surface anchoring and of the director fields in chiral doped droplets; MLC7023 doped with 0.53 wt% S1011 coated with 1![[thin space (1/6-em)]](https://www.rsc.org/images/entities/char_2009.gif) :
:![[thin space (1/6-em)]](https://www.rsc.org/images/entities/char_2009.gif) 1 DOPC
1 DOPC![[thin space (1/6-em)]](https://www.rsc.org/images/entities/char_2009.gif) :
:![[thin space (1/6-em)]](https://www.rsc.org/images/entities/char_2009.gif) DOPG was used. This gives a long enough pitch to be directly observed using transmission mode microscopy and so it enables the evolution of the director field during the switching process to be observed in a direct manner. However, for the studies of the effect of switching on the optical properties of the system, using the chiral dopant S1011 at the much higher concentrations needed to give reflection of visible light was not possible because of the solubility limit of S1011 in MLC7023. Hence, for these studies, attention was switched to R5011, a chiral dopant with a higher helical twisting power, where lower concentrations are required and for which solubility in MLC7023 is not an issue.
DOPG was used. This gives a long enough pitch to be directly observed using transmission mode microscopy and so it enables the evolution of the director field during the switching process to be observed in a direct manner. However, for the studies of the effect of switching on the optical properties of the system, using the chiral dopant S1011 at the much higher concentrations needed to give reflection of visible light was not possible because of the solubility limit of S1011 in MLC7023. Hence, for these studies, attention was switched to R5011, a chiral dopant with a higher helical twisting power, where lower concentrations are required and for which solubility in MLC7023 is not an issue.
Fig. 11 shows typical images of Frank–Pryce droplets of MLC7023 doped with 0.53% S1011 coated with 1![[thin space (1/6-em)]](https://www.rsc.org/images/entities/char_2009.gif) :
:![[thin space (1/6-em)]](https://www.rsc.org/images/entities/char_2009.gif) 1 DOPC
1 DOPC![[thin space (1/6-em)]](https://www.rsc.org/images/entities/char_2009.gif) :
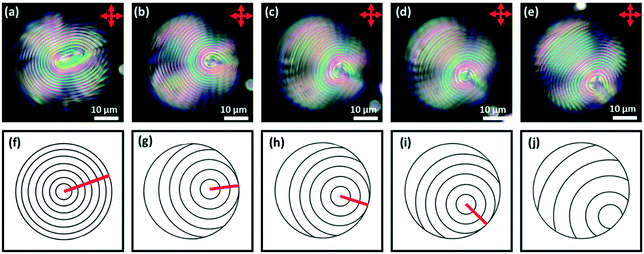
:![[thin space (1/6-em)]](https://www.rsc.org/images/entities/char_2009.gif) DOPG having planar anchoring at the lipid interface. When the droplets are imaged by transmission-mode microscopy, and SDS is then added to replace the phospholipid and promote perpendicular anchoring, the director field evolves as shown in the top row of Fig. 12; it evolves through a series of ‘nested cup’ structures analogous to those shown in Fig. 1i, j, l and m. The switching processes shown as a series of still images in the top row of Fig. 12 can be viewed as a video in the ESI,† SV1.
DOPG having planar anchoring at the lipid interface. When the droplets are imaged by transmission-mode microscopy, and SDS is then added to replace the phospholipid and promote perpendicular anchoring, the director field evolves as shown in the top row of Fig. 12; it evolves through a series of ‘nested cup’ structures analogous to those shown in Fig. 1i, j, l and m. The switching processes shown as a series of still images in the top row of Fig. 12 can be viewed as a video in the ESI,† SV1.
The experiment was repeated using MLC7023 doped with 1.9 wt% R5011 (439 nm) coated with 1![[thin space (1/6-em)]](https://www.rsc.org/images/entities/char_2009.gif) :
:![[thin space (1/6-em)]](https://www.rsc.org/images/entities/char_2009.gif) 1 DOPC
1 DOPC![[thin space (1/6-em)]](https://www.rsc.org/images/entities/char_2009.gif) :
:![[thin space (1/6-em)]](https://www.rsc.org/images/entities/char_2009.gif) DOPG so that the effect on the optical properties of droplets that have a helical pitch comparable to that of visible light could also be studied. As shown in Fig. 13a–e, when the droplets are imaged using reflectance mode spectroscopy, what is initially observed is the typical, symmetrical bullseye. After SDS is added, and as switching progresses, this reflecting spot moves away from the centre of the droplet. As shown in Fig. 14, before the SDS is added the intensity of the reflected green light from the droplet is essentially constant; (other than the disclination line) the structure is symmetrical and its properties are essentially independant of its tumbling motion in the solution. However, after switching, the reflected light is found to vary strongly as the droplet tumbles in solution; it depends on the direction in which the ‘flashlight’ is pointing. For this system it was shown that the Frank–Pryce structure could be re-established, the structure could be switched back again by adding PVA and that it could be switched back again to a structure equivalent to that in Fig. 1j and m by adding a further amount of SDS; i.e. the process is fully reversible. The switching processes shown as a series of still images in Fig. 13 can also be viewed as a video in the ESI,† SV2.
DOPG so that the effect on the optical properties of droplets that have a helical pitch comparable to that of visible light could also be studied. As shown in Fig. 13a–e, when the droplets are imaged using reflectance mode spectroscopy, what is initially observed is the typical, symmetrical bullseye. After SDS is added, and as switching progresses, this reflecting spot moves away from the centre of the droplet. As shown in Fig. 14, before the SDS is added the intensity of the reflected green light from the droplet is essentially constant; (other than the disclination line) the structure is symmetrical and its properties are essentially independant of its tumbling motion in the solution. However, after switching, the reflected light is found to vary strongly as the droplet tumbles in solution; it depends on the direction in which the ‘flashlight’ is pointing. For this system it was shown that the Frank–Pryce structure could be re-established, the structure could be switched back again by adding PVA and that it could be switched back again to a structure equivalent to that in Fig. 1j and m by adding a further amount of SDS; i.e. the process is fully reversible. The switching processes shown as a series of still images in Fig. 13 can also be viewed as a video in the ESI,† SV2.
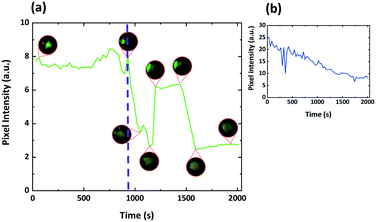 | ||
| Fig. 14 (a) Green pixel intensity data for the series of droplet stills in Fig. 13 and SV2.† Insets show actual droplet appearance between crossed polarizers at the indicated time stamps. The purple dashed line indicates the point at which the droplet alignment changes from planar to perpendicular. It is clear the tumbling motion of the droplet in solution has a much greater effect once the alignment has switched. (b) Shows data averaged over 30 droplets. Not all droplets switch at the same time and the stepwise elements of the response begin to be averaged out leading to the response shown. | ||
Because, after switching to perpendicular anchoring, the optical properties depend on the rotational state of the droplet, and because no sensor would be based on a single droplet, what is more relevant is the behaviour of a system containing many droplets averaged over time and space. Fig. 15 shows such results obtained by switching a number of droplets of MLC7023 doped with 1.9 wt% R5011 and coated with 1![[thin space (1/6-em)]](https://www.rsc.org/images/entities/char_2009.gif) :
:![[thin space (1/6-em)]](https://www.rsc.org/images/entities/char_2009.gif) 1 DOPC
1 DOPC![[thin space (1/6-em)]](https://www.rsc.org/images/entities/char_2009.gif) :
:![[thin space (1/6-em)]](https://www.rsc.org/images/entities/char_2009.gif) DOPG starting with planar anchoring and a Frank–Pryce/bullseye structure, and ending with structures with ‘perpendicular’ anchoring, Fig. 14. A video showing this switching process can also be viewed in the ESI,† video SV3. Note that, whereas for a single droplet the switching occurs over a relatively short timeframe, within an array of droplets they do not all switch at the same time. As a result the change in the optical properties is more continuous in nature.30 This is shown in the inset in Fig. 14. The period over which this change occurs will be dependant on the concentration of analyte and the kinetics of this type of response has been characterised previously.20 There may be some change in the wavelength or spread of wavelengths of the reflected light but, much more marked is the change in intensity. This can be understood in terms of the nested cup structure. As shown in Fig. 13, 14 and 16, for the Frank–Pryce structure reflection is independent of tumbling motions of the droplets in solution. The bullseye arises because only reflections from helical axes (almost) parallel to the incident light are observed. However, for the nested cup structures there is only strong reflection when the defect is on the opposite side of the droplet to the observer and in most cases this results in an off-centre reflective spot, Fig. 16e and f; since this is where the helical axes are roughly parallel to the incident beam. When the defect is on the same side as the observer, both the light entering the droplet and the reflected component (the only component involving helical axes parallel to the incident beam) must pass through the defect itself; through a region which is strongly scattering and there is only a weak, diffuse reflection. Hence, for an individual droplet, as it tumbles in solution the intensity of the reflected light shows step-like behaviour, Fig. 14; the flashlight goes on and off as the defect moves from the back to the front of the droplet. If switching were to an equatorial director field it is expected, on the basis of this argument, that there would be very low diffuse reflectivity.
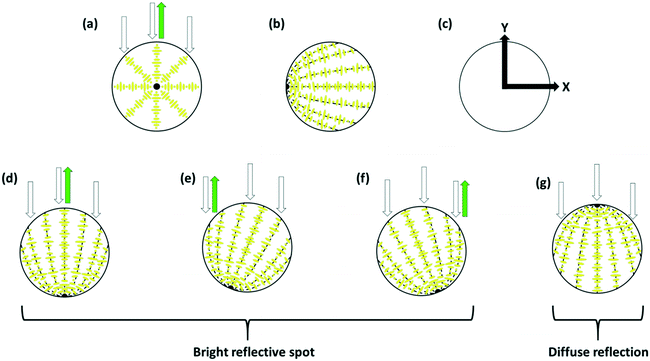
DOPG starting with planar anchoring and a Frank–Pryce/bullseye structure, and ending with structures with ‘perpendicular’ anchoring, Fig. 14. A video showing this switching process can also be viewed in the ESI,† video SV3. Note that, whereas for a single droplet the switching occurs over a relatively short timeframe, within an array of droplets they do not all switch at the same time. As a result the change in the optical properties is more continuous in nature.30 This is shown in the inset in Fig. 14. The period over which this change occurs will be dependant on the concentration of analyte and the kinetics of this type of response has been characterised previously.20 There may be some change in the wavelength or spread of wavelengths of the reflected light but, much more marked is the change in intensity. This can be understood in terms of the nested cup structure. As shown in Fig. 13, 14 and 16, for the Frank–Pryce structure reflection is independent of tumbling motions of the droplets in solution. The bullseye arises because only reflections from helical axes (almost) parallel to the incident light are observed. However, for the nested cup structures there is only strong reflection when the defect is on the opposite side of the droplet to the observer and in most cases this results in an off-centre reflective spot, Fig. 16e and f; since this is where the helical axes are roughly parallel to the incident beam. When the defect is on the same side as the observer, both the light entering the droplet and the reflected component (the only component involving helical axes parallel to the incident beam) must pass through the defect itself; through a region which is strongly scattering and there is only a weak, diffuse reflection. Hence, for an individual droplet, as it tumbles in solution the intensity of the reflected light shows step-like behaviour, Fig. 14; the flashlight goes on and off as the defect moves from the back to the front of the droplet. If switching were to an equatorial director field it is expected, on the basis of this argument, that there would be very low diffuse reflectivity.
When observing many droplets they do not all switch at the same time. The result is a sigmoidal dependence of the optical response with time, the form of which is dependant on the concentration of the analyte.20 However, with a sufficiently large number of droplets the fluctuations due to tumbling motions disappears. As shown in the inset in Fig. 14, even for just 30 droplets most of the fluctuations are lost.
Conclusion
It is important to be able to control the surface anchoring properties, particularly for the phospholipid-coated LC droplets (droplets of the type relevant to the creation of biosensors). This is because, for most LC/phospholipid combinations, the phospholipid monolayer promotes such strong perpendicular anchoring that switching of the anchoring to planar, and the subsequent reorientation of the director field, is rather difficult. We have previously shown that judicious choice of either the LC or of the phospholipid enables this usual tendency towards strong perpendicular anchoring to be overcome. Here, the effect of these two components on the sign of the alignment is shown not to be noticeably affected by the presence of a chiral dopant and the results obtained for these chiral droplets follow those we previously obtained for their non-chiral counterparts. However, with chiral doped LC droplets, the ability to switch between highly reflective Frank–Pryce structures with planar anchoring and lower reflective structures with perpendicular anchoring suggests that they will prove much more useful in creating practicable sensor systems due to the strong optical signature associated with the change in director field. For single Frank–Pryce droplets with planar surface anchoring the intensity of the reflected light is essentially independent of the tumbling motion of the droplet in solution. However, when the surface anchoring is switched to perpendicular the intensity of the reflected light becomes dependant on the orientation. Although these effects have not yet been optimised, they suggest that chiral droplets could be used to create LC-based sensors analogous to LC thermometers; devices that are relatively cheap and disposable. In this respect, ongoing work has demonstrated that such droplets can be immobilized in films of hydrogel and further details of these immobilised systems will be published later. In more concentrated films than those described in this paper, in films where (it is hoped that) changes could be detected by the human eye, the effect of photonic crosstalk will become a much more significant factor. This component of the reflected light depends not only on the concentration of the droplets but also on the nature of their ordering.Author contributions
Experimental work was performed by D. A. P., X. D., P. B., and A. A. P. Analysis and interpretation was conducted by D. A. P, R. J. B., J. C. J., and H. F. G. The overall project coordinators are R. J. B., S. D. E., and H. F. G. All authors contributed to the writing of the manuscript.Conflicts of interest
There are no conflicts to declare.Acknowledgements
The authors would like to thank Merck Group, UK for providing materials S1011, R5011 and MLC7023. The authors gratefully acknowledge the financial support from EPSRC with grant no: EP/P024041/1. JCJ is supported from EPSRC for a Fellowship in Manufacturing EP/S029214/1. SDE is also supported by Health Services and Delivery Research Programme, Grant/Award Number: MIC-2016-004 and MRC: MR/M009084/1. SAP, RJB, and SDE also wish to acknowledge support from the EPSRC EP/EP/P023266/1. XD and DL gratefully acknowledge the finance support of the Natural National Science Foundation of China (NSFC) (61875081) and the Shenzhen Science and Technology Innovation Commission (JCYJ20180305180700747).References
- D. Wang, S.-Y. Park and I.-K. Kang, J. Mater. Chem. C, 2015, 3, 9038–9047 RSC.
- D. S. Miller, X. Wang and N. L. Abbott, Chem. Mater., 2014, 26, 496–506 CrossRef CAS PubMed.
- S. Yang, C. Wu, H. Tan, Y. Wu, S. Liao, Z. Wu, G. Shen and R. Yu, Anal. Chem., 2013, 85, 14–18 CrossRef CAS PubMed.
- D. Zhao, Y. Peng, L. Xu, W. Zhou, Q. Wang and L. Guo, ACS Appl. Mater. Interfaces, 2015, 7, 23418–23422 CrossRef CAS PubMed.
- H. Tan, X. Li, S. Liao, R. Yu and Z. Wu, Biosens. Bioelectron., 2014, 62, 84–89 CrossRef CAS PubMed.
- S. E. Jäntti, M. Kivilompolo, L. Öhrnberg, K. H. Pietiläinen, H. Nygren, M. Orešič and T. Hyötyläinen, Anal. Bioanal. Chem., 2014, 30, 7799–7815 CrossRef PubMed.
- J. Deng, W. Liang and J. Fang, ACS Appl. Mater. Interfaces, 2016, 8, 3928–3932 CrossRef CAS PubMed.
- X. Niu, D. Luo, R. Chen, F. Wang, X. Sun and H. Dai, Opt. Commun., 2016, 381, 286–291 CrossRef CAS.
- I. C. Khoo, M.-J. Lee, Y.-C. Sung, Y.-C. Hsiao and W. Lee, SPIE Organic Photonics + Electronics, 2016, vol. 9940, pp. 99401–99406 Search PubMed.
- A. M. Lowe and N. L. Abbott, Chem. Mater., 2012, 24, 746–758 CrossRef CAS PubMed.
- C. Luan, H. Luan and D. Luo, Micromachines, 2020, 11, 176 CrossRef PubMed.
- R. J. Carlton, J. T. Hunter, D. S. Miller, R. Abbasi, P. C. Mushenheim, L. N. Tan and N. L. Abbott, Liq. Cryst. Rev., 2013, 1, 29–51 CrossRef CAS PubMed.
- R. Nandi and S. K. Pal, Analyst, 2018, 143, 1046–1052 RSC.
- C. Esteves, E. Ramou, A. R. P. Porteira, A. J. Moura Barbosa and A. C. A. Roque, Adv. Opt. Mater., 2020, 8, 1902117 CrossRef CAS PubMed.
- S. J. Woltman, G. D. Jay and G. P. Crawford, Nat. Mater., 2007, 6, 929–938 CrossRef CAS PubMed.
- Y. Xu, A. M. Rather, S. Song, J.-C. Fang, R. L. Dupont, U. I. Kara, Y. Chang, J. A. Paulson, R. Qin, X. Bao and X. Wang, Cell Rep. Phys. Sci., 2020, 1, 100276 CrossRef CAS PubMed.
- L. Tran, M. O. Lavrentovich, G. Durey, A. Darmon, M. F. Haase, N. Li, D. Lee, K. J. Stebe, R. D. Kamien and T. Lopez-Leon, Phys. Rev. X, 2017, 7, 041029 Search PubMed.
- M. Schwartz, G. Lenzini, Y. Geng, P. B. Rønne, P. Y. A. Ryan and J. P. F. Lagerwall, Adv. Mater., 2018, 30, 1707382 CrossRef PubMed.
- A. Sharma, D. Gupta, G. Scalia and J. P. F. Lagerwall, Phys. Rev. Res., 2022, 4, 013130 CrossRef.
- P. Bao, D. A. Paterson, P. L. Harrison, K. Miller, S. Peyman, J. C. Jones, J. A. T. Sandoe, S. D. Evans, R. J. Bushby and H. F. Gleeson, Lab Chip, 2019, 19, 1082–1089 RSC.
- P. Bao, D. A. Paterson, S. A. Peyman, J. C. Jones, J. A. T. Sandoe, R. J. Bushby, S. D. Evans and H. F. Gleeson, Crystals, 2021, 11, 65 CrossRef CAS.
- D. A. Paterson, P. Bao, R. H. Abou-Saleh, S. A. Peyman, J. C. Jones, J. A. T. Sandoe, S. D. Evans, H. F. Gleeson and R. J. Bushby, Langmuir, 2020, 36, 6436–6446 CrossRef CAS PubMed.
- S. L. Jiang, J. H. Noh, C. Park, A. D. Smith, N. L. Abbott and V. M. Zavala, Analyst, 2021, 146, 1224–1233 RSC.
- C. R. Smith, D. R. Sabatino and T. J. Praisner, Exp. Fluids, 2001, 30, 190–201 CrossRef CAS.
- A. Concellón, D. Fong and T. M. Swager, J. Am. Chem. Soc., 2021, 143, 9177–9182 CrossRef PubMed.
- S. A. Jones, J. Bailey, D. R. E. Walker, G. P. Bryan-Brown and J. C. Jones, Langmuir, 2018, 34, 10865–10873 CrossRef CAS PubMed.
- M. Sadati, H. Ramezani-Dakhel, W. Bu, E. Sevgen, Z. Liang, C. Erol, M. Rahimi, N. Taheri Qazvini, B. Lin, N. L. Abbott, B. T. Roux, M. L. Schlossman and J. J. de Pablo, J. Am. Chem. Soc., 2017, 139, 3841–3850 CrossRef CAS PubMed.
- H. Ramezani-Dakhel, M. Sadati, M. Rahimi, A. Ramirez-Hernandez, B. Roux and J. J. de Pablo, J. Chem. Theory Comput., 2017, 13, 237–244 CrossRef CAS PubMed.
- B. Alkhairalla, H. Allinson, N. Boden, S. D. Evans and J. R. Henderson, Phys. Rev. E, 1999, 59, 3033–3039 CrossRef CAS.
- J. K. Gupta, S. Sivakumar, F. Caruso and N. L. Abbott, Angew. Chem., Int. Ed., 2009, 48, 1652–1655 CrossRef CAS PubMed.
- S. Žumer and S. Kralj, Liq. Cryst., 1992, 12, 613–624 CrossRef.
- J. Jiang and D.-K. Yang, Liq. Cryst., 2017, 45, 102–111 CrossRef.
- T. Lopez-Leon and A. Fernandez-Nieves, Colloid Polym. Sci., 2011, 289, 345–359 CrossRef CAS.
- M. Urbanski, C. G. Reyes, J. Noh, A. Sharma, Y. Geng, V. S. R. Jampani and J. P. F. Lagerwall, J. Phys.: Condens. Matter, 2017, 29, 53 CrossRef PubMed.
- C. Robinson, J. C. Ward and R. B. Beevers, Discuss. Faraday Soc., 1958, 25, 29–42 RSC.
- P. Sleczkowski, Y. Zhou, S. Iamsaard, J. J. de Pablo, N. Katsonis and E. Lacaze, Proc. Natl. Acad. Sci. U. S. A., 2018, 115, 4334–4339 CrossRef CAS PubMed.
- G. Cipparrone, A. Mazzulla, A. Pane, R. J. Hernandez and R. Bartolino, Adv. Mater., 2011, 23, 5773–5778 CrossRef CAS PubMed.
- M. V. Kurik and O. D. Lavrentovich, JETP Lett., 1982, 35, 444–447 Search PubMed.
- H.-G. Lee, S. Munir and S.-Y. Park, ACS Appl. Mater. Interfaces, 2016, 8, 26407–26417 CrossRef CAS PubMed.
- T. Orlova, S. J. Aßhoff, T. Yamaguchi, N. Katsonis and E. Brasselet, Nat. Commun., 2015, 6, 7603 CrossRef PubMed.
- J. Pierron, V. Tournierlasserve, P. Sopena, A. Boudet, P. Sixou and M. Mitov, J. Phys. II, 1995, 5, 1635–1647 CrossRef CAS.
- Y. Bouligand and F. Livolant, J. Phys., 1984, 45, 1899–1923 CrossRef CAS.
- M. N. Krakhalev, A. P. Gardymova, A. V. Emel'yanenko, J. H. Liu and V. Y. Zyryanov, JETP Lett., 2017, 105, 51–54 CrossRef CAS.
- Y. Yang, PhD Thesis, University of Manchester, 2009 Search PubMed.
- M. Yu, Y. Jiang, Y. Shin, J. Jiang, H. Yang, H. Zhang, J. Xue, Q. Li and D.-K. Yang, Soft Matter, 2018, 14, 6530–6536 RSC.
- S.-K. Hsiung, C.-T. Chen and G.-B. Lee, J. Micromech. Microeng., 2006, 16, 2403–2410 CrossRef.
- X. Wang, E. Bukusoglu and N. L. Abbott, Chem. Mater., 2017, 29, 53–61 CrossRef CAS.
- P. Bao, M. R. Cheetham, J. S. Roth, A. C. Blakeston, R. J. Bushby and S. D. Evans, Anal. Chem., 2012, 84, 10702–10707 CrossRef CAS PubMed.
- N. V. Solodkov, J.-U. Shim and J. C. Jones, Nat. Commun., 2019, 10, 198 CrossRef PubMed.
- J.-K. Guo, S.-H. Hong, H.-J. Yoon, G. Babakhanova, O. D. Lavrentovich and J.-K. Song, Adv. Sci., 2019, 6, 1900785 CrossRef PubMed.
- J. Noh, H.-L. Liang, I. Drevensek-Olenik and J. P. F. Lagerwall, J. Mater. Chem. C, 2014, 2, 806–810 RSC.
Footnotes |
| † Electronic supplementary information (ESI) available. See DOI: 10.1039/d1me00189b |
| ‡ University repository for our metadata is: https://doi.org/10.5518/1115 |
| This journal is © The Royal Society of Chemistry 2022 |

