
 Open Access Article
 This Open Access Article is licensed under a Creative Commons Attribution-Non Commercial 3.0 Unported Licence
A beneficial combination of formic acid as a processing additive and fluoroethylene carbonate as an electrolyte additive for Li4Ti5O12 lithium-ion anodes†
Yun
Xu
ab,
Thomas
Diemant
ab,
Guk-Tae
Kim
ab,
Stefano
Passerini
 ab and
Dominic
Bresser
*ab
ab and
Dominic
Bresser
*ab
aHelmholtz Institute Ulm (HIU), Helmholtzstrasse 11, 89081 Ulm, Germany. E-mail: dominic.bresser@kit.edu
bKarlsruhe Institute of Technology (KIT), P.O. Box 3640, 76021 Karlsruhe, Germany
First published on 2nd November 2022
Abstract
The aqueous processing of lithium transition metal oxide active materials such as Li4Ti5O12 (LTO) into electrodes remains a challenge owing to the high reactivity of such materials in contact with water, resulting in a rapid pH increase, aluminum current collector corrosion, and inferior cycling stability. Herein, the addition of formic acid (FA) as an electrode slurry processing additive is investigated, including a variation of the mixing speed as an additional important parameter. Following the identification of suitable electrode preparation conditions, the effect of fluoroethylene carbonate (FEC) as an electrolyte additive is studied in half-cells and full-cells comprising a LiNi0.5Mn0.3Co0.2O2 (NMC532) based positive electrode. Owing to the beneficial impact of FEC on the solid electrolyte interphase (SEI) formed at the LTO|electrolyte interface, involving specifically the suppression of lithium salt decomposition, both the half-cells and the LTO‖NMC532 full-cells exhibit a superior performance, achieving a capacity retention of 84.3% and 64.1% after 5000 and 10![[thin space (1/6-em)]](https://www.rsc.org/images/entities/char_2009.gif) 000 cycles at 2C, respectively.
000 cycles at 2C, respectively.
Lithium-ion batteries (and batteries in general) are considered a key element towards the transition to renewable energy sources and, thus, a more sustainable future.1–4 The technology itself, however, has to become more sustainable as well.5 In this regard, the replacement of harmful N-methyl-2-pyrrolidone (NMP) and highly fluorinated polymer binders by water and bio-derived polymers provides an important step forward.6–8 While this has been successfully implemented already for graphite-based negative electrodes, the high reactivity of lithium transition metal oxides in contact with water, resulting in a degradation of the active material (surface), a rapid increase of the slurry pH value, aluminum current collector corrosion and inferior performance, remains a challenge.8–18 To address this, different acids such as phosphoric acid,19–26 hydrochloric acid,18 nitric acid,23 citric acid,20,27 acetic acid,28 formic acid,19 and polyacrylic acid28,29 were studied as processing additives to lower the pH and, thus, suppress the corrosion of the aluminum current collector, with the target to yield better mechanical stability of the resulting electrodes and enhanced cycling performance. While especially the use of phosphoric acid has shown exceptional improvement, not least owing to the formation of a thin lithium phosphate surface layer on the active material particles,19–26 an in-depth investigation of the combination with Li4Ti5O12 (LTO) revealed the formation of rod-shaped lithium (titanium) phosphate particles in this particular case.30
Accordingly, in the present study, the use of formic acid (FA) as an additive for the aqueous processing of LTO into electrodes was investigated, which has also been reported to enable enhanced cycling performance for LiNi0.33Mn0.33Co0.33O2 (NMC111)-based cathodes.19 Without the addition of FA, the LTO electrode slurry has a pH of 8.9 after 0.5 h of milling, which further increases to 10.6 after 2 h (Fig. S1a, ESI†), a pH value well within the aluminum corrosion regime31 as evidenced by the scanning electron microscopy (SEM) images presented in Fig. S1b (ESI†). When adding FA to the slurry, the pH is substantially lower in general, independent of the amount of FA and the milling speed (Fig. 1a). Nonetheless, also in this case the pH value increases upon ball milling and both parameters have an impact. When adding only 0.5FA (equivalent to 0.65 wt% of the mass of LTO) and applying a milling speed of 800 rpm, the pH value is generally the highest and increases from 6.1 after 0.5 h to 9.5 after 2 h, i.e., slightly within the aluminum corrosion regime, as reflected by minor holes in the electrode coating as a result of the corrosion-induced hydrogen evolution (Fig. 1b).20,28 Doubling the amount of FA as in 1FA results in a significantly lower pH value of 4.6 after 0.5 h and 7.0 after 2 h. This decrease in pH is less pronounced when increasing the milling speed from 800 rpm to 1100 rpm with 5.0 and 8.5 after 0.5 and 2 h, respectively. This is presumably due to a greater impact of the milling media on the LTO particles, forming more fresh sites for the reaction with water during milling. None of the two electrodes, however, reveal any corrosion of the aluminum current collector (Fig. 1c and d). Interestingly, though, the amount of lithium leached from the LTO particles increases with increasing amounts of FA and milling speed (Fig. S2, ESI†) in line with a previous study,19 indicating that FA favors lithium leaching – presumably accompanied by a Li+/H+ exchange, as the titanium cations can hardly be further oxidized to balance the charge loss. This greater lithium leaching, especially along with the higher ball-milling speed, results in the occurrence of significant particle cracking, as observed by SEM (Fig. S3, ESI†). The comparison of the XRD patterns does not provide any immediately apparent differences between the various electrodes (Fig. S4, ESI†). However, a more careful comparison of the XRD patterns and the intensity ratio of the single reflections reveals that it is changing slightly depending on the amount of FA added and the milling speed. The relative intensity ratio (I311/I400) of the (3,1,1) and (4,0,0) reflection, for instance, which has been reported to be an indicator for the location of the Li+ cations in the crystal structure,32 is decreasing in the order 0.5FA-800 rpm (0.78) > 1FA-800 rpm (0.75) > 1FA-1100 rpm (0.68). Yang et al.33 reported that a higher I311/I400 ratio would indicate a greater Li+ conductivity. This would mean that the conductivity decreases with a higher FA concentration and with a higher milling speed.
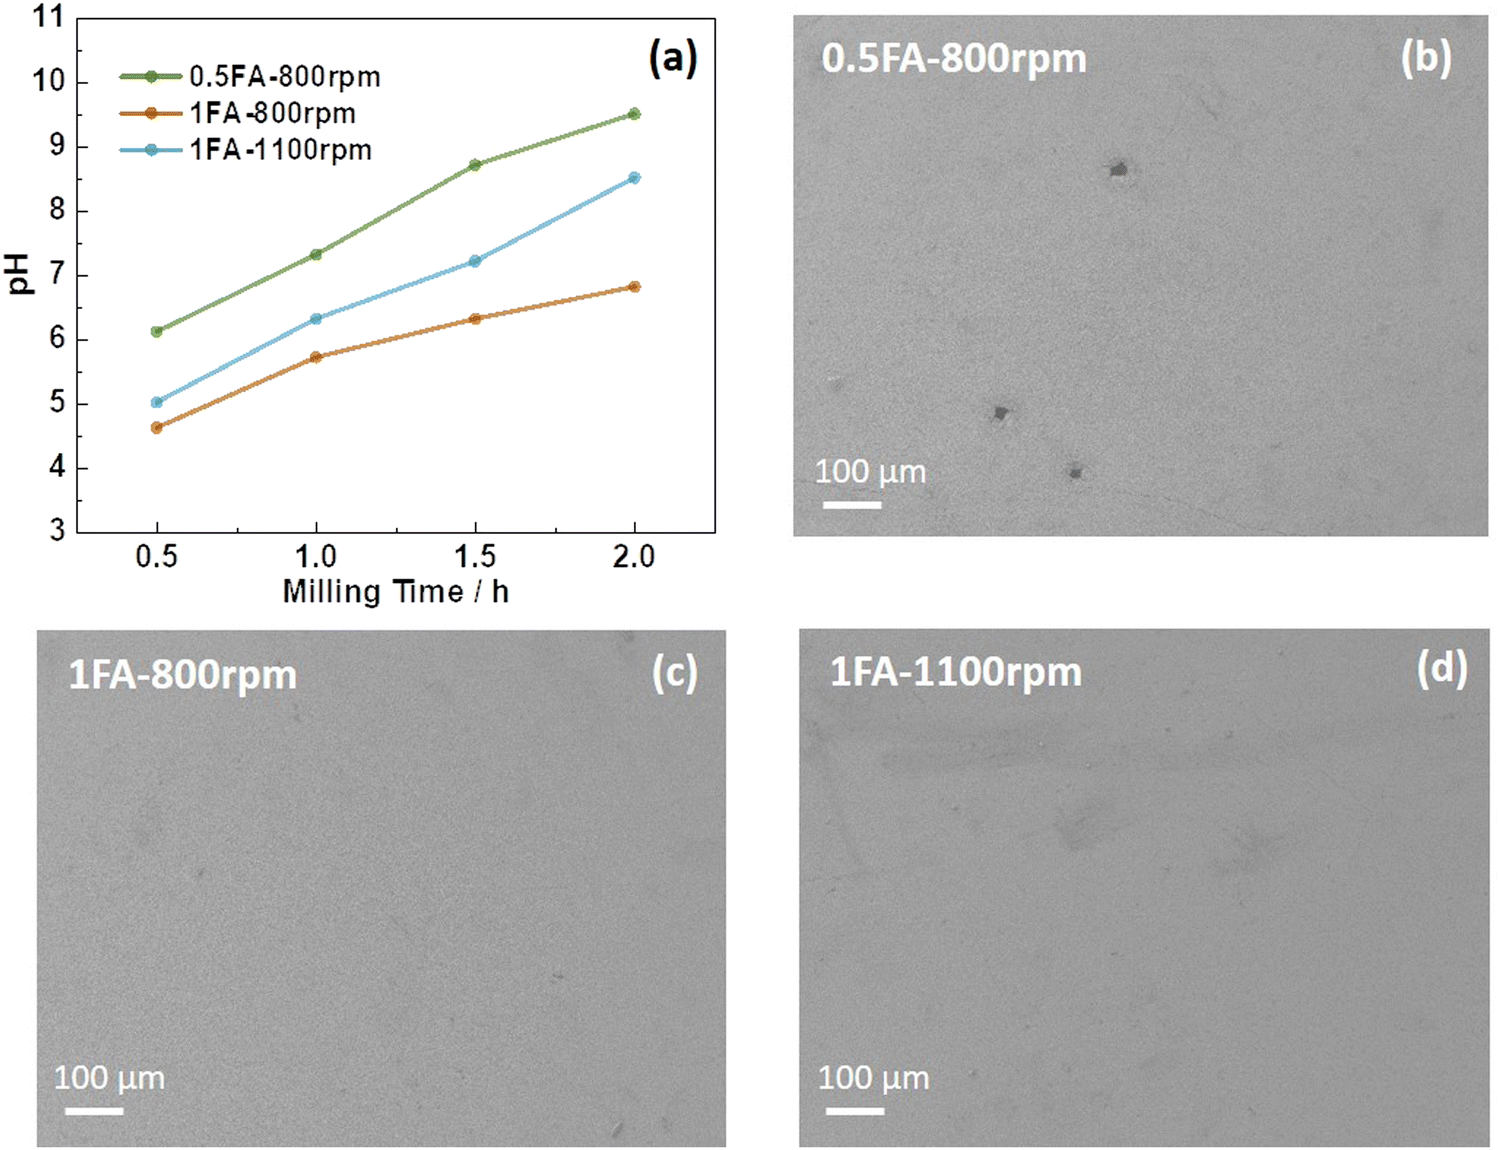 | ||
| Fig. 1 (a) Evolution of the pH value of the LTO electrode slurry in the presence of different amounts of FA (0.5FA vs. 1FA) and subjected to different milling speeds (800 rpm vs. 1100 rpm) as a function of the ball milling time. (b–d) SEM micrographs of the resulting LTO electrodes: (b) 0.5FA-800 rpm, (c) 1FA-800 rpm, and (d) 1FA-1100 rpm. | ||
For the investigation of the impact of the differences found for the three samples on the electrochemical de-/lithiation, the electrodes were subjected to galvanostatic cycling in half-cells at varying C rates (Fig. 2a) followed by constant current cycling at 1C (Fig. 2b). For comparison, also LTO electrodes prepared without adding any FA were studied accordingly (Fig. S5a and b, ESI†). The capacity retention for the constant current cycling at 1C is the highest for 0.5FA-800 rpm (89.3%) and 1FA-800 rpm (88.9%), compared to 84.4% and 84.6% for 1FA-1100 rpm and 0FA-800 rpm, respectively (see Fig. 2b and Fig. S5b, ESI†). This indicates that the addition of FA is generally beneficial while a lower milling speed favors cycling stability. A summary of the specific charge capacities recorded for the different half-cells at varying C rates is provided in Table S1 (ESI†). This comparison reveals that all LTO electrodes for which FA was added to the electrode slurry outperform the 0FA-800 rpm electrodes at all C rates and that the 0.5FA-800 rpm electrodes outperform all the other electrodes, while 1FA-800 rpm shows slightly higher capacities than the 1FA-1100 rpm electrodes, especially at elevated C rates (see also Fig. 2a). This superior performance – and the general trend for the different electrodes – is also well reflected by the trend for the polarization observed in the corresponding dis-/charge profiles, with the lowest polarization for 0.5FA-800 rpm (Fig. 2c), followed by 1FA-800 rpm (Fig. 2d) and 1FA-1100 rpm (Fig. 2e) as well as 0FA-800 rpm (Fig. S5c, ESI†). Similarly, the comparison of the EIS data (Fig. S6, ESI†) shows the same trend with the lowest and highest impedance for 0.5FA-800 rpm and 1FA-1100 rpm, respectively, and also the cyclic voltammetry data, presented in Fig. 2f, show the same trend for the redox peak separation, i.e., 0.5FA-800 rpm (ΔE = 160 mV) < 1FA-800 rpm (ΔE = 220 mV) < 1FA-1100 rpm (ΔE = 240 mV). These findings show that adding a higher amount of FA to completely suppress the aluminium current collector corrosion is not beneficial for the electrode performance – just like rather high milling speeds. In fact, the corrosion issue, if at least largely prevented by adding 0.5FA, is overcompensated by the detrimental effect of (apparently) too large amounts of FA, while the milling speed has a relatively lower impact – as also indicated by the comparison with the 0FA-800 rpm electrodes. In fact, it has been reported that very low pH values have a detrimental impact on the adhesion of the coating layer and the overall conductivity within the electrode, just like pH values above 10,18,28 highlighting the need to carefully control the pH of the electrode slurry.
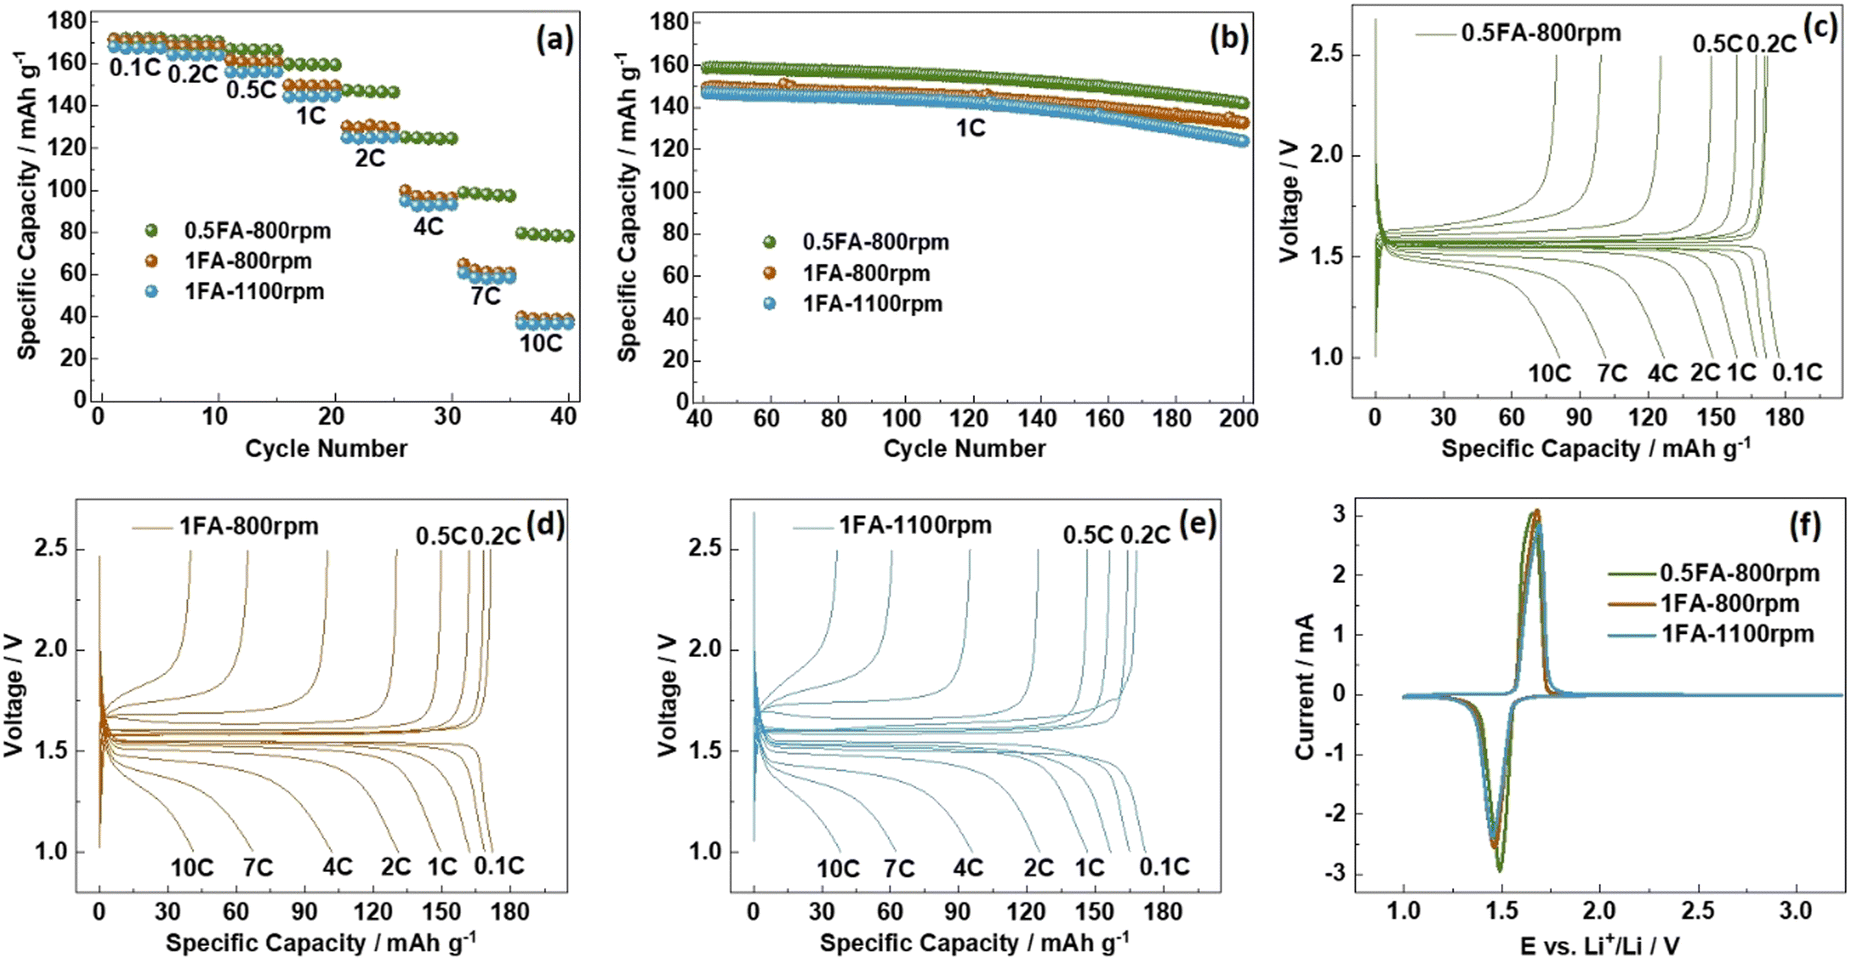 | ||
| Fig. 2 Galvanostatic cycling of 0.5FA-800 rpm, 1FA-800 rpm, and 1FA-1100 rpm LTO electrodes in half-cells: (a) application of stepwise increasing C rates (every five cycles) and (b) the subsequent constant current cycling at 1C; (c–e) exemplary dis-/charge profiles for the varying C rates for (c) 0.5FA-800 rpm, (d) 1FA-800 rpm, and (e) 1FA-1100 rpm. (f) Comparison of the cyclic voltammetry data recorded at a sweep rate of 0.1 mV s−1 for the three different LTO electrodes. The cut-off voltages/potentials were set to 1.0 and 2.5 V. | ||
To further enhance the cycling performance of the best-performing LTO electrodes, i.e., 0.5FA-800 rpm, the addition of fluoroethylene carbonate (FEC) to the electrolyte was studied in a complementary approach. FEC is a well-known electrolyte additive and co-solvent that has been extensively investigated in combination with various anode materials,34 especially graphite,35 silicon,36–39 and silicon/carbon composites,40–42 but also cathode materials such as LiCoO2,43 Li1.16[Mn0.75Ni0.25]0.84O2,44 and LiNi0.5Mn1.5O4.45,46 The commonly reported positive effect for lithium-ion anode materials is a higher reduction potential compared to non-fluorinated organic carbonate solvents, resulting in a thinner, but more stable fluorine-enriched solid-electrolyte interphase (SEI).34,47,48 Accordingly, we added 2 wt% FEC to the electrolyte and compared the performance of 0.5FA-800 rpm LTO electrodes subjected to galvanostatic cycling with and without FEC (Fig. 3a). The first discharge at 0.1C provides a specific capacity of 173 mA h g−1 without FEC and 181 mA h g−1 with FEC (Fig. 3b), while the reversible charge capacity was essentially the same with 169 mA h g−1 (without FEC) and 167 mA h g−1 (with FEC). These correspond to initial Coulombic efficiencies of 98.1% and 92.5%, respectively, which indicate the contribution of FEC to the SEI formation. When increasing the dis-/charge rate to 2C after the two formation cycles at 0.1C, the specific capacity decreases to 141 mA h g−1 in the case of the FEC-containing electrolyte (i.e., 0.5FA-800 rpm + FEC). For the FEC-free electrolyte (i.e., 0.5FA-800 rpm), it decreased to a slightly lower value of 138 mA h g−1. Even more important, though, was the improvement concerning the capacity retention after 400 cycles at 2C, which was greater than 93.6% in the case of 0.5FA-800 rpm + FEC and only about 77.5% without adding FEC to the electrolyte (Fig. 3a). The comparison of the corresponding dis-/charge profiles shows that this superior cycling stability is accompanied by a significantly lower polarization, which is increasing much less in presence of FEC (Fig. 3c and d). In fact, an analysis of the de-/lithiation kinetics by means of cyclic voltammetry and the Randles–Sevcik equation to comparatively determine the apparent Li+ diffusion coefficient (DLi+, see Fig. S7 (ESI†) and the corresponding discussion)49 revealed a significantly higher DLi+ upon lithiation (8.17 × 10⁻¹³vs. 5.50 × 10⁻¹³ cm2 s−1) and delithiation (1.35 × 10⁻¹²vs. 9.10 × 10⁻¹³ cm2 s−1) for the cell comprising the FEC electrolyte additive. As the electrodes themselves are essentially the same, this difference is assigned to a facilitated charge transfer at the LTO|electrolyte interface, as also reflected by the lower charge transfer impedance (Fig. S8, ESI†). This finding is in line with a previous study reporting that the addition of FEC yields lower desolvation energy for the Li+ cations at the LTO|electrolyte interface, which leads to superior lithiation kinetics.50
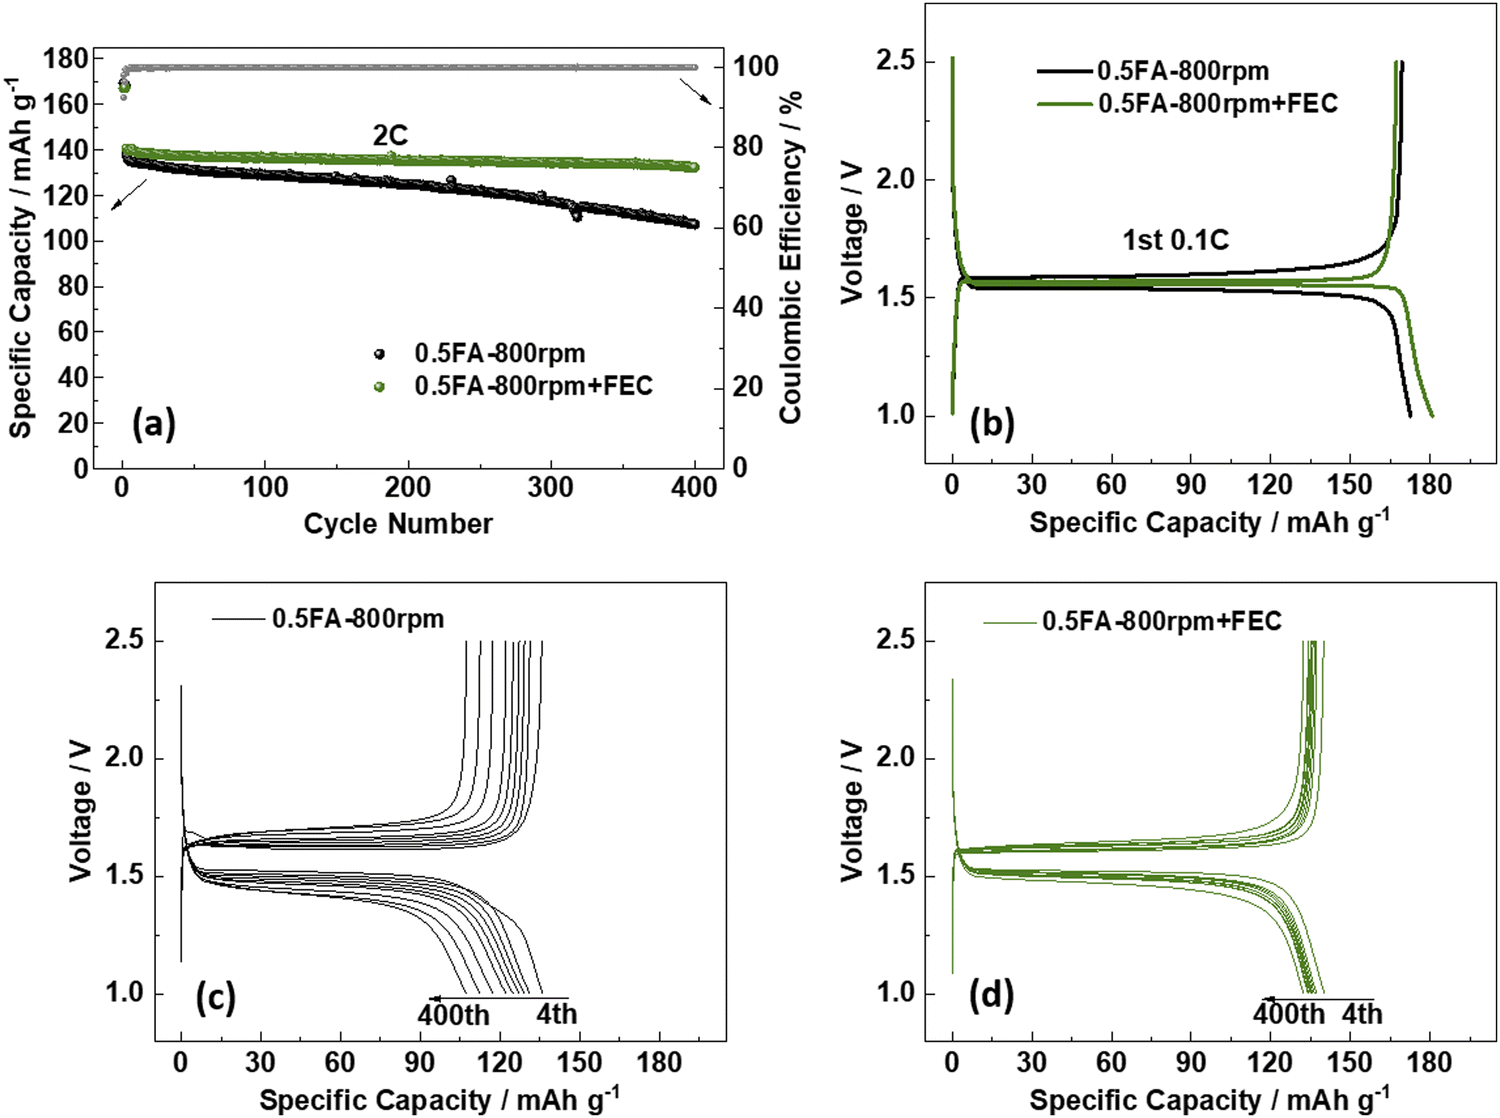 | ||
| Fig. 3 Galvanostatic cycling of 0.5FA-800 rpm LTO electrodes with (0.5FA-800 rpm + FEC) and without (0.5FA-800 rpm) FEC as electrolyte additives: (a) plot of the specific charge capacity and Coulombic efficiency as a function of the cycle number; (b) comparison of the dis-/charge profiles of the 1st cycle at 0.1C; (c) and (d) evolution of the dis-/charge profiles upon cycling at 2C for (c) 0.5FA-800 rpm and (d) 0.5FA-800 rpm + FEC (exemplarily for the 4th, 50th, 100th, 150th, 200th, 250th, 300th, 350th and 400th cycle). The first two cycles were conducted at 0.1C, followed by constant current cycling at 2C for 400 cycles. The cut-off voltages were set to 1.0 and 2.5 V. | ||
To understand the beneficial impact of FEC on the formation of such a favourable interface/-phase in more detail, ex situ X-ray photoelectron spectroscopy (XPS) analysis was conducted on pristine and cycled 0.5FA-800 rpm LTO electrodes; the latter in the absence (‘no FEC’) or presence of FEC (‘FEC’) in the electrolyte (Fig. 4). The cycled electrodes were subjected to either one cycle at 0.1C or one cycle at 1C in order to take into account also a potential impact of the specific current applied and the duration of the dis-/charge cycle. The pristine electrode reveals the characteristic features with deconvoluted peaks for C![[double bond, length as m-dash]](https://www.rsc.org/images/entities/char_e001.gif) C (283.6 eV), C–C/C–H (284.8 eV), C–O–C (286.6 eV), and CO (288.8 eV) bonds in the C 1s region, which are related to the conductive carbon, the CMC binder, and other carbonaceous species (adventitious carbon) on the sample surface. The corresponding peaks of CO (531.8 eV) and C–O (533.0 eV) species as well as the M–O (530.0 eV) peak are observed in the spectrum of the O 1s region,51 while the single peak doublet of Ti4+ (Ti 2p3/2:458.5 eV and Ti 2p1/2:464.2 eV) is detected in the Ti 2p region (Fig. 4a).19,52,53 It may be noted that the CC peak appears at a rather low binding energy of ∼283.6 eV (commonly expected is a binding energy of about 284.4–284.6 eV), which is assigned to a differential charging effect.39 After one cycle, independent from the applied C rate and the absence/presence of FEC, (Fig. 4b and c), a decrease in the intensity of the peaks due to the pristine electrode is observed. Furthermore, the appearance of new peaks in the P 2p region at 136.3/137.1 eV and 134.1/134.9 eV is noted which can be assigned to the formation of LixPFyOz54 and metaphosphates,53 respectively. Additional peaks are also observed in the F 1s region at 685.0 eV (LiF) and 687.1 eV (LiPF6/LixPFyOz).20 These new peaks indicate the decomposition of the electrolyte (more specifically, the lithium salt) and the deposition of the decomposition products on the electrode surface. The intensity decrease of the signals of the pristine electrode can be best followed by the evolution of peaks related to the LTO (M–O, O 1s and Ti4+, Ti 2p) or the conductive carbon (CC, C 1s). This decrease is more pronounced for the FEC-free electrolyte and the lower dis-/charge rate of 0.1C. Notably, the SEI generally remains rather thin, as apparent from ex situ SEM micrographs (Fig. S9, ESI†) and the fact that Ti4+ remains detectable in XPS for all cycled electrodes (Fig. 4b and c). In fact, it is generally expected that a longer discharge will result in greater electrolyte decomposition due to the longer time that the electrode is kept at low potentials. Similarly, a thinner SEI was reported earlier in the presence of FEC as the electrolyte additive, although the majority of studies focused on anode materials that are discharged to much lower cut-off voltages such as the aforementioned graphite35 and silicon36–39 as well as their composites,40–42 for which such decomposition is more pronounced. In this regard, the observation is still of interest. Even more remarkable, though, is certainly the finding that the addition of FEC leads to a lower (rather than the commonly expected higher) intensity for the LiF-related peak in the F 1s region. This suggests that the formation of LiF is not – or only to a negligible extent – caused by the decomposition of FEC, which is not expected to occur at such high voltages,48 but rather of LiPF6 (just like the other decomposition products found – see also the quantification of the different elements detected at the electrode surface presented in Fig. S10, ESI†). This decomposition reaction is suppressed in presence of FEC, presumably due to the stabilization of the Li+ solvation structure.48
C (283.6 eV), C–C/C–H (284.8 eV), C–O–C (286.6 eV), and CO (288.8 eV) bonds in the C 1s region, which are related to the conductive carbon, the CMC binder, and other carbonaceous species (adventitious carbon) on the sample surface. The corresponding peaks of CO (531.8 eV) and C–O (533.0 eV) species as well as the M–O (530.0 eV) peak are observed in the spectrum of the O 1s region,51 while the single peak doublet of Ti4+ (Ti 2p3/2:458.5 eV and Ti 2p1/2:464.2 eV) is detected in the Ti 2p region (Fig. 4a).19,52,53 It may be noted that the CC peak appears at a rather low binding energy of ∼283.6 eV (commonly expected is a binding energy of about 284.4–284.6 eV), which is assigned to a differential charging effect.39 After one cycle, independent from the applied C rate and the absence/presence of FEC, (Fig. 4b and c), a decrease in the intensity of the peaks due to the pristine electrode is observed. Furthermore, the appearance of new peaks in the P 2p region at 136.3/137.1 eV and 134.1/134.9 eV is noted which can be assigned to the formation of LixPFyOz54 and metaphosphates,53 respectively. Additional peaks are also observed in the F 1s region at 685.0 eV (LiF) and 687.1 eV (LiPF6/LixPFyOz).20 These new peaks indicate the decomposition of the electrolyte (more specifically, the lithium salt) and the deposition of the decomposition products on the electrode surface. The intensity decrease of the signals of the pristine electrode can be best followed by the evolution of peaks related to the LTO (M–O, O 1s and Ti4+, Ti 2p) or the conductive carbon (CC, C 1s). This decrease is more pronounced for the FEC-free electrolyte and the lower dis-/charge rate of 0.1C. Notably, the SEI generally remains rather thin, as apparent from ex situ SEM micrographs (Fig. S9, ESI†) and the fact that Ti4+ remains detectable in XPS for all cycled electrodes (Fig. 4b and c). In fact, it is generally expected that a longer discharge will result in greater electrolyte decomposition due to the longer time that the electrode is kept at low potentials. Similarly, a thinner SEI was reported earlier in the presence of FEC as the electrolyte additive, although the majority of studies focused on anode materials that are discharged to much lower cut-off voltages such as the aforementioned graphite35 and silicon36–39 as well as their composites,40–42 for which such decomposition is more pronounced. In this regard, the observation is still of interest. Even more remarkable, though, is certainly the finding that the addition of FEC leads to a lower (rather than the commonly expected higher) intensity for the LiF-related peak in the F 1s region. This suggests that the formation of LiF is not – or only to a negligible extent – caused by the decomposition of FEC, which is not expected to occur at such high voltages,48 but rather of LiPF6 (just like the other decomposition products found – see also the quantification of the different elements detected at the electrode surface presented in Fig. S10, ESI†). This decomposition reaction is suppressed in presence of FEC, presumably due to the stabilization of the Li+ solvation structure.48
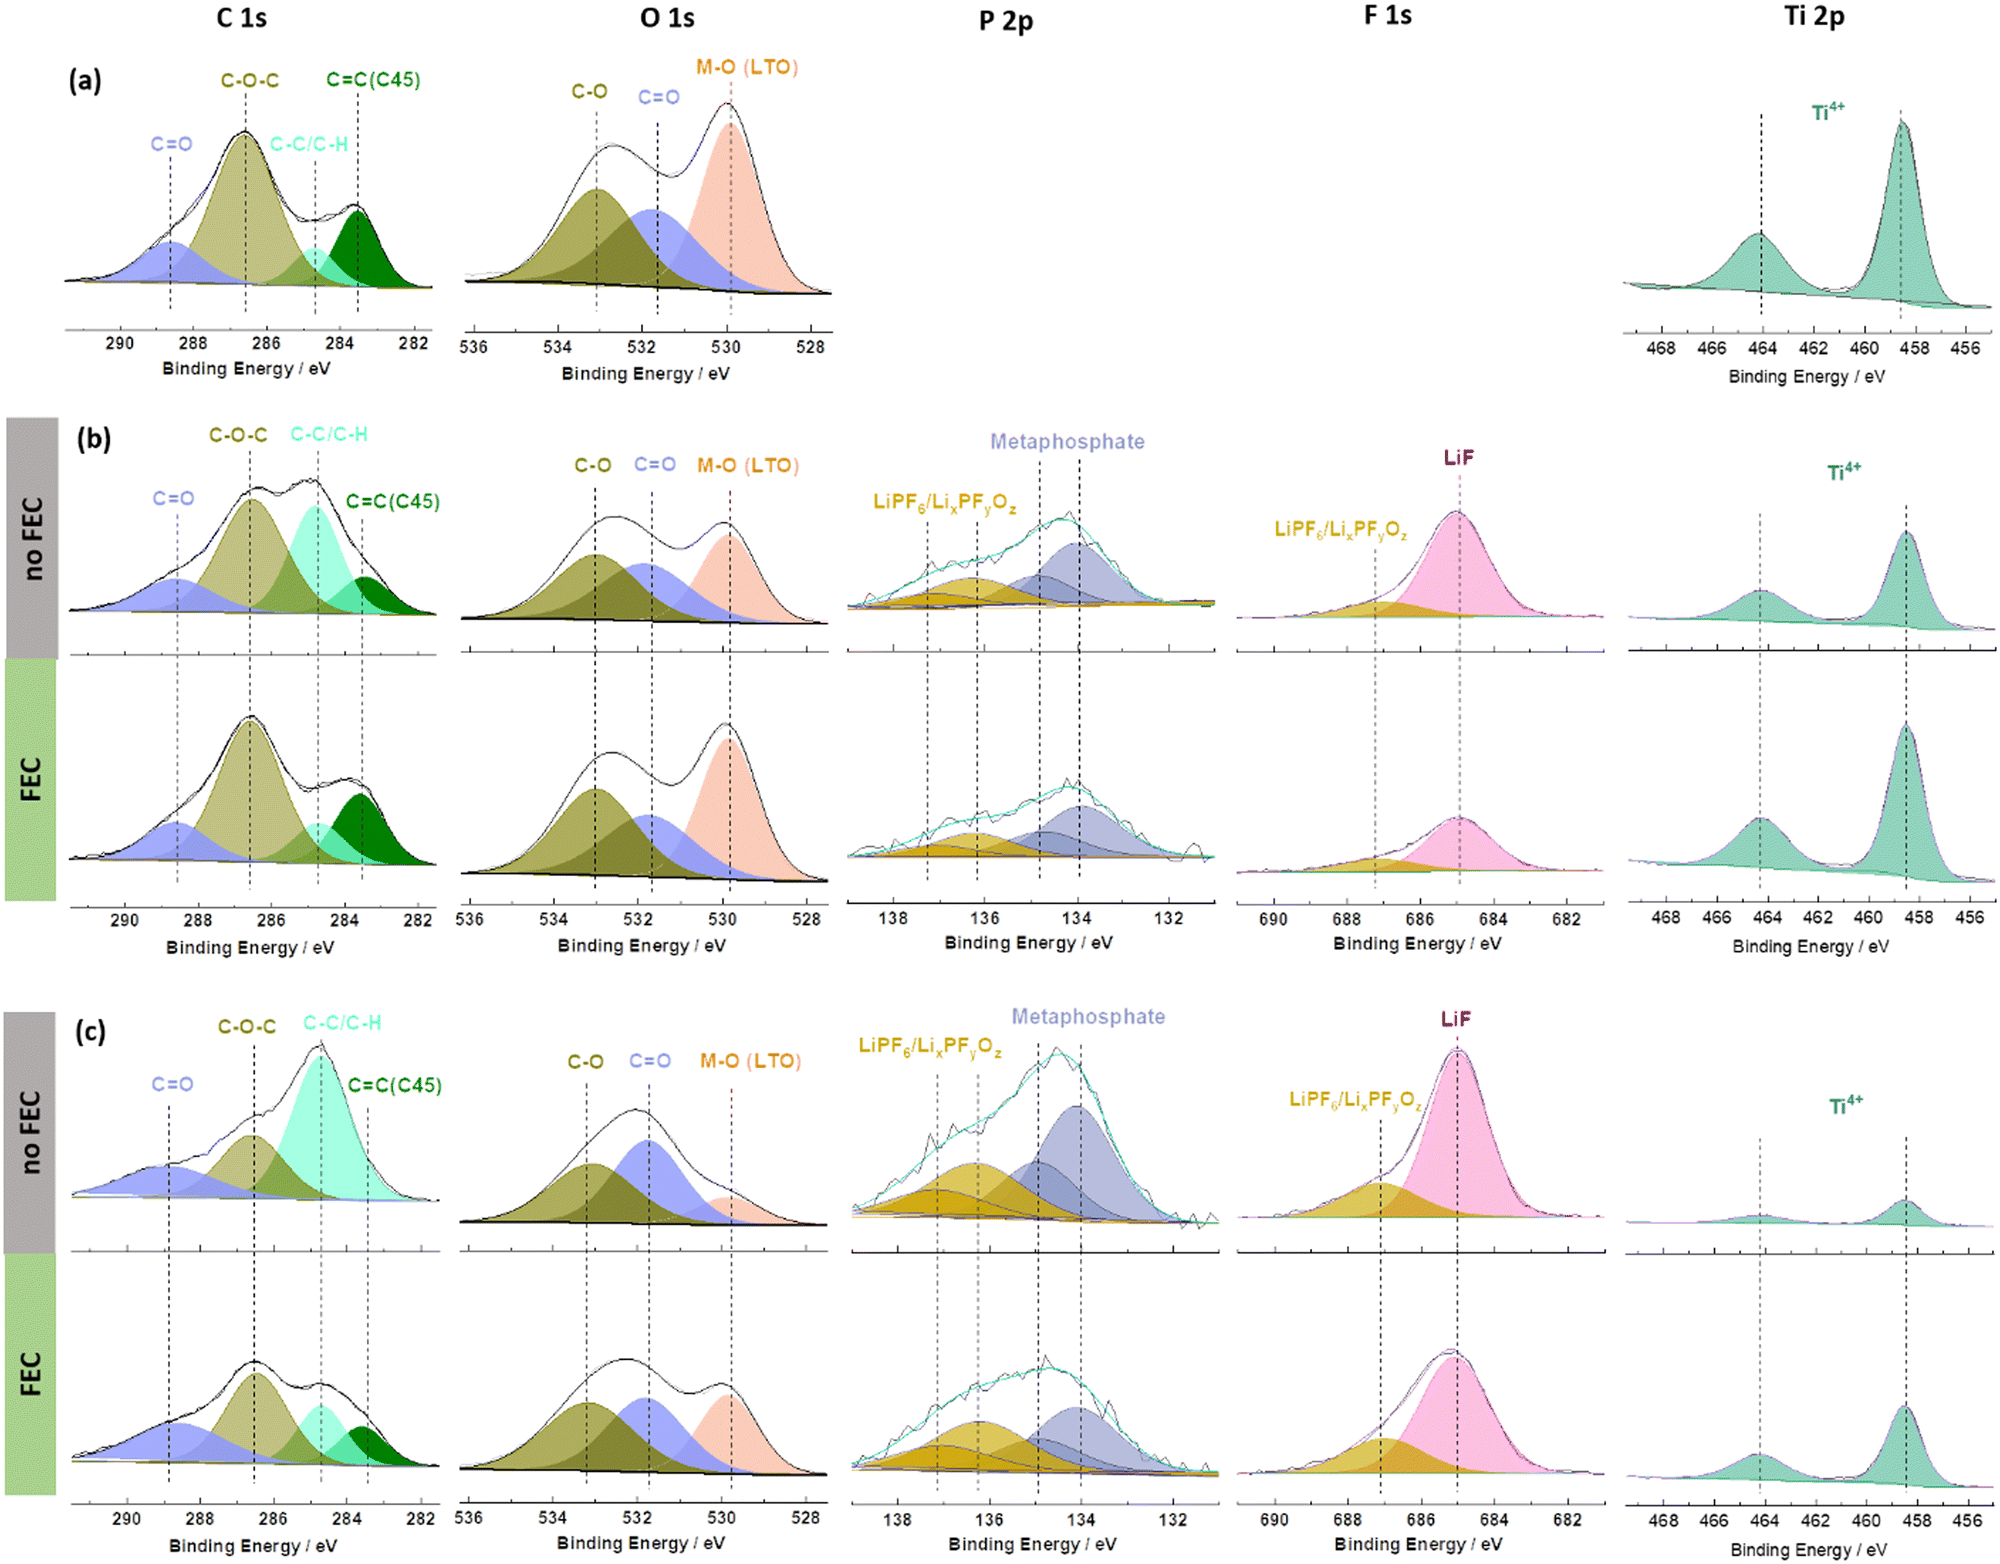 | ||
| Fig. 4 XPS analysis of (a) pristine and (b and c) cycled 0.5FA-800 rpm LTO electrodes subjected to one full dis-/charge cycle at (b) 1C and (c) 0.1C in the absence (top, grey) or the presence (bottom, green) of FEC as electrolyte additives. | ||
Finally, to ensure that the superior cycling stability is, indeed, related to the beneficial impact of FEC on the LTO|electrolyte interface/-phase rather than the lithium-metal counter electrode, LTO‖NMC532 full-cells were assembled and tested using the FEC-free and FEC-containing electrolyte (Fig. 5). The initial specific discharge capacity (referred to the active material mass loading of the NMC532 cathode) of the full-cells at 0.1C in the absence of FEC was about 140 mA h g−1, while it was around 155 mA h g−1 when FEC was added to the electrolyte. Accordingly, the specific capacity remains higher in the presence of FEC when increasing the dis-/charge rate to 2C with initially 117 mA h g−1vs. 101 mA h g−1. After 5000 cycles at 2C, the capacity retention was 72.7% for the FEC-free electrolyte and 84.3% with FEC, highlighting the beneficial impact of the thinner, but more stable SEI in such case. Similarly, the LTO‖NMC532 cell without FEC yields a specific capacity of 75 mA h g−1 after only 5000 cycles, while this capacity is reached for the LTO‖NMC532 cell with FEC after 10000 cycles, i.e., twice the cycle life, resulting in a capacity retention of 64.1% after such extended cycling.
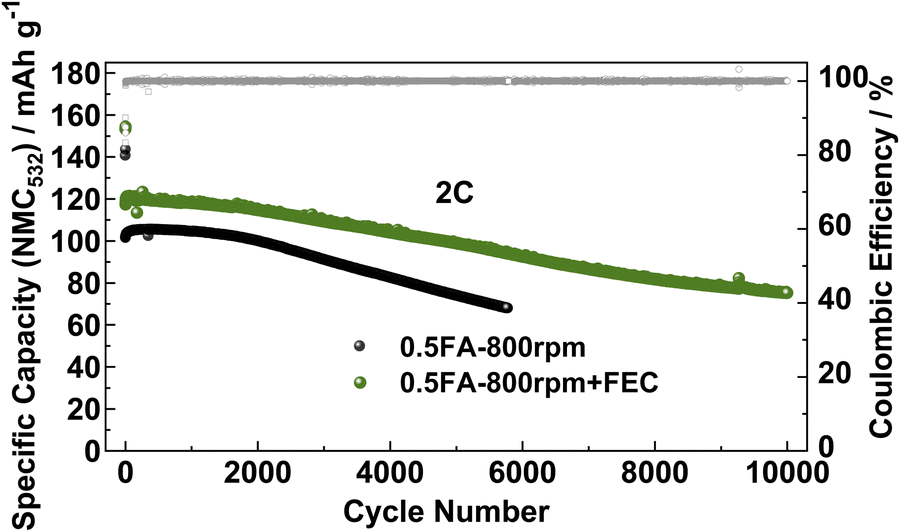 | ||
| Fig. 5 Long-term galvanostatic cycling of LTO‖NMC532 full-cells without (in black) and with FEC as electrolyte additives (in green). Following two formation cycles at 0.1C, the cells were subjected to constant current cycling at a dis-/charge rate of 2C. The cut-off potentials were set to 1.4 V and 2.8 V. | ||
In conclusion, the addition of FA to the electrode slurry largely suppresses the corrosion of the aluminum current collector. However, the best cycling performance was observed for a lower amount of FA, which still showed very minor corrosion, indicating that other impact factors such as the rheological behavior must be carefully considered as well. Thus, the FA amount must be carefully controlled to find a suitable compromise between increased lithium leaching and maintained slurry's pH values below the aluminum corrosion regime. Further optimization by adding FEC as the electrolyte additive revealed a substantial improvement, beyond the effects observed so far when adding FEC. In fact, the commonly reported LiF enrichment of the SEI was not observed in this case presumably owing to the relatively high cut-off. Instead, the presence of FEC in the electrolyte suppressed the lithium salt decomposition, resulting in superior de-/lithiation kinetics. The beneficial effect of FEC, moreover, enabled very good long-term cycling of LTO‖NMC532 full-cells for 10000 cycles at 2C with a capacity retention of 64.1%. In sum, the results show that the aqueous processing of lithium transition metal oxides is feasible when carefully optimizing every single step along the realization of the eventual lithium-ion full-cells and that FEC is more than just an F-donating electrolyte additive.
Experimental section
Electrode preparation
Commercial LTO (NEI Corporation, average particle size: 1.5–3.0 μm) was used as received. Sodium carboxymethyl cellulose (CMC, Dow Wolff Cellulosics, Walocel CRT 2000, degree of substitution: 1.2) was used as the binder, and C-NERGY Super C45 (Imerys) was used as the conductive additive. Formic acid (FA, >99%, VWR, 10% in aqueous solution) was employed as the processing additive for the electrode preparation. The LTO electrodes were prepared as follows: CMC was dissolved in deionized water by magnetic stirring at room temperature. The resulting aqueous solution together with 1FA (1FA equals 1.3 wt% of the mass of LTO) or 0.5FA (0.5FA equals 0.65 wt% of the mass of LTO), LTO, and the conductive carbon were transferred into zirconia ball milling jars. The electrode slurry was ball-milled for 2 h at a milling speed of 800 rpm or 1100 rpm. The resulting dispersions were cast on aluminum foil (battery grade, thickness: 20 μm) by using a laboratory-scale doctor blade. Subsequently, the electrodes were dried at 80 °C in an atmospheric oven (Binder), before being transferred to the dry room. Disk-shaped electrodes (geometric area: 1.13 cm2) were cut and pressed at 5 t for 10 s (Atlas manual hydraulic press, Specac). The pressed electrodes were dried once again under vacuum at 120 °C for 12 h. The composition of the LTO electrodes was 88 wt% LTO, 5 wt% of conductive carbon, and 7 wt% CMC. The active material mass loading of the LTO electrodes used for the characterization in half-cells was in the range from 4.9 to 5.3 mg cm−2. The active material mass loading of the LTO electrodes characterized in full-cells was in the range from 6.0 to 6.3 mg cm−2. The NMC532-based positive electrodes were composed of 92 wt% NMC532 (BASF), 4 wt% Super C65 (Imerys) as the conductive carbon, and 4 wt% PVdF (Solef 6020, Solvay, dissolved in N-methyl-2-pyrrolidone, NMP), coated on the aluminium foil (battery grade). The capacity ratio of the negative and positive electrodes, i.e., the N/P ratio, was about 1.14.Physicochemical characterization
The determination of the pH values of the electrode slurries was conducted every 0.5 h during ball milling, using a Lab 860 pH meter (SI Analytics) and a Blue Line 18 pH electrode (Schott Instruments). These slurries and the mixing parameters were identical to those used for the electrode preparation. Inductively coupled plasma optical emission spectroscopy (ICP-OES) was performed using a Spectro Arcos spectrometer (Spectro Analytical Instruments). For these measurements, the LTO powder was dispersed in water and the indicated amount of FA was added. The resulting dispersion was subjected to the same ball milling procedure as the electrode slurries. Subsequently, the dispersions were centrifuged, and the liquid phase was extracted for the ICP-OES experiments. X-ray diffraction (XRD) was performed using a Bruker D8 Advance with Cu Kα radiation (λ = 0.15406 nm). The 2θ range was 5° ≤ 2θ ≤ 70° and the step size was 0.008° with an acquisition time of 1 s per point. Scanning electron microscopy (SEM) was carried out using a Zeiss Crossbeam 340 field-emission electron microscope. For the ex situ X-ray photoelectron spectroscopy (XPS) and SEM experiments, the cycled cells were disassembled in an argon-filled glove box (MBraun, H2O < 0.1 ppm and O2 < 0.1 ppm) and rinsed with dimethyl carbonate (DMC) to remove the residual electrolyte. XPS was performed using a Specs XPS system with a Phoibos 150 energy analyzer using monochromatic Al Kα radiation (1486.6 eV), a take-off angle of 45° and a pass energy of 30 eV (fixed analyzer transmission mode) for the detail measurements. The cycled electrodes were transferred to the XPS load lock vacuum chamber in an argon-filled transfer vessel to avoid any contact with the ambient atmosphere. The signal of hydrocarbon (C–C/C–H) species (adventitious carbon) at 284.8 eV was used for binding energy calibration. The fitting of the spectra was done using the CasaXPS software, using nonlinear Shirley-type backgrounds and 70% Gaussian and 30% Lorentzian peak profiles. For all peak doublets (Ti 2p and P 2p), the intensity ratio (2:1) and spin–orbit splitting (Ti 2p 5.6 eV; P 2p 0.84 eV) were set to the expected values.
Electrochemical characterization
The electrochemical characterization was conducted in coin cells (CR2032, Hohsen). For the investigation in half-cells, lithium metal foil (battery grade, Honjo) was used as the counter electrode. The cells were assembled in an argon-filled glovebox (MBraun, H2O < 0.1 ppm and O2 < 0.1 ppm). The separator was made up of a single layer of polyethylene (Asahi Kasei) and soaked with 100 μL of the electrolyte (1 M LiPF6 in a 1:1 w/w mixture of ethylene carbonate (EC) and DMC, UBE). Galvanostatic cycling was performed at 20 ± 2 °C, utilizing a Maccor Battery Tester 4300. A dis-/charge rate of 1C corresponds to a specific current of 175 mA g−1. Cyclic voltammetry was conducted at 20 ± 2 °C in three-electrode Swagelok-type cells, using a VMP3 potentiostat/galvanostat (BioLogic) and lithium metal foil as the counter and reference electrodes. In this case, glass fiber sheets (Whatman GF/D) were used as a separator and soaked with 120 μL of the electrolyte. For all electrochemical studies in the half-cell configuration, the cut-off potentials/voltages were set to 1.0 and 2.5 V (vs. Li+/Li). Electrochemical impedance spectroscopy (EIS) was conducted using a VMP multichannel potentiostat (BioLogic). The impedance spectra were recorded in three-electrode cells from EL-Cell, comprising a circular lithium metal ring as the reference electrode and lithium metal foil as the counter electrode. The amplitude of the applied AC signal was 5 mV and the frequency was 1 MHz to 10 mHz. For the LTO‖NMC532 full-cell studies, the cut-off voltages were set to 1.4 and 2.8 V and a dis-/charge rate of 1C corresponds to a specific current of 161 mA g−1.
Conflicts of interest
The authors declare no conflict of interest.Acknowledgements
The authors would like to thank Mr Jason Lelovas for performing the ICP-OES analysis. Y.X. would like to acknowledge financial support from the Chinese Scholarship Council (CSC). In addition, the authors would like to acknowledge financial support from the German Federal Ministry of Education and Research (BMBF) within the Li-EcoSafe project (03X4636D) and the ExcellBattUlm project (03XP0257D), as well as the Helmholtz Association.References
- B. Dunn, H. Kamath and J.-M. Tarascon, Science, 2011, 334, 928–935 CrossRef CAS PubMed.
- I. Belharouak, G. M. Koenig Jr. and K. Amine, J. Power Sources, 2011, 196, 10344–10350 CrossRef CAS.
- D. Bresser, K. Hosoi, D. Howell, H. Li, H. Zeisel, K. Amine and S. Passerini, J. Power Sources, 2018, 382, 176–178 CrossRef CAS.
- D. Bresser, A. Moretti, A. Varzi and S. Passerini, Encyclopedia of Electrochemistry: Batteries, Wiley-VCH, Weinheim, Germany, 1st edn, 2020, pp. 3–11 Search PubMed.
- D. Larcher and J.-M. Tarascon, Nat. Chem., 2015, 7, 19–29 CrossRef CAS PubMed.
- D. L. Wood, J. D. Quass, J. Li, S. Ahmed, D. Ventola and C. Daniel, Drying Technol., 2018, 36, 234–244 CrossRef CAS.
- J. Li, Y. Lu, T. Yang, D. Ge, D. L. Wood and Z. Li, iScience, 2020, 23, 101081 CrossRef CAS PubMed.
- D. Bresser, D. Buchholz, A. Moretti, A. Varzi and S. Passerini, Energy Environ. Sci., 2018, 11, 3096–3127 RSC.
- S. Y. Li and B. C. Church, Mater. Corros., 2016, 67, 978–987 CrossRef CAS.
- I. A. Shkrob, J. A. Gilbert, P. J. Phillips, R. Klie, R. T. Haasch, J. Bareño and D. P. Abraham, J. Electrochem. Soc., 2017, 164, A1489–A1498 CrossRef CAS.
- J. Sicklinger, M. Metzger, H. Beyer, D. Pritzl and H. A. Gasteiger, J. Electrochem. Soc., 2019, 166, A2322–A2335 CrossRef CAS.
- M. Hofmann, M. Kapuschinski, U. Guntow and G. A. Giffin, J. Electrochem. Soc., 2020, 167, 140512 CrossRef CAS.
- M. Hofmann, M. Kapuschinski, U. Guntow and G. A. Giffin, J. Electrochem. Soc., 2020, 167, 140535 CrossRef CAS.
- R. Sahore, D. L. Wood, A. Kukay, K. M. Grady, J. Li and I. Belharouak, ACS Sustainable Chem. Eng., 2020, 8, 3162–3169 CrossRef CAS.
- W. B. Hawley, A. Parejiya, Y. Bai, H. M. Meyer, D. L. Wood and J. Li, J. Power Sources, 2020, 466, 228315 CrossRef CAS.
- M. Bichon, D. Sotta, N. Dupré, E. De Vito, A. Boulineau, W. Porcher and B. Lestriez, ACS Appl. Mater. Interfaces, 2019, 11, 18331–18341 CrossRef CAS PubMed.
- M. Bichon, D. Sotta, E. De Vito, W. Porcher and B. Lestriez, J. Power Sources, 2021, 483, 229097 CrossRef CAS.
- C.-C. Li, J.-T. Lee, Y.-L. Tung and C.-R. Yang, J. Mater. Sci., 2007, 42, 5773–5777 CrossRef CAS.
- N. Loeffler, G.-T. Kim, F. Mueller, T. Diemant, J.-K. Kim, R. J. Behm and S. Passerini, ChemSusChem, 2016, 9, 1112–1117 CrossRef CAS PubMed.
- M. Kuenzel, D. Bresser, T. Diemant, D. V. Carvalho, G.-T. Kim, R. J. Behm and S. Passerini, ChemSusChem, 2018, 11, 562–573 CrossRef CAS PubMed.
- A. Kazzazi, D. Bresser, A. Birrozzi, J. von Zamory, M. Hekmatfar and S. Passerini, ACS Appl. Mater. Interfaces, 2018, 10, 17214–17222 CrossRef CAS PubMed.
- M. Y. Abeywardana, N. Laszczynski, M. Kuenzel, D. Bresser, S. Passerini and B. L. Lucht, Int. J. Electrochem., 2019, 2019, 8636540 Search PubMed.
- M. Wood, J. Li, R. E. Ruther, Z. Du, E. C. Self, H. M. Meyer, C. Daniel, I. Belharouak and D. L. Wood, Energy Storage Mater., 2020, 24, 188–197 CrossRef.
- C.-H. Jo, D.-H. Cho, H.-J. Noh, H. Yashiro, Y.-K. Sun and S. T. Myung, Nano Res., 2015, 8, 1464–1479 CrossRef CAS.
- A. Kukay, R. Sahore, A. Parejiya, W. Blake Hawley, J. Li and D. L. Wood, J. Colloid Interface Sci., 2021, 581, 635–643 CrossRef CAS PubMed.
- D. L. Wood, M. Wood, J. Li, Z. Du, R. E. Ruther, K. A. Hays, N. Muralidharan, L. Geng, C. Mao and I. Belharouak, Energy Storage Mater., 2020, 29, 254–265 CrossRef.
- M. Kuenzel, D. Bresser, G.-T. Kim, P. Axmann, M. Wohlfahrt-Mehrens and S. Passerini, ACS Appl. Energy Mater., 2020, 3, 218–230 CrossRef CAS.
- W. Bauer, F. A. Çetinel, M. Müller and U. Kaufmann, Electrochim. Acta, 2019, 317, 112–119 CrossRef CAS.
- W. B. Hawley, A. Parejiya, Y. Bai, H. M. Meyer, D. L. Wood and J. Li, J. Power Sources, 2020, 466, 228315 CrossRef CAS.
- Y. Xu, A. Mullaliu, S. D. Lin, Y. Ma, M. Zarrabeitia, S. Passerini and D. Bresser, Electrochim. Acta, 2022, 429, 140970 CrossRef CAS.
- I. Doberdò, N. Löffler, N. Laszczynski, D. Cericola, N. Penazzi, S. Bodoardo, G.-T. Kim and S. Passerini, J. Power Sources, 2014, 248, 1000–1006 CrossRef.
- T. Ohzuku, A. Ueda and N. Yamamoto, J. Electrochem. Soc., 1995, 142, 1431–1435 CrossRef CAS.
- G. Yang and S.-J. Park, J. Mater. Chem. A, 2020, 8, 2627–2636 RSC.
- N. Xu, J. Shi, G. Liu, X. Yang, J. Zheng, Z. Zhang and Y. Yang, J. Power Sources Adv., 2021, 7, 100043 CrossRef CAS.
- D. Liu, K. Qian, Y.-B. He, D. Luo, H. Li, M. Wu, F. Kang and B. Li, Electrochim. Acta, 2018, 269, 378–387 CrossRef CAS.
- Y. Jin, N.-J. H. Kneusels, P. C. M. M. Magusin, G. Kim, E. Castillo-Martínez, L. E. Marbella, R. N. Kerber, D. J. Howe, S. Paul, T. Liu and C. P. Grey, J. Am. Chem. Soc., 2017, 139, 14992–15004 CrossRef CAS PubMed.
- K. Schroder, J. Alvarado, T. A. Yersak, J. Li, N. Dudney, L. J. Webb, Y. S. Meng and K. J. Stevenson, Chem. Mater., 2015, 27, 5531–5542 CrossRef CAS.
- C. Xu, F. Lindgren, B. Philippe, M. Gorgoi, F. Björefors, K. Edström and T. Gustafsson, Chem. Mater., 2015, 27, 2591–2599 CrossRef CAS.
- F. Lindgren, C. Xu, L. Niedzicki, M. Marcinek, T. Gustafsson, F. Björefors, K. Edström and R. Younesi, ACS Appl. Mater. Interfaces, 2016, 8, 15758–15766 CrossRef CAS PubMed.
- R. Jung, M. Metzger, D. Haering, S. Solchenbach, C. Marino, N. Tsiouvaras, C. Stinner and H. A. Gasteiger, J. Electrochem. Soc., 2016, 163, A1705–A1716 CrossRef CAS.
- K. Kim, I. Park, S.-Y. Ha, Y. Kim, M.-H. Woo, M.-H. Jeong, W. C. Shin, M. Ue, S. Y. Hong and N.-S. Choi, Electrochim. Acta, 2017, 225, 358–368 CrossRef CAS.
- Q. Li, X. Liu, X. Han, Y. Xiang, G. Zhong, J. Wang, B. Zheng, J. Zhou and Y. Yang, ACS Appl. Mater. Interfaces, 2019, 11, 14066–14075 CrossRef CAS PubMed.
- Y. Park, S. H. Shin, H. Hwang, S. M. Lee, S. P. Kim, H. C. Choi and Y. M. Jung, J. Mol. Struct., 2014, 1069, 157–163 CrossRef CAS.
- Y. Li, F. Lian, L. Ma, C. Liu, L. Yang, X. Sun and K. Chou, Electrochim. Acta, 2015, 168, 261–270 CrossRef CAS.
- Y. Xu, J. Liu, L. Zhou, L. Zeng and Z. Yang, J. Electroanal. Chem., 2017, 791, 109–116 CrossRef CAS.
- B. Aktekin, R. Younesi, W. Zipprich, C. Tengstedt, D. Brandell and K. Edström, J. Electrochem. Soc., 2017, 164, A942–A948 CrossRef CAS.
- S. P. Beltran and P. B. Balbuena, J. Mater. Chem. A, 2021, 9, 7888–7902 RSC.
- T. Hou, G. Yang, N. N. Rajput, J. Self, S.-W. Park, J. Nanda and K. A. Persson, Nano Energy, 2019, 64, 103881 CrossRef CAS.
- F. Wu, G.-T. Kim, M. Kuenzel, H. Zhang, J. Asenbauer, D. Geiger, U. Kaiser and S. Passerini, Adv. Energy Mater., 2019, 9, 1902445 CrossRef CAS.
- R. N. Nasara, W. Ma, Y. Kondo, K. Miyazaki, Y. Miyahara, T. Fukutsuka, C.-A. Lin, S.-K. Lin and T. Abe, ChemSusChem, 2020, 13, 4041–4050 CrossRef CAS PubMed.
- R. I. R. Blyth, H. Buqa, F. P. Netzer, M. G. Ramsey, J. O. Besenhard, P. Golob and M. Winter, Appl. Surf. Sci., 2000, 167, 99–106 CrossRef CAS.
- M.-S. Song, R.-H. Kim, S.-W. Baek, K.-S. Lee, K. Park and A. Benayad, J. Mater. Chem. A, 2014, 2, 631–636 RSC.
- J. F. Moulder, Handbook of X-ray Photoelectron Spectroscopy: A Reference Book of Standard Spectra for Identification and Interpretation of XPS Data, Physical Electronics Division, PerkinElmer Corporation, 1992 Search PubMed.
- J.-B. Gieu, V. Winkler, C. Courrèges, L. E. Ouatani, C. Tessier and H. Martinez, J. Mater. Chem. A, 2017, 5, 15315–15325 RSC.
Footnote |
| † Electronic supplementary information (ESI) available. See DOI: https://doi.org/10.1039/d2ma00741j |
| This journal is © The Royal Society of Chemistry 2022 |