 Open Access Article
Creative Commons Attribution 3.0 Unported Licence
Upcycling of waste jute biomass to advanced biocarbon materials: the effect of pyrolysis temperature on their physicochemical and electrical properties†
Neelima
Tripathi
 ab,
Arturo
Rodriguez Uribe
 ab,
Haftom
Weldekidan
ab,
Manjusri
Misra
ab,
Haftom
Weldekidan
ab,
Manjusri
Misra
 ab and
Amar K.
Mohanty
 *ab
*ab
aBioproducts Discovery and Development Centre, Department of Plant Agriculture, Crop Science Building, University of Guelph, Guelph, Ontario N1G 2W1, Canada. E-mail: mohanty@uoguelph.ca
bSchool of Engineering, Thornborough Building, University of Guelph, Guelph, Ontario N1G 2W1, Canada
First published on 10th October 2022
Abstract
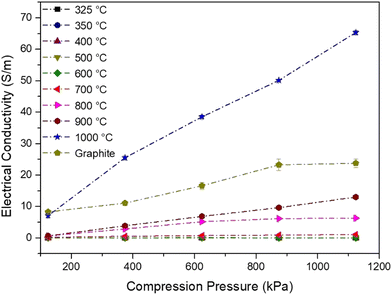
In this work, waste burlap (jute) biomass from the coffee industry was valorized to synthesize advanced biocarbon. Waste burlap biomass was carbonized at various temperatures (325, 350, 400, 500, 600, 700, 800, 900 and 1000 °C), followed by ball-milling. The pyrolysis yield, functionality, particle size, surface area, interlayer d-spacing, ash content, thermal stability, carbon/oxygen content, graphitic content and electrical conductivity of the biocarbon obtained after each carbonization were determined. With an increase in the carbonization temperature a decrease in yield occurred. The yield of biocarbon obtained at 325 °C was noted to be ∼71 wt%, which decreased with an increase in the carbonization temperature and remained ∼22 wt% from 800–1000 °C. It was observed that the functional groups of the carbonized biomass (biocarbon) due to the presence of cellulose, hemicellulose and lignin in biomass were retained up to ∼600 °C and diminished at higher pyrolysis temperatures. In addition, among 325–1000 °C carbonization temperatures, the highest thermally stable biocarbon and highest carbon content (85%) were obtained after pyrolyzing burlap biomass at 1000 °C. XRD analysis revealed the reduction in d-spacing as the carbonization temperature increases leading to close packing of layers. Importantly, burlap biocarbon (pyrolyzed at ∼1000 °C, compressed at 1.12 MPa) showed significant enhancement in electrical conductivity (∼3.5 times higher) than commercial graphite. The research has demonstrated that the synthesized sustainable biocarbon can be further upcycled. High temperature (∼1000 °C) pyrolyzed biocarbon has the potential to be used as biographite and can substitute fossil fuel-derived for certain semi-conductive materials.
1. Introduction
Conventional carbon products for instance graphite, graphene, carbon black, and carbon fibers are used immensely in day-to-day life products and applications such as batteries1 and automotive composites,2 water desalination,3 biomedical4 and construction industries.5 These materials are derived from fossil-fuel based precursors6 such as pitch, benzene, toluene, coal, coal tar, asphalt and hydrocarbons (gaseous form). Thus, the extensive usage of fossil-fuel-based resources results in the depletion of non-renewable resources, increasing oil prices and greenhouse gas emissions.7Conventional fossil fuel-based carbon can be replaced with under-valued biobased carbon (biocarbon). Biocarbon/biochar, generally developed by carbonization of renewable (waste agricultural feedstocks) resources, is a low-cost sustainable alternative that helps in carbon sequestration.7 The final cost of biocarbon depends on the feedstock source, carbonization unit type, coproducts obtained other than biocarbon, and market demand.8 Researchers investigated that the production cost of biocarbon from yard waste can be as low as USD 51 per ton. Further, the greenhouse gas emissions balance of biocarbon (from dried biomass) production and application can be as low as −1054 kg CO2e per ton.9 In comparison with fillers such as glass fibers used for making biocomposites, biocarbon is 70% less expensive.10
This upcycled waste biomass in the biocarbon form with respect to natural fibers is more chemically and thermally stable, is hydrophobic and has a wide processing window, unlike natural fibers (the degradation temperature of natural fibers starts at >200 °C).11 It has been explored that biocarbon as a filler significantly enhances the performance of a polymer matrix with increased sustainable content and has the potential to be used as a next-generation carbon material.12 The research towards developing biobased, economically viable and sustainable composite13 injection molded parts will create a niche market for agro-waste biomass.
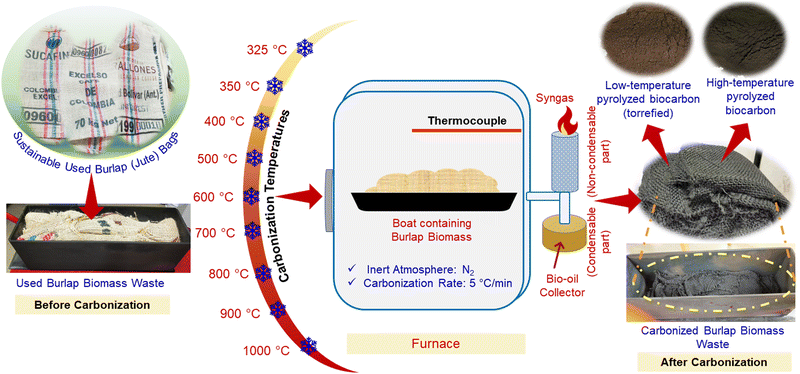
The thermochemical conversion of biomass to biocarbon in an inert or limited oxygen environment via carbonization is a waste management technique that increases bioeconomy and the potential to develop value-added applications. During the process, decomposition or breakdown of the material occurs with an increase in temperature. Other products that are obtained with char or biocarbon (solid form) are bio-oil (liquid form that can also be valorized14,15) and syngas (gaseous form, a mixture of carbon monoxide and hydrogen) or pyro-gas (gaseous). The reactions that primarily occur during the process are dehydration, recondensation, decarboxylation and aromatization.
Pyrolysis at low temperatures (torrefaction) and that at high temperatures are carbonization processes in which a thermally stable carbon-rich solid product is obtained. According to Chang et al.16 a slow pyrolysis rate (<10 °C min−1) results in a high biocarbon yield. However, a fast pyrolysis rate (∼100 °C min−1 or more) is favorable for producing the bio-oil.
The physicochemical properties, such as yield, carbon content, ash content, maximum degradation temperature, porosity, surface area, hydrophobicity, distance between planes of atoms (d-spacing) and graphitization, of the biocarbon from different feedstocks depend on (i) the primary molecular structure of the selected feedstock; (ii) composition of biomass (percent of cellulose, hemicellulose and lignin present); (iii) heating rate during carbonization; (iv) carbonization temperature; (v) carbonization retention/residence time; (vi) physical or chemical treatments conducted on the biomass preceding carbonization.
However, extensive research is still needed to enhance the commercial value of biocarbon exponentially. Based on its characteristic properties, biocarbon shows incredible scope to be used for the upcycling technology for sustainable development. Adesemuyi et al.17 studied the effects of pyrolysis temperatures of 400 and 600 °C on elephant grass and confirmed that it could remove nitrate ions from water. You et al.7 prepared activated Miscanthus biocarbon as an electrode material for developing an electric double-layer capacitor. The biocarbon was activated using potassium hydroxide, which increased the surface area. The effects of pyrolysis temperature on biomasses such as sugarcane bagasse,18 corn straw,19 rapeseed stems,20 hazelnut shells,21 distillers’ dried grains with solubles (DDGS)22 and sawdust23 have been explored.
Among the various renewable biomasses, waste burlap (jute) biomass is less probed and still needs attention as it is an unexplored agro-waste having unique physical and chemical properties. Jute biomass is composed of cellulose (∼55–75%), hemicellulose (∼12–20%), lignin (∼12–17%) (comparatively stable, primarily aromatic and the molecular structure varies among biomass24), pectin and some waxy materials.25 Jute fibers are one of the low-cost bast fibers among kenaf, sisal, hemp and flax. Jute has a specific heat value of 1360 J kg K−1.26 The degree of polymerization of untreated jute fibers was found to be 403.27 The easy availability, poor spinnability and rough touch make it an undervalued industrial fabric.28 Jute bags/sacks/fabrics are extensively used in various sectors, namely fertilizers, cement, agriculture, chemicals and transportation. However, the mass production of this inexpensive packaging material is gaining environmental concerns and needs disposal management.29 In addition, burlap (jute) bags are used to pack coffee beans, which are often reused to pack other products such as vegetables (such as potatoes) and grains and used for gardening. However, based on the calculation, it was predicted that only the coffee industry in Canada could produce about ∼1899.8 tons of burlap waste if not reused.
In this study, used burlap (strong, coarsely woven fibers) bags made of jute fibers produced as waste from the coffee industry were used to prepare sustainable burlap biocarbon samples. Jute is mainly composed of cellulose, hemicellulose and lignin30,31 and was pyrolyzed from 325 to 1000 °C. Physicochemical properties such as the yield, surface area, spacing between biocarbon layers, ash content, functionality, carbon content, graphitic content and evolution of residual gaseous components from biocarbon with a rise in the carbonization temperature were determined. Furthermore, the electrical conductivity of biocarbon with an increase in the compression load was also measured.
2. Experimental
2.1 Materials
Waste burlap bags that were used for storing green (unroasted) coffee beans were kindly provided by Club Coffee, Ontario, Canada. Commercial graphite (Model-299, Beijing Great Wall Co. Ltd) was used to compare a few of the critical results of the prepared biocarbon in the laboratory.2.2 Methods
2.3 Characterization
| Yield (%) = (WBioC/W0) × 100 | (1) |
| σ = L/RA | (2) |
3. Results and discussion
3.1 Burlap biocarbon yield
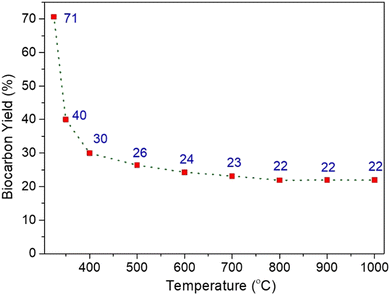
The yield of biocarbon obtained on pyrolyzing burlap biomass was determined using eqn (1). Fig. 2 illustrates that with an increment in the carbonization temperature (from 325 °C to 1000 °C), the yield decreases from 71 to 22 wt%. It signifies that as the carbonization temperature increases, the cleavage of bonds and functional groups present in the lignocellulosic burlap biomass increases. A continuous decrease in the biocarbon yield in the range of 325–700 °C indicates the decomposition or breakdown of hemicellulose, cellulose and lignin present in the lignocellulosic biomass.32 During pyrolysis at higher temperatures, devolatilization and thermal cracking occurred in the biomass. Similar observations of a decrease in biocarbon yields with an increase in carbonization temperatures were also observed by Chen et al.;33 Zhao et al.20 and Paleri et al.22 It was further observed that there is a negligible change in yield beyond 600–700 °C pyrolysis temperature that became constant at pyrolysis temperatures of 800–1000 °C (i.e., the yield remains ∼22 wt%). The no change in yield at higher temperatures reveals that all the volatiles in the lignocellulosic burlap biomass were removed before 800 °C, and the higher stable aromatic component remained.3.2 Effect of carbonization temperature on the functionality
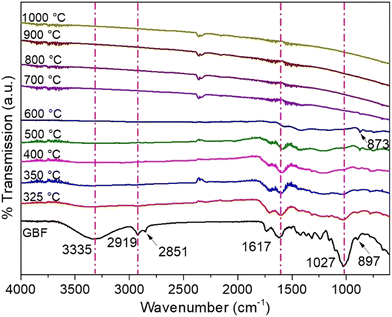
The FTIR analysis was conducted to analyse the influence of the carbonization temperature on the functionality of burlap biomass (Fig. 3).The broad peak at 3335 cm−1 present in GBF signifies the stretching vibrations of the hydroxyl (O–H) group. The peaks at 2919 and 2851 cm-1 denote the existence of symmetric and asymmetric C–H stretching on aliphatic hydrocarbons (alkane stretch) and symmetric stretch, respectively, present in lignocellulosic constituents. The peak at 1617 cm−1 represents the C![[double bond, length as m-dash]](https://www.rsc.org/images/entities/char_e001.gif) O stretching present in cellulose-hemicellulose and the C
O stretching present in cellulose-hemicellulose and the C![[double bond, length as m-dash]](https://www.rsc.org/images/entities/char_e001.gif) C aromatic bond present in lignin. In addition to that, the peaks at 873 and 897 cm−1 represent aromatic out-of-plane bending vibrations due to ring substitution.34–36
C aromatic bond present in lignin. In addition to that, the peaks at 873 and 897 cm−1 represent aromatic out-of-plane bending vibrations due to ring substitution.34–36
From the FTIR spectra, it can be observed that with the rise in carbonization temperature, the peak intensity reduces, indicating the loss of volatiles and components present in the lignocellulosic part that is degradable at low carbonization temperatures. The presence of functional groups until 600 °C carbonization temperature represents the functionality of lignin retained in the biocarbon up to 600 °C. Beyond the 600 °C pyrolysis temperature, the functionality of the biocarbon was not retained as the peaks that indicate the presence of hemicellulose, cellulose and lignin were not visible. Furthermore, it was noted that the peaks representing aromatic signals (873 cm−1) retained at around 600 °C show the presence of lignin (as lignin-containing aromatic rings have a higher thermal stability than cellulose-hemicellulose). The change in functionality was supported by the percent yield obtained after the carbonization of burlap biomass.
3.3 Effect of carbonization temperature on the thermal stability and ash content
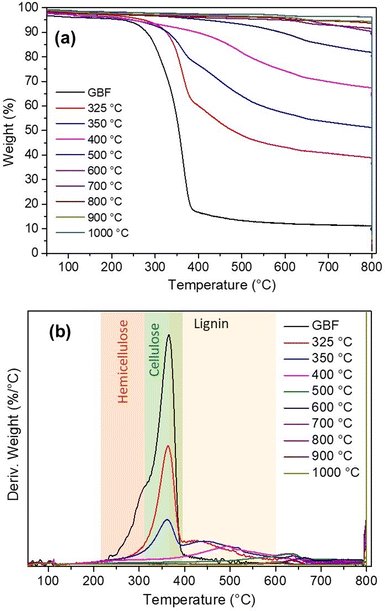
The thermal stability of the biocarbon samples was checked using the analysis (Fig. 4). The derivative graph shows that the peak height reduces with an increase in the pyrolysis temperature. The derivative weight curves (%/°C) demonstrated that the maximum peak height shifts towards a higher temperature with an increase in carbonization temperature due to the prior carbonization in the pyrolizer.22In addition to that, with an enhancement in the carbonization temperature, the weight percent rate of the samples decreases. The change in weight percent rate was significant up to 600 °C and beyond 600 °C, less change was observed. This increased thermal stability reveals that all the volatiles in the lignocellulosic biomass were removed at around 600 °C (also proved by the percent yield of biocarbon and FTIR analysis), and the higher stable aromatic component remained. Hence, it can be concluded that the thermostability of the biocarbon samples increases when the carbonization temperature is increased from 325 to 1000 °C.
A similar behaviour of biochar was observed by Ma et al.37 Yang et al.38 studied the degradation temperature range of commercial cellulose, hemicellulose and lignin. It was noted that the degradation of hemicellulose resulted in the range of 220–315 °C, while that of cellulose occurred at 315–400 °C. However, lignin decomposes in a wide range, and its range depends on the type of lignin (based on the origin and extraction process). The lignin depolymerization starts with the cleavage of H2 and C–OH (weaker bonds), followed by β-O-4 bonds at higher temperatures.6 Brebu et al.39 stated that the maximum degradation range was around 370–385 °C; however, mass loss continued above 550 °C slowly due to aromatic condensation. Bartkowiak et al.40 stated that up to 600 °C, mass loss of lignin is still retained. The mass loss rate in the case of lignin was the slowest.38 Furthermore, it was noted that the ash content increases with an increase in the carbonization temperature (shown in Table 1). The increment in ash content occurred due to the progressive concentration of inorganic mineral constituents (K, Ca, and Si).41,42 The change in thermal stability of burlap biocarbon was affirmed by the percent yield and the presence of functional groups in burlap biocarbon at different temperatures (325–1000 °C).
| Burlap biomass carbonization temperature (°C) | TGA | BET | XRD | |
|---|---|---|---|---|
| Ash content (wt%) | Surface area (m2 g−1) | Peak position (2θ) | d-spacing (Å) | |
| 325 | 3.29 ± 1.12 | 2.902 | 24.3 | 3.66 |
| 350 | 3.81 ± 1.13 | 3.297 | 24.32 | 3.66 |
| 400 | 4.9 ± 0.03 | 4.120 | 24.38 | 3.65 |
| 500 | 5.34 ± 0.27 | 6.126 | 29.33 | 3.05 |
| 600 | 6.21 ± 1.26 | 31.965 | 29.41 | 3.04 |
| 700 | 6.08 ± 1.03 | 87.914 | 29.38 | 3.04 |
| 800 | 6.7 ± 0.62 | 39.323 | 31.32 | 2.86 |
| 900 | 6.62 ± 1.27 | 11.193 | 31.33 | 2.86 |
| 1000 | 7.59 ± 0.03 | 7.265 | 31.34 | 2.85 |
3.4 Effect of carbonization temperature on the functionality of the evolved gaseous residues
The analysis was conducted to determine the release of gases from the biocarbon samples during heating (up to 900 °C in a TGA instrument in an inert atmosphere). The analysis helps in detecting residues that evolve in the form of gases during thermal decomposition. The analysis also provides information on the environmental impact during pyrolysis.35Fig. 5 shows the 3D spectra of gaseous products produced from burlap fibers and burlap biocarbon samples. The burlap (jute) biomass comprises cellulose, hemicellulose and lignin.31Fig. 5(a) shows the removal of volatile organic compounds from burlap fibers in a wide range of temperatures. The gaseous compounds are alcohols (methanol and ethanol), acetone, acetaldehyde and phenol derivatives.6 Among all the three components, lignin is highly thermally stable as it exhibits the evolution of gases up to a higher temperature relative to the hemicellulose and cellulose, and for a wider temperature range.37,43 The decomposition temperatures of cellulose and hemicellulose are less than that of lignin. Lignin consists of aromatic rings in each structural unit with different reactivities, resulting in a milder mass loss or decomposition.33 The absorption peak of products at 3800–3500 cm−1 represents H2O, 3100–2800 cm−1 represents CH4, 2390–2250 cm−1 represents CO2, and 2240–2040 cm−1 represents CO. Hence, a wider pyrolysis temperature range was noted for lignin than cellulose and hemicellulose.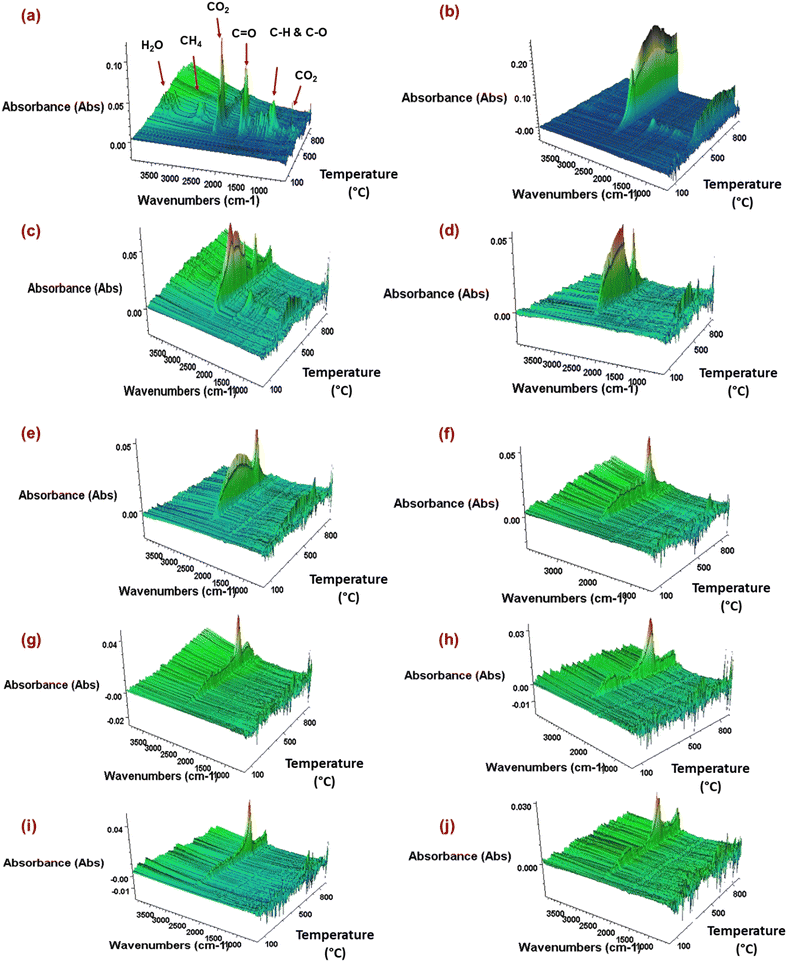 | ||
| Fig. 5 TGA-FTIR 3D spectra of (a) ground burlap fibers (BF); pyrolyzed at (b) 325 °C, (c) 350 °C, (d) 400 °C, (e) 500 °C, (f) 600 °C, (g) 700 °C, (h) 800 °C, (i) 900 °C, and (j) 1000 °C. | ||
The absorption band (2390–2250 cm−1) indicates that with an increase in the carbonization temperature, the CO2 intensity reduces. The reduced intensity could be observed due to the conversion of unstable to more thermally stable biocarbon as the pyrolysis temperature increases; hence, the susceptibility to thermal decomposition reduces.
3.5 Effect of carbonization temperature on the disordered and graphitic (ordered) carbon
Raman scattering analysis was conducted to determine the D- and G-band ratio. The D-band resulted due to turbostratic carbon,44 representing disordered and distorted carbon, and the G-band represents highly ordered or graphitic carbon.45The intensity ratio (ID/IG) of the two (D and G) bands was calculated by taking the ratio of the amplitude height of the deconvoluted peaks at Raman shift 1300–1400 cm−1 for D and 1500–1600 cm−1 for G peaks.44Fig. 6 illustrates that with the rise in pyrolysis temperature (from 500–1000 °C), the intensity ratio (ID/IG) increases (ID/IG values are shown in Fig. 6). Thus, it signifies that the disordered structure increases with an increase in the pyrolysis temperature.
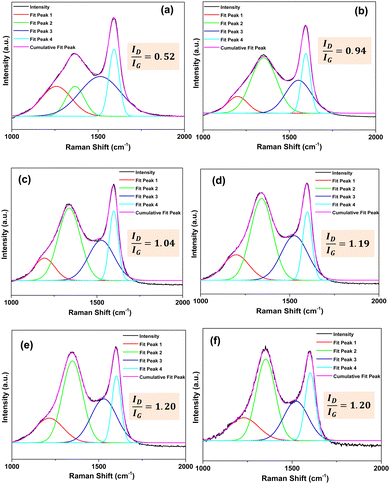 | ||
| Fig. 6 Deconvoluted Raman spectra of burlap biocarbon pyrolyzed at (a) 500 °C, (b) 600 °C, (c) 700 °C, (d) 800 °C, (e) 900 °C, and (f) 1000 °C. | ||
Furthermore, the crystallite size (La) (nm) of the biocarbon samples was calculated using eqn (3):
| La = (2.4 × 10⁻¹⁰)λ4(ID/IG)−1 | (3) |
The calculated crystal size value for 500, 600, 700, 800, 900 and 1000 °C were 36.97, 20.46, 18.49, 16.16, 16.03 and 16.03 nm, respectively. A decrease in the crystallite size with an increase in carbonization temperature was observed. Snowdon et al.44 also observed an increase in the ID/IG ratio with a rise in carbonization temperatures.
3.6 Effect of carbonization temperature on the surface area of the burlap biocarbon
BET analysis was performed for the carbonized burlap biomass. The change in the specific surface area of burlap biocarbon with a change in carbonization temperature is shown in Table 1. It was observed that the surface area was enhanced when burlap biomass was carbonized from 325 to 700 °C. Furthermore, the specific surface area was reduced with a rise in carbonization temperature from 700 to 1000 °C. The enhancement of surface area from 325 to 700 °C was 30.3%, and the reduction from 700 to 1000 °C was 12%. The increase in the surface area occurred because of the accelerated release of volatile matter, resulting in complete devolatilization. After the complete decomposition of hemicellulose, the cellulose resulted in an enhanced surface area as cellulose microfibrils controlled the dimensional modifications.47 The rise in carbonization temperature to 700 °C also results in pore enlargement. However, the increment above 700 °C leads to a decrease in surface area. The decrease in surface area was observed due to the collapse of internal structures of biocarbon (adjacent walls breakdown because of the pore enlargement), resulting in a decline in surface area. A similar decrease in surface area with an increase in pyrolysis temperature was also observed by Elnour et al.48 and Dhar et al.473.7 Effect of carbonization temperature on the surface morphology and percent carbon content
SEM was conducted to determine the surface morphology of the biocarbon samples (Fig. 7) and identify their microstructure. EDS helped in determining the percent of carbon and oxygen present in the samples (Fig. 8).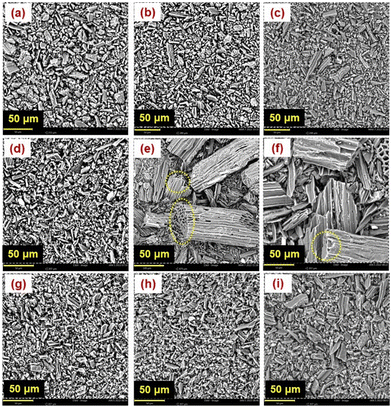 | ||
| Fig. 7 Surface morphology of the burlap biocarbon pyrolyzed at (a) 325 °C, (b) 350 °C, (c) 400 °C, (d) 500 °C, (e) 600 °C, (f) 700 °C, (g) 800 °C, (h) 900 °C, and (i) 1000 °C. | ||
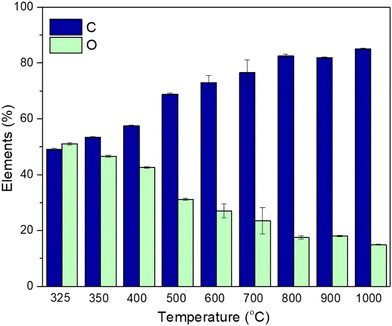 | ||
| Fig. 8 SEM-EDS of the burlap biocarbon pyrolyzed at 325 °C, 350 °C, 400 °C, 500 °C, 600 °C, 700 °C, 800 °C, 900 °C, and 1000 °C. | ||
The biocarbon pyrolyzed at 600 °C (Fig. 7(e)) and 700 °C (Fig. 7(f)) demonstrated larger sizes than lower carbonization temperatures (325–500 °C). The increase in particle size at 600 °C was also observed by Li et al.49 Furthermore, the biocarbon pyrolyzed at 600 °C and 700 °C showed a lotus root-like morphology. The porous morphology was obtained due to the dislodging of organic volatiles. A similar morphology was also observed by Chen et al.50 Som et al.51 also evidenced the existence of this morphology after pyrolysis of palm frond and stated the occurrence because the lignin fused and formed pores during pyrolysis.
The increased porosity at a temperature of 600 °C is due to the quick release of gases during lignin decomposition that was retained at 700 °C.42Fig. 8 shows the effect of pyrolysis temperature on the elemental composition.
It was observed that with rise in pyrolysis temperature from 325 to 1000 °C, carbon content increased from 49 to 85%; however, oxygen content reduced from 51 to 15%. The higher carbon content at a higher pyrolysis temperature resulted in the formation of fixed carbon by depolymerization of lignocellulose. During the process, labile components such as oxygen and hydrogen were removed by dehydration and deoxygenation. This behavior was also evidenced by Zhao et al.20 In addition to that, less oxygen component in biocarbon signifies its higher stability as oxygen renders a reaction that leads to degradation.
3.8 Effect of carbonization temperature on the interlayer spacing of burlap biocarbon
XRD analysis was conducted to determine the crystalline and amorphous phases present in the biocarbon samples (Fig. 9). The interlayer d-spacing between the burlap biocarbon layers was also detected (Table 1). Fig. 9(a) shows the high intensity, sharp narrow peak (at 2θ = 26.61°) of a commercial graphite sample with a d-spacing of 3.35 Å, demonstrating its crystalline nature. It implies that commercial graphite is a highly oriented carbon material and has a crystalline structure. However, the burlap biomass carbonized from 325–1000 °C shows an amorphous nature (randomly distributed atoms). The shift of peak towards a higher 2θ angle (Fig. 9(b)) signifies that the increase in carbonization temperature resulted in compressive stresses between the carbon layers. The reduced d-spacing was also validated by the analysis. The d-spacing for 325 °C was 3.66 Å, which was reduced to 2.85 Å for 1000 °C burlap biocarbon (Table 1). Li et al.49 also observed that as the pyrolysis temperature was increased, the interlayer d-spacing reduced.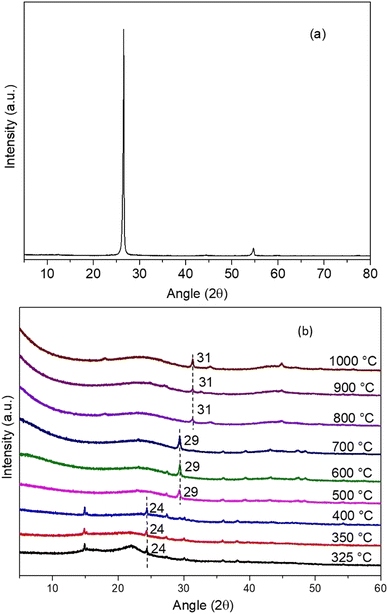 | ||
| Fig. 9 XRD spectra of (a) commercial graphite and (b) burlap biocarbon samples carbonized at different temperatures. | ||
3.9 Effect of carbonization temperature on the electrical conductivity
Nowadays, there is a significant requirement to develop a low-cost ubiquitous biographite that can be used to enhance modulus in polymer composites and energy storage applications. It is critically essential to discover and develop carbon obtained from waste biomass with a significantly higher conductivity. Biographite will also decrease the dependence on fossil-based resources.The increase in the electrical conductivity was viewed with an increase in pressure loadings due to a decrease in the volume of samples resulting in close packing of the powder particles (Fig. 10). A similar behavior was observed for graphene samples. The lower compression pressure was insufficient to achieve the full potential of the samples showing electrical conductivity. The lowest conductivity was observed at 124.84 kPa because of the presence of air gaps between the particles. Moreover, as the gap decreases, electrical conductivity increases.
Kane et al.52 compared the physicochemical properties of biochar obtained by pyrolyzing lignin at 900 and 1100 °C. The laboratory isolated lignin showed an electrical conductivity of 18.5 S cm−1 and further suggested meticulously tailoring biochar properties.
The significant enhancement of electrical conductivity for the biocarbon samples was observed even though the sample was amorphous, unlike graphite/graphene, because the rise occurred due to the interconnected pores. BET analysis shows that the surface area first increases to 700 °C and decreases with a further rise in the carbonization temperature. A decline in the surface area occurred due to the collapse of walls of the biocarbon due to the enlargement of pores at 700 °C. These interconnected pores that may lead to intense packing make the movement of electrons easier.
In addition, the shift in the 2θ angle to a higher value occurred due to the compressive residual stress or contraction of the layers (also affirmed by the d-spacing value from XRD) developed in the sample as the carbonization temperature increased. Giorcelli et al.53 also confirmed the enhancement in conductivity with an increase in pressure and stress on the samples.
4. Conclusions
The work probed the effect of carbonization (pyrolysis at low (torrefied) and at high temperatures) of waste burlap (jute) sustainable biocarbon on its physicochemical and electrical properties. The carbonization was conducted at 325, 350, 400, 500, 600, 700, 800, 900 and 1000 °C. The following observations were made:• The biocarbon yield was 71–22 wt% when carbonized at 325–1000 °C. The change in yield was negligible (±1%) beyond 600 °C. The yield was constant (22 wt%) towards higher temperatures i.e., 800, 900 and 1000 °C.
• The thermal stability increases with an increase in carbonization temperature.
• As the carbonization temperature increased, the highest peak at the diffraction angle shifted towards a higher angle, and the d-spacing also reduces with a rise in carbonization temperature, which signifies the contraction of layers leading to compressive residual stress generated at a higher carbonization temperature.
• SEM-EDS revealed that the maximum carbon content obtained was 85% on pyrolyzing burlap biomass at 1000 °C.
• The electrical conductivity of burlap biocarbon pyrolyzed at 1000 °C showed a 250% improvement compared with commercial graphite.
The results from the analyses corroborated the enhancement in electrical conductivity. Hence, the tuning of burlap biocarbon will further show excellent enhancement in electrical conductivity and have the potential to replace non-renewable graphite that needs a higher electrical conductivity for certain applications.
Author contributions
Methodology, investigation, data analysis, and writing – original draft preparation, N.T.; investigation, validation, and writing – review and editing, A. R. and H. W.; project conceptualization, methodology, administration, resources, funding acquisition and supervision, and writing – review and editing, A. K. M. and M. M.; all authors contributed to the discussion, reviews and approval of the manuscript for publication.Conflicts of interest
There are no conflicts to declare.Acknowledgements
The authors would like to thank the financial support of (i) the Ontario Research Fund, Research Excellence Program; Round 9 (ORF-RE09) Ontario Ministry of Economic Development, Job Creation and Trade (Project No. 053970 and 054345); (ii) the Ontario Agri-Food Innovation Alliance – Bioeconomy for Industrial Uses Research Program (Project No. 030331 and 030332); (iii) the Ontario Agri-Food Research Initiative (Project No. 055217); (iv) the Natural Sciences and Engineering Research Council (NSERC) – Collaborative Research and Development Grants (CRD) Project No. 401637 with the partner industries Prism Farms Limited and Competitive Green Technologies, Lamington, Ontario, Canada for carrying out this study. The authors would also like to thank Club Coffee, Ontario, Canada for the burlap samples; and the powder XRD data were collected at the Chemistry Department X-Ray Diffraction Facility, University of Guelph for the powder XRD study.References
- S. Yang, Y. Cheng, X. Xiao and H. Pang, Development and application of carbon fiber in batteries, Chem. Eng. J., 2020, 384, 123294 CrossRef CAS.
- Z. Zhao, P. Bai, W. Du, B. Liu, D. Pan and R. Das, et al., An overview of graphene and its derivatives reinforced metal matrix composites: Preparation, properties and applications, Carbon, 2020, 170, 302–326 CrossRef CAS.
- J. R. Werber, C. O. Osuji and M. Elimelech, Materials for next-generation desalination and water purification membranes, Nat. Rev. Mater., 2016, 1, 1–15 Search PubMed.
- K. Nekoueian, M. Amiri, M. Sillanpää, F. Marken, R. Boukherroub and S. Szunerits, Carbon-based quantum particles: An electroanalytical and biomedical perspective, Chem. Soc. Rev., 2019, 48(15), 4281 RSC.
- K. M. Liew, M. F. Kai and L. W. Zhang, Carbon nanotube reinforced cementitious composites: An overview, Composites, Part A, 2016, 91, 301–323 CrossRef CAS.
- M. Erfani Jazi, G. Narayanan, F. Aghabozorgi, B. Farajidizaji, A. Aghaei and M. A. Kamyabi, et al., Structure, chemistry and physicochemistry of lignin for material functionalization, SN Appl. Sci., 2019, 1, 1–19 Search PubMed.
- X. You, M. Misra, S. Gregori and A. K. Mohanty, Preparation of an Electric Double Layer Capacitor (EDLC) Using Miscanthus-Derived Biocarbon, ACS Sustainable Chem. Eng., 2018, 6(1), 318–324 CrossRef CAS.
- E. Behazin, M. Misra and A. K. Mohanty, Sustainable biocarbon from pyrolyzed perennial grasses and their effects on impact modified polypropylene biocomposites, Composites, Part B, 2017, 118, 116–124 CrossRef CAS.
- S. Meyer, B. Glaser and P. Quicker, Technical, economical, and climate-related aspects of biochar production technologies: A literature review, Environ. Sci. Technol., 2011, 45, 9473–9483 CrossRef CAS PubMed.
- B. P. Chang, A. K. Mohanty and M. Misra, Sustainable biocarbon as an alternative of traditional fillers for poly(butylene terephthalate)-based composites: Thermo-oxidative aging and durability, J. Appl. Polym. Sci., 2019, 136(27), 47722–47735 CrossRef.
- N. Tripathi, M. Misra and A. K. Mohanty, Durable Polylactic Acid (PLA)-Based Sustainable Engineered Blends and Biocomposites: Recent Developments, Challenges, and Opportunities, ACS Eng. Au, 2021, 1(1), 7–38 CrossRef CAS.
- A. K. Mohanty, S. Vivekanandhan, J. M. Pin and M. Misra, Composites from renewable and sustainable resources: Challenges and innovations, Science, 2018, 362, 536–542 CrossRef CAS PubMed.
- N. A. Mohamad Aini, N. Othman, M. H. Hussin, K. Sahakaro and N. Hayeemasae, Effect of hybrid carbon black/lignin on rheological, mechanical and thermal stability properties of NR/BR composites, Plast., Rubber Compos., 2021, 1–3 Search PubMed.
- B. Valle, A. Remiro, N. García-Gómez, A. G. Gayubo and J. Bilbao, Recent research progress on bio-oil conversion into bio-fuels and raw chemicals: a review, J. Chem. Technol. Biotechnol., 2019, 94, 670–689 CrossRef CAS.
- T. Cordero-Lanzac, J. Rodríguez-Mirasol, T. Cordero and J. Bilbao, Advances and challenges in the valorization of bio-oil: Hydrodeoxygenation using carbon-supported catalysts, Energy Fuels, 2021, 35, 17008–17031 CrossRef CAS.
- B. P. Chang, A. Rodriguez-Uribe, A. K. Mohanty and M. Misra, A comprehensive review of renewable and sustainable biosourced carbon through pyrolysis in biocomposites uses: Current development and future opportunity, Renewable Sustainable Energy Rev., 2021, 152, 111666 CrossRef CAS.
- M. F. Adesemuyi, M. A. Adebayo, A. O. Akinola, E. F. Olasehinde, K. A. Adewole and L. Lajide, Preparation and characterisation of biochars from elephant grass and their utilisation for aqueous nitrate removal: Effect of pyrolysis temperature, J. Environ. Chem. Eng, 2020, 8(6), 104507 CrossRef CAS.
- A. K. Varma and P. Mondal, Pyrolysis of sugarcane bagasse in semi batch reactor: Effects of process parameters on product yields and characterization of products, Ind. Crops Prod., 2017, 95, 704–717 CrossRef CAS.
- B. Zhao, H. Xu, T. Zhang, X. Nan and F. Ma, Effect of pyrolysis temperature on sulfur content, extractable fraction and release of sulfate in corn straw biochar, RSC Adv., 2018, 8(62), 35611 RSC.
- B. Zhao, D. O’Connor, J. Zhang, T. Peng, Z. Shen and D. C. W. Tsang, et al., Effect of pyrolysis temperature, heating rate, and residence time on rapeseed stem derived biochar, J. Cleaner Prod., 2018, 174, 977–987 CrossRef CAS.
- C. Zhao, X. Liu, A. Chen, J. Chen, W. Lv and X. Liu, Characteristics evaluation of bio-char produced by pyrolysis from waste hazelnut shell at various temperatures, Energy Sources, Part A, 2020, 1–11, DOI:10.1080/15567036.2020.1754530.
- D. M. Paleri, A. Rodriguez-Uribe, M. Misra and A. K. Mohanty, Pyrolyzed biomass from corn ethanol industry coproduct and their polypropylene-based composites: Effect of heat treatment temperature on performance of the biocomposites, Composites, Part B, 2021, 215, 108714 CrossRef CAS.
- B. Li, L. Zhao, X. Xie, D. Lin, H. Xu and S. Wang, et al., Volatile-char interactions during biomass pyrolysis: Effect of char preparation temperature, Energy, 2021, 215, 119189 CrossRef CAS.
- W. Qu, J. Yang, X. Sun, X. Bai, H. Jin and M. Zhang, Towards producing high-quality lignin-based carbon fibers: A review of crucial factors affecting lignin properties and conversion techniques, Int. J. Biol. Macromol., 2021, 189:, 768–784 CrossRef PubMed.
- H. Singh, J. I. P. Singh, S. Singh, V. Dhawan and S. K. Tiwari, A Brief Review of Jute Fibre and Its Composites, Mater. Today: Proc., 2018, 28427–28437 CAS.
- M. Ramachandran, S. Bansal and P. Raichurkar, Scrutiny of jute fiber poly-lactic acid (PLA) resin reinforced polymeric composite, J. Text. Assoc., 2016, 76(6), 372–375 Search PubMed.
- J. Gassan and A. K. Bledzki, Thermal degradation of flax and jute fibers, J. Appl. Polym. Sci., 2001, 82(6), 1417–1422 CrossRef CAS.
- X. Zhong, R. Li, Z. Wang, Y. Wang, W. Wang and D. Yu, Highly flexible, transparent film prepared by upcycle of wasted jute fabrics with functional properties, Process Saf. Environ. Prot., 2021, 146, 718–725 CrossRef CAS.
- L. Benhamadouche, M. Rokbi, H. Osmani, M. Jawaid, M. Asim and A. B. M. Supian, et al., Characterization of physical and mechanical properties of recycled jute fabric reinforced polypropylene composites, Polym. Compos., 2021, 42(10), 5435–5444 CrossRef CAS.
- N. D. Choudhury, R. S. Chutia, T. Bhaskar and R. Kataki, Pyrolysis of jute dust: Effect of reaction parameters and analysis of products, J. Mater. Cycles Waste Manage., 2014, 16(3), 449–459 CrossRef CAS.
- W. W. Ming, C. Z. Sheng, Y. J. Yong and X. Z. Peng, Changes in composition, structure, and properties of jute fibers after chemical treatments, Fibers Polym., 2009, 10(6), 776–780 CrossRef.
- K. Crombie, O. Mašek, S. P. Sohi, P. Brownsort and A. Cross, The effect of pyrolysis conditions on biochar stability as determined by three methods, GCB Bioenergy, 2013, 5(2), 122–131 CrossRef CAS.
- D. Chen, X. Yu, C. Song, X. Pang, J. Huang and Y. Li, Effect of pyrolysis temperature on the chemical oxidation stability of bamboo biochar, Bioresour. Technol., 2016, 218, 1303–1306 CrossRef CAS PubMed.
- P. Quosai, A. Anstey, A. K. Mohanty and M. Misra, Characterization of biocarbon generated by high- and low-temperature pyrolysis of soy hulls and coffee chaff: For polymer composite applications, R. Soc. Open Sci., 2018, 5(8), 171970 CrossRef PubMed.
- M. Picard, S. Thakur, M. Misra, D. F. Mielewski and A. K. Mohanty, Biocarbon from peanut hulls and their green composites with biobased poly(trimethylene terephthalate) (PTT), Sci. Rep., 2020, 10(1), 3310 CrossRef CAS PubMed.
- D. L. Pavia, G. M. Lampman, G. S. Kriz and J. A. Vyvyan, Introduction to spectroscopy, Cengage Learning, 2008 Search PubMed.
- Z. Ma, Y. Yang, Y. Wu, J. Xu, H. Peng and X. Liu, et al., In-depth comparison of the physicochemical characteristics of bio-char derived from biomass pseudo components: Hemicellulose, cellulose, and lignin, J. Anal. Appl. Pyrolysis, 2019, 140, 195–204 CrossRef CAS.
- H. Yang, R. Yan, H. Chen, D. H. Lee and C. Zheng, Characteristics of hemicellulose, cellulose and lignin pyrolysis, Fuel, 2007, 86(12–13), 1781–1788 CrossRef CAS.
- M. Brebu, T. Tamminen and I. Spiridon, Thermal degradation of various lignins by TG-MS/FTIR and Py-GC-MS, J. Anal. Appl. Pyrolysis, 2013, 104, 531–539 CrossRef CAS.
- M. Bartkowiak and R. Zakrzewski, Thermal degradation of lignins isolated from wood, J. Therm. Anal. Calorim., 2004, 295–304 CrossRef CAS.
- A. Phounglamcheik, R. Vila, N. Kienzl, L. Wang, A. Hedayati and M. Broström, et al., CO2 Gasification Reactivity of Char from High-Ash Biomass, ACS Omega, 2021, 6(49), 34115–34128 CrossRef CAS PubMed.
- A. Tomczyk, Z. Sokołowska and P. Boguta, Biochar physicochemical properties: pyrolysis temperature and feedstock kind effects, Rev. Environ. Sci. Bio/Technol., 2020, 19, 191–215 CrossRef CAS.
- X. Cao, L. Zhong, X. Peng, S. Sun, S. Li and S. Liu, et al., Comparative study of the pyrolysis of lignocellulose and its major components: Characterization and overall distribution of their biochars and volatiles, Bioresour. Technol., 2014, 155, 21–27 CrossRef CAS PubMed.
- M. R. Snowdon, A. K. Mohanty and M. Misra, A study of carbonized lignin as an alternative to carbon black, ACS Sustainable Chem. Eng., 2014, 2(5), 1257–1263 CrossRef CAS.
- T. Balint, B. P. Chang, A. K. Mohanty and M. Misra, Underutilized agricultural co-product as a sustainable biofiller for polyamide 6,6: Effect of carbonization temperature, Molecules, 2020, 25(6), 1455 CrossRef CAS PubMed.
- A. Ferrari and J. Robertson, Interpretation of Raman spectra of disordered and amorphous carbon, Phys. Rev. B: Condens. Matter Mater. Phys., 2000, 61(20), 14095–14107 CrossRef CAS.
- S. A. Dhar, T. U. Sakib and L. N. Hilary, Effects of pyrolysis temperature on production and physicochemical characterization of biochar derived from coconut fiber biomass through slow pyrolysis process, Biomass Convers. Biorefin., 2020, 1–17 Search PubMed.
- A. Y. Elnour, A. A. Alghyamah, H. M. Shaikh, A. M. Poulose, S. M. Al-Zahrani and A. Anis, et al., Effect of pyrolysis temperature on biochar microstructural evolution, physicochemical characteristics, and its influence on biochar/polypropylene composites, Appl. Sci., 2019, 9(6), 1149 CrossRef CAS.
- Z. Li, C. Reimer, M. Picard, A. K. Mohanty and M. Misra, Characterization of Chicken Feather Biocarbon for Use in Sustainable Biocomposites, Front Mater., 2020, 7, 1–12 CrossRef.
- M. Chen, C. Bao, D. Hu, X. Jin and Q. Huang, Facile and low-cost fabrication of ZnO/biochar nanocomposites from jute fibers for efficient and stable photodegradation of methylene blue dye, J. Anal. Appl. Pyrolysis, 2019, 139, 319–332 CrossRef CAS.
- A. M. Som, Z. Wang and A. Al-Tabbaa, Palm frond biochar production and characterisation, Earth Environ. Sci. Trans. R. Soc. Edinburgh, 2012, 39–50 CrossRef CAS.
- S. Kane, R. Ulrich, A. Harrington, N. P. Stadie and C. Ryan, Physical and chemical mechanisms that influence the electrical conductivity of lignin-derived biochar, Carbon Trends, 2021, 5, 100088 CrossRef.
- M. Giorcelli, M. Bartoli, A. Sanginario, E. Padovano, C. Rosso and M. Rovere, et al., High-Temperature Annealed Biochar as a Conductive Filler for the Production of Piezoresistive Materials for Energy Conversion Application, ACS Appl. Electron. Mater, 2021, 3(2), 838–844 CrossRef CAS.
Footnote |
| † Electronic supplementary information (ESI) available. See DOI: https://doi.org/10.1039/d2ma00678b |
| This journal is © The Royal Society of Chemistry 2022 |

