 Open Access Article
Preparation of C–N co-doped zirconia electrospun nanofibers and their humidity sensing properties†
Jingjing
Zhang
,
Ze
Lv
,
Lianying
Wang
 * and
Ying
Guo
 *
*
State Key Laboratory of Chemical Resource Engineering, Department of Chemistry, Beijing University of Chemical Technology, China. E-mail: guoying@mail.buct.edu.cn
First published on 9th August 2022
Abstract
Carbon and nitrogen co-doped ZrO2 (C–N/ZrO2) composites were systematically obtained via an electrospinning approach and a calcination process. The components of C and N were introduced by adding melamine to the electrospinning precursor solution. The effects of C and N doping amount on the morphology and the humidity sensing behavior of C–N/ZrO2 composites were studied. Compared with ZrO2, C–N/ZrO2 with a uniform nanofiber structure exhibits significant improvements in humidity sensing performance, such as fast response (2 s), short recovery time (15 s), negligible hysteresis (0.3195%) and excellent repeatability. The humidity sensing mechanism of the composites was explored. It turns out that the introduction of C and N components into ZrO2 facilitates charge separation and enhances electron mobility, which is an effective method to improve the sensing properties. Moreover, the nanofibers with a large specific surface area and a porous structure prepared by electrospinning provided more active sites available for the reaction with water molecules.
1. Introduction
In recent years, humidity sensors have attracted considerable attention and have been successfully applied in fields such as agriculture, medicine and industrial production.1–5 Humidity sensors can sense humidity and convert it into an electrical signal to output. Humidity-sensitive materials are the cores of the sensor, which play decisive roles in performance. Among many sensing materials, metal oxide semiconductors,6–8 polymers,9,10 and carbon materials11 are popular in the field of humidity sensing. As one of the most popular sensing materials, metal oxide semiconductors show superiorities in terms of low cost and easy preparation.12,13 However, these have the disadvantages of delayed recovery and large hysteresis, which thus limited their potential applications. Consequently, it is still difficult for metal oxide sensing materials to realize humidity sensing with all-round good performance, such as rapid response and recovery, high repeatability and stability. To improve the situation, doping, compounding, or designing a special morphology have been used by researchers.14–16To the best of our knowledge, zirconium oxide (ZrO2), with a band gap of 5.0![[thin space (1/6-em)]](https://www.rsc.org/images/entities/char_2009.gif) eV, is one of the typical metal oxide humidity sensitive materials. Due to its good optical properties, and stable chemical, mechanical, thermal and catalytic properties, it has been extensively studied by researchers.17 In the early research, I. B. Vinnik et al.18 studied a ceramic humidity sensor based on nanophase zirconium dioxide, which confirmed that pure ZrO2 was a favorable humidity sensing material. In 2013, Lu, Yi et al.17 adopted a microwave-hydrothermal method to synthesize ZrO2 nanorods, which showed a higher humidity sensor response. However, the long recovery time of the ZrO2 material normally limits its application in humidity sensing.
eV, is one of the typical metal oxide humidity sensitive materials. Due to its good optical properties, and stable chemical, mechanical, thermal and catalytic properties, it has been extensively studied by researchers.17 In the early research, I. B. Vinnik et al.18 studied a ceramic humidity sensor based on nanophase zirconium dioxide, which confirmed that pure ZrO2 was a favorable humidity sensing material. In 2013, Lu, Yi et al.17 adopted a microwave-hydrothermal method to synthesize ZrO2 nanorods, which showed a higher humidity sensor response. However, the long recovery time of the ZrO2 material normally limits its application in humidity sensing.
Among the doping methods, C–N doping shows certain advantages in improving performance. For example, Hang Li et al.19 prepared C–N/SnO2/Co3O4 microspheres with a good gas-sensitive behavior for triethylamine. The study reported that the introduction of C–N components can accelerate electron transmission and enhance the gas sensitivity properties. Wen-Yuan Yan et al.20 synthesized a sensor based on C-doped and N-doped reduced graphene oxide/TiO2 composites using a hydrothermal route for enhancing gas sensing performances. This indicated that C–N doping can greatly improve the gas response, which was attributed to the high carrier concentrations caused by the narrowing bandgap, thereby promoting gas adsorption/desorption. The works of the literature have explained that doping C–N components can get high carrier concentrations and abundant active sites, which is an effective way to improve sensing performance. To date, there are few reports on the use of C- and N-doped metal oxides in humidity sensors.
Besides, because the response of humidity mainly depends on the contact area and the interaction between the sensitive materials and water molecules,21 various methods have been used to prepare nanomaterials with different morphologies like nanoparticles,22,23 nanowires,24 nanosheets,11 and nanospheres.25 Electrospinning is a simple and versatile technique to acquire a nanofiber with a nanometer and micrometer diameter.26–28 The high-voltage power supply between the syringe needle and the collector stretches the precursor solution into a nano-scale fiber structure. One-dimensional (1D) nanostructures with high surface-to-volume ratios are promising to increase the sensitivity of materials.
In this work, a series of 1D uniform nanofibers of C–N co-doped ZrO2 composites (C–N/ZrO2-x) have been prepared by electrospinning, which is followed by a calcination process. C–N/ZrO2-x has a better performance than ZrO2 in terms of the humidity sensing behavior, such as the faster response, the shorter recovery time, and the smaller humidity hysteresis. Optimizing the doping amount of C and N by the introduction of melamine can increase the concentration of carriers, and the 1D morphology can provide a high specific surface area, both of which thereby improve the humidity-sensitive performance. Furthermore, based on the complex impedance curves of the composite materials, the sensing mechanisms have been analyzed.
2. Experimental section
Zirconium oxychloride octahydrate (ZrOCl2·8H2O) was supplied by Shanghai Macklin Biochemical Co. Ltd. Polyvinylpyrrolidone (PVP, Mw![[thin space (1/6-em)]](https://www.rsc.org/images/entities/char_2009.gif) =
= ![[thin space (1/6-em)]](https://www.rsc.org/images/entities/char_2009.gif) 130
130![[thin space (1/6-em)]](https://www.rsc.org/images/entities/char_2009.gif) 000) and ethanol (A.R.) were bought from Beijing Chemical Co. (China). Melamine was purchased from Tianjin Guangfu Fine Chemical Research Institute. In our experiments, all the chemicals were of analytical grade and used as received without further purification.
000) and ethanol (A.R.) were bought from Beijing Chemical Co. (China). Melamine was purchased from Tianjin Guangfu Fine Chemical Research Institute. In our experiments, all the chemicals were of analytical grade and used as received without further purification.
2.1 Preparation of precursor solutions
In a typical synthesis, 2 g of zirconium oxychloride octahydrate (ZrOCl2·8H2O) and 5 g of polyvinylpyrrolidone (PVP) were dispersed in a 60 ml mixed solvent of ethanol and deionized water (the volume ratio of ethanol![[thin space (1/6-em)]](https://www.rsc.org/images/entities/char_2009.gif) :
:![[thin space (1/6-em)]](https://www.rsc.org/images/entities/char_2009.gif) deionized water = 2
deionized water = 2![[thin space (1/6-em)]](https://www.rsc.org/images/entities/char_2009.gif) :
:![[thin space (1/6-em)]](https://www.rsc.org/images/entities/char_2009.gif) 1). The solution was further stirred for 12 hours to obtain a homogeneous solution for electrospinning. Moreover, 0.1 g, 0.2 g, 0.3 g, 0.4 g, and 0.5 g of C3N6H6 were dissolved in the mixture to obtain a series of precursor solutions.
1). The solution was further stirred for 12 hours to obtain a homogeneous solution for electrospinning. Moreover, 0.1 g, 0.2 g, 0.3 g, 0.4 g, and 0.5 g of C3N6H6 were dissolved in the mixture to obtain a series of precursor solutions.
2.2 Preparation of C–N/ZrO2 nanofiber materials
The as-prepared precursor solution was loaded into a plastic syringe with a stainless steel nozzle with an inner diameter of 0.40 mm. In a typical electrospinning process, the precursor solution ejected by the needle was stretched into ultra-fine fibers with diameters of nanometer-scale under an external high voltage. A piece of aluminum foil was used as a collector for gathering the fibers. The distance between the needle tip and the collector was controlled at 20 cm, the spinning voltage was set to 20 kV by a direct current (DC) stabilized power supply and the flow rate was fixed at 0.8 ml h−1. The obtained samples were added to a muffle furnace to be calcined from room temperature to 600 °C with a heating rate of 2 °C min−1 and kept at 600 °C for 4 hours. After naturally cooling down to room temperature, the final composites were obtained. According to the amount of melamine added (0.1–0.5 g), the obtained products were denoted as C–N/ZrO2-x (x = 1, 2, 3, 4, 5), respectively. A schematic diagram of the experiment process is described in Fig. 1.2.3 Fabrication and measurements of humidity sensors
A comb-like Ag–Pd interdigital electrode was used as the sensor substrate. The electrode length of the sensing device is 6.8 mm, the width is 3 mm and the gap is 0.2 mm. The grounded powder products were mixed with water to form a paste and were evenly coated on the interdigital electrode using a small brush. The sensor was dried at room temperature before the test. The humidity sensor measuring apparatus is Chemical Humidity Sensing-1 (CHS-1) (Beijing Elite Tech. Co., Ltd, China). All sensors were measured at room temperature with an alternating current (AC) voltage of 1.25 V under different relative humidity environments. The supersaturation salt solution of LiCl (11% RH), MgCl2 (33% RH), Mg (NO3)2 (54% RH), KCl (85% RH), and KNO3 (95% RH) was used to make different relative humidity environments.3. Results and discussion
To analyse the crystal structures of the composites, powder X-ray diffraction characterization (XRD: Rigaku XRD-6000 diffractometer under the conditions: 40 kV, 40 mA, Cu-Kα radiation (λ = 0.15418 nm)) was employed. The Fourier transform infrared (FTIR) spectra were recorded using a Bruker Vector-22 Fourier transform infrared spectrometer in the range of 4000–400 cm−1. The morphological characterization was carried out using a scanning electron microscope (SEM: Zeiss SUPRA 55). The states of elements were investigated by X-ray photoelectron spectroscopy (XPS: Thereto VGESCALAB 250 with the voltage of 15 kV, current of 10 mA, wide scan energy of 160 eV, and a narrow scan energy of 40 eV). The BET and pore size distribution characterizations were obtained with a fully automatic surface area and pore size analyzer, model ASAP-2460, produced by Micromeritics. The element analyzer of Elementar Vario MICRO cube was used to study the relative contents of C and N elements.3.1 Characterization of material structure and morphology
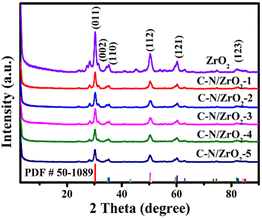
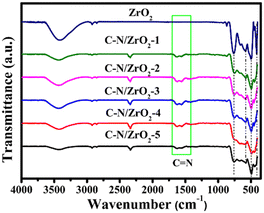
Fig. 2 shows the XRD patterns of ZrO2 and C–N/ZrO2-x (x = 1, 2, 3, 4, 5) nanofiber materials. The diffraction pattern for ZrO2 has several peaks at 30.1°, 34.4°, 35.5°, 50.4°, 60.3°, and 82.0°, corresponding to the crystalline planes (011), (002), (110), (112), (121), and (123) of the tetragonal phase ZrO2 (JCPDS NO. 50-1089), respectively. All characteristic peaks of the C–N/ZrO2-x (x = 1, 2, 3, 4, 5) composites are well-matched with ZrO2 and no impurity peaks were observed, which confirms the high purity of samples.In the FT-IR spectra, as shown in Fig. 3, several continuous peaks present the bond vibrations of the ZrO2 and C–N/ZrO2-x (x = 1, 2, 3, 4, 5) composites at 410.8 cm−1, 501.5 cm−1, 580.5 cm−1, and 762.8 cm−1, which correspond to the stretching modes of Zr–O–Zr vibrations.29,30 The broadband around 3433 cm−1 indicates the stretching of O–H bonds. In contrast with ZrO2, two exclusive infrared absorption peaks of composites appear at 1556.4 cm−1 and 1621.0 cm−1, which are the stretching vibration peaks of the carbon–nitrogen aromatic heterocyclic ring.31 The above peaks prove that C and N have been successfully doped into the material. C and N doping is believed to change the surface state and the hydrophilicity of ZrO2. Apparently, the doping enhances the hydrophobicity of the surface of the material.
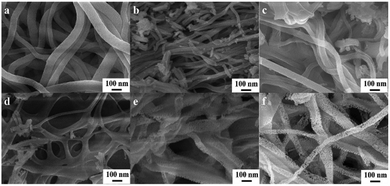
In order to study the morphology of all the samples, SEM was carried out and is shown in Fig. 4. From Fig. 4(a), it can be seen that the surface of ZrO2 after calcination is smooth and its structure is uniform. However, after C and N doping in ZrO2 (Fig. 4(b–f)), the fiber surface becomes rough and the fiber diameter decreases. As we all know, the rough surface can provide more active sites, which is believed to improve the sensing performance. Because melamine and PVP will decompose and generate small molecules during the calcination process, the structure of the holes begins to appear on the fibers as shown in Fig. 4(b and c). In addition, the number and density of holes induced by the calcination process increase with the doping amount of melamine, forming a special spiderweb-like structure of C–N/ZrO2-3, which is shown in Fig. 4(d). With a continuous increase in the amount of melamine, it is observed that the nanofibers gradually disintegrate as shown in Fig. 4(e–f). The above phenomenon may be attributed to the decomposition of melamine and PVP during the calcination process, generating gases detached from the fibers and thus resulting in a porous structure. Therefore, it is explicable that the excessive addition of melamine will disintegrate the fiber structure.
Fig. 5a shows the EDS diagram of C–N/ZrO2-3, which confirms the presence of O, N, Zr, and C in the composites. The mapping characterization of Fig. 5b was carried out to observe the distribution of each element. The overlay of O, N, Zr, and C mapping images is shown in Fig. 5(c–f), confirming that all the elements were uniformly distributed in the fiber structure.
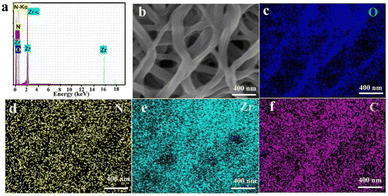 | ||
| Fig. 5 EDS spectrum (a) and the SEM image of C–N/ZrO2-3 (b), and the mapping of O (c), N (d), Zr (e) and C (f) in C–N/ZrO2-3. | ||
To further explore the compositions of all products, elemental analysis was done. Table 1 shows the elemental analysis result, which is a list of C (wt%), N (wt%), and C/N (mol%) results of C–N/ZrO2-x (x = 1, 2, 3, 4, 5). The C/N ratio of the complex increases with the increasing concentration of melamine, which is in line with the expectations. Moreover, N2 physisorption was applied to acquire the specific surface areas of all C–N/ZrO2-x (x = 1, 2, 3, 4, 5) composites, and the results are also summarized in Table 1. With the increase of the doping amount of melamine, the specific surface area of the materials tends to grow first and decline afterward. The C–N/ZrO2-3 nanocomposite has the largest specific surface area among all the samples, which may be related to its porous structure.
| Samples | C (wt%) | N (wt%) | C/N (mol%) | S BET (m2 g−1) |
|---|---|---|---|---|
| C–N/ZrO2-1 | 0.36 | 0.91 | 0.461538 | 17.5925 |
| C–N/ZrO2-2 | 0.36 | 0.78 | 0.538462 | 18.6535 |
| C–N/ZrO2-3 | 0.56 | 0.86 | 0.759690 | 21.6623 |
| C–N/ZrO2-4 | 0.54 | 0.73 | 0.863014 | 19.0307 |
| C–N/ZrO2-5 | 0.78 | 0.80 | 1.137500 | 10.6842 |
The decrease in the specific surface area of C–N/ZrO2-4 and C–N/ZrO2-5 composites might be due to the incomplete structure of the nanofibers, and excessive doping of C–N might block the micropores. Furthermore, Fig. 6 shows the pore size distribution of the composites, and it can be seen that the pore size is mainly distributed around 7.6 nm within a wide range of 0–80 nm, which reveals the formation of a porous nanofiber structure.
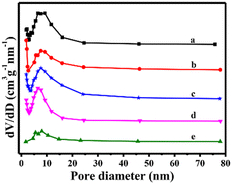 | ||
| Fig. 6 Diagrams of pore size distribution of (a) C–N/ZrO2-1, (b) C–N/ZrO2-2, (c) C–N/ZrO2-3, (d) C–N/ZrO2-4 and (e) C–N/ZrO2-5. | ||
3.2 Research on humidity sensing performance
The humidity sensing performance of hysteresis for ZrO2 and all the C–N/ZrO2-x (x = 1, 2, 3, 4, 5) composites is shown in Fig. 7. In the adsorption process, as the relative humidity increases, the resistances of all the samples gradually decrease, and every adsorption curve shows a downward trend. However, in the desorption process, as the relative humidity decreases, the resistances of all the samples increase, and every desorption curve shows an upward trend. Compared to ZrO2, the adsorption and desorption curves of the composites are similar. The hysteresis parameter is marked H (% RH) and calculated by eqn (1).32 | (1) |
 | (2) |
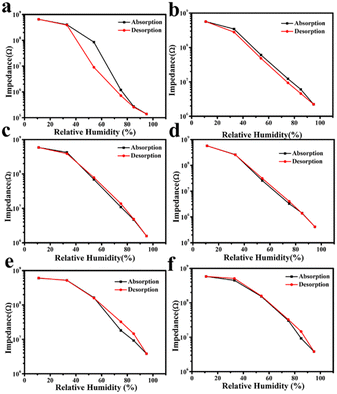 | ||
| Fig. 7 Humidity hysteresis of sensors based on (a) ZrO2, (b) C–N/ZrO2-1, (c) C–N/ZrO2-2, (d) C–N/ZrO2-3, (e) C–N/ZrO2-4 and (f) C–N/ZrO2-5. | ||
Both stability and repeatability are significant indicators for evaluating the humidity sensing performance of materials. Fig. 8 shows five humidity cycle groups of all samples, measuring their impedances under certain relative humidity which changed from 11% RH to 95% RH and then changed back to 11% RH. It can be seen that the baseline of ZrO2 shows a slightly decreasing trend after five test cycles. And along with the increase in the repeat cycle, the recovery time becomes longer and longer, which exhibits its instability and poor repeatability, while the baselines of these C–N/ZrO2-x (x = 1, 2, 3, 4, 5) composites are stable, as shown in Fig. 8(b–f). Compared with ZrO2, all the C–N/ZrO2-x (x = 1, 2, 3, 4, 5) composites have better stability and better repeatability in humidity sensing tests.
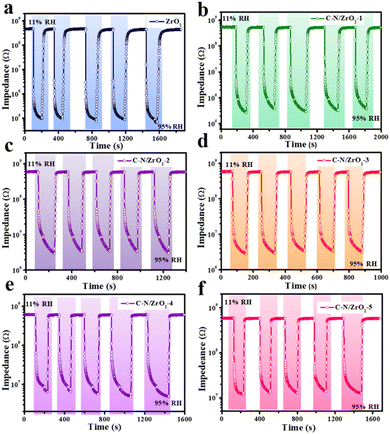 | ||
| Fig. 8 Humidity performance cycle curves of (a) ZrO2, (b) C–N/ZrO2-1, (c) C–N/ZrO2-2, (d) C–N/ZrO2-3, (e) C–N/ZrO2-4 and (f) C–N/ZrO2-5. | ||
Response and recovery time are indispensable parameters for evaluating humidity sensitivity. The response and recovery curves of ZrO2 and all composites are shown in Fig. 9. From the magnified 5th response and recovery curve (Fig. 9(a)), it can be seen that ZrO2 responds quickly (1 s) to humidity change; however, its recovery time (101 s) is very long, which implies that ZrO2 has excellent behavior in adsorption but has difficulty in desorption. The C–N/ZrO2-x (x = 1, 2, 3, 4, 5) composites can maintain the characteristics of rapid response times, which are 2 s, 4 s, 2 s, 3 s and 2 s, respectively. Compared to ZrO2, the recovery times of the C–N/ZrO2-x (x = 1, 2, 3, 4, 5) composite are significantly shortened, and are 48 s, 17 s, 15 s, 11 s, and 14 s, respectively. Specifically, the shortest recovery time in the composites is reduced to 11 s, which is almost one-tenth of the recovery time of ZrO2. There is a correlation between the amount of adsorbed water and sensitivity because the adsorption of water vapor on the surface of the material is related to electrolytic conductivity. And as the weight of the adsorbed water increases, the resistance decreases. For resistive sensors, the change in resistance is positively related to sensitivity. Therefore, when the weight of the adsorbed water increases, the electrical resistance decreases and the sensitivity increases. Regarding the humidity sensitivity (resistance change), ZrO2 has higher sensitivity than the doped ZrO2, but it is difficult for ZrO2 to desorb. The long recovery time of ZrO2 (Fig. 9a) limits its application of humidity sensing, and the doping with C and N accelerates the recovery behavior of ZrO2 in this work.
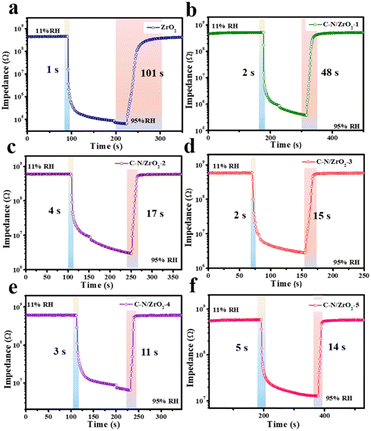 | ||
| Fig. 9 Response–recovery curves of (a) ZrO2, (b) C–N/ZrO2-1, (c) C–N/ZrO2-2, (d) C–N/ZrO2-3, (e) C–N/ZrO2-4 and (f) C–N/ZrO2-5. | ||
Besides, to analyze the humidity sensing performance of our sample, Table 2 lists the comparison results of the ZrO2-based humidity sensors in the literature and our result, including synthetic methods, response/recovery time, and measurement range. In our work, C–N/ZrO2-3 exhibits excellent humidity performance which is reflected in the short response time (2 s) and recovery time (15 s).
| Sensing materials | Synthetic methods | Res/rec time (s) | Humidity range (% RH) | Ref. |
|---|---|---|---|---|
| Graphene/ZrO2 | Sol–gel | 5/20 | 12–90 | 34 |
TiO2![[thin space (1/6-em)]](https://www.rsc.org/images/entities/char_2009.gif) : :![[thin space (1/6-em)]](https://www.rsc.org/images/entities/char_2009.gif) ZrO2 ZrO2 |
Sol–gel | 56/124 | 11–97 | 35 |
| ZnO–ZrO2 | Ultrasonic assisted wet chemical | 53/69 | 30–90 | 36 |
| ZrO2 | Hydrothermal | 5/38 | 33–95 | 37 |
| ZrO2 | Microwave-hydrothermal | 14/36 | 11–95 | 17 |
| C–N/ZrO2 | Electrospun | 2/15 | 11–95 | This work |
Compared with the other ZrO2-based humidity sensors reported in the literature, our results show faster response and recovery.
3.3 Humidity sensing mechanism
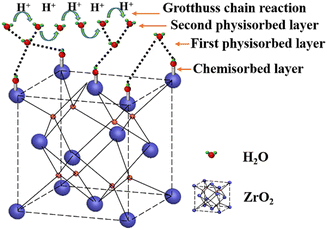
To explore the humidity sensing mechanism of the composites, the complex impedances of C–N/ZrO2 at different humidities were characterized and are shown in Fig. 10. At low humidity (Fig. 10(a and b)), the complex impedance curve presents an arc shape with a large curvature, which is close to a straight line. Few water molecules are adsorbed on the sensor under this humidity, and the resistance value of the device itself is high, showing high impedance through a straight line. As the relative humidity increases, the semi-circular arc shape of the complex impedance curve becomes more obvious. At this time, some water molecules are adsorbed on the surface of the material for chemisorption. Under the action of a strong electrostatic field, water molecules are ionized to generate hydrogen protons for conduction, and the conduction mode at this time is proton conduction. At medium RH (Fig. 10(c–e)), it can be observed that all the figures consist of a semicircle and a straight line. The straight line behind the semicircle is known as Warburg impedance,38 presenting the diffusion process of water molecules or charge carriers. It indicates that at this humidity, the carrier diffusion process begins. Along with the increase of RH, water molecules adsorbed on the chemical adsorption layer form a physical adsorption layer. At this moment, more water molecules and the ionized H+ together form H3O+. According to the ion transport theory of Grotthuss,39 H2O + H3O+ → H3O+ + H2O, H3O+ acts as a carrier to accelerate conduction, which makes the impedance drop rapidly. Therefore, under medium and high humidity, the conductive form is coexistent proton conduction and ion conduction. Furthermore, at high humidity like 95% RH (Fig. 10(f)), the semi-circular curve almost disappears and the straight line dominates, Apparently, the conductive form is mainly ion conduction.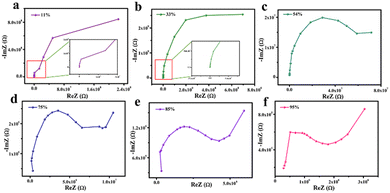 | ||
| Fig. 10 Complex impedances of the sensors based on C–N/ZrO2-3 under different humidity environments, (a) 11% RH, (b) 33% RH, (c) 54% RH, (d) 75% RH (e) 85% RH and (f) 95% RH. | ||
In general, when being exposed to low RH, a few water molecules are chemically adsorbed on the surface of the material, forming a discontinuous water film. Due to the electrostatic attraction, OH− and Zr4+ are assembled by chemical adsorption. H+ is attracted to the adjacent surface O2− ion to form new OH−.17 With the increase of RH, the subsequent water molecules are physically adsorbed on the chemisorbed H2O layer (Fig. 11). At high humidity, H3O+ dominates conduction progress in a continuous and dense water layer.
4. Conclusions
In this article, the C–N/ZrO2-x (x = 1, 2, 3, 4, 5) composites with a nanofiber structure were prepared by electrospinning and calcination processes. Compared to the ZrO2 sensor, the humidity sensing performances of the C–N co-doped ZrO2 sensors were enhanced. Zirconia shows a slow recovery time (101 s), while the recovery time of C–N/ZrO2-x (x = 1, 2, 3, 4, 5) composites is significantly shortened. Among them, the C–N/ZrO2-3 composite has the best performance: high sensitivity, fast response time (2 s), rapid recovery time (15 s), negligible hysteresis (H = 0.3195%) and good repeatability. It is believed that the co-doping of the C–N component can increase the concentration of the carrier and accelerate the adsorption and desorption of water molecules. In addition, the one-dimensional nanofiber structure provides a higher specific surface area and more active sites, allowing more water molecules to react on the surface of materials. This proves that it is an effective way to improve the humidity sensing property by co-doping C and N combined with the 1D morphology.Author contributions
J. Z.: synthesis, characterization, analysis and writing; Z. L.: synthesis, characterizations; L. W.: investigation; Y. G.: supervision, review and editing.Conflicts of interest
There are no conflicts to declare.Acknowledgements
This work was supported by the National Natural Science Foundation of China (NSFC 21627813, 51472021, 52072022) and Fundamental Research Funds for the Central Universities (XK1802-6, 12060093063).References
- M. Tsai, P. Su and C. Lu, Sens. Actuators, B, 2020, 324, 128728 CrossRef CAS.
- C. Chen, X. Wang, M. Li, Y. Fan and R. Sun, Sens. Actuators, B, 2018, 255, 1569–1576 CrossRef CAS.
- Z. Chen and C. Lu, Sens. Lett., 2005, 3, 274–295 CrossRef CAS.
- C. Zhou, X. Zhang, N. Tang, Y. Fang, H. Zhang and X. Duan, J. Nanotechnol., 2019, 31, 125302 CrossRef PubMed.
- D. Zhang, Z. Xu, Z. Yang and X. Song, Nano Energy, 2020, 67, 104251 CrossRef CAS.
- P. Pascariu, A. Airinei, N. Olaru, I. Petrila, V. Nica, L. Sacarescu and F. Tudorache, Sens. Actuators, B, 2016, 222, 1024–1031 CrossRef CAS.
- C. L. Qin Kuang, Z. Lin Wang, Z. Xie and L. Zheng, J. Am. Chem. Soc., 2007, 129, 6070–6071 CrossRef PubMed.
- S. A. Arote, A. S. Pathan, Y. V. Hase, P. P. Bardapurkar, D. L. Gapale and B. M. Palve, Ultrason. Sonochem., 2019, 55, 313–321 CrossRef CAS PubMed.
- M. Z. Yang, C. L. Dai and W. Y. Lin, Sensors, 2011, 11, 8143–8151 CrossRef CAS PubMed.
- X. Wang, B. Ding, J. Yu and M. Wang, J. Mater. Chem., 2011, 21, 16231–16238 RSC.
- W. Meng, S. Wu, X. Wang and D. Zhang, Sens. Actuators, B, 2020, 315, 128058 CrossRef CAS.
- J. Cao, N. Zhang, S. Wang, C. Chen and H. Zhang, Sens. Actuators, B, 2020, 305, 127475 CrossRef CAS.
- C. Fan, F. Sun, X. Wang, M. Majidi, Z. Huang, P. Kumar and B. Liu, J. Mater. Sci., 2020, 55, 7702–7714 CrossRef CAS.
- R. Si, X. Xie, T. Li, J. Zheng, C. Cheng, S. Huang and C. Wang, ACS Sens., 2020, 5, 1345–1353 CrossRef CAS PubMed.
- P. M. Faia and J. Libardi, Sens. Actuators, B, 2016, 236, 682–700 CrossRef CAS.
- D. Zhang, H. Chang, Y. E. Sun, C. Jiang, Y. Yao and Y. Zhang, Sens. Actuators, B, 2017, 252, 624–632 CrossRef CAS.
- Y. Lu, Z. Wang, S. Yuan, L. Shi, Y. Zhao and W. Deng, RSC Adv., 2013, 3, 11707 RSC.
- I. V. U. I. B. Vinnik and V. S. Zenkov, Powder Metall. Met. Ceram., 1998, 37, 632–634 CrossRef CAS.
- H. Li, J. Guo, S. Chu, H. Li, Q. Zhang, Z. Lin and Q. Ma, Phys. Lett. A, 2021, 387, 127023 CrossRef CAS.
- W. Yan, Q. Zhou, X. Chen, X. Huang and Y.-C. Wu, Sens. Actuators, B, 2016, 230, 761–772 CrossRef CAS.
- M. N. Tetsuo Morimoto and F. Tokuda, J. Phys. Chem., 1969, 73, 243–248 CrossRef.
- G. Dubourg, M. Radovic and B. Vasic, Nanomaterials, 2021, 11, 80 CrossRef CAS PubMed.
- D. Zhang, H. Chang, P. Li and R. Liu, J. Mater. Sci.: Mater. Electron., 2016, 27, 3723–3730 CrossRef CAS.
- Z. Chen, T. Chang, K. Su, H. Lee and J. Wang, Sens. Actuators, B, 2021, 327, 1289304 Search PubMed.
- Z. Wang, K. Yu, Y. Feng, R. Qi, J. Ren and Z. Zhu, Appl. Surf. Sci., 2019, 496, 143729 CrossRef CAS.
- J. Xue, T. Wu, Y. Dai and Y. Xia, Chem. Rev., 2019, 119, 5298–5415 CrossRef CAS PubMed.
- I. Kim and A. Rothschild, Polym. Adv. Technol., 2011, 22, 318–325 CrossRef CAS.
- B. Ding, M. Wang, J. Yu and G. Sun, Sensors, 2009, 9, 1609–1624 CrossRef CAS PubMed.
- M. Guo, G. Wang, Y. Zhao, H. Li, K. Tang, Y. Zhao and K. Burgess, Ceram. Int., 2021, 47, 12425–12432 CrossRef CAS.
- N. Mahendran, S. J. Jeyakumar and M. Ponnar, J. Mater. Sci.: Mater. Electron., 2021, 32, 23399–23411 CrossRef CAS.
- P. Balasubramanian, M. Annalakshmi, S. M. Chen and T. W. Chen, Ultrason. Sonochem., 2019, 50, 96–104 CrossRef CAS PubMed.
- Z. Lv, Q. Chen and Y. Guo, Solid State Sci., 2020, 109, 106393 CrossRef CAS.
- U. Kalsoom, S. Waheed and B. Paull, ACS Appl. Mater. Interfaces, 2020, 12, 4962–4969 CrossRef CAS PubMed.
- T. Wang and R. Wu, Sens. Mater., 2018, 30, 1297–1306 Search PubMed.
- K. P. Biju and M. K. Jain, Sens. Actuators, B, 2008, 128, 407–413 CrossRef CAS.
- S. Arote, A. Pathan, Y. Hase, P. Bardapurkar, D. Gapale and B. Palve, Ultrason. Sonochem., 2019, 55, 313–321 CrossRef CAS PubMed.
- Z. Wang, Y. Lu, S. Yuan, L. Shi, Y. Zhao, M. Zhang and W. Deng, J. Colloid Interface Sci., 2013, 396, 9–15 CrossRef CAS PubMed.
- D. Zhang, M. Wang, W. Zhang and Q. Li, Sens. Actuators, B, 2020, 304, 127234 CrossRef CAS.
- B. M. Kulwicki, J. Am. Ceram. Soc., 1991, 74, 697–708 CrossRef CAS.
Footnote |
| † Electronic supplementary information (ESI) available. See DOI: https://doi.org/10.1039/d2ma00532h |
| This journal is © The Royal Society of Chemistry 2022 |


