DOI:
10.1039/D2MA00519K
(Paper)
Mater. Adv., 2022,
3, 6050-6061
Broad-band sensitized visible up-conversion in Y2Mg3Ge3O12:Ni2+,Er3+,Nb5+ phosphors†
Received
9th May 2022
, Accepted 17th June 2022
First published on 18th June 2022
Abstract
Ni2+, Er3+, Nb5+ tri-doped Y2Mg3Ge3O12 phosphors have been fabricated using a conventional solid-phase reaction method. Near infrared light in the wavelength range of 900–1700 nm can be up-converted by the phosphors into visible emissions peaking at 532 nm, 555 nm and 675 nm of Er3+, performed by the Ni2+ → Er3+ and Er3+ → Er3+ energy transfers. The introduction of Nb5+ ions can adjust the local environment of Ni2+ and Er3+ ions and thus effectively reduces their nonradiative transition probability, which largely enhances the intensity of up-conversion emission. The effects of Ni2+ and Er3+ concentration together with the excitation power on the fluorescence properties have been investigated. The Y2Mg3Ge3O12:0.015Ni2+,0.13Er3+,0.06Nb5+ phosphor manifests the optimal UC emission effectiveness in this work, in which the energy transfer sensitization from Ni2+ → Er3+ induced by quadrupole-quadrupole interaction is as high as 92.1%. The developed broadband near-infrared excitable up-conversion materials are promising for extensive photonic applications, including c-Si solar cells and infrared detectors.
1. Introduction
As the research on rare earth (RE) ion doped up-conversion (UC) materials has continued, many UC materials with different characteristics have been created. They have attracted a lot of attention owing to their excellent properties and special characteristics for multi-color displays, optical processing sensors, solid-state lasers, optical data storage, solar cells, infrared detection, photodynamic therapy, bioimaging and other fields.1–8 With the increasing emphasis on green energy, especially since solar radiation is a readily available renewable energy source, the high-efficiency utilization of solar radiation has received a lot of attention in the field of photovoltaics. Because of the Shockley–Queisser (S–Q) limit, however, the efficiencies of the current solar cells are still not satisfactory. To illustrate, the typical single-junction crystalline silicon solar cell currently has a peak conversion efficiency of only 33% for solar energy. The crystalline silicon solar cell has an absorption threshold of about 1127 nm, which is wasteful of solar radiation energy in the near-infrared (NIR) region.9–14 Fortunately, the UC process that can convert the near-infrared wavelength to the usable wavelength of solar cells seems to be an effective way to solve this problem.15–17
In the case of UC materials, Yb3+ ions can be doped widely as a sensitizer ion to improve the optical pump efficiency of activator ions including Er3+, Tm3+ and Ho3+. For example, the UC emission of 500–700 nm is obtained for β-NaYF4:17%Yb3+,3%Er3+ at 980 nm excitation, and its UC quantum efficiency (QE) is 10.5% at an excitation power density of 30 W cm−2. Other high-efficiency UC materials including BaF2:3%Yb3+,2%Er3+ (QE = 10.0% at excitation power density 490 W cm−2), La2O2S:9%Yb3+,1%Er3+ (QE = 5.8% at excitation power density of 13 W cm−2), and BaY2ZnO5:7%Yb3+,3%Er3+ (QE = 5% at excitation power density of 2.2 W cm−2) have also been reported.18–21 This is attributed to the large absorption cross section of Yb3+ at around 980 nm and the efficient energy transfer (ET) from Yb3+ to the activator ion.22–24 Regretfully, the narrow absorption bandwidth of Yb3+ due to its parity forbidden 4f–4f transition, limits the practical application of the Yb3+ sensitized UC phosphor in some fields such as solar cell efficiency enhancement and infrared detection. Thus, it is expected to break through the bottleneck of traditional UC phosphor to find new sensitizers that can absorb infrared light in a wide wavelength and transfer the absorbed energy to the activator ions such as Er3+, Tm3+ and Ho3+. It was reported recently that dye-sensitized core/shell nanocrystals can capture photons over a broad range of wavelengths (720–1000 nm) and significantly enhance the overall UC efficiency.25 On the other hand, as transition metal ions (Ni2+, Cr3+, etc.) have been widely studied, they have demonstrated satisfactory wavelength-tunable fluorescence properties due to their customary 3dn electron structure and sensitivity to the surrounding crystal field environment.26–28 As a consequence of their properties of a wider absorption band than that of Yb3+, some transition metal ions are also used as sensitizers in some UC phosphors. For example, in the Cr3+–Er3+ double-doped La3Ga5GeO14, UC emission of Er3+ in the 510–570 nm region under 620 nm excitation sensitized by the Cr3+ has been observed.29,30 Similarly, UC emission of Er3+/Tm3+ sensitized by Ni2+ has also been realized in phosphors such as (Mg, Ca, Sr, Ba)TiO3:Ni2+,Er3+, MgGa2O4:Ni2+,Er3+, LiGa5O8:Ni2+,Tm3+, La(Ga, Sc, In)O3:Ni2+,Er3+, etc.31–37 Therefore, Ni2+ sensitized UC phosphors might be promising materials for up-converting photons in a wide near infrared wavelength region into a higher energy photon due to the broad band absorption of Ni2+.
Phosphors based on Y2Mg3Ge3O12 have been reported several times in very recent years, including Mg3Y2Ge3O12:Ce3+, Mg3Y2Ge3O12:Sm3+, Mg3Y2−x−yGe3O12:xTb3+,yEu3+, and Y2Mg3Ge3O12:Mn4+,Li+, etc.38–41 Y2Mg3Ge3O12 has a garnet structure, and it has three cationic sites with different valence states (+2, +3, +4) that can accommodate the insertion of various RE ions and transition metal ions. This means that the Y2Mg3Ge3O12 matrix is possibly a suitable environment for performing the Ni2+ sensitized UC of RE ions. In the current study, therefore, Ni2+, Er3+, Nb5+ tri-doped Y2Mg3Ge3O12 phosphors have been fabricated and broad band NIR light in the wavelength range of 900–1700 nm to visible UC has been used for the first time.
2. Experimental methods
2.1. Materials synthesis
With a conventional high temperature solid-phase reaction method, a range of samples with polycrystalline powder, Y2Mg3(1−x)Ge3O12:xNi2+ (x = 0.005, 0.015, 0.025, 0.035, 0.045 and 0.055), Y2(1−y)Mg3(1−x−z)Ge3O12:xNi2+,yEr3+,zNb5+ (x = 0, 0.001 and 0.015, y = 0, 0.001 and 0.11, z = 0, 0.015, 0.03, 0.045, 0.06 and 0.075), and Y2(1−y)Mg3(1−x−0.06)Ge3O12:xNi2+,yEr3+,0.06Nb5+ (x = 0.005, 0.01, 0.015, 0.02, 0.025, y = 0.11, y = 0.05, 0.07, 0.09, 0.11, 0.13, 0.15, 0.17 and x = 0.015) were prepared. The powders MgO (AR), Y2O3 (99.99%), GeO2 (99.99%), NiO (AR), Er2O3 (99.99%) and Nb2O5 (AR) were weighed according to the stoichiometric amounts as raw materials. The weighed raw materials were fully ground and mixed in an agate mortar, and the mixtures were subsequently transferred into corundum crucibles. The mixtures were calcined at a temperature of 1500 °C for 7 hours in an electric furnace under an air atmosphere. Eventually, the products were taken out after waiting for natural cooling to room temperature as well as being milled again into powders for further characterization.
2.2. Characterization
In order to identify the purity of the crystalline phase in the sample, X-ray diffraction (XRD) patterns were analyzed which were documented using a Bruker D8 Focus Diffractometer (Instrument Model: PIGAKV Ultima IV Device) utilizing Cu/Kα (λ = 0.1541 nm) radiation over the 2θ scale in the range of 10° to 90° with a scan step of 0.02° and a scan rate of 10° min−1. The absorption spectra of the samples doped with Ni2+ and Er3+ were analyzed using a Hitachi UH5700 Spectrophotometer (Integrating Sphere) running at a scan step of 1 nm. The UC emission and Stokes emission spectra were analyzed by using the diode lasers of 455 nm, 980 nm, 1064 nm, 1342 nm, and 1550 nm as well as a 150 watt xenon lamp as the excitation sources on a monochromator (Zolix Instrument, Omni-λ320i) which was equipped with a photomultiplier tube (PMTHS1-R928) and a data acquisition system with a scan step of 1 nm. The sample was placed in a solid sample holder. The powder sample was kept in a small hollow metal container and the container was filled with the powder. Then, the surface of the powder was made smooth by pressing with a glass slide in order to make sure all measurements were done on an equal amount of material. Moreover, the sample was placed between the excitation and emission monochromator in such a way that the emitted light signal from the sample was directed at 90° with respect to the incident light. Great care was taken in the setup to assure the material was placed in the exact same measuring position for each measurement. The time decay curves were analyzed using the FLS980 (Edinburgh) spectrometer operating at 380 nm, 455 nm and 1064 nm excitation. All the measurements were performed at room temperature.
3. Results and discussion
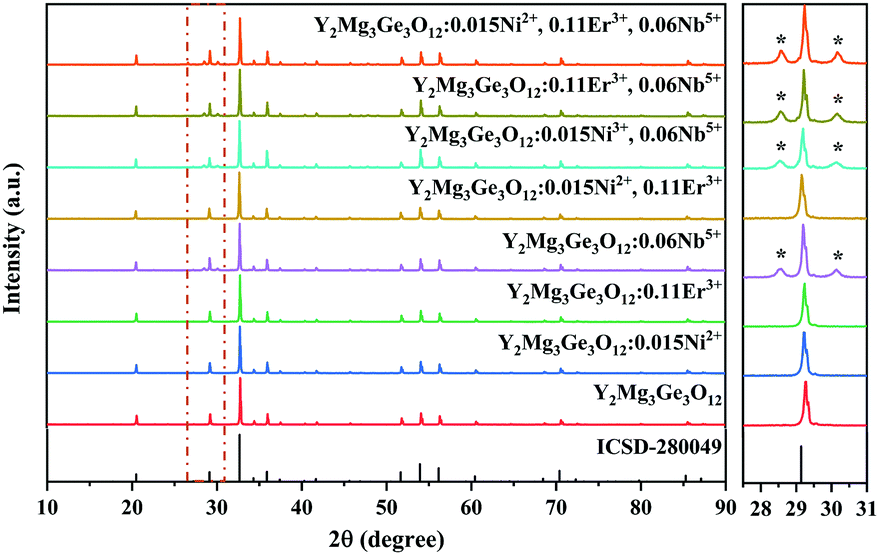
Y2Mg3Ge3O12 has a garnet structure with the space group Ia![[3 with combining macron]](https://www.rsc.org/images/entities/char_0033_0304.gif) d (230). Its cations occupy a total of three different sites. In detail, Y3+ and one third of Mg2+ occupy the center of the dodecahedra. The remaining two-thirds of Mg2+ occupy the sites of the octahedral centers and Ge4+ is located in the tetrahedral sites. Fig. 1 shows the enlargement of the crystal structure of Y2Mg3Ge3O12. Table 1 shows the effective ionic radius of the different ions. Due to the similar effective ionic radius and the same chemical valences, the doped Ni2+ and Er3+ can well replace the lattice sites of Mg2+ and Y3+ in the Y2Mg3Ge3O12 matrix, respectively. It is well-known that Ni2+ usually exhibits the habit of preferentially occupying the octahedral site.27 After Ni2+ is doped into the Y2Mg3Ge3O12 matrix, therefore, it is going to occupy the octahedral Mg2+ site. It is found that Nb5+ ions can replace the ions with valence +1, +2 and +3.42,43 Therefore, Nb5+ might occupy both Mg2+ and Y3+ sites. When a Nb5+ ion occupies a Mg2+ site, a Y3+ ion vacancy will be created. When a Nb5+ ion occupies a Y3+ site, a Mg2+ ion vacancy will be created. Thus, the vacancies induced by the doped Nb5+ ions will cause distortion of the lattice host, which might reduce the local symmetry of Ni2+ and Er3+ luminescence centers and is beneficial to improve their luminescent properties. The XRD patterns of some prepared samples are given in Fig. 2, including the Y2Mg3Ge3O12 host, Ni2+, Er3+ and Nb5+ mono-doped Y2Mg3Ge3O12, Ni2+, Er3+ double-doped, Er3+, Nb5+ double-doped and Ni2+, Nb5+ double-doped Y2Mg3Ge3O12 and Ni2+, Er3+, Nb5+ tri-doped Y2Mg3Ge3O12. Most of the diffraction peaks for these samples could be in good agreement with the standard card data of Y2Mg3Ge3O12 (PDF#89-6603). By careful comparison, however, two impurity peaks are found at two thetas of 28.6 and 30.2 degrees in the sample doped with Nb5+, which likely belong to YNbO4 (PDF#72-2077). Fortunately, the content of the impurity is relatively slight and the XRD pattern of the main phase Y2Mg3Ge3O12 has not been interfered with, meaning that the impurity has no effect on the crystal structure of the phosphors.
d (230). Its cations occupy a total of three different sites. In detail, Y3+ and one third of Mg2+ occupy the center of the dodecahedra. The remaining two-thirds of Mg2+ occupy the sites of the octahedral centers and Ge4+ is located in the tetrahedral sites. Fig. 1 shows the enlargement of the crystal structure of Y2Mg3Ge3O12. Table 1 shows the effective ionic radius of the different ions. Due to the similar effective ionic radius and the same chemical valences, the doped Ni2+ and Er3+ can well replace the lattice sites of Mg2+ and Y3+ in the Y2Mg3Ge3O12 matrix, respectively. It is well-known that Ni2+ usually exhibits the habit of preferentially occupying the octahedral site.27 After Ni2+ is doped into the Y2Mg3Ge3O12 matrix, therefore, it is going to occupy the octahedral Mg2+ site. It is found that Nb5+ ions can replace the ions with valence +1, +2 and +3.42,43 Therefore, Nb5+ might occupy both Mg2+ and Y3+ sites. When a Nb5+ ion occupies a Mg2+ site, a Y3+ ion vacancy will be created. When a Nb5+ ion occupies a Y3+ site, a Mg2+ ion vacancy will be created. Thus, the vacancies induced by the doped Nb5+ ions will cause distortion of the lattice host, which might reduce the local symmetry of Ni2+ and Er3+ luminescence centers and is beneficial to improve their luminescent properties. The XRD patterns of some prepared samples are given in Fig. 2, including the Y2Mg3Ge3O12 host, Ni2+, Er3+ and Nb5+ mono-doped Y2Mg3Ge3O12, Ni2+, Er3+ double-doped, Er3+, Nb5+ double-doped and Ni2+, Nb5+ double-doped Y2Mg3Ge3O12 and Ni2+, Er3+, Nb5+ tri-doped Y2Mg3Ge3O12. Most of the diffraction peaks for these samples could be in good agreement with the standard card data of Y2Mg3Ge3O12 (PDF#89-6603). By careful comparison, however, two impurity peaks are found at two thetas of 28.6 and 30.2 degrees in the sample doped with Nb5+, which likely belong to YNbO4 (PDF#72-2077). Fortunately, the content of the impurity is relatively slight and the XRD pattern of the main phase Y2Mg3Ge3O12 has not been interfered with, meaning that the impurity has no effect on the crystal structure of the phosphors.
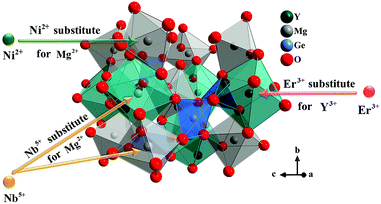 |
| | Fig. 1 Enlargement of the crystal structure of Y2Mg3Ge3O12. | |
Table 1 Effective ionic radius at the different coordination numbers (CN)
| Ion |
CN = 8 |
CN = 6 |
CN = 4 |
| Y3+ |
Mg2+ |
Nb5+ |
Er3+ |
Mg2+ |
Ni2+ |
Nb5+ |
Ge4+ |
| Ionic radius (Å) |
1.019 |
0.89 |
0.74 |
1.004 |
0.72 |
0.69 |
0.64 |
0.39 |
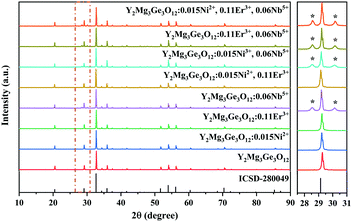 |
| | Fig. 2 XRD patterns of the Y2Mg3Ge3O12 host, Ni2+, Er3+ and Nb5+ mono-doped Y2Mg3Ge3O12,Ni2+,Er3+ double-doped, Er3+, Nb5+ double-doped and Ni2+, Nb5+ double-doped Y2Mg3Ge3O12 and Ni2+, Er3+, Nb5+ tri-doped Y2Mg3Ge3O12. | |
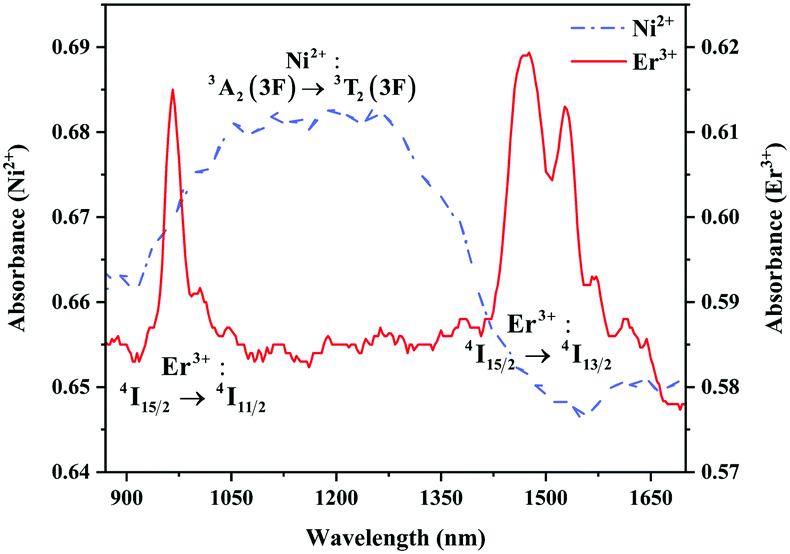
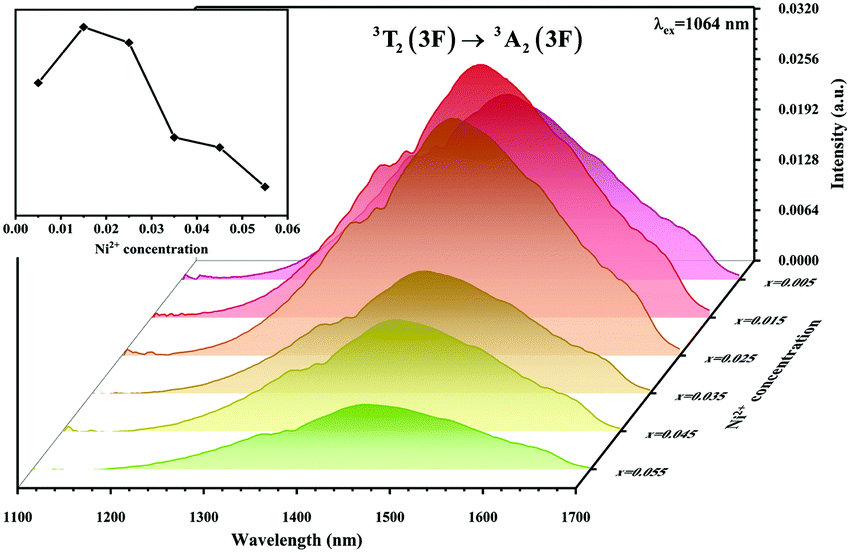
The absorption spectra of 0.015Ni2+ mono-doped and 0.11Er3+ mono-doped Y2Mg3Ge3O12 powders in the range of 870–1700 nm are given in Fig. 3. For the Ni2+ mono-doped sample, a broad and strong absorption band in the range of 900–1600 nm is observed, which is due to the spin-allowed d–d transition from 3A2(3F) to 3T2(3F) of Ni2+ substituting the octahedral Mg2+. The Er3+ mono-doped sample has two absorbing bands peaking at 966 nm and 1500 nm, respectively. They are ascribed to the f–f transitions of Er3+ ions from the ground state (4I15/2) to the 4I11/2 and 4I13/2 excited states, respectively. The absorption of Er3+ and Ni2+ ions together forms a wide absorption band covering from 900 nm to 1700 nm. Fig. 4 shows the NIR emission spectra of Y2Mg3Ge3O12:xNi2+ (x = 0.005, 0.015, 0.025, 0.035, 0.045 and 0.055) samples under excitation of 1064 nm. The excitation light of 1064 nm is located exactly in the absorption band of Ni2+: 3A2 → 3T2. The Ni2+ mono-doped sample exhibits broadband NIR emission within the 1100 nm to 1700 nm range due to its 3T2 → 3A2 transition. The NIR emission intensity reaches the maximum at the concentration of Ni2+ up to 0.015 and then begins to decrease at higher Ni2+concentration due to the concentration quenching effect.
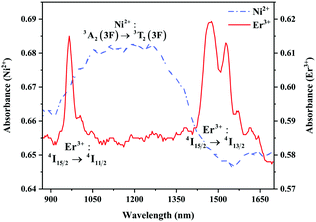 |
| | Fig. 3 Absorption spectra of 0.015Ni2+ mono-doped and 0.11Er3+ mono-doped Y2Mg3Ge3O12. | |
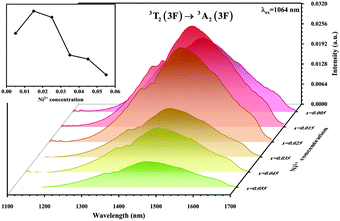 |
| | Fig. 4 NIR emission spectra of Y2Mg3Ge3O12: xNi2+ (x = 0.005, 0.015, 0.025, 0.035, 0.045 and 0.055) samples under 1064 nm excitation. The inset shows the effect of Ni2+ concentrations on the NIR emission intensity. | |
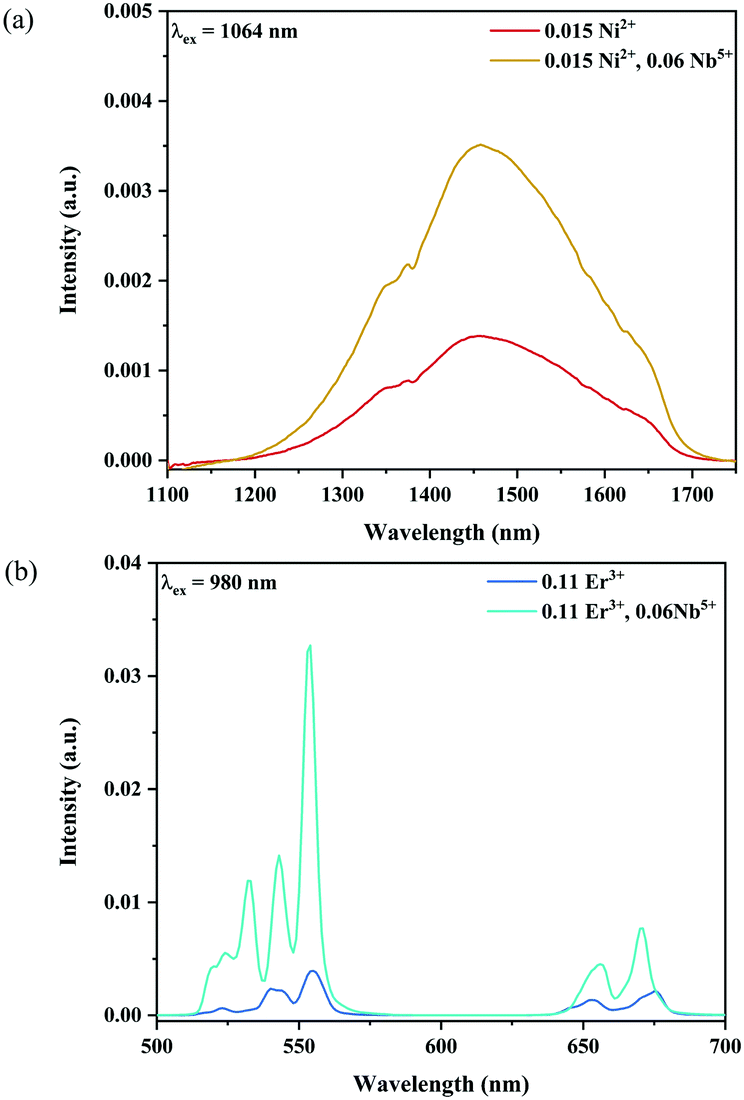
The UC emission spectra of Ni2+ mono-doped, Er3+ mono-doped, and Ni2+, Er3+ double-doped Y2Mg3Ge3O12 samples in the 500–700 nm range under 980 nm and 1064 nm excitation are shown in Fig. 5. The UC emission of the Er3+ mono-doped and Ni2+, Er3+ double-doped samples at 980 nm excitation is clearly observed in Fig. 5a, which originates from the Er3+: 4F9/2 → 4I15/2 transition (675 nm), Er3+: 4S3/2 → 4I15/2 transition (555 nm) and Er3+: 2H11/2 → 4I15/2 transition (532 nm), respectively. On the other hand, although the 980 nm and 1064 nm light both fall into the Ni2+: 3A2 → 3T2 absorption band, the UC emission is not observed in the Ni2+ mono-doped sample either with the excitation of 980 nm or 1064 nm. This implies that the Er3+ ions can conduct the UC process with the excitation at 980 nm, while the Ni2+ ion cannot perform the UC by itself. Not surprisingly, the Er3+ mono-doped sample also does not give UC emission under 1064 nm excitation since the incident 1064 nm phonon cannot be absorbed by Er3+ ions (in Fig. 5b). Of interest, relatively obvious UC emission at 675 nm and 555 nm originating from the Er3+: 4F9/2 → 4I15/2 and 4S3/2 → 4I15/2 transitions and a weak UC emission at 532 nm originating from the Er3+: 2H11/2 → 4I15/2 transition are detected for the Ni2+, Er3+ double-doped sample under the excitation of 1064 nm. This illustrates that the incident 1064 nm photon is absorbed by the Ni2+ ion and then the Er3+ is sensitized by the energy transfer from the Ni2+ ion to the Er3+ ion, resulting in the emissions at 675 nm, 555 nm and 532 nm. The different UC properties of the Ni2+, Er3+ mono-doped and Ni2+, Er3+ double-doped Y2Mg3Ge3O12 with the excitation of 1064 nm and 980 nm prove the occurrence of the Ni2+ → Er3+ energy transfer sensitization. It should be noted that no UC emission has been observed in the Ni2+ doped YNbO4, Er3+ doped YNbO4 and Ni2+, Er3+ co-doped YNbO4 samples under 1064 nm excitation (as shown in Fig. S1, ESI†), which implies that the UC emission of Er3+ sensitized by Ni2+ is only performed in the Y2Mg3Ge3O12 host.
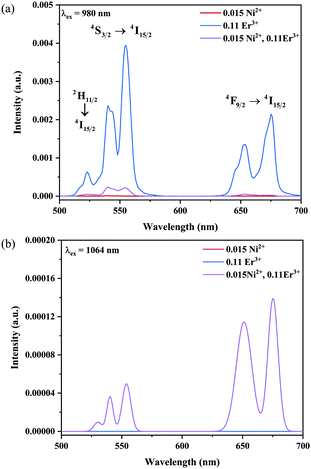 |
| | Fig. 5 UC emission spectra of the Ni2+ mono-doped, Er3+ mono-doped and Ni2+, Er3+ double-doped Y2Mg3Ge3O12 samples with excitation at 980 nm and 1064 nm. | |
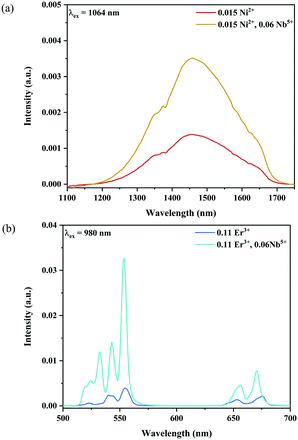
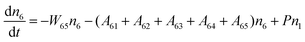
Fig. 6 and 7 show the effects of the samples on the luminescence intensity with the introduction of Nb5+ ions. In Fig. 6, it can be observed that the UC luminescence intensity of the Ni2+, Er3+ and Nb5+ tri-doped samples is significantly enhanced compared with that of the Ni2+, Er3+ double-doped sample with the excitation at 1064 nm. When the Nb5+ concentration is 0.06, the total UC emission intensity is increased by 22 times. Fig. 7 also shows the effect of Nb5+ on the emission of the Ni2+ mono-doped and Er3+ mono-doped samples, respectively. The Ni2+: 3T2 → 3A2 emission intensity of the 0.015Ni2+, 0.06Nb5+ double-doped sample is enhanced by 1.5 times compared with that of the 0.015Ni2+ mono-doped sample under 1064 nm excitation. Meanwhile, the UC emission intensity of the 0.11Er3+, 0.06Nb5+ double-doped sample is significantly enhanced in the range of 500–700 nm compared with that of the 0.11Er3+ mono-doped sample under 980 nm excitation. It is found that the intensities of the UC emission bands at 532 nm, 555 nm and 675 nm for the 0.11Er3+, 0.06Nb5+ double-doped sample are enhanced by 11.7, 4.3 and 1.8 times as compared with that of the 0.11Er3+ mono-doped sample, respectively. In a word, the introduction of Nb5+ ions can improve the luminescence properties of Ni2+ and Er3+ simultaneously.
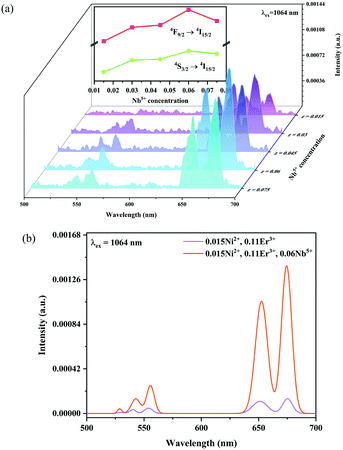 |
| | Fig. 6 1064 nm excited UC emission spectra for Y2Mg3Ge3O12:0.015Ni2+,0.11Er3+,zNb5+ (z = 0.015, 0.03, 0.045, 0.06 and 0.075) (a), and 1064 nm excited UC spectral comparison for the Ni2+, Er3+ double-doped and Ni2+, Er3+ and Nb5+ tri-doped samples (b). The inset shows the variation of green and red emission intensities with the Nb5+ ion concentrations, respectively. | |
 |
| | Fig. 7 NIR emission spectra of the Ni2+ mono-doped and Ni2+, Nb5+ double-doped samples excited at 1064 nm (a), and UC emission spectra of the Er3+ mono-doped and Er3+, Nb5+ double-doped samples excited at 980 nm (b). | |
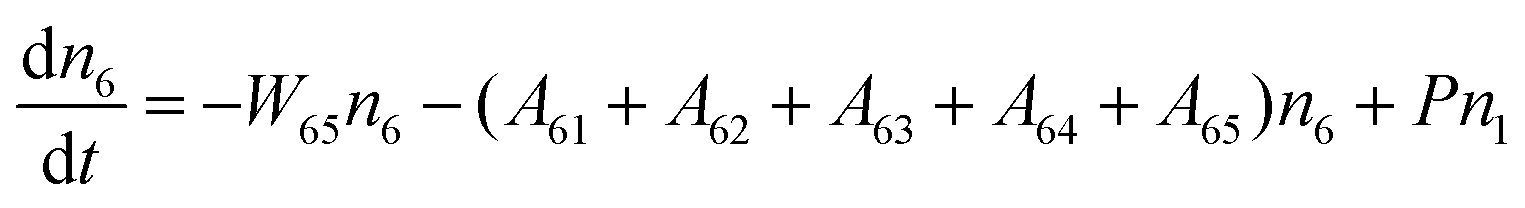
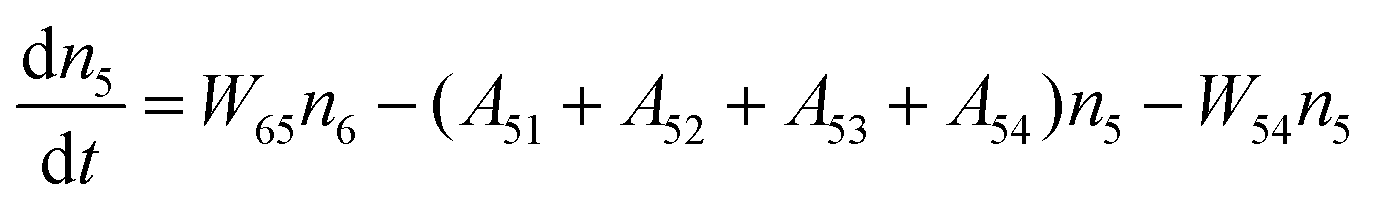
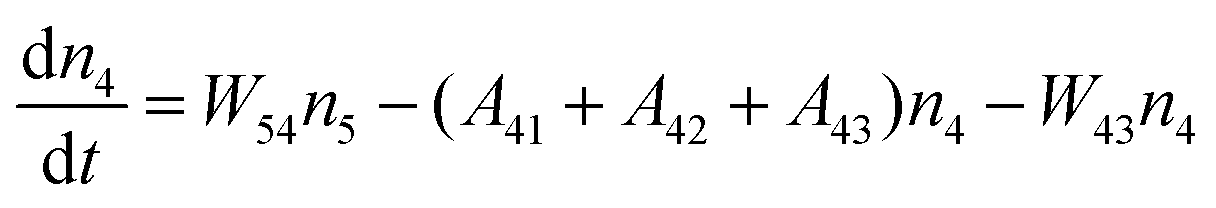
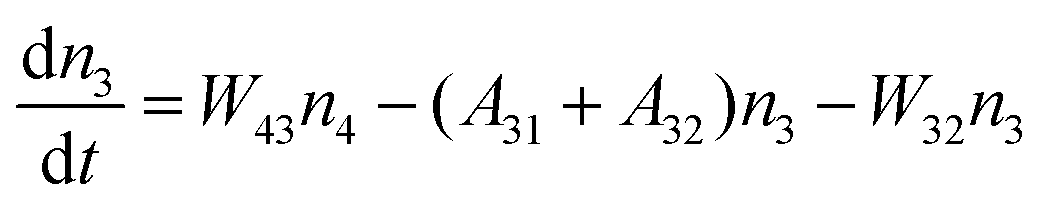
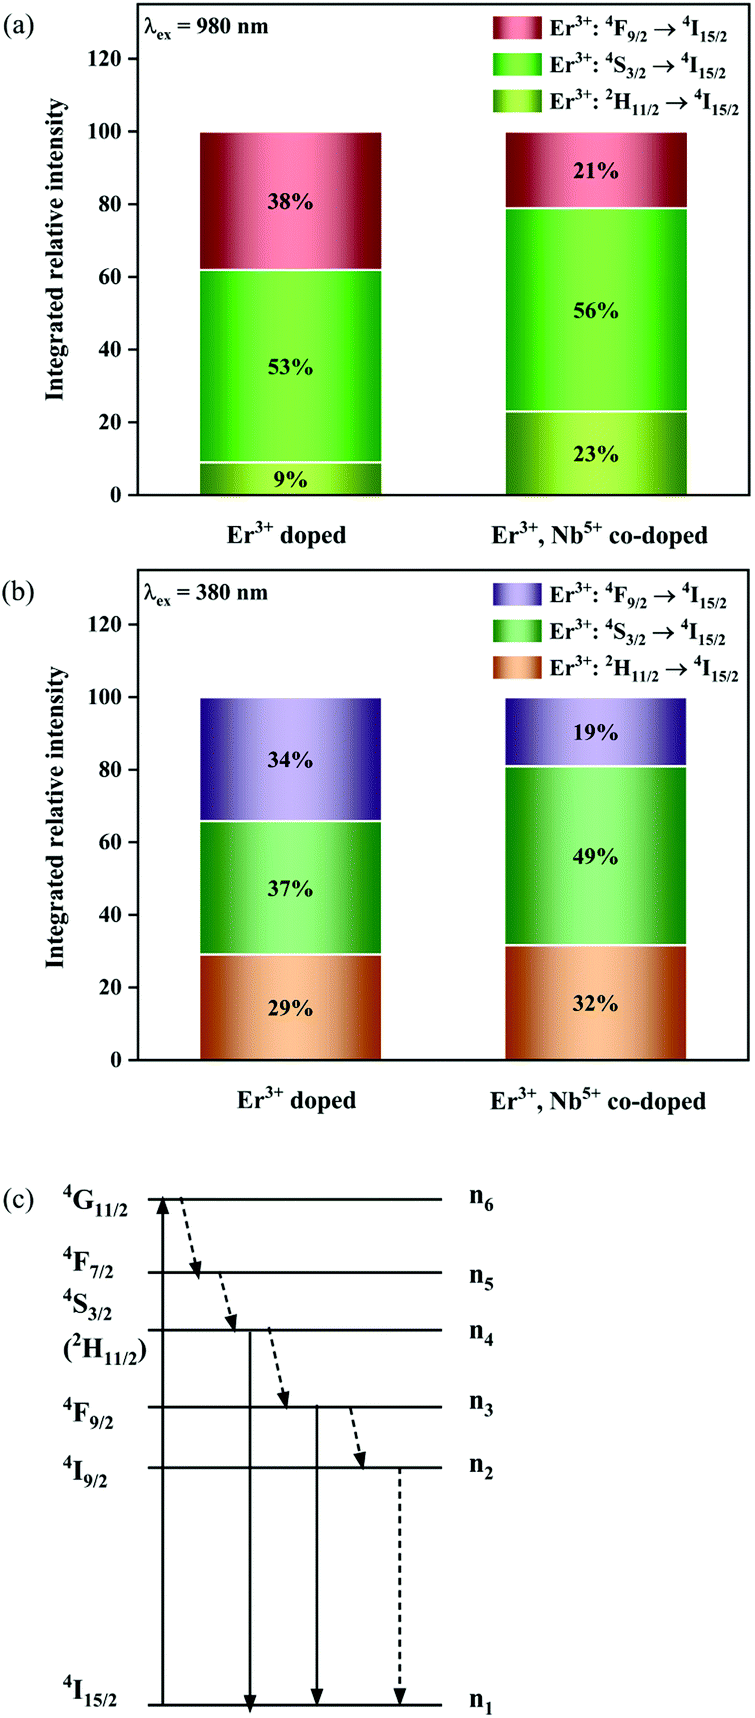
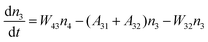
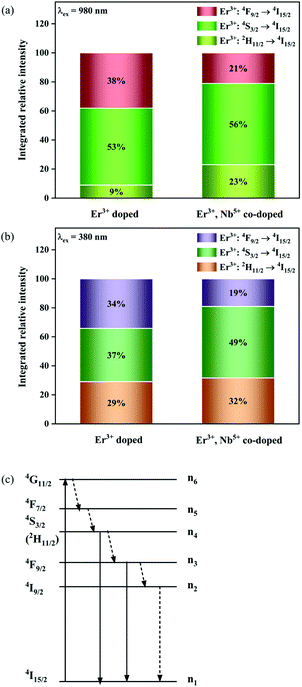
Fig. 8a shows the percentage of the UC intensity of the 2H11/2 → 4I15/2, 4S3/2 → 4I15/2 and 4F9/2 → 4I15/2 emissions in the total UC emission intensity for the 0.11Er3+ mono-doped and 0.11Er3+, 0.06Nb5+ double-doped samples with the excitation at 980 nm, respectively. It is found that the 2H11/2 → 4I15/2 and 4S3/2 → 4I15/2 emission intensity is largely enhanced as compared that of the 4F9/2 → 4I15/2 emission intensity with the introduction of Nb5+. Surprisingly, when Nb5+ is introduced, the percentage of 2H11/2 → 4I15/2 and 4S3/2 → 4I15/2 UC emissions of the Er3+ increases by 14% and 3%, respectively, while the percentage of the 4F9/2 → 4I15/2 UC emission intensity decreases by 17%. This indicates that the introduction of Nb5+ not only enhances the total UC intensity but also alters the electron density population at the up-converting energy levels. The alternation of electron density population at 2H11/2, 4S3/2 and 4F9/2 levels might be ascribed to the change of the non-radiation relaxation probability of the Er3+ induced by the doped Nb5+ ions. To better understand the related mechanism, the 0.001Er3+ mono-doped and 0.001Er3+, 0.06Nb5+ double-doped samples have been prepared and their emission spectra under 380 nm excitation have also been measured. The percentage of the emission intensity of the 2H11/2 → 4I15/2, 4S3/2 → 4I15/2 and 4F9/2 → 4I15/2 emissions in the total emission intensity for the 0.001Er3+ mono-doped and 0.001Er3+, 0.06Nb5+ double-doped samples with the excitation at 380 nm is shown in Fig. 8b. A similar phenomenon has also been observed in the low Er3+ concentration (0.001) doped case under 380 nm excitation. For the sample doped with low Er3+ concentration, the interaction between Er3+ ions can be ignored, which is helpful to analyse the process of electron density population at different levels and the non-radiation relaxation properties of Er3+. According to the luminescence mechanism given in Fig. 8c, the following rate equations can be constructed for the low Er3+ concentration doped sample under 380 nm excitation:
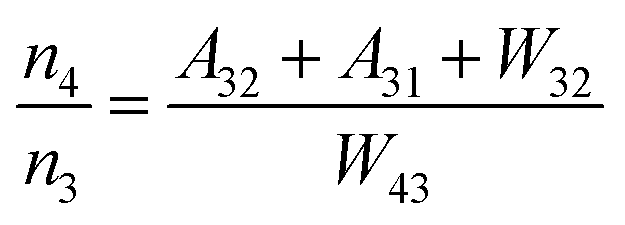
| |  | (1) |
| |  | (2) |
| |  | (3) |
| |  | (4) |
where
ni represents the density of electrons at the corresponding energy level.
Aij and
Wij are the probabilities of radiative transition and nonradiative transition from the energy level
i to
j, respectively.
P is the pumping rate from
4I
15/2 to
4G
11/2. In the steady state, d
ni/d
t = 0. According to
eqn (1)–(4), an equation can be obtained as:
| | 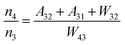 | (5) |
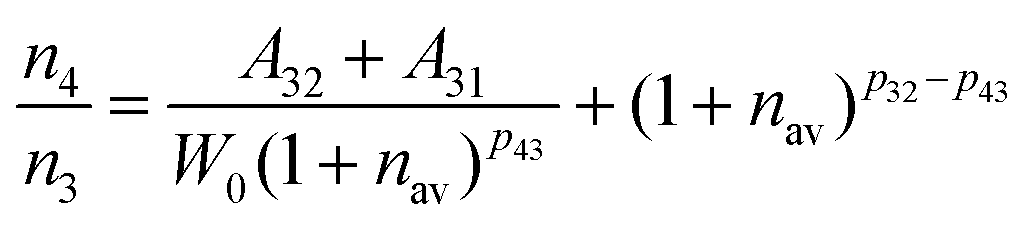
For the weakly coupled system such as rare earth ions, the nonradiative transition probability can be expressed as:
| | | Wnr(T) = W0 (1 + nav)p | (6) |
where
W0 is associated with the matrix environment and the electron-phonon coupling strength, and (1 +
nav)
pij is the temperature-dependent phonon number averaging factor.
44nav = (exp(
hν/
kT) − 1)
−1, which can be regarded as a constant at room temperature (
T = 300 K).
pij = Δ
Eij/
hν, where Δ
Eij is the energy level gap between the energy level
i and
j. Therefore, the
Wnr from the energy level
i to
j is only related to
W0, and the
Wnr is positively correlated with the
W0. Combing equation 6 with equation 5,
n4/
n3 can be obtained as:
| | 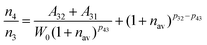 | (7) |
The emission intensity
Ii for the energy level
i can be expressed as:
where
h is the Planck constant, and
νi is the radiative transition frequency at the energy level
i.
45 Therefore, the intensity relationship between the green light (
4S
3/2 →
4I
15/2) and red light (
4F
9/2 →
4I
15/2) of Er
3+ can be expressed as:
| | 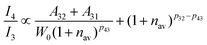 | (9) |
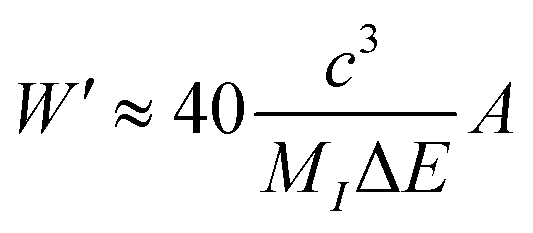
Of note, a relationship between the nonradiative transition probability factor
W′ and radiative transition probability
A can be constructed as follows:
| |  | (10) |
where
MI is regarded as the mass of the atom adjacent to the luminous centre. This implies that
A is positively correlated with
Wnr.
46–48 This relationship between the probability of nonradiative transition (
Wnr) and radiative transition (
A) is known as the parallelism relationship. From
Fig. 8b, it can be calculated that the intensity ratio between the green (
4S
3/2 →
4I
15/2) and red (
4F
9/2 →
4I
15/2) emission of the Er
3+ is 1.39 and 2.67 for the 0.001Er
3+ mono-doped and 0.001Er
3+, 0.06Nb
5+ double-doped samples, respectively. This means that with the introduction of Nb
5+ ions, the intensity ratio between the green (
4S
3/2 →
4I
15/2) and red (
4F
9/2 →
4I
15/2) emission,
i.e., I
4/I
3 increases. According to the parallelism relationship, the radiative transition probability (
A32 +
A31) and nonradiative transition probability (
Wnr) should simultaneously increase or decrease. When both the radiative transition probability and nonradiative transition probability increase simultaneously and the increase in the radiative transition probability is greater than that of the nonradiative transition probability, the I
4/I
3 will increase. On the contrary, when the radiative transition probability and nonradiative transition probability decrease at the same time and the degree of reduction of the radiative transition probability is less than that of the nonradiative transition probability, the I
4/I
3 will also increase.
 |
| | Fig. 8 Percentage of the UC intensity of the 2H11/2 → 4I15/2, 4S3/2 → 4I15/2 and 4F9/2 → 4I15/2 emissions in the total UC emission intensity for the 0.11Er3+ mono-doped and 0.11Er3+, 0.06Nb5+ double-doped samples under 980 nm excitation (a), percentage of the emission intensity of the 2H11/2 → 4I15/2, 4S3/2 → 4I15/2 and 4F9/2 → 4I15/2 emissions in the total emission intensity for the 0.001Er3+ mono-doped and 0.001Er3+, 0.06Nb5+ double-doped samples under 380 nm excitation (b) and simplified diagram of the energy transition of Er3+ under 380 nm excitation (c). | |
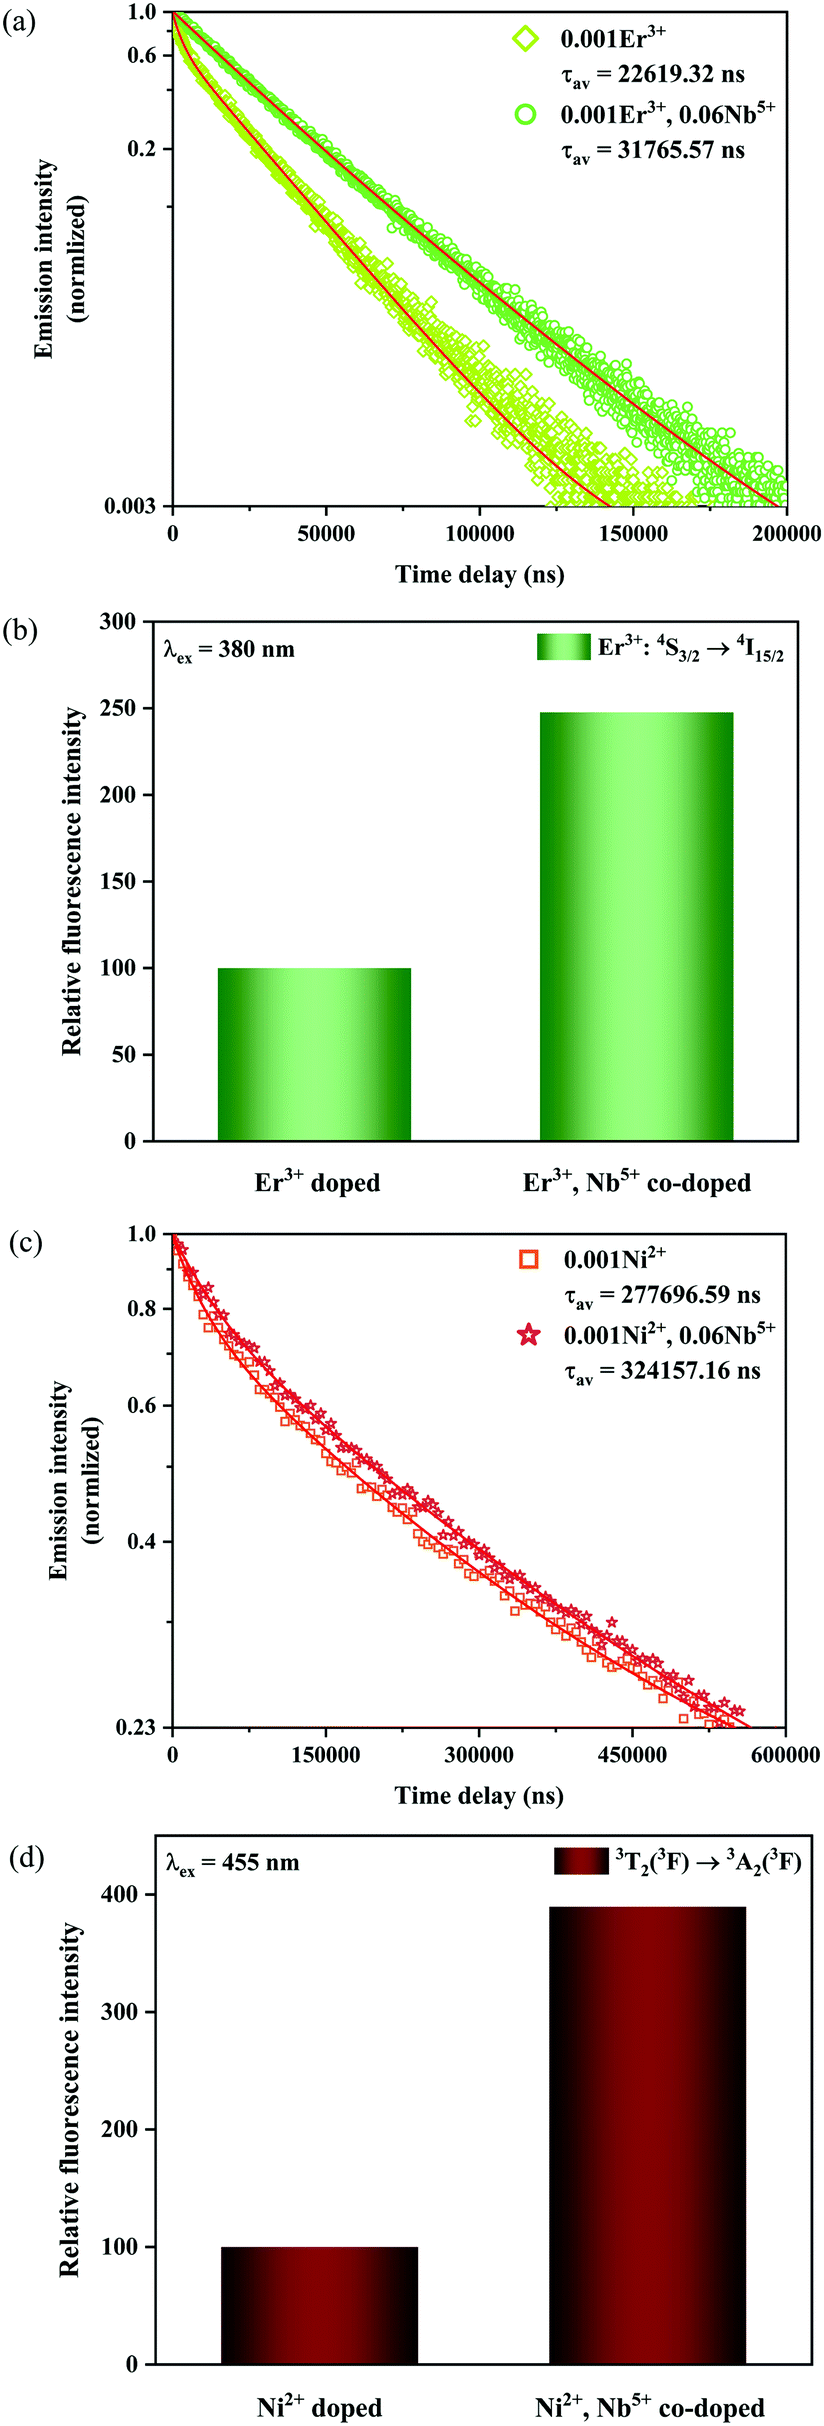
In order to confirm the reason for the increase of I4/I3, therefore, the fluorescence lifetimes of green light (4S3/2 → 4I15/2) for the 0.001Er3+ mono-doped and 0.001Er3+, 0.06Nb5+ double-doped samples are monitored under 380 nm excitation. In the case of low activation ion concentration, the fluorescence lifetime τ can generally be described by the radiative transition probability A and nonradiative transition probability Wnr as follows:44
| |  | (11) |
Fig. 9a shows the luminescence decay curves at 555 nm of the Er
3+ for the 0.001Er
3+ mono-doped and 0.001Er
3+, 0.06Nb
5+ double-doped samples with 380 nm excitation, respectively. The luminescence decay curves can be well fitted by the double exponential function:
| | | I(t) =a0 + a1exp(−t/τ1) + a2exp(−t/τ2) | (12) |
where
I(
t) denotes the luminescent intensity at time
t.
a0,
a1 and
a2 are constants, with
τ1 and
τ2 representing the lifetimes of the exponential components.
49 Their corresponding average lifetimes can be given by the equation:
| |  | (13) |
The calculated fluorescence lifetimes for the 0.001Er
3+ mono-doped and 0.001Er
3+, 0.06Nb
5+ double-doped samples are 0.023 ms and 0.032 ms, respectively, meaning that the doped Nb
5+ can prolong the fluorescence lifetime of Er
3+. According to the parallelism relationship and
eqn (11), the prolongation of the fluorescence lifetime means the decrease of radiative transition probability and nonradiative transition probability. Therefore, the increase of I
4/I
3 in the Er
3+, Nb
5+ double-doped phosphor suggests that the doped Nb
5+ ions reduce both the radiative transition and nonradiative transition probabilities, but the reduction in nonradiative transition probability is larger than that of the radiative transition probability. In addition, the introduction of Nb
5+ also leads to the enhancement in the emission intensity of Er
3+ in the 0.001Er
3+, 0.06Nb
5+ double-doped Y
2Mg
3Ge
3O
12 under excitation of 380 nm. As shown in
Fig. 9b, the green emission of the Er
3+, Nb
5+ double-doped sample is increased by 147.7% as compared with that of the Nb
5+ free one. This indicates that the greatly reduced nonradiative transition probability effectively improves the fluorescence efficiency of the sample.
 |
| | Fig. 9 Fluorescence decay curves (a) as well as relative emission intensity at 555 nm for the 0.001Er3+ mono-doped and 0.001Er3+, 0.06Nb5+ double-doped samples with excitation at 380 nm (b), and fluorescence decay curves (c) as well as relative emission intensity at 1450 nm for the 0.001Ni2+ mono-doped and 0.001Ni2+, 0.06Nb5+ double-doped samples with excitation at 455 nm (d). | |
In addition, the luminescence decay curves at 1450 nm of the Ni2+ for the 0.001Ni2+ mono-doped and 0.001Ni2+, 0.06Nb5+ double-doped samples under 455 nm excitation are also measured, as shown in Fig. 9c. The calculated fluorescence lifetimes for the 0.001Ni2+ mono-doped and 0.001Ni2+, 0.06Nb5+ double-doped samples are 0.277 ms and 0.324 ms, respectively. It can be found that the introduction of Nb5+ also results in the enhancement of the fluorescence lifetime of the Ni2+. Similarly, with eqn (11) and the parallelism relationship, it can be inferred that the introduction of Nb5+ also reduces the radiative transition probability and nonradiative transition probability of the Ni2+. On the other hand, the relative intensity of Ni2+: 3T2 → 3A2 transition emission for the 0.001Ni2+ mono-doped and 0.001Ni2+, 0.06Nb5+ double-doped samples with the excitation at 455 nm is shown in Fig. 9d. It can be found that the 3T2 → 3A2 emission intensity of the Ni2+ increases by 289.5% with the introduction of Nb5+ at 455 nm excitation, meaning that decreasing the nonradiative transition probability is also quite helpful for enhancing the Ni2+ fluorescence intensity.
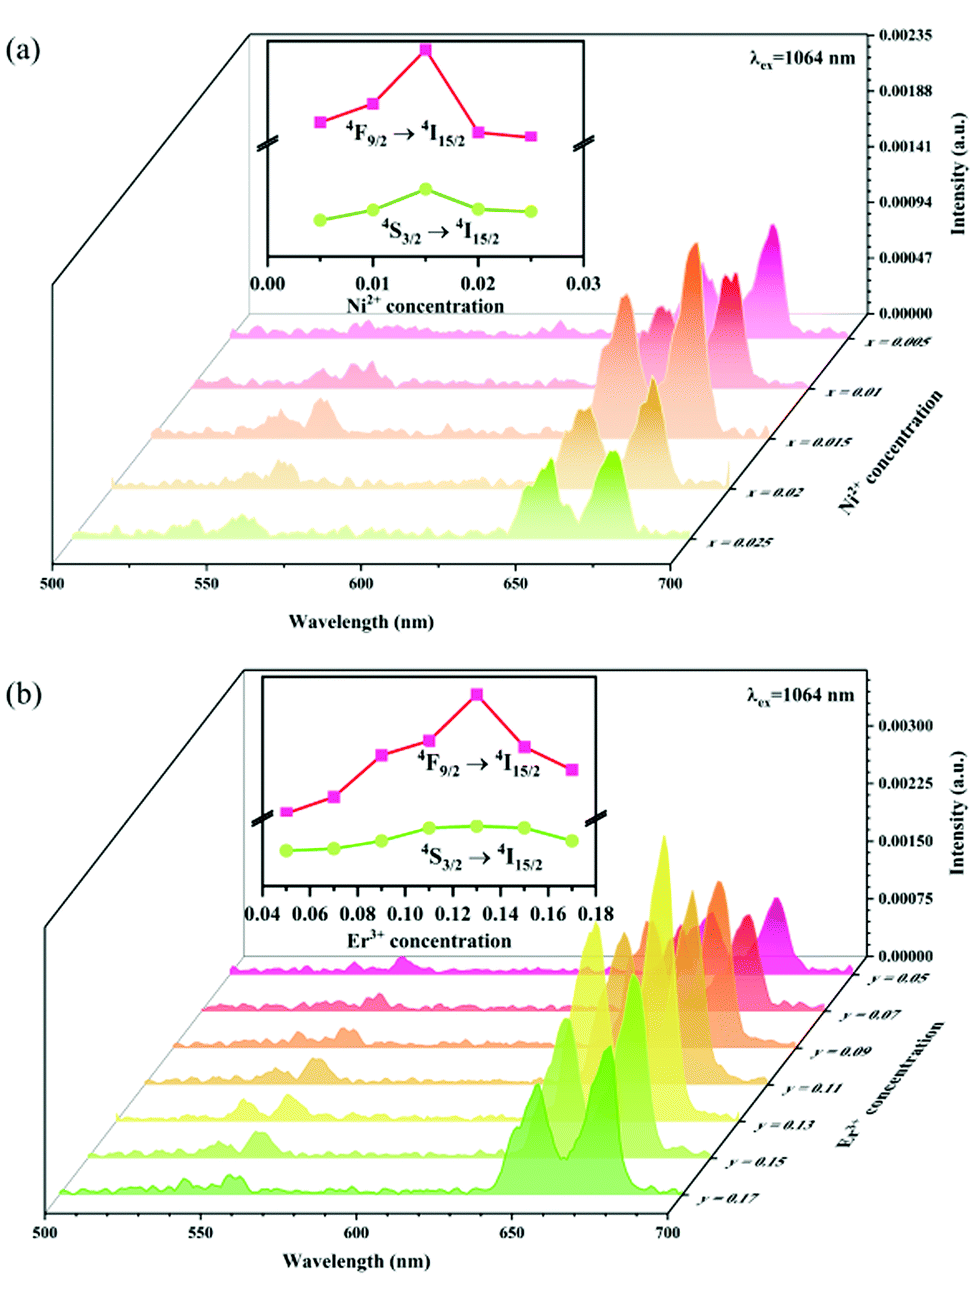
In order to explore the effect of the Ni2+ and Er3+ concentrations on the sensitized UC emission and further optimize the up conversion sample, a series of samples with different Ni2+ ion and Er3+ ion concentrations have been fabricated. Fig. 10 shows the effect of the Ni2+ and Er3+ concentrations on the intensity of UC emission under 1064 nm excitation. It can be seen from Fig. 10a that the UC green and red emission intensities increase correspondingly as the Ni2+ concentration increases, and reach the maximum at the Ni2+ concentration of 0.015 and then decrease with further increasing the Ni2+ concentration. The dependence of the UC emission intensity on the concentrations of Er3+ is displayed in Fig. 10b. A positive correlation between the Er3+ concentrations and the UC green and red emission intensity is shown when the Er3+ concentrations do not exceed 0.13. The phosphor gives the strongest UC green and red emission when the Er3+ concentration arrives at 0.13. Later on, as the concentration of Er3+ increases, the UC emission intensity starts to diminish on account of the energy dissipation from Er3+ to Ni2+ as well as other non-radiative quenching. Based on the experimental results, the Y2Mg3Ge3O12:0.015Ni2+,0.13Er3+,0.06Nb5+ phosphor manifests the optimal UC emission effectiveness in this work.
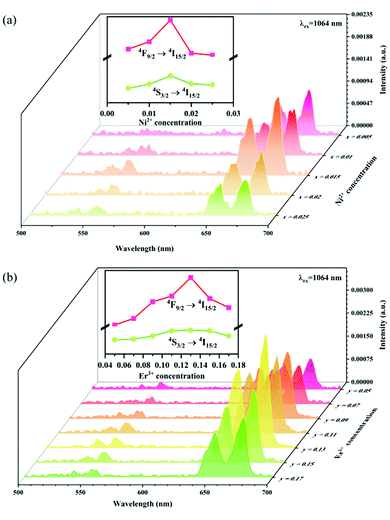 |
| | Fig. 10 UC emission spectra of Y2Mg3Ge3O12: xNi2+,0.11Er3+,0.06Nb5+ (x = 0.005, 0.01, 0.015, 0.02 and 0.025) (a) and Y2Mg3Ge3O12:0.015Ni2+,yEr3+,0.06Nb5+ (y = 0.05, 0.07, 0.09, 0.11, 0.13, 0.15 and 0.17) (b). The insets show the dependence of UC emission intensity on Ni2+ and Er3+ concentrations, respectively. | |
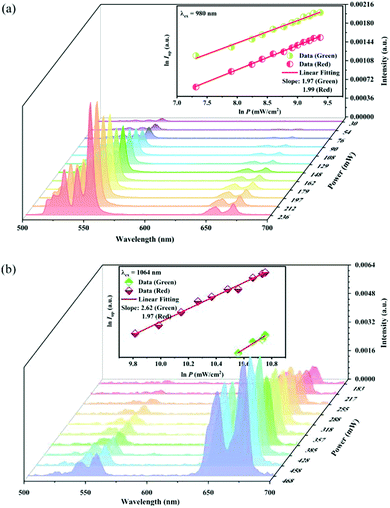
It is well known that there is a non-linear dependence between the UC emission intensity Iem with the pumping power P, which can usually be described as:
where
K is the material correlation coefficient, and the
Q value represents the number of the pump photons required to produce the corresponding UC emission.
50 The UC emission of the Y
2Mg
3Ge
3O
12:0.015Ni
2+,0.13Er
3+,0.06Nb
5+ sample with different power excitation was measured as shown in
Fig. 11. The log-log relationship between the UC emission intensity and the pump power density is also given in the insets of
Fig. 11.
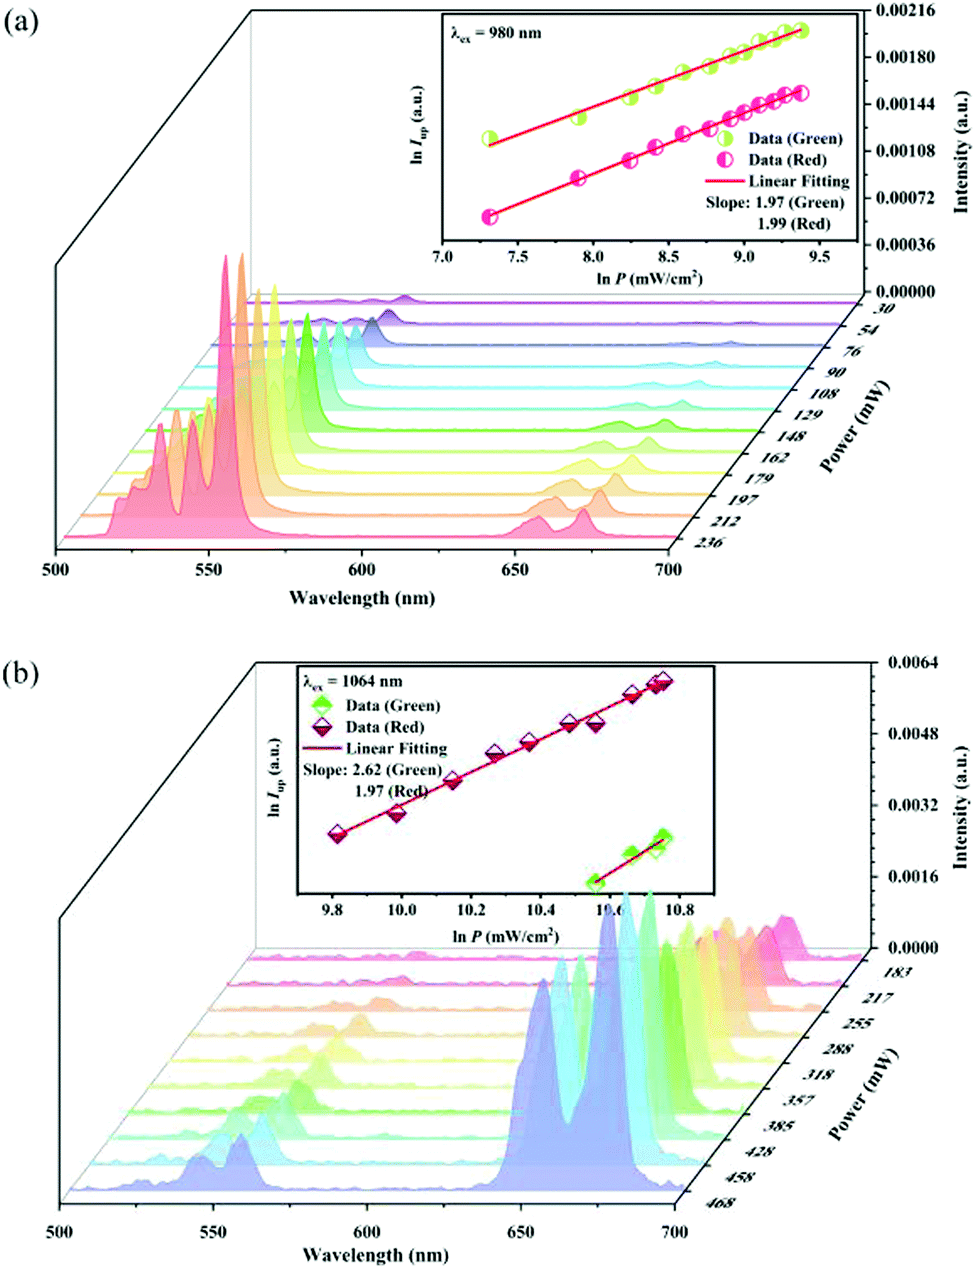
Fig. 11a records the UC spectra under different 980 nm pumping power variations, and the UC emission intensity shows a positive correlation with the pumping power. The inset in
Fig. 11a shows that the UC green and red emission intensity varies as the 980 nm pumping power density increases, respectively. The
Q value is 1.97 and 1.99 for the green and red emissions, respectively. This indicates that both the green and red UC emissions of the sample under 980 nm excitation belong to two-photon processes.
Fig. 11b records the UC emission spectra under 1064 nm excitation light of different power. The inset in
Fig. 11b shows the dependence of the UC green and red emission intensity upon the 1064 nm pumping power density. Unlike that under 980 nm excitation, the
Q value is 2.62 and 1.97 for the green and red emission, respectively. This means that the red UC emission under 1064 nm excitation is still a two-photon process, while the green UC emission belongs to a three-photon one.
 |
| | Fig. 11 UC emission intensity of the Y2Mg3Ge3O12:0.015Ni2+,0.13Er3+,0.06Nb5+ sample under the different powers of 980 nm (a) and 1064 nm (b) excitation. The insets show the double logarithmic plots of the excitation power density and the UC emission intensity. | |
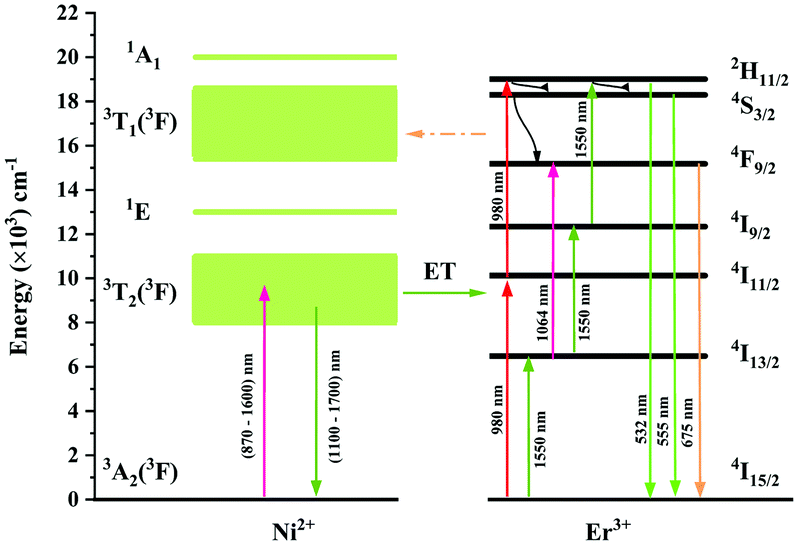
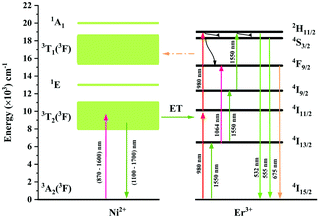
The UC mechanism as well as the energy transfer process is illustrated in Fig. 12. Under excitation of 980 nm, the Er3+ ions are raised to the 4I11/2 state, and the following 4I11/2 (Er3+) + 4I11/2 (Er3+) → 4I15/2 (Er3+) + 2H11/2 (Er3+) energy transfer or the 4I11/2 → 2H11/2 excited absorption occurs between the Er3+ ions, resulting in the population of the 2H11/2 state. Then the 4S3/2 and 4F9/2 are populated due to the nonradiative relaxation process. The 2H11/2 → 4I15/2, 4S3/2 → 4I15/2 and 4F9/2 → 4I15/2 radiative transitions generate the 532 nm, 555 nm and 675 nm emissions. It is evident that both the green emission and red emission are performed by the two-photon process under 980 nm excitation. In the Ni2+, Er3+ double-doped sample, however, intense back energy transfer from Er3+ to Ni2+ might occur under 980 nm excitation, which largely reduces the UC emission of Er3+. Therefore, the UC intensity of the Ni2+, Er3+ double-doped sample is much weaker than that of the Er3+ mono-doped sample. As shown in Fig. 5a, the UC integral intensities of green emission and red emission for the Ni2+, Er3+ double-doped sample weakens by 92% and 97% as compared with that for the Er3+ mono-doped sample, respectively.
 |
| | Fig. 12 Energy level schemes of the Ni2+ ions and Er3+ ions in Y2Mg3Ge3O12 and possible energy transfer mechanisms between the Ni2+ and Er3+ with 980 nm and 1064 nm excitation. | |
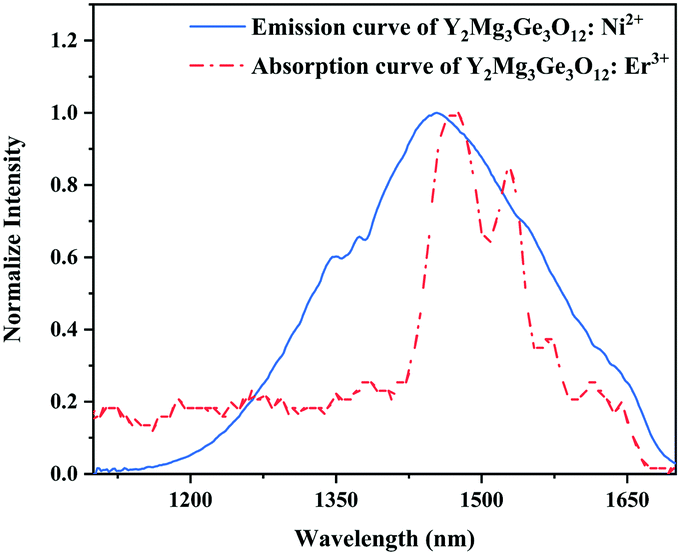
Since 1064 nm excitation light is located in the absorption band of the Ni2+ ion, but not in that of the Er3+ ion, the energy transfer from Ni2+ to Er3+ is responsible for the UC under 1064 nm excitation. In order to understand the energy transfer from Ni2+ to Er3+ in Y2Mg3Ge3O12, the normalized absorption spectra of Y2Mg3Ge3O12:Er3+ and the normalized emission spectra of Y2Mg3Ge3O12:Ni2+ excited at 1064 nm are both given in Fig. 13. It can be found that the Er3+: 4I15/2 → 4I13/2 absorption band is almost completely within the Ni2+: 3T2 → 3A2 emission band. This indicates that the resonant energy transfer from Ni2+ to Er3+ is allowed in the Ni2+, Er3+ double-doped Y2Mg3Ge3O12 phosphor. Under 1064 nm excitation, the Ni2+ ions in the ground state reach the 3T2 state by absorption of 1064 nm photons, and subsequently the Er3+ ions in the nearby ground state are populated to their intermediate state 4I13/2 by the 3T2 (Ni2+) + 4I15/2 (Er3+) → 3A2 (Ni2+) + 4I13/2 (Er3+) energy transfer process. The Er3+ ions in the 4I13/2 state can be followed by two types of photon transfer processes. In one of them, the Er3+ ions in the 4I13/2 state allow further absorption of 1064 nm photons to make themselves reach the 4F9/2 state, resulting in the red emission at 675 nm. Obviously, this is a two-photon process. In the other one, the Er3+ ions are raised to the 4I9/2 state by the 3T2 (Ni2+) + 4I13/2 (Er3+) → 3A2 (Ni2+) + 4I9/2 (Er3+) energy transfer process. The immediately followed energy transfer process 3T2 (Ni2+) + 4I9/2 (Er3+) → 3A2 (Ni2+) + 2H11/2 (Er3+) causes the Er3+ ions in the 4I9/2 state to reach their 2H11/2 state and the subsequent successive nonradiative relaxation process populates the 4S3/2 state of Er3+ ions, resulting in the green emission originating in the 2H11/2, 4S3/2 → 4I15/2. Therefore, the green UC emission is a three-photon process.
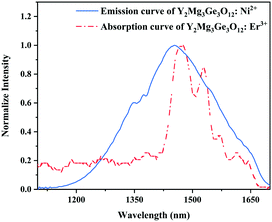 |
| | Fig. 13 Normalized emission curve of Y2Mg3Ge3O12:Ni2+ and absorption curve of Y2Mg3Ge3O12:Er3+. | |
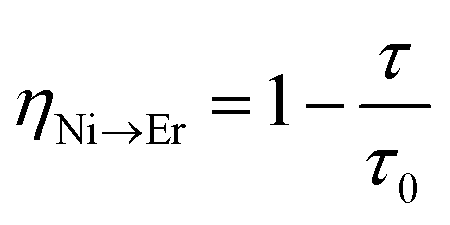
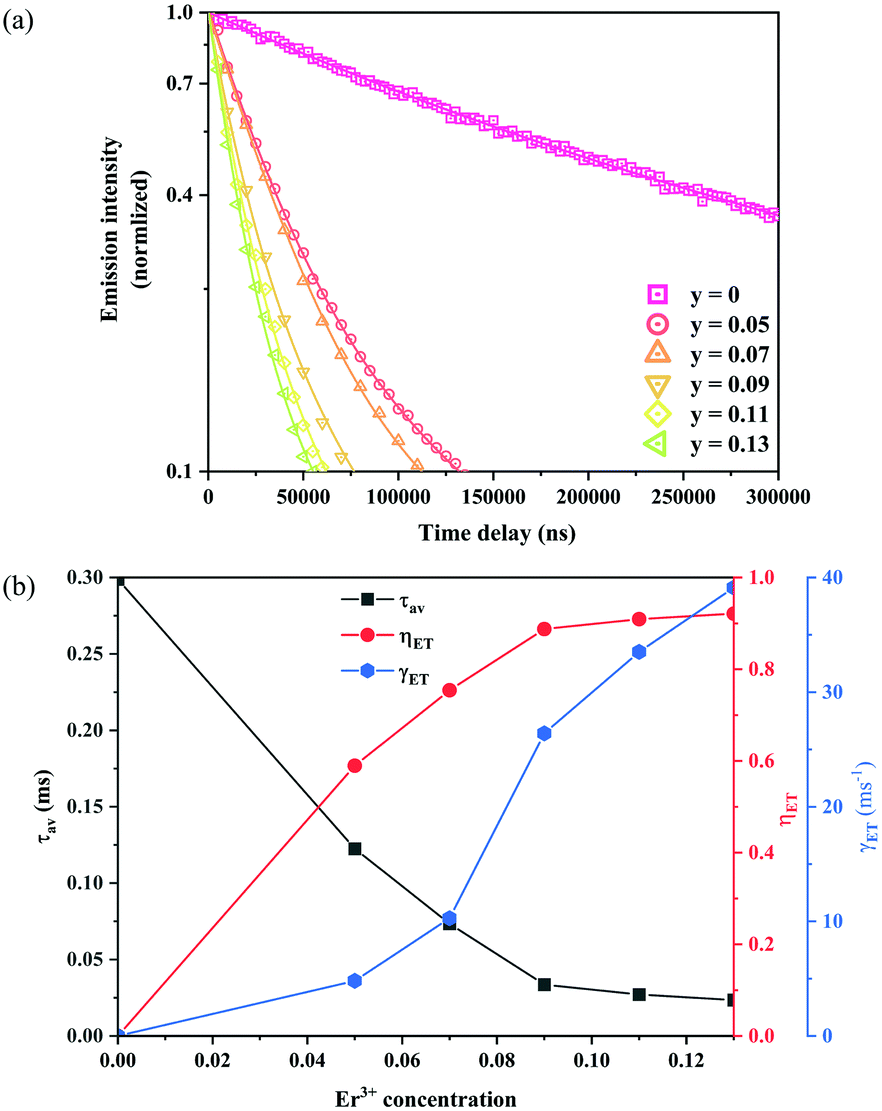
In order to estimate the energy transfer efficiency and energy transfer rate from Ni2+ to Er3+, the time-resolved measurements of the Ni2+ emission are performed. Fig. 14a shows the luminescence decay curves of Ni2+ emission at 1400 nm for Y2Mg3Ge3O12:0.015Ni2+,yEr3+,0.06Nb5+ (y = 0, 0.05, 0.07, 0.09, 0.11 and 0.13) samples with 1064 nm excitation. The Ni2+ emission decays more rapidly when the Er3+ ions are introduced, which indicates that a nonradiative energy transfer from Ni2+ to Er3+ takes place. The decay curves can be well fitted by the double exponential function of eqn (12). The average lifetimes can also be calculated by eqn (13). The energy transfer efficiency ηNi→Er and energy transfer rate γNi→Er from the Ni2+ to the Er3+ can be determined by the following equations:44,51
| |  | (15) |
| |  | (16) |
where
τ0 and
τ are the lifetime of Ni
2+ at
y = 0 and
y ≠ 0, respectively.
Fig. 14b shows the variation of the fluorescence lifetime of Ni
2+, the energy transfer efficiency
ηNi→Er as well as the energy transfer rate
γNi→Er with the doping concentration of Er
3+ ions. As the concentration of Er
3+ ions increases,
ηNi→Er and
γNi→Er also increase. The energy transfer efficiency is as high as 92.1% and the energy transfer rate is 39.1 ms
−1 at
y = 0.13, at which the sample shows the strongest UC.
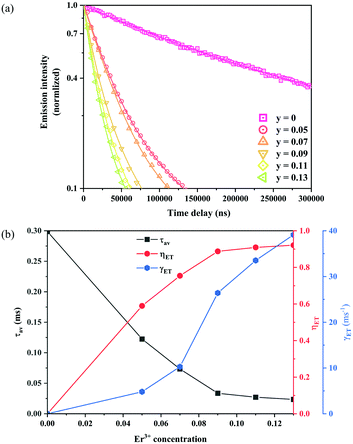 |
| | Fig. 14 Fluorescence decay curves at 1400 nm for Ni2+ emission under 1064 nm excitation of Y2Mg3Ge3O12:0.015Ni2+,yEr3+,0.06Nb5+ (y = 0, 0.05, 0.07, 0.09, 0.11 and 0.13) samples (a); the variations of fluorescence lifetime τ of Ni2+, as well as energy transfer efficiency ηNi→Er and energy transfer rate γNi→Er from Ni2+ to Er3+ with the Er3+ ion doping concentration (b). | |
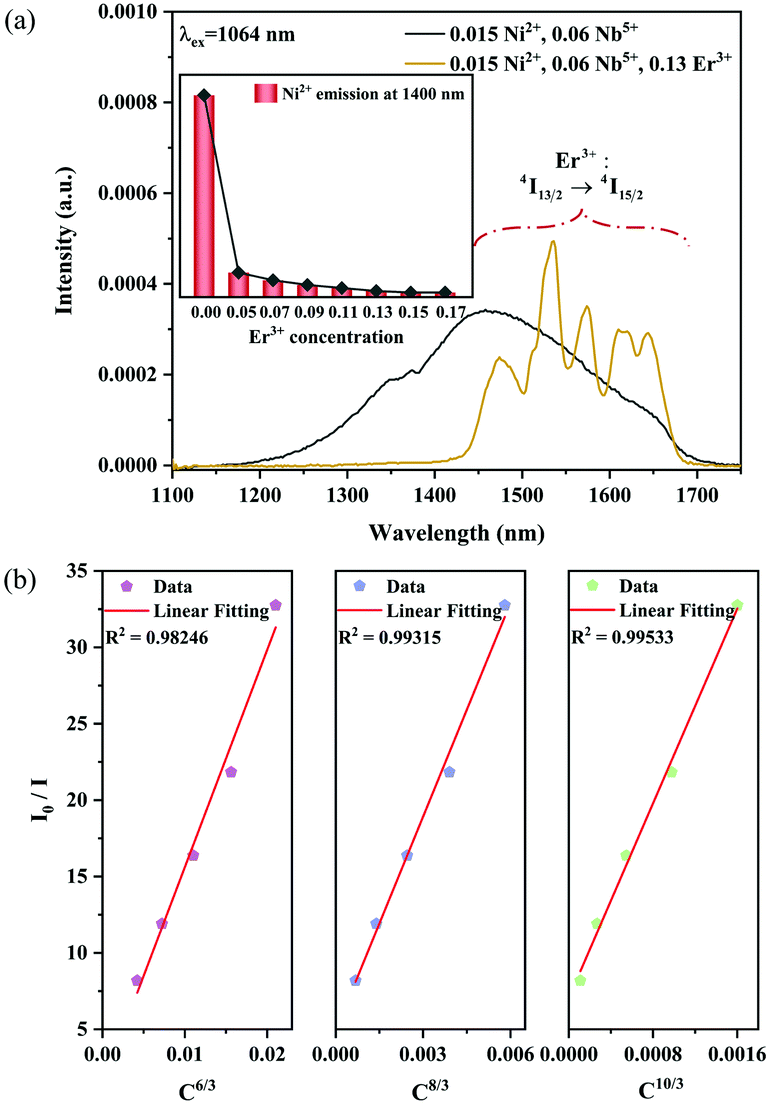
To better know the Ni2+ → Er3+ energy transfer process, the NIR emission spectra of Y2Mg3Ge3O12:0.015Ni2+,yEr3+,0.06Nb5+ phosphors under 1064 nm excitation are also measured, as shown in Fig. 15a. Since the Er3+ cannot be excited by 1064 nm directly, the presence of NIR emission peaking at 1536 nm due to the 4I13/2 →4I15/2 transition of Er3+ in Fig. 15a should be ascribed to the Ni2+ → Er3+ energy transfer. Moreover, it is also found that the NIR emission of Ni2+ drastically weakens with the increase of the concentration of the doped Er3+. The NIR emission properties of the Ni2+, Er3+ double-doped phosphors under 1064 nm excitation further prove the occurrence of the efficient Ni2+ → Er3+ energy transfer. In general, the energy transfer mechanisms include exchange interaction and electrical multipolar interaction. These two mechanisms can be distinguished by the critical distance (RC). In theory, when the value of RC is less than 5 Å, the exchange interaction is predominant. On the contrary, the electric multipole interaction will predominate when the value of RC is above 5 Å. RC can be calculated according to the following equation given by Blasse:
| | 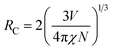 | (17) |
where
V is the volume of the unit cell;
χ represents the total concentration of Ni
2+ and Er
3+ when Er
3+ emission intensity begins to weaken;
N is the number of available sites of dopant in each unit cell.
52 And here
V = 1837.77 Å
3,
χ = 0.145 and
N = 8. The calculated value of
RC is about 14.464 Å and is above 5 Å. Thus, the energy transfer mechanism is dominated by the electric multipolar interaction for the Y
2Mg
3Ge
3O
12:Ni
2+,Er
3+,Nb
5+ phosphor. The types of electric multipolar interaction can be determined by fitting
eqn (18) following the Dexter energy transfer theory:
| |  | (18) |
where
I0 denotes the emission intensity of Ni
2+:
3T
2 →
3A
2 for the Y
2Mg
3Ge
3O
12:0.015Ni
2+,0.06Nb
5+ phosphor.
I is the emission intensity of Ni
2+:
3T
2 →
3A
2 for the Y
2Mg
3Ge
3O
12:0.015Ni
2+,
yEr
3+,0.06Nb
5+ phosphors.
C is the total doping concentration of Ni
2+ ions and Er
3+ ions.
n is a constant and the number of
n can be 6, 8 and 10, which corresponds to dipole–dipole, dipole–quadrupole and quadrupole–quadrupole interactions, respectively. The dependence of
I0/
I on
Cn/3 is shown in
Fig. 15b. The linear relationship displays the best fitting when
n = 10. The results indicate that the energy transfer from Ni
2+ to Er
3+ in Y
2Mg
3Ge
3O
12:Ni
2+,Er
3+,Nb
5+ phosphors is a quadrupole–quadrupole interaction.
 |
| | Fig. 15 NIR emission spectra of the 0.015Ni2+,0.06Nb5+ double-doped and 0.015Ni2+,0.13Er3+,0.06Nb5+ tri-doped samples under 1064 nm excitation (a); the dependence of I0/I on C6/3, C8/3 and C10/3 (b). The inset shows the dependence of the emission intensity of Ni2+ at 1400 nm on the Er3+ concentrations. | |
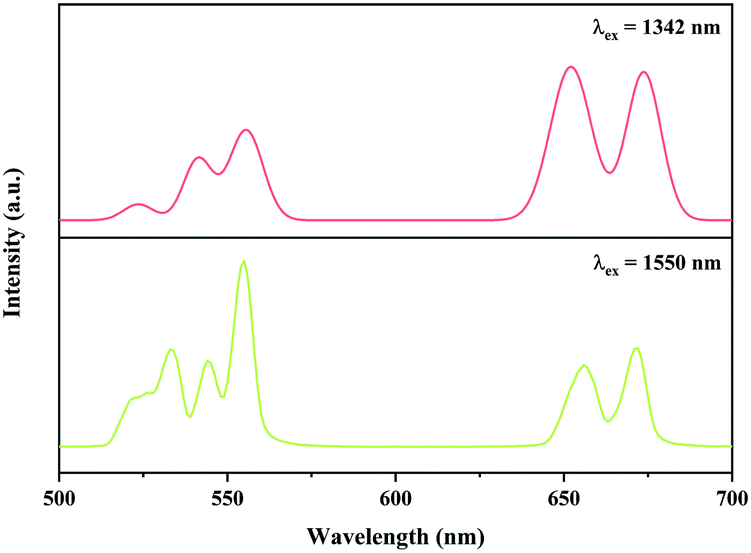
In addition, the Ni2+, Er3+ double-doped Y2Mg3Ge3O12 phosphor might have the potential to convert light within the broadband range of 900–1700 nm into visible emission, considering the broad absorption band (900–1700 nm) of the Ni2+ and Er3+ ions in the Y2Mg3Ge3O12 matrix and the Ni2+ → Er3+ energy transfer pathway therein. To verify its broadband UC performance, the UC emission of the Y2Mg3Ge3O12:0.015Ni2+,0.13Er3+,0.06Nb5+ phosphor with the excitation of 1342 nm and 1550 nm are also measured. Similar to that with 1064 nm and 980 nm excitation, the UC emissions at 532 nm, 555 nm and 675 nm due to the 2H11/2 → 4I15/2, 4S3/2 → 4I15/2 and 4F9/2 → 4I15/2 transitions of the Er3+ are also observed under excitation of 1342 nm and 1550 nm, respectively, as shown in Fig. 16. Obviously, the UC emission under 1550 nm excitation is performed by successive energy transfer between Er3+ as well as Er3+ excited state absorption since Er3+ can be directly excited by 1550 nm light, while the UC emission under 1342 nm is realized by the Ni2+ → Er3+ energy transfer because the 1342 nm is not within the absorption band of Er3+, but within the absorption band of Ni2+. It is worth noting that the Y2Mg3Ge3O12:Ni2+,Er3+,Nb5+ phosphor in this work gives strong visible UC emission at 532 nm, 555 nm and 675nm under excitation of light in a wide near infrared range, unlike the previously reported broadband sensitized Ni2+, Er3+ double-doped UC materials that gave near infrared UC emission at 980 nm. Table 2 shows the comparison of UC performance between some reported Ni2+, Er3+ double-doped materials and the Y2Mg3Ge3O12:Ni2+,Er3+,Nb5+ phosphor in the present work. It can be found that the energy transfer efficiency from Ni2+ to Er3+ in the Y2Mg3Ge3O12:Ni2+,Er3+,Nb5+ phosphor is similar to that reported in previous literature. The broadband sensitized visible UC performance of the Y2Mg3Ge3O12:Ni2+,Er3+,Nb5+ phosphor might open up new applications in the photoelectron field.
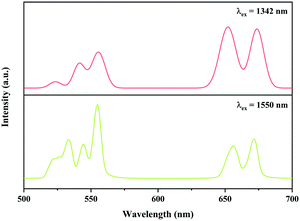 |
| | Fig. 16 UC emission spectra of Y2Mg3Ge3O12:0.015Ni2+, 0.13Er3+, 0.06Nb5+ phosphor with excitation at 1342 nm and 1550 nm. | |
Table 2 Comparison of broadband sensitized Ni2+, Er3+ double-doped UC materials
| Host |
Excitation (nm) |
Emission (nm) |
η
Ni→Er
|
Ref |
| CaTiO3 |
1200 |
980 |
0.97 |
31
|
| SrZrO3 |
1200 |
980 |
0.98 |
32
|
| LaScO3 |
1180 |
980 |
0.99 |
33
|
| Gd3Ga5O12 |
1180 |
980 |
0.98 |
34
|
| Ca3Ga2Ge3O12 |
1180 |
980 |
0.96 |
35
|
| MgGa2O4 |
1064 |
660 |
0.11 |
36
|
| Y2Mg3Ge3O12 |
1064 |
532/555/675 |
0.92 |
This work |
4. Conclusions
In this work, Ni2+, Er3+ and Nb5+ tri-doped Y2Mg3Ge3O12 phosphors have been synthesized by a conventional solid-phase reaction method. The UC emissions at 532 nm, 555 nm and 675 nm have been observed under excitation of 980 nm, 1064 nm, 1342 nm and 1550 nm, respectively. It was found that the Ni2+ → Er3+ energy transfer, Er3+-Er3+ interaction as well as Er3+ excited state absorption provide abundant channels for the UC process, making it capable of converting light within the wide band range of 900–1700 nm into visible emission. The additional Nb5+ ions can reduce both the radiative transition probability and nonradiative transition probability of Ni2+ and Er3+ ions simultaneously and the decrease of nonradiative transition probability is greater than that of the radiative transition probability, which leads to a more intense UC emission. The optimum UC emission intensity is achieved when the doping concentrations of Ni2+, Er3+ and Nb5+ are 0.015, 0.13 and 0.06, respectively, of which the efficiency of Ni2+ → Er3+ energy transfer caused by the quadrupole-quadrupole interaction is as high as 92.1%. The newly developed UC material in the present work has potential application in c-Si solar cells, infrared detectors and other spectral conversion devices.
Conflicts of interest
There are no conflicts to declare.
Acknowledgements
The authors acknowledge the financial support from the Natural Science Foundation of Hunan Province, China (No. 2020JJ4589).
Notes and references
- H. Scheife, G. Huber, E. Heumann, S. Bär and E. Osiac, Opt. Mater., 2004, 26, 365–374 CrossRef CAS.
- S. Wen, J. Zhou, K. Zheng, A. Bednarkiewicz, X. Liu and D. Jin, Nat. Commun., 2018, 9, 2415 CrossRef PubMed.
- M. Gu, Q. Zhang and S. Lamon, Nat. Rev. Mater., 2016, 1, 16070 CrossRef CAS.
- S. Jiang, P. Zeng, L. Liao, S. Tian, H. Guo, Y. Chen, C. Duan and M. Yin, J. Alloys Compd., 2014, 617, 538–541 CrossRef CAS.
- M. Zhang, Y. Lin, T. J. Mullen, W.-F. Lin, L.-D. Sun, C.-H. Yan, T. E. Patten, D. Wang and G.-Y. Liu, J. Phys. Chem. Lett., 2012, 3, 3188–3192 CrossRef CAS.
- J. Tao, J. Chen, D. Ban, M. G. Helander and Z. H. Lu, Sci. Adv. Mater., 2012, 4, 266–281 CrossRef CAS.
- Y. Liu, X. Meng and W. Bu, Coord. Chem. Rev., 2019, 379, 82–98 CrossRef CAS.
- M. Alkahtani, Y. Chen, J. J. Pedraza, J. M. González, D. Y. Parkinson, P. R. Hemmer and H. Liang, Opt. Express, 2017, 25, 1030–1039 CrossRef CAS PubMed.
- K.-Q. Peng and S.-T. Lee, Adv. Mater., 2011, 23, 198–215 CrossRef CAS.
- Y. Liang, Y. Wu, D. Feng, S.-T. Tsai, H.-J. Son, G. Li and L. Yu, J. Am. Chem. Soc., 2009, 131, 56–57 CrossRef CAS.
- W. Shockley and H. J. Queisser, J. Appl. Phys., 1961, 32, 510–519 CrossRef CAS.
- X. Huang, J. Alloys Compd., 2017, 690, 356–359 CrossRef CAS.
- J. C. Goldschmidt and S. Fischer, Adv. Opt. Mater., 2015, 3, 510–535 CrossRef CAS.
- L. C. Hirst and N. J. Ekins-Daukes, Prog. Photovoltaics Res. Appl., 2011, 19, 286–293 CrossRef.
- T. Trupke, M. A. Green and P. Würfel, J. Appl. Phys., 2002, 92, 4117–4122 CrossRef CAS.
- S. Fischer, A. Ivaturi, B. Fröhlich, M. Rüdiger, A. Richter, K. W. Krämer, B. S. Richards and J. C. Goldschmidt, IEEE J. Photovolt., 2014, 4, 183–189 Search PubMed.
- B. M. van der Ende, L. Aarts and A. Meijerink, Phys. Chem. Chem. Phys., 2009, 11, 11081–11095 RSC.
- M. Kaiser, C. Würth, M. Kraft, I. Hyppänen, T. Soukka and U. Resch-Genger, Nanoscale, 2017, 9, 10051–10058 RSC.
- E. I. Madirov, V. A. Konyushkin, A. N. Nakladov, P. P. Fedorov, T. Bergfeldt, D. Busko, I. A. Howard, B. S. Richards, S. V. Kuznetsov and A. Turshatov, J. Mater. Chem. C, 2021, 9, 3493–3503 RSC.
- M. Pokhrel, G. A. Kumar and D. K. Sardar, J. Mater. Chem. A, 2013, 1, 11595–11606 RSC.
- I. Etchart, A. Huignard, M. Bérard, M. N. Nordin, I. Hernández, R. J. Curry, W. P. Gillin and A. K. Cheetham, J. Mater. Chem., 2010, 20, 3989–3994 RSC.
- S. Heer, K. Kömpe, H.-U. Güdel and M. Haase, Adv. Mater., 2004, 16, 2102–2105 CrossRef CAS.
- F. Wang and X. Liu, J. Am. Chem. Soc., 2008, 130, 5642–5643 CrossRef CAS.
- F. Vetrone, J.-C. Boyer, J. A. Capobianco, A. Speghini and M. Bettinelli, J. Appl. Phys., 2004, 96, 661–667 CrossRef CAS.
- X. Xie and X. Liu, Nat. Mater., 2012, 11, 842–843 CrossRef CAS PubMed.
- W. Yan, F. Liu, Y.-Y. Lu, X.-J. Wang, M. Yin and Z. Pan, Opt. Express, 2010, 18, 20215–20221 CrossRef CAS.
- M. G. Brik, C. N. Avram and N. M. Avram, J. Phys. Chem. Solids, 2008, 69, 1796–1801 CrossRef CAS.
- W. E. Vehse, K. H. Lee, S. I. Yun and W. A. Sibley, J. Lumin., 1975, 10, 149–162 CrossRef CAS.
- S. Ye, E. H. Song, E. Ma, S. J. Zhang, J. Wang, X. Y. Chen, Q. Y. Zhang and J. R. Qiu, Opt. Mater. Express, 2014, 4, 638–648 CrossRef.
- P. Gerner, K. Krämer and H. U. Güdel, J. Lumin., 2003, 102-103, 112–118 CrossRef CAS.
- H. N. Luitel, S. Mizuno, T. Tani and Y. Takeda, J. Ceram. Soc. Jpn., 2017, 125, 821–828 CrossRef CAS.
- H. N. Luitel, S. Mizuno, T. Tani and Y. Takeda, Opt.Mater., 2017, 64, 314–322 CrossRef CAS.
- Y. Takeda, S. Mizuno, H. N. Luitel, K.-I. Yamanaka and T. Tani, J. Appl. Phys., 2016, 120, 073102 CrossRef.
- Y. Takeda, H. N. Luitel and S. Mizuno, Jpn. J. Appl. Phys., 2018, 57, 08RF02 CrossRef.
- Y. Takeda, S. Mizuno, H. N. Luitel and T. Tani, J. Am. Ceram. Soc., 2019, 102, 3457–3467 CrossRef CAS.
- X. Zou, S. Xiao and X. Yang, Ceram. Int., 2021, 47, 13853–13858 CrossRef CAS.
- W. Guan, S. Xiao and X. Yang, J. Lumin., 2020, 217, 116795 CrossRef CAS.
- H. Lin, J. Xu, Q. Huang, B. Wang, H. Chen, Z. Lin and Y. Wang, ACS Appl. Mater. Interfaces, 2015, 7, 21835–21843 CrossRef CAS PubMed.
- C. Ji, Z. Huang, X. Tian, H. He, J. Wen and Y. Peng, J. Alloys Compd., 2020, 825, 154176 CrossRef CAS.
- J. Niu, Z. Zhang, W. Zhou and H. Du, J. Mater. Sci.: Mater. Electron., 2020, 31, 4113–4120 CrossRef CAS.
- T. Jansen, J. Gorobez, M. Kirm, M. G. Brik, S. Vielhauer, M. Oja, N. M. Khaidukov, V. N. Makhov and T. Jüstel, ECS J. Solid State Sci. Technol., 2017, 7, R3086–R3092 CrossRef.
- P. Zhang, Y. Wang, M. Lin, D. Zhang, X. Ren and Q. Yuan, J. Electrochem. Soc., 2012, 159, A402–A409 CrossRef CAS.
- A. C. Silva, D. Q. L. Oliveira, L. C. A. Oliveira, A. S. Anastácio, T. C. Ramalho, J. H. Lopes, H. W. P. Carvalho and C. E. R. Torres, Appl. Catal. A, 2009, 357, 79–84 CrossRef CAS.
-
R. Reisfeld, Rare Earths, Springer, 1975, pp. 123–175 Search PubMed.
- X. Zou and H. Toratani, J. Non-Cryst. Solids, 1995, 181, 87–99 CrossRef CAS.
- Z.-D. Luo, Chem. Phys. Lett., 1983, 94, 498–504 CrossRef CAS.
- D. S. Ray and M. Chowdhury, Chem. Phys., 1981, 61, 157–169 CrossRef CAS.
- M. F. H. Schuurmans and J. M. F. van Dijk, Phys. B + C, 1984, 123, 131–155 CrossRef CAS.
-
J. R. Lakowicz, Principles of Fluorescence Spectroscopy, Springer, US, 2013 Search PubMed.
- M. Pollnau, D. R. Gamelin, S. R. Lüthi, H. U. Güdel and M. P. Hehlen, Phys. Rev. B: Condens. Matter Mater. Phys., 2000, 61, 3337–3346 CrossRef CAS.
- Q. Y. Meng, Z. X. Liu and W. J. Sun, Acta Phys. Sin., 2013, 62, 097801 CrossRef.
- Z. Wang, L. Cheng, H. Tang, X. Yu, J. Xie, X. Mi, Q. Liu and X. Zhang, J. Solid State Chem., 2021, 301, 122295 CrossRef CAS.
|
| This journal is © The Royal Society of Chemistry 2022 |
Click here to see how this site uses Cookies. View our privacy policy here. 
 Open Access Article
 This Open Access Article is licensed under a Creative Commons Attribution-Non Commercial 3.0 Unported Licence
 ,
Siguo
Xiao
,
Siguo
Xiao