DOI:
10.1039/D2MA00509C
(Paper)
Mater. Adv., 2022,
3, 6643-6655
Morphological evolution of carnation flower-like Cu2CoSnS4 battery-type electrodes
Received
6th May 2022
, Accepted 10th July 2022
First published on 12th July 2022
Abstract
Transition metal sulfides are the most reliable type of battery electrode material for supercapacitors. Herein, the morphological evolution of Cu2CoSnS4 has been enhanced with different time-varied temperature processes through a one-step solvothermal route. Promoted by its unique carnation flower-like morphology with excellent petals, it achieves an elevated 132.08 mA h g−1 specific capacity at 0.5 A g−1 current density and long lasting stability with only 22.33% loss over 5000 cycles at 5 A g−1. Moreover, a full-cell asymmetric solid-state supercapacitor (ASSC) device has been constructed to demonstrate its practical applications. The fabricated Cu2CoSnS4//AC ASSC device delivers a 131.90 W h kg−1 high energy density for 749.98 W kg−1 power density with an improved stability of 70% and a Coulombic efficiency of 97.98% after 20![[thin space (1/6-em)]](https://www.rsc.org/images/entities/char_2009.gif) 000 charge–discharge cycles, demonstrating its potential as a gifted electrode for high-performance supercapacitor applications.
000 charge–discharge cycles, demonstrating its potential as a gifted electrode for high-performance supercapacitor applications.
1. Introduction
In this burgeoning neo-civilized world, research on clean and renewable energy sources is being increasingly considered due to the dramatic increase in global energy requirements and the environmental impact of conventional energy sources.1,2 Since these new energy sources are intermittent in nature, there is a need to easily store electrical energy.3–5 Supercapacitors are unique in that they have the best energy storage efficiency, and hence, the device reliability depends largely on fundamental component configuration.6–14 Composite materials are designed to achieve functional capabilities beyond the limits of a single material's properties, such as energy density and lifetime. The production of new materials is essential to develop and improve power transmission and storage systems to meet the extreme energy needs of the growing low-carbon economy.15–17 Mesoporous materials have the potential to store high charges for energy storage owing to their extensive surface area and pores. Due to this reason, their basic properties, such as material stability, specific capacitance, energy, strength, and longevity, are also improved. A suitable electrode and its properties or a suitable active material are most important to increase the efficiency and performance of supercapacitors.18,19 Recently, several synthetic routes, such as thermodynamic (capping agent, structure directing agent, temperature, etc.) and kinetic factors (concentration of reactants, reduction rate, reaction time, etc.), have focused on producing shape-controlled metal nanostructures.20–22 Nowadays, the development of Cu2MSnS4 compounds (M = Ni2+; Co2+; Fe2+; Mn2+; Ca2+; Mg2+), new quaternary compounds with similar structure and properties as Cu2ZnSnS4, is attracting much research interest in the energy field due to their excellent physical properties, optical band gap between 1.3 eV and 1.5 eV, high abundance, and affordable and non-toxic nature. Among these, quaternary compounds of Cu2CoSnS4 are promising candidates for SCs because of their outstanding properties, such as their elevated specific capacity, improved electrical conductivity, variable oxidation conditions, good physical and mechanical properties, and high cyclic stability due to their mixed metal additives.23–25 In general, ruthenium dioxides are a standard electrode material in supercapacitor applications. Although RuO2 is considered crucial for practical applications because of its high reversibility, high specific capacitance, very long cycle life, and superior pseudocapacitive performances, it faces limitations in supercapacitor applications due to its low availability and high cost.26 In this report, we have developed Cu2CoSnS4 by varying both thermodynamic and kinetic factors to form a 3D hierarchical carnation flower-like morphology that can show exceptional performance similar to that of the sophisticated RuO2 material and improve its energy storage ability through its petal-like arrangements. In addition to the ease of preparation, control of the synthetic route has been proposed to synthesize the quaternary Cu2CoSnS4 compound through a solvothermal method, which offers good reproducibility, good performance and the ability to store more charges at lower costs for energy storage applications. We hope this work will have a positive impact in energy-related fields.
2. Experimental section
2.1. Synthesis of carnation flower-like Cu2CoSnS4 microflowers
The synthesis of Cu2CoSnS4 has been previously achieved by many approaches, for example, thin film via electrodeposition,27 hydrothermal28 and solvothermal methods.29 The solvothermal method is optimal for monitoring and tailoring the size, shape, and morphology of materials. The wet-chemical synthetic strategy using water and an organic solvent as a medium for the solvothermal route was adapted to synthesize the quaternary metal sulfide Cu2CoSnS4 at different times and to study its morphological variations. Firstly, timeless products (0 h) were treated with 3 mM copper(II) chloride dehydrate, 1 mM cobalt(II) chloride hexahydrate, and 1 mM tin(IV) chloride pentahydrate in 80 mL deionized water. A greenish brown solution was formed, which was stirred for 30 min. Then, 4 mM thiourea was blended in and a small amount of citric acid was added with continuous stirring at an 80 °C constant temperature, followed by sonication for more than 1 h. This solution was named CCTS-0 h and it was not fixed in an autoclave. Similarly, to understand the morphological effect, the time was varied to 12, 18 and 24 h to form the CCTS-12 h, CCTS-18 h and CCTS-24 h samples, respectively. These three products were individually poured into a stainless steel 80 mL autoclave at 160 °C. All the samples were centrifuged with ethanol, methanol, and deionized water, washed well, and dried in a vacuum furnace overnight at 80 °C for 12 h. Then, all the obtained black-colored powders were characterized. The simplest forms of the reactants and the products in the overall chemical reaction of the material formation are described in eqn (1). The coefficient of each compound varies with respect to the reaction stoichiometry calculations.| | | 2CuCl2 + CoCl2 + SnCl4 + 4SC(NH2)2 + 9H2O → Cu2CoSnS4 + 8NH4Cl + 4CO2 + H2O + Cl2 | (1) |
2.2. Electrode preparation
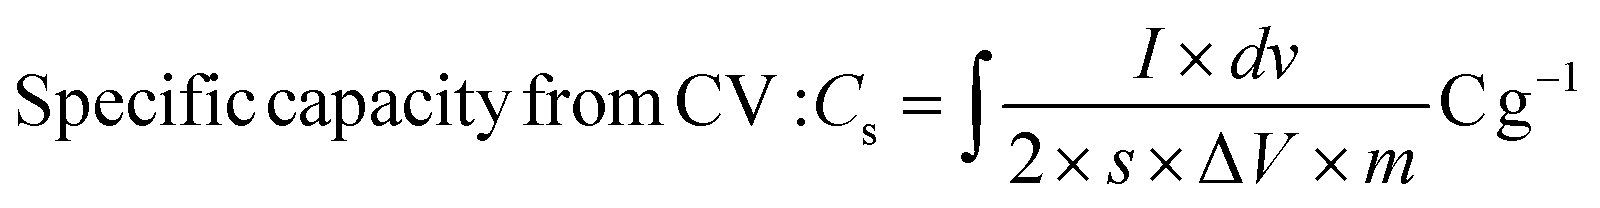
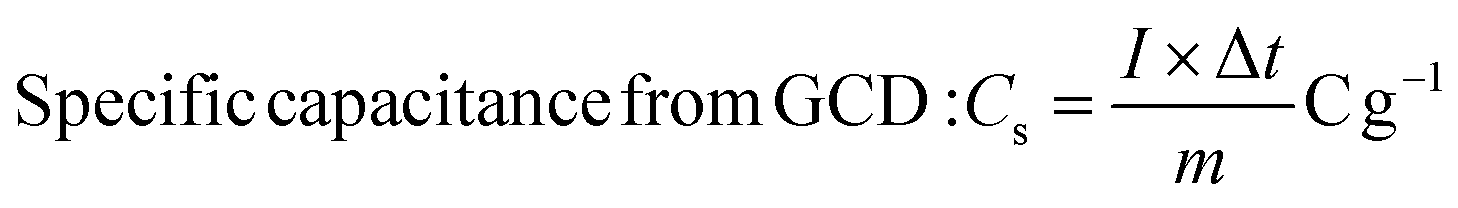
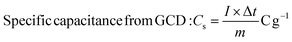
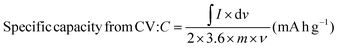
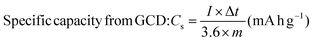
Electrochemical measurements were performed using a Biologic SP-150 potentiostat at ambient temperature. The working material slurry was prepared using the CCTS catalyst, activated carbon, acetylene black and PVDF at 70:20:5:5 wt% by manual mixing in 20 drops NMP (N-methyl pyrrolidinone) solvent in an agate mortar. Ni foam sheets were pre-cleaned with 1 M HCl in 100 mL DI water using ultrasonication for 15 min to eliminate the NiOx surface, and then cleaned several times. Thereafter, the obtained slurry was uniformly coated on a selective 1 × 1 cm2 area of Ni foam using an art painting brush size 4. Then, all the coated electrodes were placed in an oven at 80 °C for 12 h. The Ni foam substrate's weight before and after catalyst coating was measured properly for mass balancing and error bar calculations. The active mass coated was optimized cautiously within 2 mg. The CCTS catalyst (1 × 1 cm2 area coated on Ni foam) was employed as the working electrode, Pt wire as the counter electrode, and Ag/AgCl as the reference electrode for supercapacitor applications in a three-electrode configuration. 2 M KOH was employed as an alkaline electrolyte for the electrochemical measurements. In this three-electrode configuration, the prepared electrode materials’ specific capacities in terms of C g−1 and mA h g−1 were estimated.| | 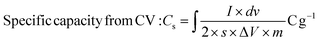 | (2) |
| |  | (3) |
| |  | (4) |
| |  | (5) |
where I × dv signifies the area under the CV curve, ‘I’ is the discharge current (A), ‘Δt’ is the discharge time (s), dv is the applied potential window (V), ‘v’ is the scan rate (mV s−1), and ‘m’ represents the active material mass (mg) coated on the electrode surface. The instrumentation details of all the characterization tools are detailed in our previous articles.30,31
2.3. Fabrication of an asymmetric solid-state supercapacitor (ASSC)
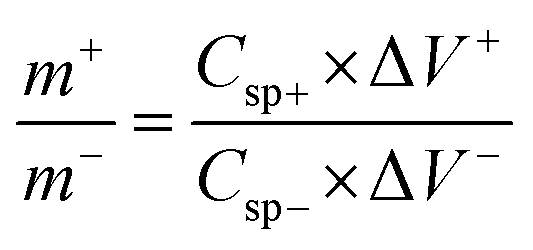
An ASSC was fabricated by employing Cu2CoSnS4 and then separately activated as a cathode and anode material. A PVA/KOH gel separator was placed between the negative and positive electrode. The Ni foam substrate acts as a current collector in the two-electrode arrangements. 2 M KOH (3.36 g) was blended in 30 mL deionized water with 3 g polyvinyl alcohol (PVA) and kept at 80 °C for 2 h to construct the gel electrolytes. The semisolid gel was then poured as a homogeneous transparent very thin layer onto an overhead projector (OHP) sheet and cooled naturally in the ambient environment. After a while, this sheet was extracted, and a piece of the required size was used as a separator. A two-electrode system was constructed of Cu2CoSnS4-18 h (2 mg) and activated carbon (5 mg)-coated Ni foam as the positive and negative electrodes, respectively, and an electrolyte separator made of PVA/KOH gel polymer. A sandwich-type ASSC device was used as the positive electrode, separator, and negative electrode and then used for the electrochemical measurements. The formula Q− = Q+ was used for the charge balance between the two working electrodes of Cu2CoSnS4-18 h and activated carbon.| |  | (6) |
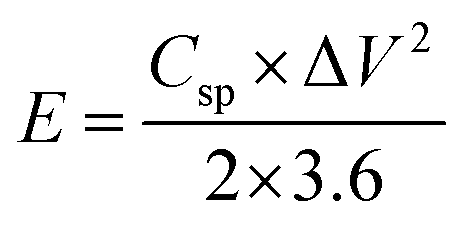
To test the practical use, two-electrode measurements were used to examine the electrochemical properties of the ASSC device. All the characterizations were done at room temperature conditions. Further, the Cu2CoSnS4-18 h//AC ASSC device energy density (E) and power density (P) were computed:32,33
| |  | (7) |
| |  | (8) |
3. Results and discussion
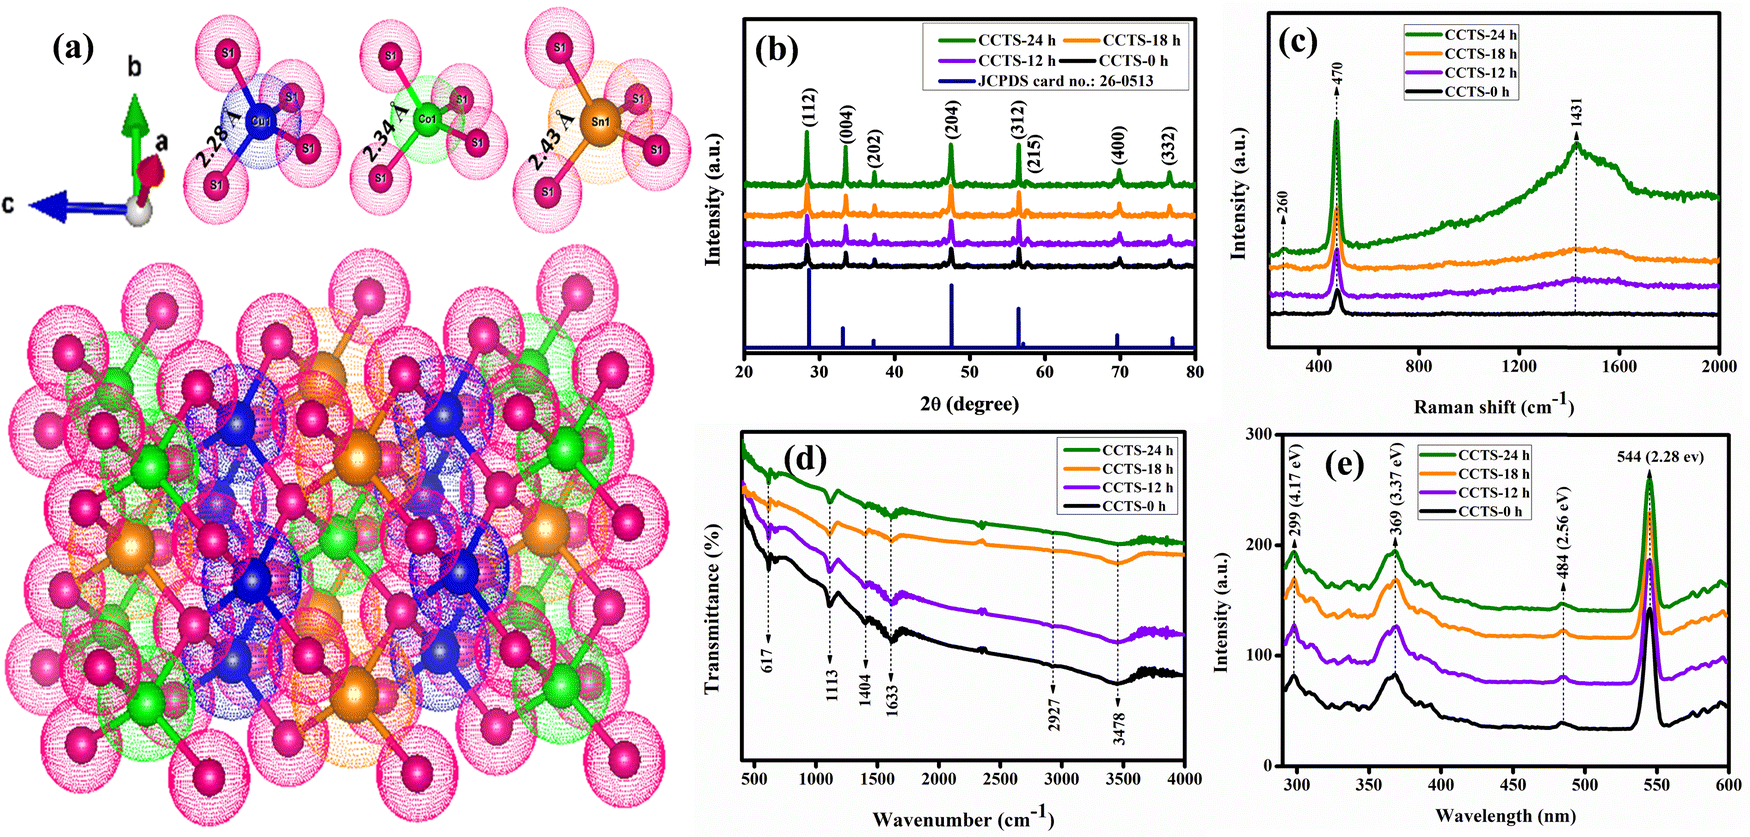
The crystallinity effects of Cu2CoSnS4 were studied using primarily XRD analysis for different time-varied samples (CCTS-0 h, CCTS-12 h, CCTS-18 h and CCTS-24 h). A crystallographic image of the Cu2CoSnS4 structure was drawn using VESTA software, as shown in Fig. 1(a). There was no other secondary phase formation observed in the synthesized samples. Fig. 1(b) shows the XRD results of the Cu2CoSnS4 samples. All the diffraction peaks coincided with JCPDS 26-0513, corresponding to the stannite phase of Cu2CoSnS4. The diffraction peaks at 28.30°, 33.42°, 37.27°, 47.41°, 56.47°, 57.36°, 69.84° and 76.65° are attributed to the diffraction planes of (112), (004), (202), (204), (312), (215), (400) and (332), respectively, for the Cu2CoSnS4 phase. The mean crystallite size of the prepared particles was measured using the Debye–Scherer formula and the values are around 25 to 30 nm for the high intensity peak. As we conferred in the introduction, these Cu2CoSnS4 phases are useful because they have high conductivity in energy storage applications.34 The phase purity was further studied by Raman analysis in the wavenumber range of 200 to 2000 cm−1 (Fig. 1(c)). The bands at 260, 470 and 1431 cm−1 matched well with the band positions of previous reports. The low intensity peak at 260 cm−1 was due to the Cu2CoSnS4 compound. The predominant peak appeared at 470 cm−1, which corresponds to the S anion A1 symmetric molecular vibration mode, while the band at 1431 cm−1 was due to the C![[double bond, length as m-dash]](https://www.rsc.org/images/entities/char_e001.gif) C bonds.35,36 Vibration spectroscopy provides structural information for quality and quantity analysis. Fig. 1(d) shows the FT-IR spectra of the prepared CCTS materials displayed in different bands at 617, 1113, 1404, 1633, 2927 and 3478 cm−1. Generally, sulfur-based materials exhibit fixed absorbances at 1404, 1113, and 617 cm−1.37 The peak typically present at 3478 cm−1 was due to the water and thiourea complex, while the peaks at 1113 and 1633 cm−1 were related to the metal–thiourea complexes. The stretching and bending vibrations of oxygen are responsible for the bands around 900–1600 cm−1. Additional weak bands found at 963 and 683 cm−1 were because of resonance interactions between the sulfide vibration modes in the prepared samples, while the peak at 617 cm−1 belongs to the Co–S bond and the specific absorption peak at 2927 cm−1 is assigned to S–H thiol functional groups.38 Photoluminescence was used to study the optical behaviors of the synthesized materials. The room-temperature-assisted photoluminescence spectra exhibited well-resolved peaks at 299, 369, 417, 484, and 544 nm (4.17, 3.37, 2.97, 2.56, and 2.28 eV, respectively). The band at 484 nm may have been due to photogenerated electrons and holes recombination, while the band located at 417 nm may have arisen from the 3d9 4s1 ↔ 3d10 transition of the Cu+ ion. The band observed at 369 nm is ascribed to the Co2+ ion in the tetrahedral coordination with sulfur (Fig. 1(e)) and definitely confirms the addition of Cu–Co–Sn–S.39,40
C bonds.35,36 Vibration spectroscopy provides structural information for quality and quantity analysis. Fig. 1(d) shows the FT-IR spectra of the prepared CCTS materials displayed in different bands at 617, 1113, 1404, 1633, 2927 and 3478 cm−1. Generally, sulfur-based materials exhibit fixed absorbances at 1404, 1113, and 617 cm−1.37 The peak typically present at 3478 cm−1 was due to the water and thiourea complex, while the peaks at 1113 and 1633 cm−1 were related to the metal–thiourea complexes. The stretching and bending vibrations of oxygen are responsible for the bands around 900–1600 cm−1. Additional weak bands found at 963 and 683 cm−1 were because of resonance interactions between the sulfide vibration modes in the prepared samples, while the peak at 617 cm−1 belongs to the Co–S bond and the specific absorption peak at 2927 cm−1 is assigned to S–H thiol functional groups.38 Photoluminescence was used to study the optical behaviors of the synthesized materials. The room-temperature-assisted photoluminescence spectra exhibited well-resolved peaks at 299, 369, 417, 484, and 544 nm (4.17, 3.37, 2.97, 2.56, and 2.28 eV, respectively). The band at 484 nm may have been due to photogenerated electrons and holes recombination, while the band located at 417 nm may have arisen from the 3d9 4s1 ↔ 3d10 transition of the Cu+ ion. The band observed at 369 nm is ascribed to the Co2+ ion in the tetrahedral coordination with sulfur (Fig. 1(e)) and definitely confirms the addition of Cu–Co–Sn–S.39,40
 |
| | Fig. 1 (a) Crystallographic image of Cu2CoSnS4; (b) XRD, (c) Raman, (d) FTIR, and (e) photoluminescence spectra of Cu2CoSnS4 fabricated with different times (CCTS-0, 12, 18, 24 h). | |
To know the external morphology, chemical composition, and crystal structure of the samples, direct visualization SEM analysis is the best technique. The carnation flower-like morphological images of the Cu2CoSnS4 prepared with different reaction times were obtained by FE-SEM at different magnification levels of 5 and 1 μm and 500 nm (Fig. 2). The highly magnified 5 μm images for the temperature-varied samples show a close resemblance to flower-like morphologies. Regardless of the temperature, all the samples exhibited a perfect flower-like morphology. This significantly improves the material surface contact between the electrolyte and electrode due to the wider and thinner petals of the 18 h time variation, which increases the supercapacitor performance.41–43
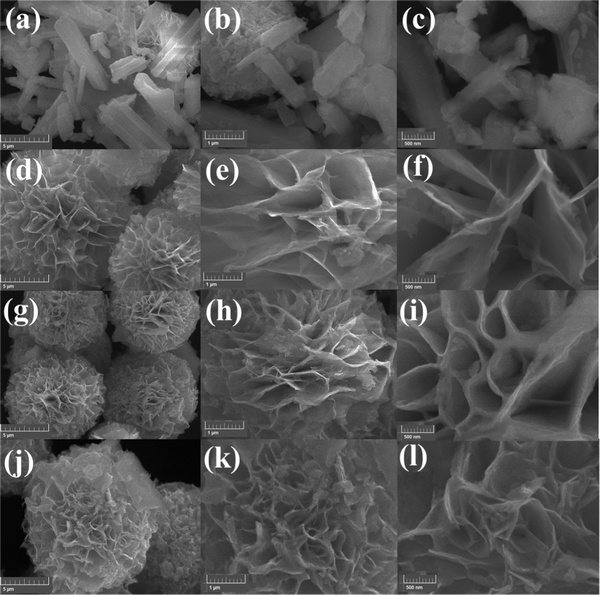 |
| | Fig. 2 Solvothermal-tailored FE-SEM images of Cu2CoSnS4 with increasing magnification: (a–c) CCTS-0 h, (d–f) CCTS-12 h, (g–i) CCTS-18 h and (j–l) CCTS-24 h. | |
Fig. 3 presents the high-magnification TEM images of the obtained product. The TEM images in Fig. 3(a and b) show that the as-prepared Cu2CoSnS4 has a 3D carnation flower-like structure with two-dimensional ∼40 nm thick petals. HR-TEM images were obtained to further look at the structure of CCTS-18 h. Fig. 3(c) clearly reveals the lattice fringes (0.31 nm) associated with the (111) plane of Cu2CoSnS4. The obvious diffraction ring in the SAED pattern substantiates the polycrystalline nature of CCTS-18 h (Fig. 3(d)). The Cu2CoSnS4 materials, which are designed to contribute to the carrier separation and electron transport performance, exhibit a stable microstructure. The diffraction rings estimated from the inside to the outside associated with the tetragonal phase of Cu2CoSnS4 show the corresponding lattice planes of (112), (004), (202), (204), (312), (400) and (332), which are concurrent with the XRD results.44,45
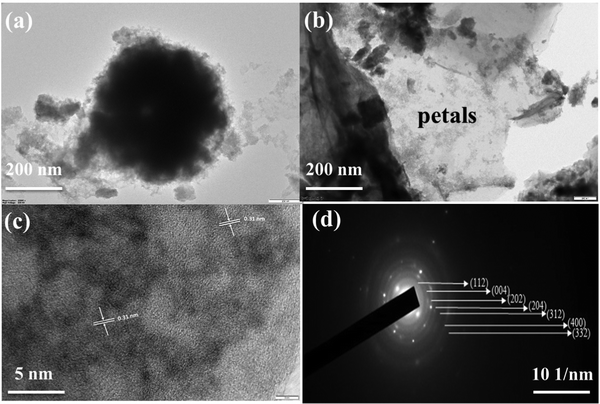 |
| | Fig. 3 HR-TEM micrographs of CCTS-18 h with increasing magnification along with its SAED pattern. | |
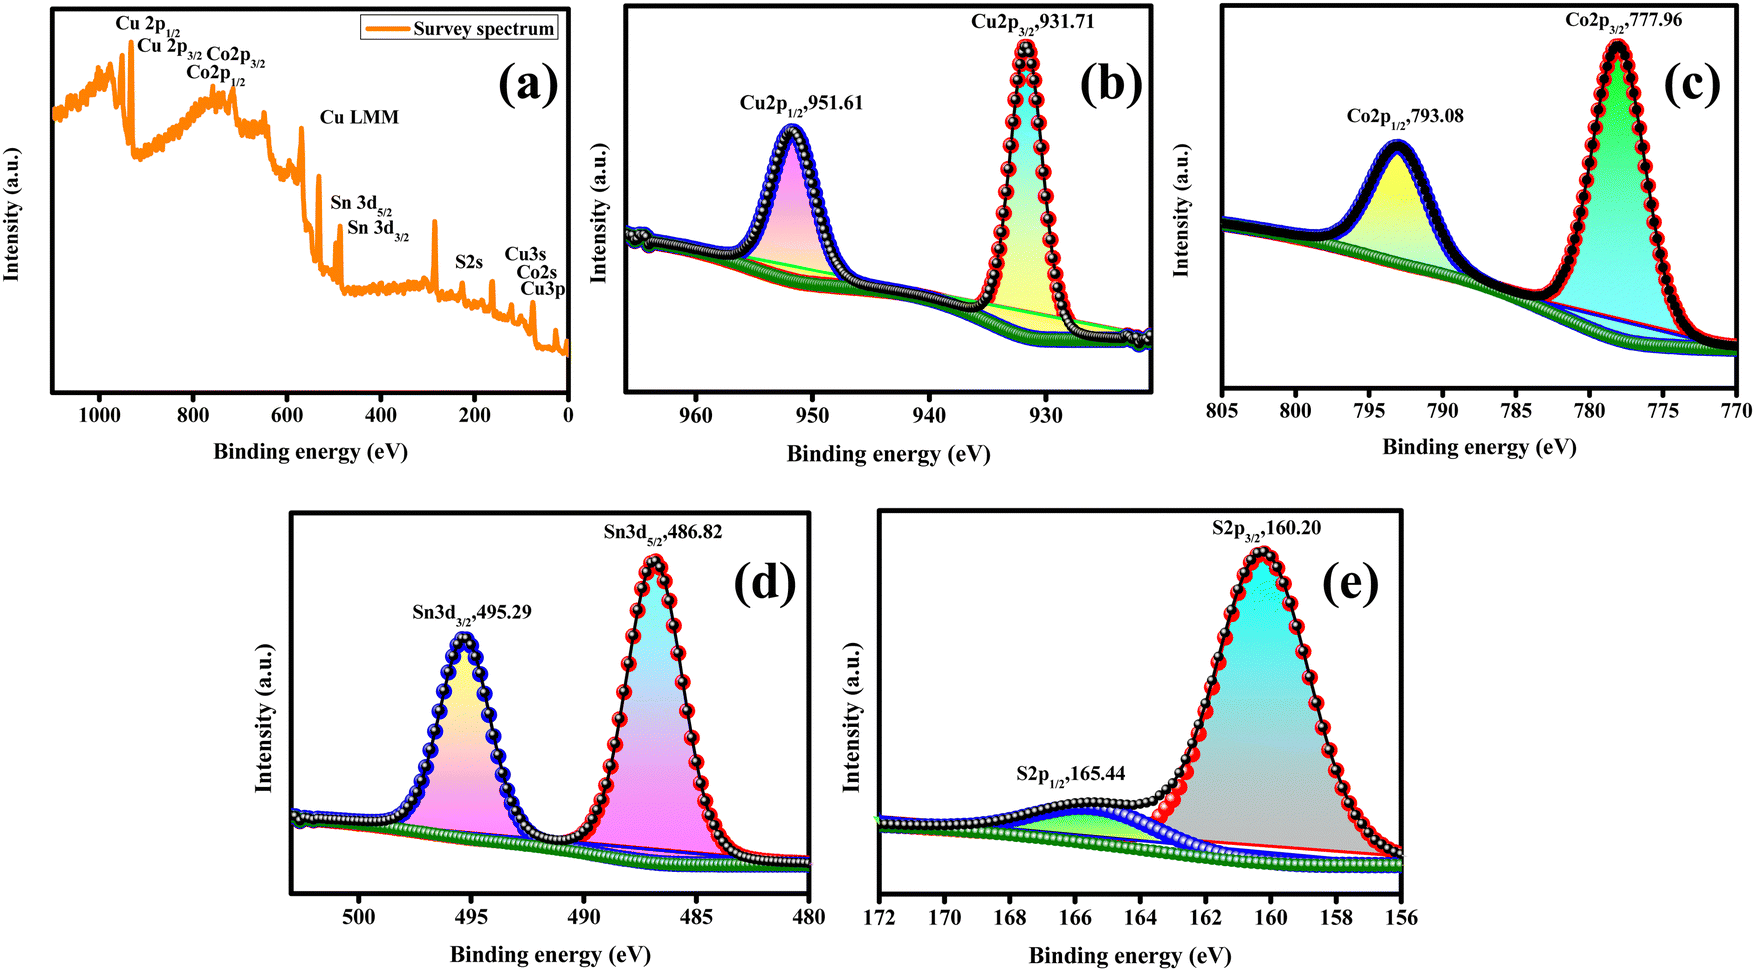
Fig. 4(a) presents the high-resolution XPS scanning survey spectra of the synthesized CCTS-18 h, which shows all the consistent elements of Cu, Co, Sn and S for Cu2CoSnS4. The core level Cu2p spectra has two splits for Cu2p3/2 (931.71 eV) and Cu2p1/2 (951.61 eV), as displayed in Fig. 4(b). The split difference is 19.9 eV, which is indicative of the Cu1+ state, as previously reported. Fig. 4(c) presents the core level spectrum of the Co2p species, which has two splits at 777.96 eV and 793.08 eV for Co2p3/2 and Co2p1/2, respectively. The difference in the splits was calculated to be 15.12 eV, which agrees with the reported Co2+ state. The binding energies at 486.82 eV (Sn3d5/2) and 495.29 eV (Sn3d3/2) are observed in the core level spectrum of Sn3d, as shown in Fig. 4(d). The 8.47 eV peak difference indicates presence of Sn4+. The fitted core level spectrum detected at the binding energies of 160.20 eV and 165.44 eV matches with S2p3/2 and S2p1/2, respectively, and is due to the S−2 species (Fig. 4(e)).46
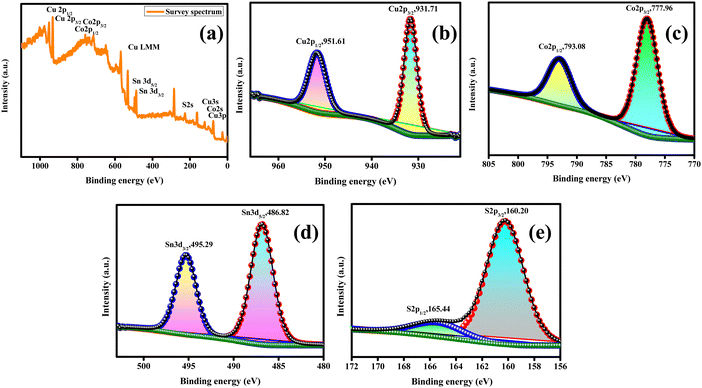 |
| | Fig. 4 XPS of Cu2CoSnS4-18 h. | |
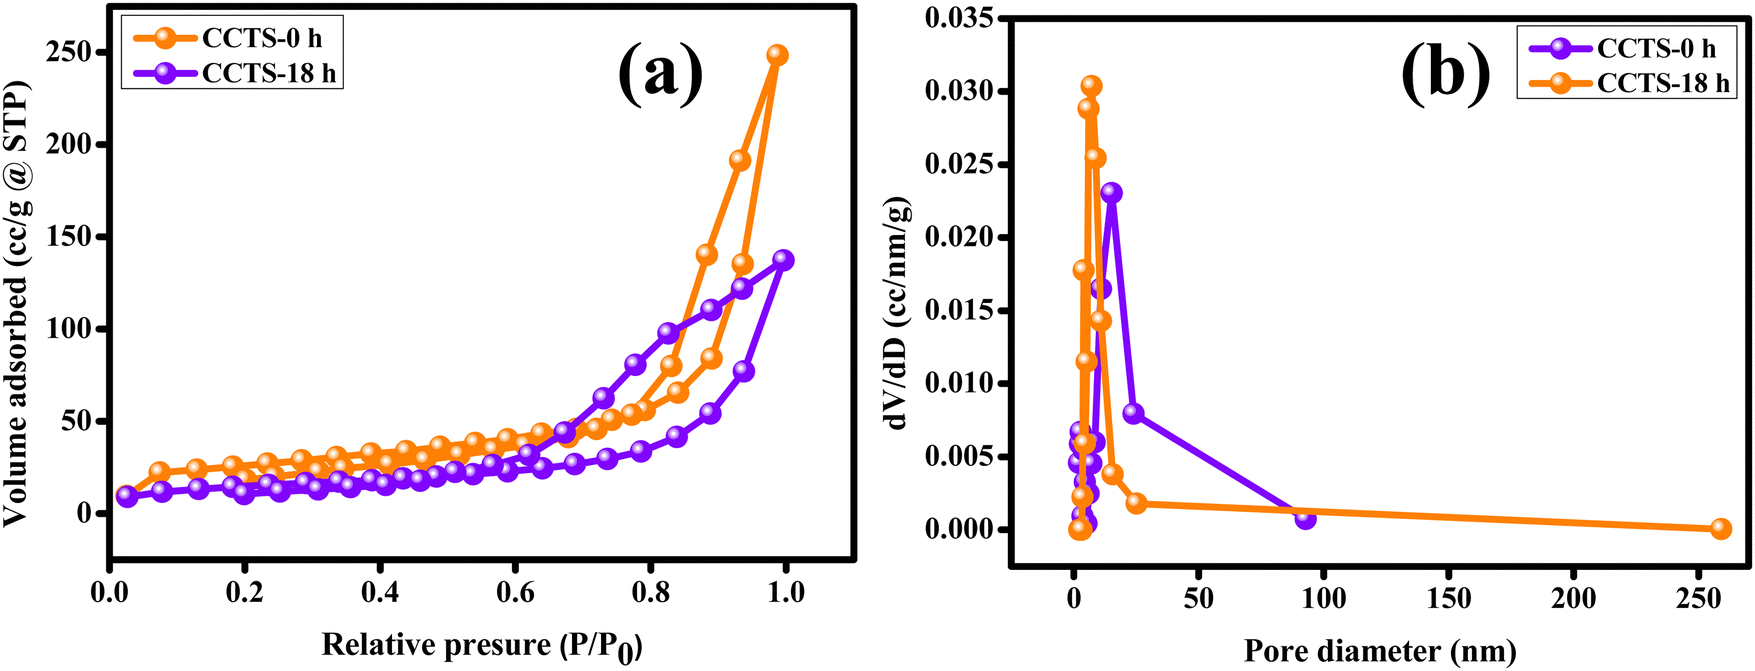
The quality of the synthesized carnation flower-like Cu2CoSnS4 was exemplified by N2 physisorption experiments. The large pores in the carnation flower-shaped structure are formed due to the inter-nanopetal spaces, while the small pores may be attributed to the nanopetals. The BET and BJH methods were used to investigate the specific surface area and porosity of Cu2CoSnS4. Fig. 5(a) shows the N2 adsorption/desorption curves indicative of a type-IV isotherm with an H3 hysteresis loop, representing the mesoporous nature of the Cu2CoSnS4 samples, and Fig. 5(b) shows the pore-size distribution curve. The BET specific surface area (m2 g−1), cumulative pore volume (cc g−1) and average pore diameter (nm) were calculated from the BJH desorption isotherms, as tabulated in Table 1. The mesopores afford a high surface area and high porosity, promoting shorter diffusion paths for charge transport and providing richer electroactive sites to improve the electrochemical performances and potential use of the Cu2CoSnS4 materials in supercapacitor applications.47
 |
| | Fig. 5 (a) N2 adsorption–desorption isotherms of the carnation flower-like Cu2CoSnS4 and (b) the pore-size distribution curves. | |
Table 1 BJH desorption summary
| Sample |
BET specific surface area (m2 g−1) |
Cumulative pore volume (cc g−1) |
Mean pore diameter (nm) |
| CCTS-0 h |
93.902 |
0.395 |
15.158 |
| CCTS-18 h |
105.663 |
0.244 |
7.181 |
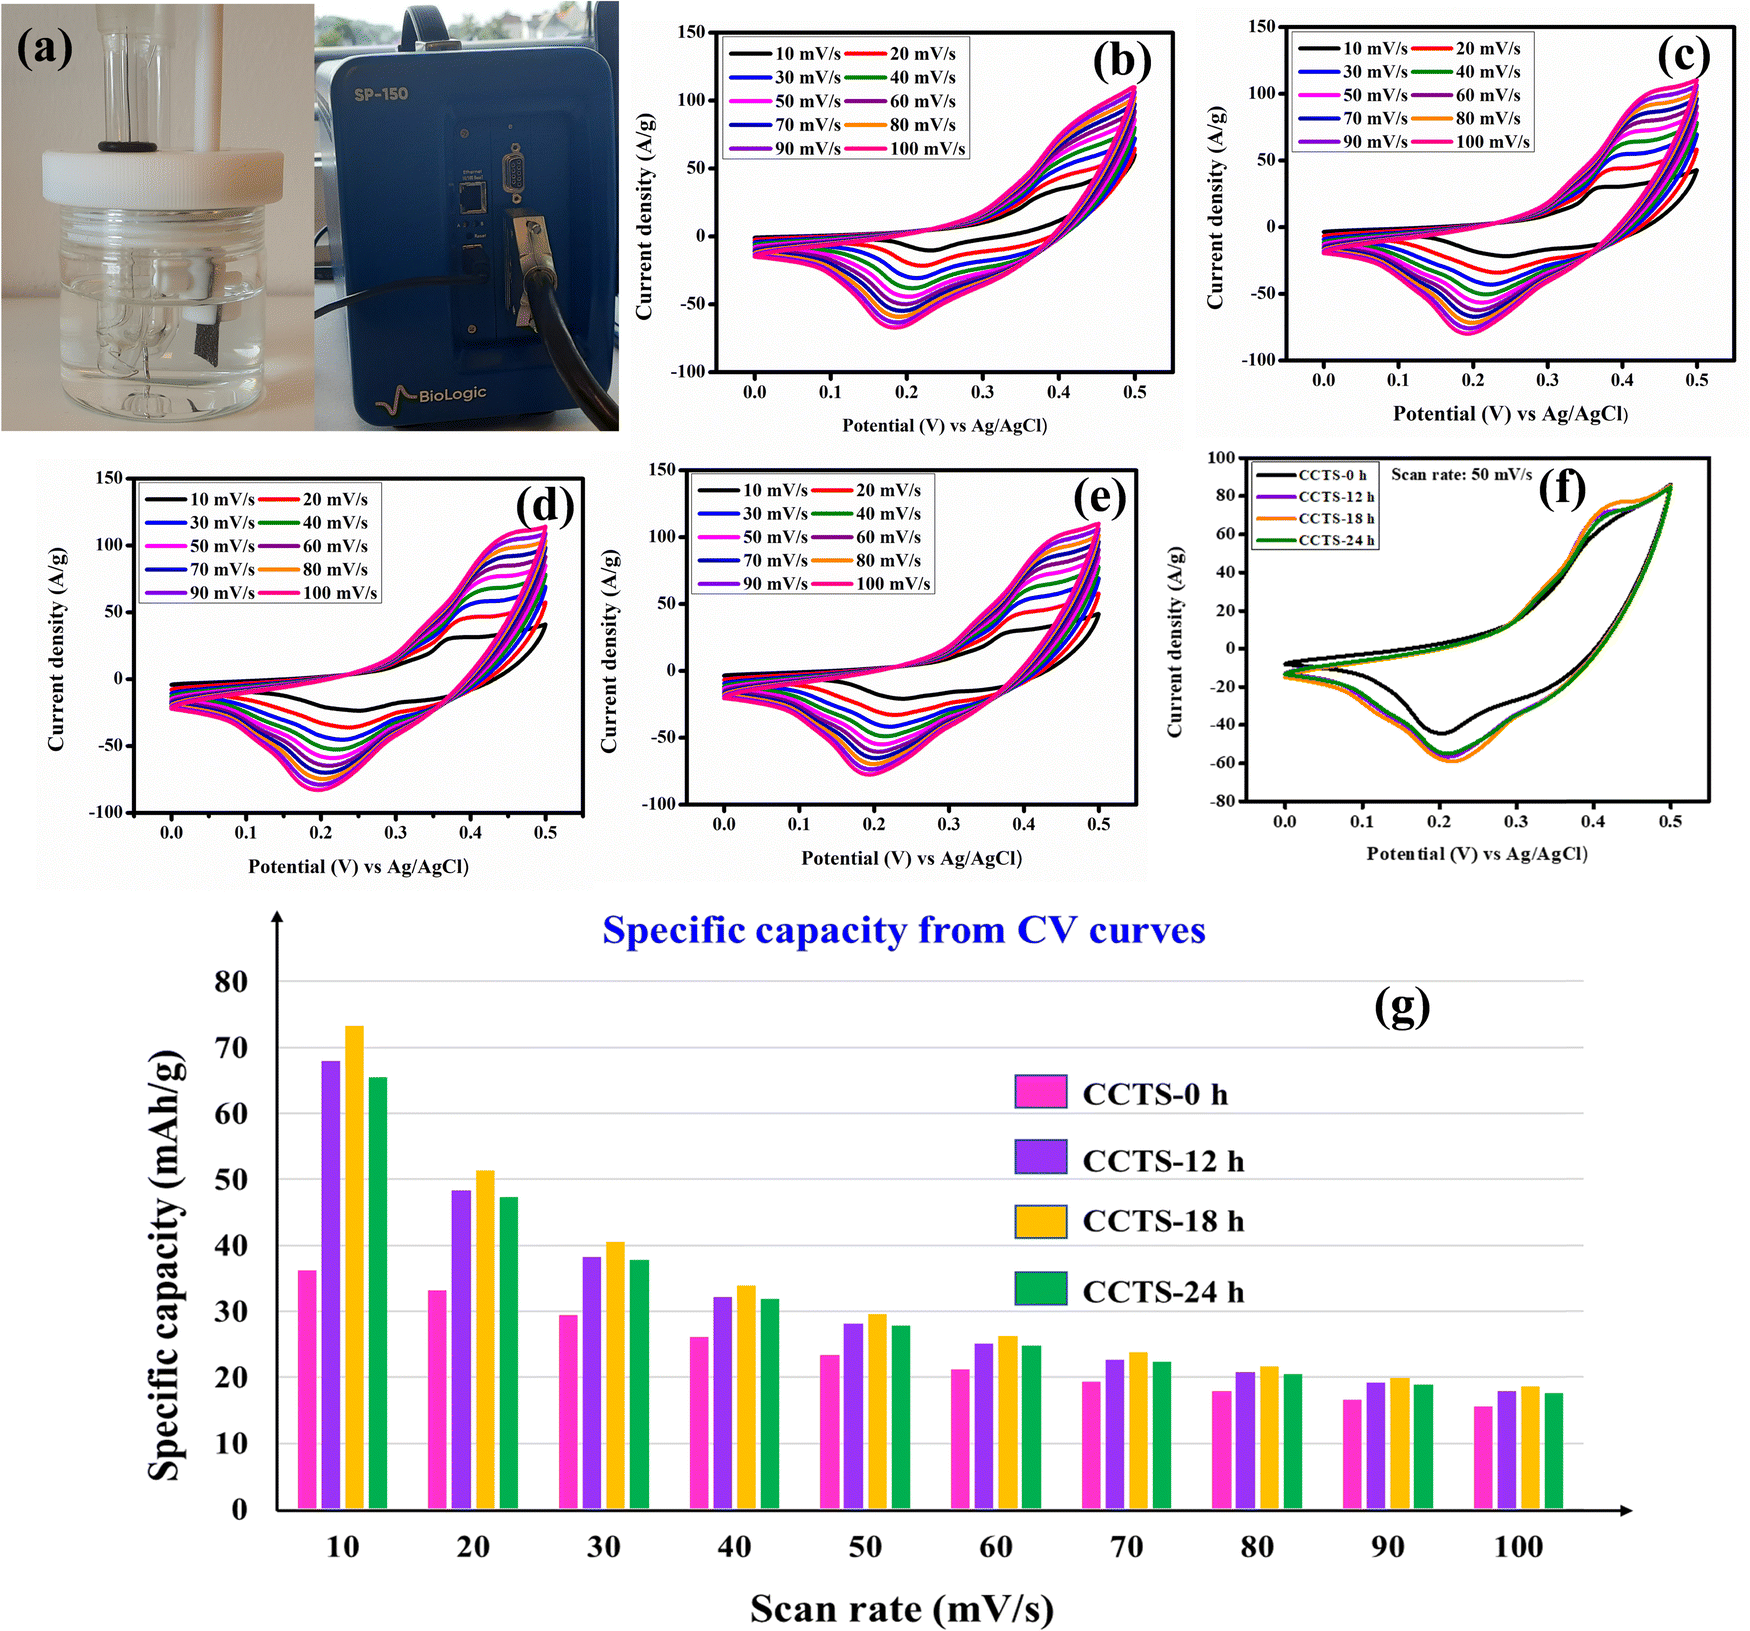
The structure and surface morphology of the materials have a major impact on their electrochemical performance. The carnation flower-like microstructure of the electroactive material affords an enormous surface area for the electrode surface, which provides excellent spacing/intercalation of charges for the electrode material.48 The different fabrication times (CCTS-0 h, CCTS-12 h, CCTS-18 h and CCTS-24 h) of the synthesized materials led to changes in the surface morphology and electrochemical performance. Electrochemical studies were performed for all the electrodes to evaluate the influence of temperature on the electrochemical performance. Metal sulfides are generally considered good candidates for saving a greater amount of charges at the electrode/electrolyte interface and electrode surface.49 Cyclic voltammetry (CV) is a general method to study the reduction and oxidation processes associated with electroactive species and is an excellent way to classify charge storage systems. Electrochemical dual-layer capacitive materials typically show a rectangular CV shape, while pseudocapacitive materials show quasi-rectangular CVs, whereas battery-type electrodes give a pair of oxidation and reduction curves. Fig. 6(a) shows the arrangement of a three-electrode system in an electrolytic cell with a photograph of the electrochemical potentiostat used (Biologic SP-150). Fig. 6(b–e) show the CV curves at 10–100 mV s−1 for the CCTS-0 h, CCTS-12 h, CCTS-18 h and CCTS-24 h electrodes. All the curves show the oxidation and reduction pair and clearly demonstrate that the surface redox reaction is dominant over EDLC. The CV profiles undoubtedly show battery-type behavior, and the possible Faradaic redox mechanisms are proposed as follows:
| | | Cu2CoSnS4 + 9OH− ↔ 2Cu(OH)2 + Co(SOH) + Sn(OH)4 + 3S | (9) |
 |
| | Fig. 6 (a) The three-electrode setup and the instrument. CV profiles of CCTS- (b) 0 h, (c) 12 h, (d) 18 h, (e) and 24 h. (f) CV curves of the different electrodes at 50 mV s−1 and the (g) specific capacity values from the CV profiles. | |
The CV curves of Cu2CoSnS4 exhibit active redox pairs of Cu+/Cu2+, Co2+/Co3+ and Sn2+/Sn4+ working with the support of OH anions in the alkaline medium at a definite potential window. The specific capacity was computed using eqn (2) and (4). At a low 10 mV s−1 scan rate, the prepared CCTS-0 h, CCTS-12 h, CCTS-18 h and CCTS-24 h electrodes deliver 36.18, 67.91, 73.26 and 65.55 mA h g−1 specific capacities, respectively, and the calculated values are shown in Fig. 6(f). Compared to the temperature-aided electrodes, the CCTS-18 h electrode performed better and offered higher electrochemical performance than the other electrodes. The lower the scan rate, the more time it takes for the OH− ions to intercalate to the electrode/electrolyte interface, thus increasing the specific capacity. At a high scan rate, however, less time is available to intercalate with the OH− ions as a result of a decrease in specific capacity.50,51
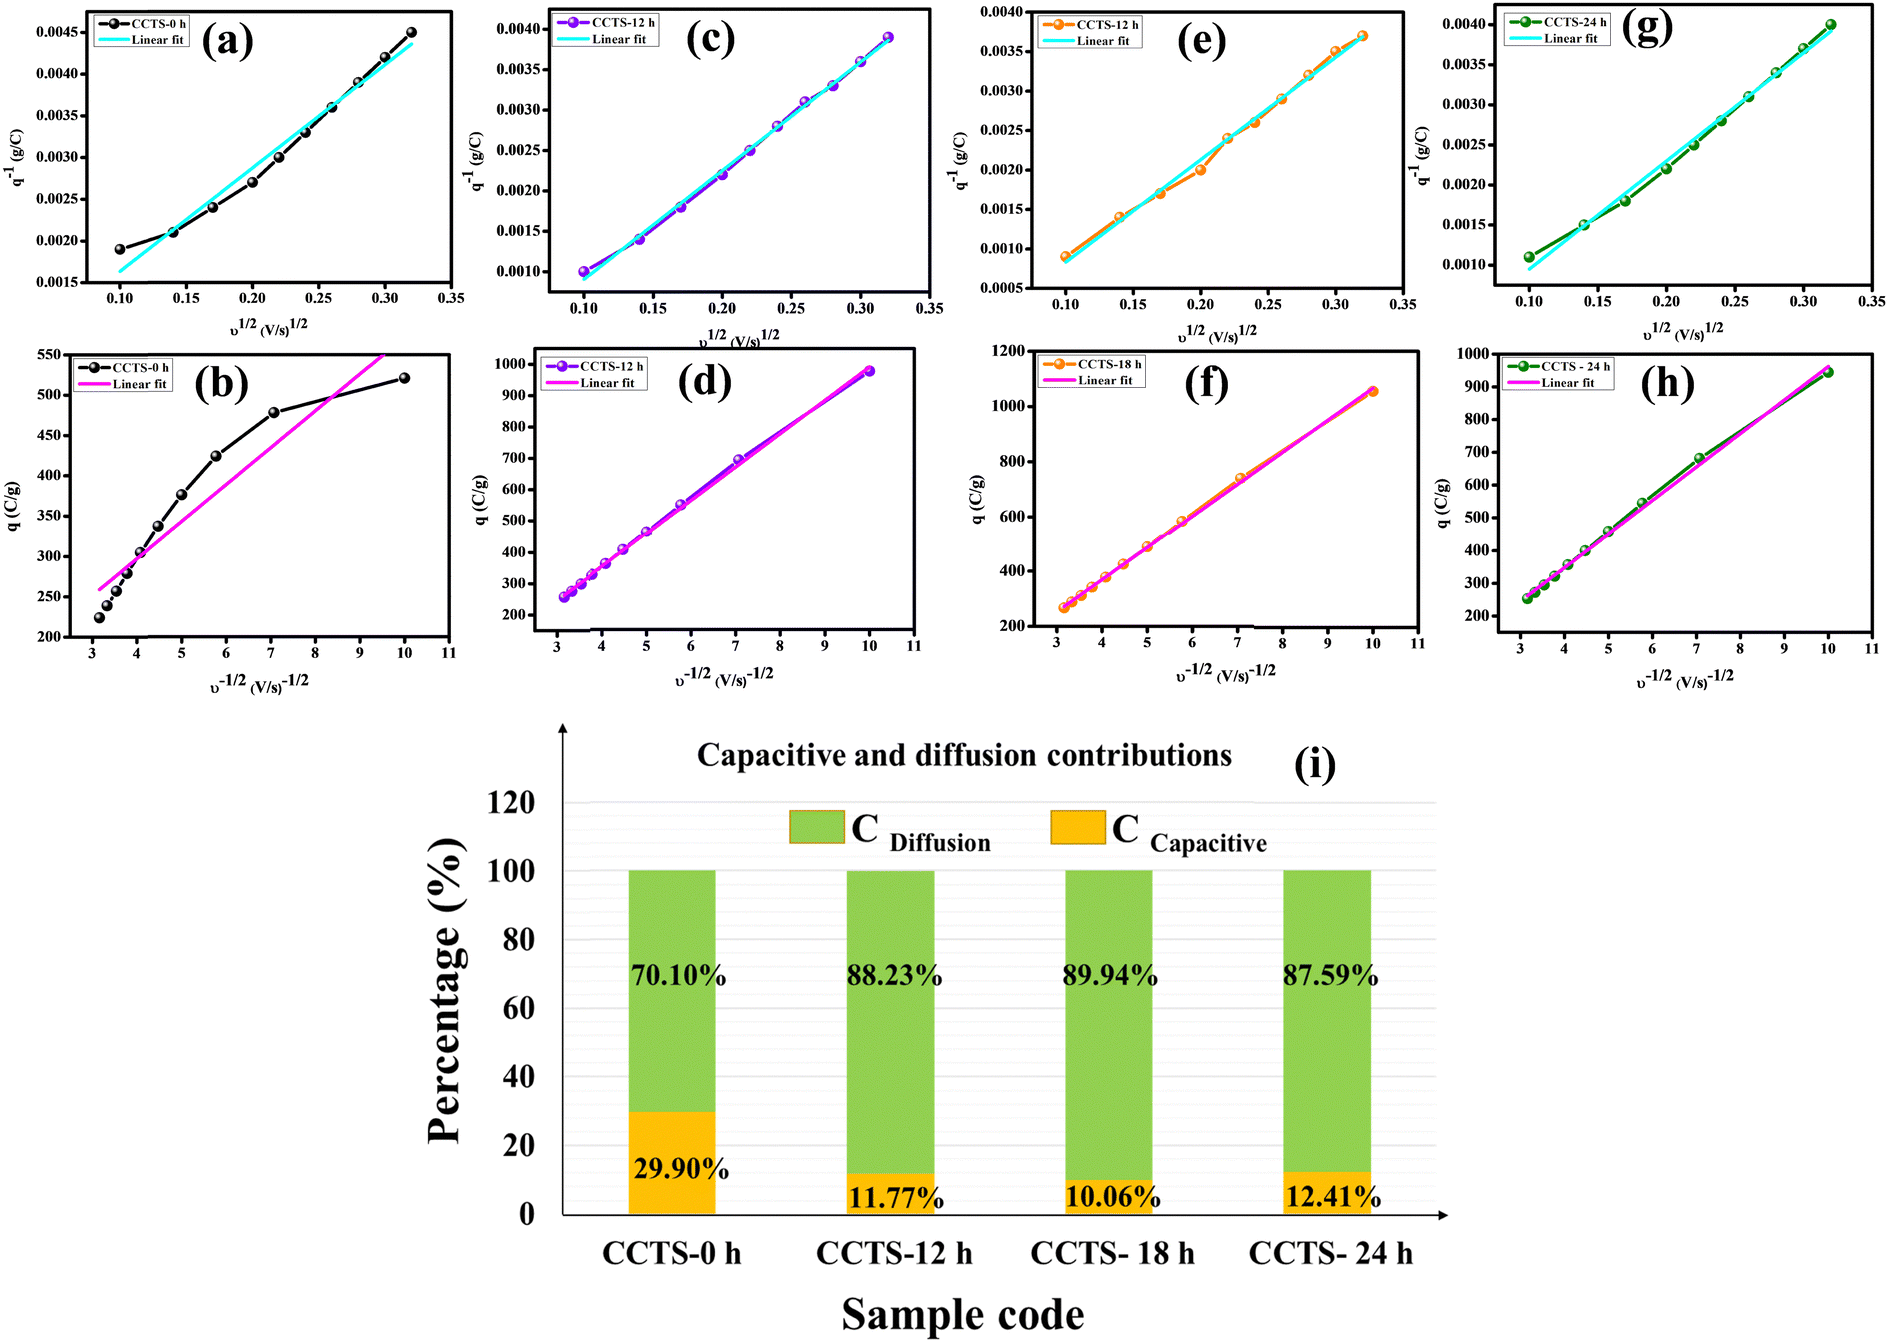
The Trasatti method helps in the categorization of the intrinsic charge storage kinetics of electrode materials. Trasatti et al. proposed a method to approximately calculate the contributions of the ‘inner’ (diffusion-controlled) and ‘outer’ (surface-controlled) surfaces to the total charge (qT = qi + qo) evaluated using cyclic voltammetry curves. The basis of this technique is that charged species (ions) on the inner surfaces follow a diffusion-controlled route, while the electrode outer surface is characterized by a non-diffusion-controlled process that is independent of the scan rate. The detailed calculations of the charge storage process using this method are clearly discussed in our previous work.52 Plotting the reciprocal of the specific capacity (q−1) vs. the square root of the scan rates (v1/2) and q vs. v−1/2 gives linear correlations, which take into account the semi-infinite diffusion of the ions. Owing to the electrode internal resistance and deviation from the semi-infinite ion diffusion from this linear relationship, the data points deviated at high scan rates. Fig. 7(a, c, e, g) present the linear fitting of q−1vs. v1/2 and Fig. 7(b, d, f, h) display the linear fitting of q vs. v−1/2. Trasatti analysis revealed that the maximum capacities for CCTS-18 h from the EDLC (capacitive) and pseudocapacitive (diffusive) contributions are 10.06% and 89.94%, respectively, which are quite a bit higher than those of the other electrodes, as shown in Fig. 7(i).
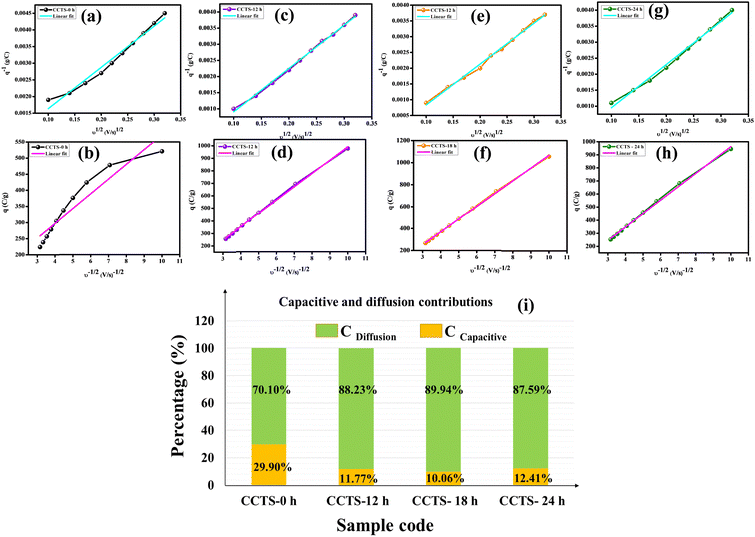 |
| | Fig. 7 Trasatti analysis: (a, c, e, g) Reciprocal specific capacity plots (q−1) vs. the square root of scan rate (v1/2). (b, d, f, h) Plots of the specific capacity (q) vs. the reciprocal of the square root of scan rate (v−1/2). (i) Bar chart displaying the capacitance contributions from electrical double-layer capacitance (EDLC) and pseudocapacitance (PC). | |
A galvanostatic charge–discharge study was carried out for the different current densities of 0.5, 1, 2, 3 and 5 A g−1 for all the electrodes (Fig. 8(a–d)). The GCD results clearly reveal and confirm that the behavior of this material is based on battery-type electrodes. The specific capacity for each discharge curve was calculated using eqn (3). The values are 52.01, 129.72, 132.08 and 65.97 mA h g−1 at 0.5 A g−1 for the CCTS-0 h, CCTS-12 h, CCTS-18 h and CCTS-24 h electrodes, respectively. All the remaining values are pictorially represented in a bar graph in Fig. 8(e). High specific capacities can be achieved at low current densities because of the low Ohmic drop, so that the internally active sites of the electrolyte can easily reach the electrode holes. At higher current densities, the specific capacity values decreases as the rate of the redox reaction is lower.53 The stability of the best performing CCTS-18 h electrode was examined at 5 A g−1, which retained a capacitance of 77.67% for 5000 charge–discharge cycles (Fig. 8(f)).
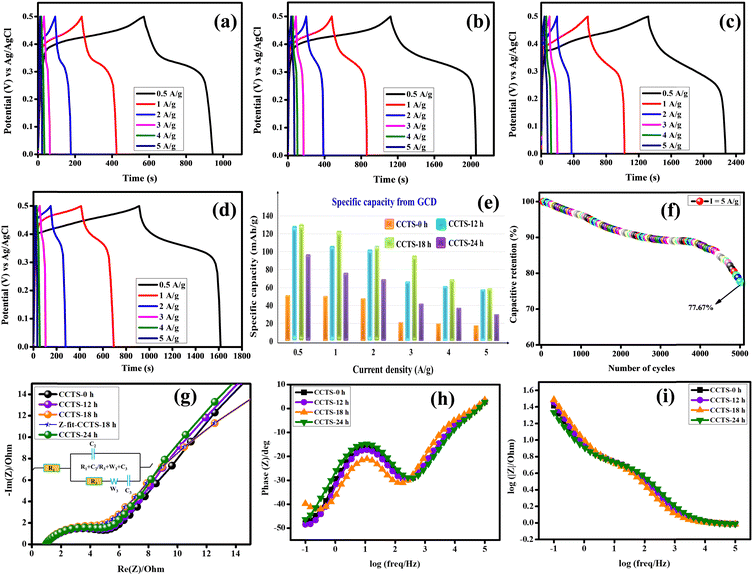 |
| | Fig. 8 GCD profiles of (a) CCTS-0 h, (b) CCTS-12 h, (c) CCTS-18 h, and (d) CCTS-24 h. (e) Specific capacity variation, (f) capacitive retention of CCTS-18 h and (g) Nyquist plot of the EIS spectra. Bode plots of the (h) phase angle vs. frequency and (i) modulus vs. frequency of the prepared electrodes. | |
The kinetic mechanisms for the electrode/electrolyte interfaces of the CCTS-0 h, 12 h, 18 h and 24 h electrodes were evaluated through Nyquist diagrams, as shown in Fig. 8(g), where the inset photograph is the equivalent electrical circuit for the fitting of the Nyquist plots. The equivalent circuit has a semicircular part, which corresponds to the resistor–capacitor at a series connection of solution resistance. The high-frequency region is responsible for the trapping/de-trapping transfer of charge carriers, whereas the medium- and low-frequency semicircular regions correspond to the charge transfer of the surface-active sites.54–56 The diameter of the semicircle in a Nyquist diagram indicates the charge transfer resistance (Rct), which is primarily a function of the ions shifting between the electrode and electrolyte. The Rct values are 2.704, 2.607, 2.206 and 2.647 Ω for the CCTS-0 h, 12 h, 18 h and 24 h electrodes, respectively. The intercept with the real axis gives the equivalent series resistance (Rs), and is a consequence of the intrinsic resistance of the electrode material and electrolyte. The lowest solution resistance and the charge transfer resistance of the CCTS-18 h electrodes indicate rapid ion/electron transfer kinetics during the redox reaction process and could provide high conductivity to improve the specific capacity. Table 2 lists the fitted parameter values of the Nyquist plots. Bode plots are the second-most important form of EIS analysis, and contain important information related to the frequency used, i.e., changes in capacitance, resistance, and ion diffusion of the electrodes. From the Bode plots (Fig. 8(h) and (i)), the CCTS-18 h electrode is found to reveal better electrical/ionic resistance with a smaller value of equivalent series resistance (ESR) at the high-frequency range than the other electrodes. In addition, all the electrodes deviated from the 90° angle from the phase angle vs. frequency curve, which indicates battery-type behavior.
Table 2 Nyquist plot Z fit analysis
| Parameter |
Equivalent circuit: R1 + C2/(R3 + W3 + C3) |
| CCTS-0 h |
CCTS-12 h |
CCTS-18 h |
CCTS-24 h |
Unit |
|
R
1 = Rs |
1.053 |
1.004 |
1.0054 |
1.023 |
Ohm |
|
C
2
|
0.205 |
0.273 |
0.373 |
0.224 |
F |
|
R
3 = Rct |
2.704 |
2.607 |
2.206 |
2.647 |
Ohm |
|
S
3
|
9.867 |
10.74 |
13.99 |
10.05 |
Ohm s(−1/2) |
|
C
3
|
0.1967 |
0.2418 |
0.5392 |
0.2234 |
F |
To check the practical applicability, an asymmetric solid-state supercapacitor (ASSC) device was built with CCTS-18 h as the positive electrode and activated carbon as the negative electrode. Fig. 9(a) shows a description of the assembled ASSC device (CCTS-18 h//AC) with the applied power source. The structure of the ASSC device and the comparative CV curves of the negative (−1 to 0 V) and positive electrode (0 to 0.5 V) are illustrated in Fig. 9(b). Fig. 9(c) presents the CV profiles of the two electrode measurements for the 0–1.5 V potential range with different scan rates from 10 to 100 mV s−1. The active mass was 2 mg in the three-electrode and 7 mg in the two-electrode configurations (2 mg and 5 mg in both the positive and negative electrodes, respectively, in the two-electrode configurations). The CV curves were similar for all scan rates, showing the good reversibility and quick charge–discharge capability of the ASSC device. The charge–discharge profile and discharge profile with diverse current densities of the ASSC device are illustrated in Fig. 9(d and e). Although the current density was amplified from 1 to 25 A g−1, at higher current density, its discharge time was very close to the charge time, which indicates the good Coulombic efficiency and good electrochemical reversibility of the device. The capacitive retention of the ASSC device was verified with 78% retention and 97.98% Coulombic efficiency in 20000 charge–discharge cycles, as displayed in Fig. 10(a).57,58 The capacitive parameters of the energy and power density from the GCD plots of CCTS-18 h//AC in the two-electrode configuration and other reported values are summarized in Table 3. Based on these values, a Ragone plot was prepared to compare the power density against the energy density, as shown in Fig. 10(b).
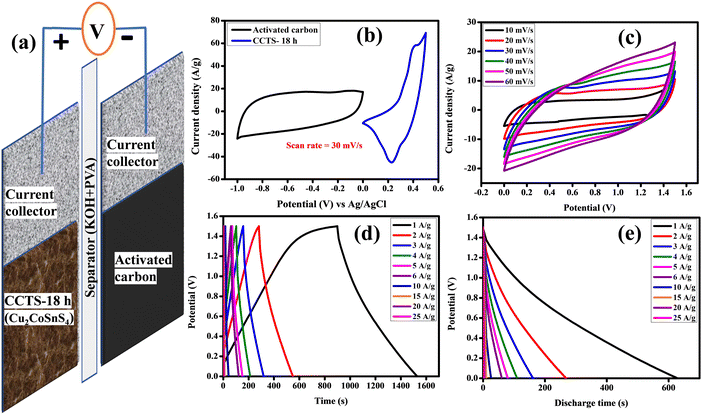 |
| | Fig. 9 (a) Schematic illustration of the ASSC. (b) Comparative graph, (c) CV curves, (d) GCD curves and (e) discharge curves of the ASSC. | |
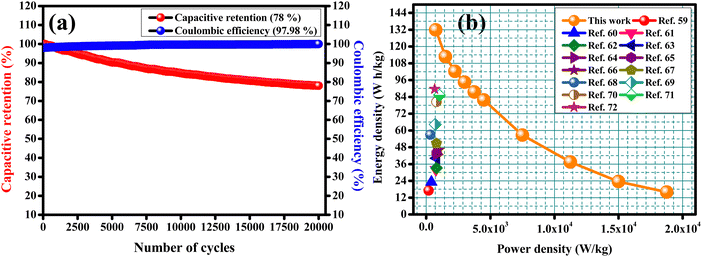 |
| | Fig. 10 (a) Capacitive retention and Coulombic efficiency and (b) Ragone plot. | |
Table 3 Capacitive parameters from the GCD plots in the two-electrode configuration
| Potential window (V) |
Current (A) |
Discharge time (s) |
Specific capacitance (F g−1) |
Energy density (W h kg−1) |
Power density (W kg−1) |
| 1.5 |
1 |
633.14 |
422.09 |
131.90 |
749.98 |
| 2 |
270.63 |
360.84 |
112.76 |
1499.97 |
| 3 |
163.55 |
327.10 |
102.21 |
2249.81 |
| 4 |
113.37 |
302.32 |
94.48 |
3000.15 |
| 5 |
83.97 |
279.90 |
87.47 |
3750.05 |
| 6 |
65.39 |
261.56 |
81.74 |
4500.14 |
| 10 |
27.21 |
181.40 |
56.69 |
7500.33 |
| 15 |
12.00 |
120.00 |
37.50 |
11250.00 |
| 20 |
5.64 |
75.20 |
23.50 |
15000.00 |
| 25 |
3.08 |
51.33 |
16.04 |
18758.05 |
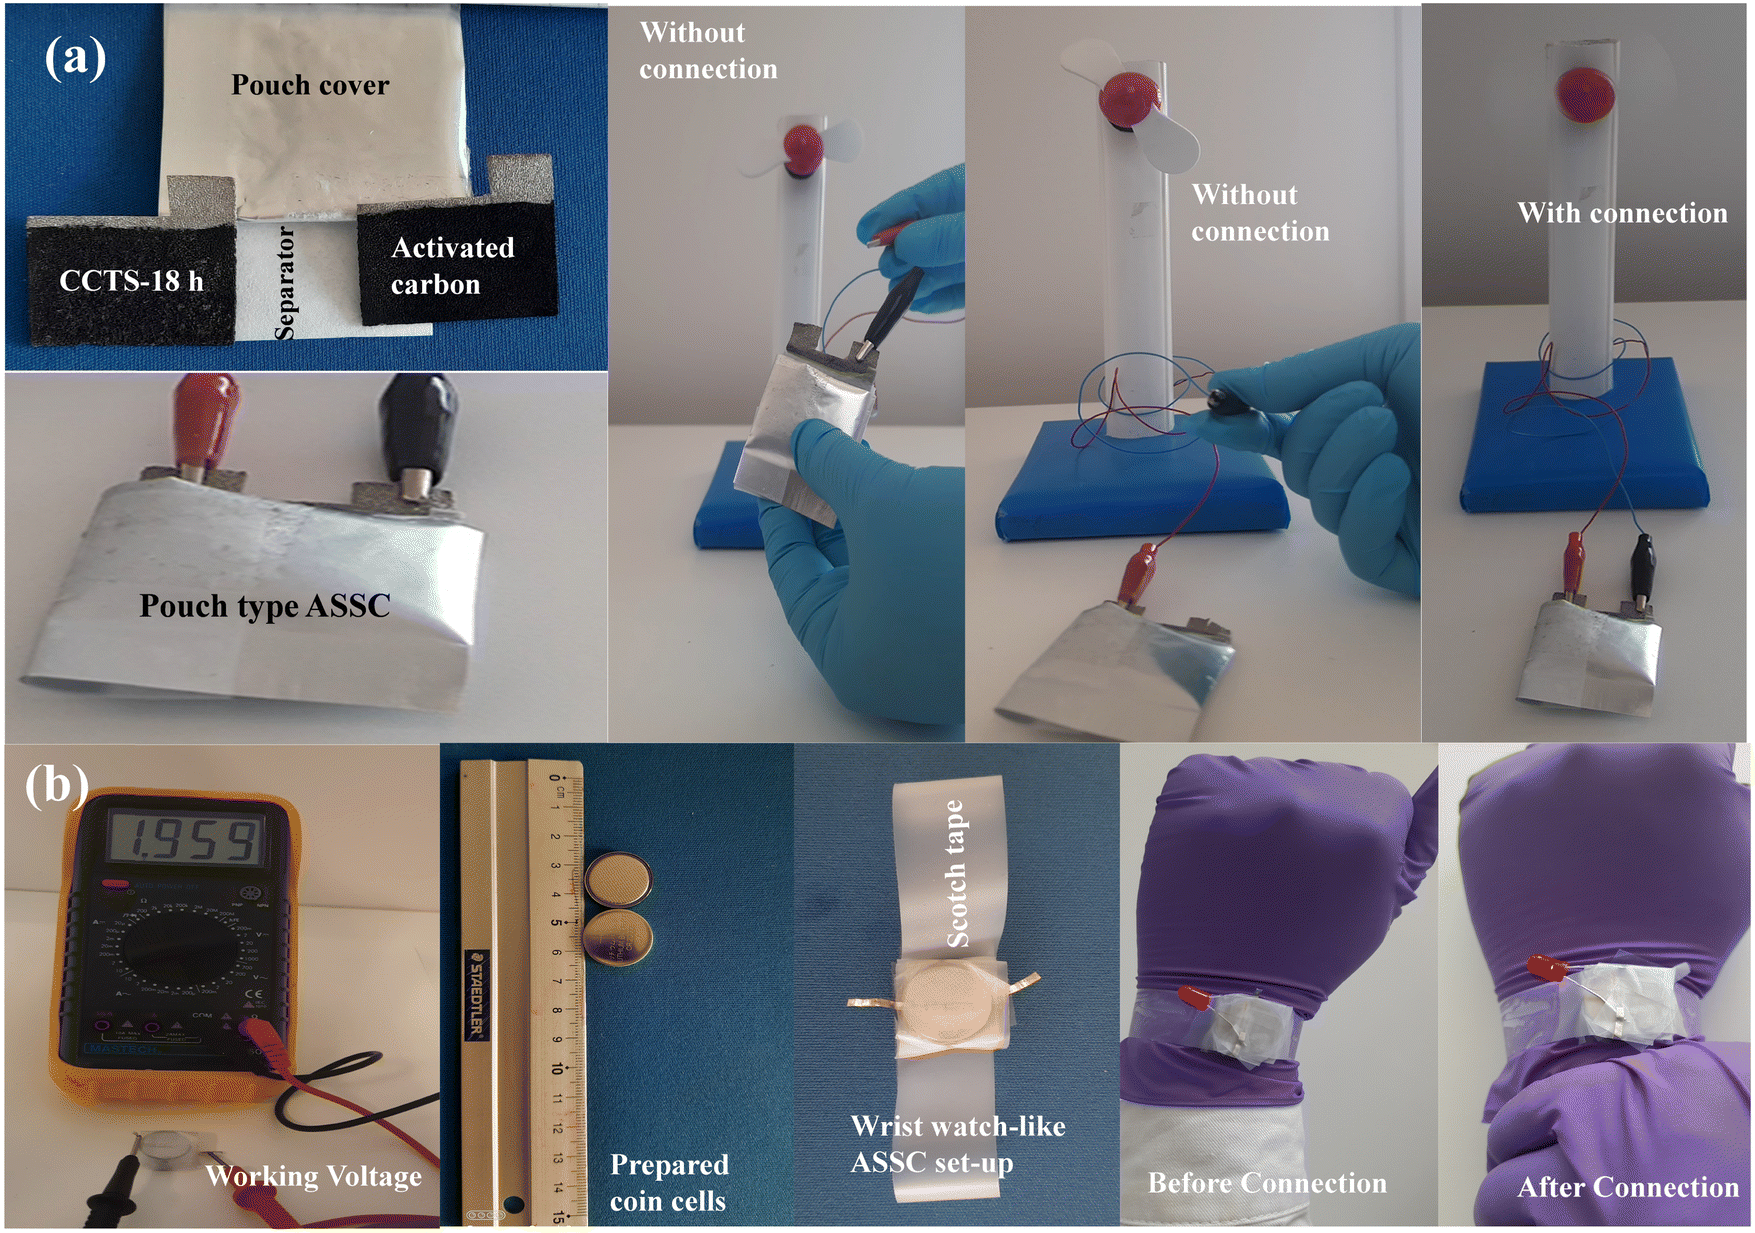
Photographic assembled pouch-type and coin-cell-type ASSCs were constructed to evaluate the device for practical applications. Fig. 11(a) shows the pouch-type ASSC supercapacitor device using Ni foam. The prepared device showed excellent electrochemical performance after charging for 10 s, whereby the device could operate a mini-sized 1.5 V electric table fan. This demonstration refers to the best possible use for its practical application in energy storage applications. Lastly, in terms of being used for a realistic perspective, we connected a two-coin-cell-type ASSC device in series to extend the voltage window designed for switch applications. The electrode material in all the coin cells had an area of about 1 cm2. The function of the coin-cell-type ASSCs can be extended to design a wristwatch-like application by considering the compact design displayed in Fig. 11(b). A 2-coin-cell-type ASSC connected with the help of Scotch tape was designed. A comparison of the energy storage properties of Cu2CoSnS4//AC with those of other reported materials is shown in Table 4.
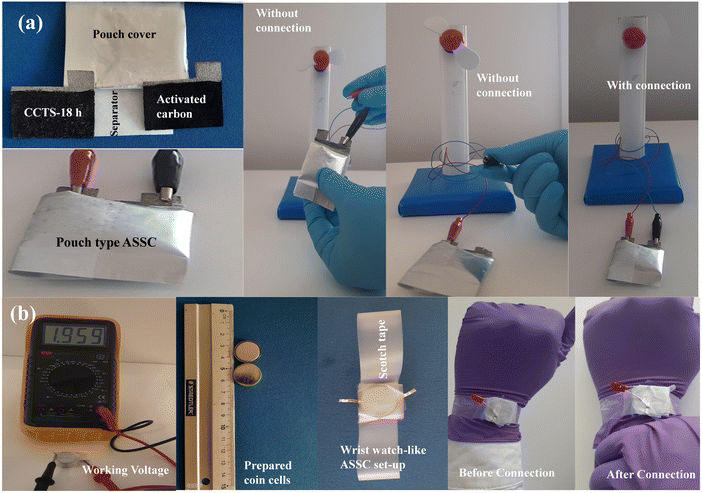 |
| | Fig. 11 (a) Working model of the pouch-type ASSC and (b) photograph of the assembled wristwatch-like coin-cell ASSC. | |
Table 4 Comparison of the energy storage properties of Cu2CoSnS4//AC with other reported results
| Device materials |
Electrolyte |
Working potential (V) |
Energy density (W h kg−1) |
Power density (W kg−1) |
Capacitive retention (%) @ cycle |
Ref. |
| CuCo2S4 on carbon textile//AC |
PVA/KOH (9:1 ratio) |
1.6 |
17.12 |
194.4 |
78.4%@3000 |
59
|
| CuCo2S4/CNTs-3.2%//AC |
2 M KOH |
1.6 |
23.2 |
402.7 |
87.5%@10000 |
60
|
| CuCo2S4@NiCo(OH)2//CuCo2S4@NiCo(OH)2 |
3 M KOH |
1.5 |
32 |
750 |
92%@2000 |
61
|
| CuCo2S2/CuCo2O4//graphene |
2 M KOH |
1.6 |
33.2 |
800 |
73%@10000 |
62
|
| N-DLCHs//CuCo2S4 |
6 M KOH |
1.6 |
40.2 |
799.1 |
90.89%@5000 |
63
|
| CuCo2S4/CC//AC/CC |
PVA/KOH (3 g) |
1.6 |
42.9 |
800 |
80%@5000 |
64
|
| CuCo2S4//AC |
3 M KOH |
1.6 |
43.65 |
∼800 |
91.7%@10000 |
65
|
| CuCo2S4/Ni foam//AC |
3 M KOH |
1.6 |
46.1 |
991.6 |
70.8%@4000 |
66
|
| r-NiCo2S4-6 HSs//N/S-AC |
PVA + KOH |
1.6 |
50.76 |
800 |
91.35%@5000 |
67
|
| CuCo2S4 NRAs//AC |
PVA + KOH |
1.6 |
56.96 |
320 |
88%@5000 |
68
|
| SnNi2S4//AC |
2 M KOH |
1.41 |
64.38 |
700.3 |
98.38%@10000 |
69
|
| CePO4@CuCo2S4//AC |
2 M KOH |
1.6 |
80.4 |
799.5 |
94.4%@10000 |
70
|
| MCNSvac//AC |
1 M KOH |
1.8 |
85.2 |
1030 |
79.1%@10000 |
71
|
| CuCo2S4 NS//Fe2O3/NG//AC |
PVA + KOH |
1.6 |
89.6 |
663 |
91.5%@10000 |
72
|
| Cu2CoSnS4//AC |
PVA + KOH |
1.5 |
131.90 |
749.98 |
78%@20000 |
This work |
4. Conclusion
In summary, morphological analysis was performed for the quaternary formation of Cu2CoSnO4 materials at different times and their electrochemical performances were evaluated. The as-synthesized materials possessed not only a high specific surface area and high specific capacity but also an excellent carination flower-like morphology with multiple sheets; all of these revealed that they could be excellent electrodes for supercapacitors. The morphologies were tailored using different times in the fabrication process. The best-performing CCTS-18 h electrode exhibited an elevated specific capacity (132.08 mA h g−1 at 0.5 A g−1), low solution and charge transfer resistance, and improved capacitive retention (77.67 at 5 A g−1) over 5000 cycles in three-electrode measurements. In addition, an as-fabricated ASSC produced with CCTS-18 h as the cathode and activated carbon as the negative electrode and PVA/KOH electrolyte revealed ideal capacitive characteristics with a capacitance of 422.09 F g−1, energy density of 131.90 W h kg−1 and power density of 749.98 W kg−1 at 1 A g−1. Finally, to check the practical applicability, two sets of ASSC supercapacitor devices were designed in the form of pouch-type and wristwatch-like coin-cell-type devices. The fabricated pouch-type supercapacitor device could run a small laboratory-level self-made motor and the coin-cell could drive a red-colored LED for more than 15 min, thus showing potential use in practical applications. Moreover, this study offers a facile and unique route for the effective utilization of quaternary battery-type materials for supercapacitor applications.
Conflicts of interest
There are no conflicts to declare.
Acknowledgements
This work was supported by UGC-SAP, DST-FIST, DST-PURSE, and MHRD-RUSA grants.
References
- A. A. Kebede, T. Kalogiannis, J. Van Mierlo and M. Berecibar, Renewable Sustainable Energy Rev., 2022, 159, 112213 CrossRef CAS.
- A. G. Olabi, Q. Abbas, A. Al Makky and M. A. Abdelkareem, Energy, 2022, 248, 123617 CrossRef CAS.
- G. Smdani, M. R. Islam, A. N. Ahmad Yahaya and S. I. Bin Safie, Energy & Environment, 2022, 0958305X221074729 Search PubMed.
- S. M. Benoy, M. Pandey, D. Bhattacharjya and B. K. Saikia, J. Energy Storage, 2022, 52, 104938 CrossRef.
- T. Xu, H. Du, H. Liu, W. Liu, X. Zhang, C. Si, P. Liu and K. Zhang, Adv. Mater., 2021, 2101368 CrossRef CAS PubMed.
- K. A. Sammed, L. Pan, A. Farid, M. Javid, H. Huang and Y. Zhao, Nanoscale, 2021, 13, 11943–11952 RSC.
- J. Tian, N. Cui, P. Chen, K. Guo and X. Chen, J. Mater. Chem. A, 2021, 9(36), 20635–20644 RSC.
- M. A. Nassar, S. I. El-dek, W. M. El Rouby and A. G. El-Deen, J. Energy Storage, 2021, 44, 103305 CrossRef.
- J. Huang, K. Yuan and Y. Chen, Adv. Funct. Mater., 2021, 2108107 Search PubMed.
-
M. Mishra, S. K. Behura, M. Beidaghi, K. Verma and S. Singh, Advanced Applications of 2D Nanostructures, 2021, pp. 73–98 Search PubMed.
- R. N. A. R. Seman, M. A. Azam and A. A. Mohamad, Renewable Sustainable Energy Rev., 2017, 75, 644–659 CrossRef CAS.
- L. Wan, Y. Yuan, J. Liu, J. Chen, Y. Zhang, C. Du and M. Xie, Electrochim. Acta, 2021, 368, 137579 CrossRef CAS.
- L. Liu, Z. Xie, X. Du, D. Yu, B. Yang, B. Li and X. Liu, Chem. Eng. J., 2021, 132815 Search PubMed.
- D. P. Chatterjee and A. K. Nandi, J. Mater. Chem. A, 2021, 9, 15880–15918 RSC.
- Z. Shi, G. Sun, R. Yuan, W. Chen, Z. Wang, L. Zhang, K. Zhan, M. Zhu, J. Yang and B. Zhao, J. Mater. Sci. Technol., 2022, 99, 260–269 CrossRef.
- J. Zou, D. Xie, J. Xu, X. Song, X. Zeng, H. Wang and F. Zhao, Appl. Surf. Sci., 2021, 151322 Search PubMed.
- M. A. Azam, N. S. N. Ramli, N. A. N. M. Nor and T. I. T. Nawi, Int. J. Energy Res., 2021, 45, 8335–8346 CrossRef CAS.
- Y. Fang, Q. Zhang and L. Cui, Microporous Mesoporous Mater., 2021, 110870 CrossRef CAS.
- S. E. Moosavifard, A. Mohammadi, M. E. Darzi, A. Kariman, M. M. Abdi and G. Karimi, Chem. Eng. J., 2021, 415, 128662 CrossRef CAS.
- I. A. Safo, M. Werheid, C. Dosche and M. Oezaslan, Nanoscale Adv., 2019, 1, 3095–3106 RSC.
- M. Priya, P. Vasantharani and G. Sivakumar, Materials Technology, 2022, 1–11 CrossRef.
- M. A. Dar, M. Y. Bhat, N.
A. Mala, H. A. Rather, S. Venkatachalam and N. Srinivasan, Mater. Today: Proc., 2022 DOI:10.1016/j.matpr.2022.05.264.
- K. Liu, B. Yao, Y. Li, Z. Ding, Z. Xiao, Y. Jiang, G. Wang and D. Pan, New J. Chem., 2017, 41, 685–691 RSC.
- A. C. Lokhande, P. T. Babar, V. C. Karade, M. G. Gang, V. C. Lokhande, C. D. Lokhande and J. H. Kim, J. Mater. Chem. A, 2019, 7, 17118–17182 RSC.
- K. Mokurala, S. Mallick and P. Bhargava, J. Power Sources, 2016, 305, 134–143 CrossRef CAS.
- J. Rehman, K. Eid, R. Ali, X. Fan, G. Murtaza, M. Faizan, A. Laref, W. Zheng and R. S. Varma, ACS Appl. Energy Mater., 2022, 5(6), 6481–6498 CrossRef CAS.
- M. Beraich, M. Taibi, A. Guenbour, A. Zarrouk, M. Boudalia, A. Bellaouchou, M. Tabyaoui, S. Mansouri, Z. Sekkat and M. Fahoume, Optik, 2019, 193, 162996 CrossRef CAS.
- M. Krishnaiah, A. Kumar, S. H. Jin and J. Song, Data Brief, 2020, 32, 106103 CrossRef PubMed.
- H. Guan, X. Ma and J. Zhao, Micro Nano Lett., 2020, 15, 258–260 CrossRef CAS.
- M. Isacfranklin, R. Yuvakkumar, G. Ravi, S. I. Hong, D. Velauthapillai, M. Thambidurai, C. Dang, T. S. Algarni and A. M. Al-Mohaimeed, Carbon, 2021, 172, 613–623 CrossRef CAS.
- M. Isacfranklin, R. Yuvakkumar, G. Ravi, B. Saravanakumar, M. Pannipara, M. A. G. Al-Sehemi and D. Velauthapillai, ACS Omega, 2021, 6, 9471–9481 CrossRef CAS PubMed.
- K. Murugesan, S. Perumal, A. Sankaiya, K. B. Lankamsetty, G. Nagaraju, B. Karuppannan, Y. Rathinam and R. Ganesan, ACS Sustainable Chem. Eng., 2021, 9, 1656–1668 CrossRef CAS.
- M. Isacfranklin, R. Yuvakkumar, G. Ravi, S. I. Hong, F. Shini, M. Thambidurai, C. Dang and D. Velauthapillai, Sci. Rep., 2020, 10, 1–12 CrossRef PubMed.
- Y. Cui, R. Deng, G. Wang and D. Pan, J. Mater. Chem., 2012, 22, 23136–23140 RSC.
- M. A. Ahmed, N. A. Bakr and A. A. Kamil, Chalcogenide Lett., 2019, 16, 231–239 CAS.
- A. T. A. Ahmed, S. M. Pawar, A. I. Inamdar, H. Im and H. Kim, Int. J. Energy Res., 2020, 44, 1798–1811 CrossRef CAS.
- M. Patel, I. Mukhopadhyay and A. Ray, J. Phys. D: Appl. Phys., 2012, 45, 445103 CrossRef.
- X. Meng, J. Deng, J. Zhu, H. Bi, E. Kan and X. Wang, Sci. Rep., 2016, 6, 1–9 CrossRef PubMed.
- M. Gusain, P. Rawat and R. Nagarajan, RSC Adv., 2015, 5, 43202–43208 RSC.
- V. Maheskumar and B. Vidhya, J. Photochem. Photobiol., A, 2018, 356, 521–529 CrossRef CAS.
- R. K. Mishra, G. W. Baek, K. Kim, H. I. Kwon and S. H. Jin, Appl. Surf. Sci., 2017, 425, 923–931 CrossRef CAS.
- N. Parveen, S. A. Ansari, H. R. Alamri, M. O. Ansari, Z. Khan and M. H. Cho, ACS Omega, 2018, 3, 1581–1588 CrossRef CAS PubMed.
- I. Sheebha, V. Venugopal, J. James, V. Maheskumar, A. Sakunthala and B. Vidhya, Int. J. Hydrogen Energy, 2020, 45, 8139–8150 CrossRef CAS.
- X. Feng, Y. Huang, C. Li, Y. Xiao, X. Chen, X. Gao and C. Chen, Electrochim. Acta, 2019, 308, 142–149 CrossRef CAS.
- J. Zhong, Q. Wang and W. Cai, Mater. Lett., 2015, 150, 69–72 CrossRef CAS.
- M. Krishnaiah, A. Kumar, S. H. Jin and J. Song, Data Brief, 2020, 32, 106103 CrossRef PubMed.
- B. K. Rajwar and S. K. Sharma, J. Sol-Gel Sci. Technol., 2020, 96, 423–430 CAS.
- X. Feng, Y. Huang, C. Li, Y. Xiao, X. Chen, X. Gao and C. Chen, Electrochim. Acta, 2019, 308, 142–149 CrossRef CAS.
- W. Chen, P. Yuan, S. Guo, S. Gao, J. Wang, M. Li, F. Liu, J. Wang and J. P. Cheng, J. Electroanal. Chem., 2019, 836, 134–142 CrossRef CAS.
- M. K. Sahoo, M. Gusain, S. Thangriyal, R. Nagarajan and G. R. Rao, J. Solid State Chem., 2020, 282, 121049 CrossRef CAS.
- S. Jayasubramaniyan, S. Balasundari, S. J. Yeom, N. Naresh, T. Rani, E. V. Rapaka, N. Satyanarayana, H. W. Lee and P. Muralidharan, Electrochim. Acta, 2021, 390, 138865 CrossRef CAS.
- M. Isacfranklin, R. Yuvakkumar, G. Ravi, D. Velauthapillai, M. Pannipara and A. G. Al-Sehemi, Nanoscale Adv., 2021, 3, 486–498 RSC.
- H. B. Li, G. F. Xiao, H. Y. Zeng, X. J. Cao, K. M. Zou and S. Xu, Electrochim. Acta, 2020, 352, 136500 CrossRef CAS.
- H. Li, Z. Li, Z. Wu, M. Sun, S. Han, C. Cai, W. Shen, X. Liu and Y. Fu, J. Colloid Interface Sci., 2019, 549, 105–113 CrossRef CAS PubMed.
- H. J. Kim, B. Naresh, I. H. Cho, J. S. Bak, S. A. Hira, P. S. Reddy, T. N. V. Krishna, K. D. Kumar, B. A. Mola and Y. A. Kumar, J. Energy Storage, 2021, 40, 102702 CrossRef.
- J. Sun, X. Tian, C. Xu and H. Chen, Journal of Materiomics, 2021, 7, 1358–1368 CrossRef.
- W. Zhang, Y. Wang, X. Guo, Y. Liu, Y. Zheng, M. Zhang, R. Li, Z. Peng, Z. Wang and T. Zhang, J. Alloys Compd., 2021, 855, 157394 CrossRef CAS.
- L. Jing, Z. Yongjin, L. Bin, X. Fen, C. Hailiang, Q. Shujun, Z. Jian, S. Lixian and X. Cuili, Ceram. Int., 2021, 47(12), 16562–16569 CrossRef.
- T. Xie, Y. Gai, Y. Shang, C. Ma, L. Su, J. Liu and L. Gong, Eur. J. Inorg. Chem., 2018, 4711–4719 CrossRef CAS.
- H. Li, Z. Li, Z. Wu, M. Sun, S. Han, C. Cai, W. Shen, X. Liu and Y. Fu, J. Colloid Interface Sci., 2019, 549, 105–113 CrossRef CAS PubMed.
- P. Naveenkumar and G. P. Kalaignan, Composites, Part B, 2019, 173, 106864 CrossRef CAS.
- X. Xu, Y. Liu, P. Dong, P. M. Ajayan, J. Shen and M. Ye, J. Power Sources, 2018, 400, 96–103 CrossRef CAS.
- L. Han, X. Liu, Z. Cui, Y. Hua, C. Wang, X. Zhao and X. Liu, Inorg. Chem. Front., 2021, 8, 3025–3036 RSC.
- T. Xie, J. Xu, J. Wang, C. Ma, L. Su, F. Dong and L. Gong, Front. Chem., 2020, 8, 62 CrossRef CAS PubMed.
- A. Mohammadi, S. E. Moosavifard, A. Goljanian Tabrizi, M. M. Abdi and G. Karimi, ACS Appl. Energy Mater., 2018, 2, 627–635 CrossRef.
- L. Q. Fan, F. Pan, Q. M. Tu, Y. Gu, J. L. Huang, Y. F. Huang and J. H. Wu, Int. J. Hydrogen Energy, 2018, 43(52), 23372–23381 CrossRef CAS.
- S. Jia, J. Wei, B. Gong and Z. Shao, J. Colloid Interface Sci., 2021, 601, 640–649 CrossRef CAS PubMed.
- S. Cheng, T. Shi, C. Chen, Y. Zhong, Y. Huang, X. Tao, J. Li, G. Liao and Z. Tang, Sci. Rep., 2017, 7, 1–11 CrossRef PubMed.
- N. I. Chandrasekaran, H. Muthukumar, A. D. Sekar, A. Pugazhendhi and M. Manickam, J. Mol. Liq., 2018, 266, 649–657 CrossRef CAS.
- Y. Wang, Y. Xie, T. Han, H. Zhang, K. Duan, J. Wen, X. Huang, J. Jiang and S. Han, Energy Fuels, 2021, 35, 5192–15204 Search PubMed.
- M. Li, J. Wang, F. Wang, Y. Zhai, X. Zhang, H. Lv, T. Yu and G. Lv, Appl. Surf. Sci., 2021, 568, 150900 CrossRef CAS.
- A. Bahaa, J. Balamurugan, N. H. Kim and J. H. Lee, J. Mater. Chem. A, 2019, 7, 8620–8632 RSC.
|
| This journal is © The Royal Society of Chemistry 2022 |
Click here to see how this site uses Cookies. View our privacy policy here. 
 Open Access Article
 This Open Access Article is licensed under a Creative Commons Attribution-Non Commercial 3.0 Unported Licence
 *a,
G.
Ravi
*ab and
Dhayalan
Velauthapillai
*c
*a,
G.
Ravi
*ab and
Dhayalan
Velauthapillai
*c