 Open Access Article
Synthesis of UV-curable polyurethane-acrylate hybrids with tuneable hardness and viscoelastic properties on-demand
Guillem
Romero-Sabat
 ,
Luis Angel
Granda
 and
Sandra
Medel
 *
*
Leitat Technological Center, Carrer de la Innovació, 2, Terrassa, Spain. E-mail: smedel@leitat.org
First published on 30th May 2022
Abstract
Currently, there is an unmet need for possessing a deeper understanding between the chemical structure and the exhibited properties of more polymers. Moreover, thanks to the development of technologies allowing an unprecedented level of personalization, researchers are aiming towards the generation of polymers tailored for specific applications. In the present work, a series of soft, transparent, and UV-photopolymerizable polyurethane-acrylate (PUA) hybrids were synthesized via a two-step polymerization route, followed by a UV-curing process and maintaining two constant ratios of a soft/hard segment in the polyurethane (PU) structure as well as using three different acrylate segment types at three concentrations in the overall polymeric structure (2.5, 5 and 7.5 wt%). The success of the synthesis procedure, the molecular weight, the transparency, the thermal behaviour, the viscoelastic response and the softness of the synthesized PUA were studied by analytical methods. Using these techniques, it was possible to quantify gradual values between the different generated materials showing up to a 50% difference in the molecular weight, variations reaching 15 °C in the thermal transition or modifications of a thermal stability of 50 °C, changes of even a 90% in the viscoelastic response and, additionally, a range of hardness going from extra-soft to medium-hard. Through this work, it is possible to predict how the different variables affect some of the most relevant properties of the synthesized materials and therefore select the most suitable variables for each specific application. These results are expected to guide further developments in materials in applications ranging from UV-curable coatings to in situ 3D-printing for biomedical applications.
Introduction
The transition from solvent-containing, toxic and slow reactive 2k formulations to 1k UV-curing systems made a significant impact in improving the fields of protective coatings,1 automotives, the dental industry,2 and photolithography among others.3 Moreover, the addition of polyurethanes (PUs) to the typically acrylic single-component formulations to synthesize polyurethane-acrylate (PUA) hybrids allowed a gain in mechanical properties, adhesion and weather resistance while keeping the good properties of these light-curable materials.4Most of the interesting properties of these PUA polymers come from PU's molecular backbone composed of different blocks of soft polyether or polyester bonded by polycondensation reactions to hard segments of diisocyanates. While soft segments account for the elastic behaviour, urethane groups are mainly responsible for increasing the rigidity due to their high hydrogen bond content.5 The almost endless possibilities of modifying the structure and final properties of polymers provide a unique level of versatility, thus being possible to adapt them into a wide range of applications.
Taking a close look at the general composition of the most UV-curable systems, the oligomer, which is a macromolecule or a prepolymer, is the provider of the major properties of the end-product.6,7 Concretely, for PUA hybrid polymers, the main oligomers are based on a PU structure but ended in both extremes of the chain by acrylic photo-responsive moieties. Then, a light sensitive molecule called the photoinitiator triggers polymerization when it is exposed to certain wavelengths of UV light, and finally, a reactive diluent is added, which lowers the system's viscosity. There are, however, concerns regarding this last component in the system.8 Even though the reactive diluent reduces the system's intrinsic viscosity and thus eases its use into certain applications, issues of volatility and toxicity during its manipulation as well as during transport and storage must be managed. For all these reasons, the use of reactive diluents must be carefully studied in further developments of photocurable polymer systems.
One of the fields of application with higher potential for photocurable resins lies within additive manufacturing (AM) technologies. AM, also known as 3D printing, has caused a revolution in designing and producing objects with complex geometries by building them layer by layer.9 Among the different AM techniques, photocuring 3D technologies, known as vat photopolymerization techniques (VAT), are still the most relevant in terms of speed, cost, and printing resolution.9 Within VAT AM, a photocurable direct-ink-writing (DIW) method, thanks to extruding the materials to the photocuring area, has been proposed to introduce novel materials that are unable to be achieved by conventional techniques (i.e. limited by high viscosities).10 Moreover, the current possibility of generating data from imaging technologies (i.e., from nuclear magnetic resonance (NMR) or tomography) allows the fabrication of complex personalized models of great value for a great range of medical applications.11,12 However, to achieve successful results working with these techniques, materials with specific characteristics and sensitive to light stimulus must be designed. To date, most uses of photocuring 3D printing techniques are focused on temporary replacement materials due to the limited performance and brittleness of the currently used UV-curing resins. Additionally, the current commercially available elastomeric resins, apart from being mostly opaque and therefore not applicable in fields where high transparency is required, do not provide the users the possibility of modifying the resin composition and thus its properties.13,14 A challenging but potentially high-rewarding area lies within the manufacture of customizable elastomeric materials capable of complementing the currently available ones for rapid prototyping AM, widening the material's portfolio and thus accelerating the inclusion of this technology into more fields.15 However, to achieve such a goal, it is imperative to obtain first a deep enough understanding of the structure–property relationship of the materials as a way of creating specifically and optimally synthesized polymers tailored for each desired application.6
Beyond the attempts to replicate some organ-like structures, to generate artificial replacements, there has been recently an interest in obtaining relevant models for testing and practicing medical procedures aiming to increase the ratio of success and decrease unexpected complications. Thanks to non-invasive techniques, doctors are already capable of looking through the human body to find alterations in the homeostasis and analysing the general tissue behaviour before an intervention. The potential generation of those images as 3D models would gear up the preoperational readiness and greatly diminish potential associated risks. Nonetheless, to truly generate a positive impact, these models should mimic as precisely as possible the behaviour of the targeted organs. As an outline, the generation of highly tuneable materials can become a huge step forward in the successful production of these truly realistic surgical models.
In the past years, there have been studies directed specifically towards enlightening the potential relationships between the molecular structures of the synthesized PUA systems and the properties of these materials being presented. Early studies aimed to understand, among others, the thermal,16,17 mechanical18 or viscoelastic19 behavioural changes generated in basic PU systems using different kinds of isocyanates,20,21 chain extenders22 or polyol types23 and the proportion between them.24 For PUA hybrids, similar but more recent studies regarding thermal stability,25 mechanical properties,25 microphase separation,26 transparency14 or biocompatibility27,28 have been performed. However, they are mostly focused on the effect of polyol and diisocyanate due to the relative broad spectrum of possibilities they provide. With all, there are very few literature reports on the influence of the acrylic component on the final polymer properties.29
In this work, we have been able to synthesize soft, photocurable, transparent, diluent and filler-free PUA hybrid polymers aiming to provide a thorough structure–property relationship study on the effect of different UV-reactive biocompatible acrylate moieties such as 2-hydroxyethyl methacrylate (HEMA), 2-hydroxypropyl methacrylate (HPMA) and poly(ethylene-glycol) methacrylate (PEGMA) as well as the different soft/hard microstructure ratios. Simultaneously, a methodology has been provided to finely tune the photocurable polymer's properties thus broadening the library of elastomeric materials potentially suitable for UV-curing technologies and potentially easing the adoption of soft polymers for tissue-replicating models. Additionally, the effectiveness of their sterilization was also studied to demonstrate their applicability for preoperative strategic planning as surgical model materials.
Experimental
Materials
Isophorone diisocyanate (IPDI), 1,4-butanediol (BDO), tetrahydrofuran (THF) (all materials were reagent grade with a purity of ≥99.0% and contained 250 ppm BHT as an inhibitor), dibutyltin dilaurate (DBTDL) and phenylbis(2,4,6-trimethylbenzoyl)phosphine oxide (PBO) were purchased from Sigma and used without further purification. Poly(propylenglycol) (PPG, Mn = 1000 g mol−1), 2-hydroxyethyl methacrylate (HEMA), 2-hydroxypropyl methacrylate (HPMA), poly(ethyleneglycol) methacrylate (PEGMA, Mn = 360 g mol−1, containing 500–800 ppm MEHQ as an inhibitor) were purchased from Sigma and placed under vacuum at 60 °C for 2 h prior to use to ensure the removal of unwanted moisture.Characterization methods
![[thin space (1/6-em)]](https://www.rsc.org/images/entities/char_2009.gif) 577
577![[thin space (1/6-em)]](https://www.rsc.org/images/entities/char_2009.gif) 000 Da.
000 Da.
![[thin space (1/6-em)]](https://www.rsc.org/images/entities/char_2009.gif) δ) as a function of temperature (from −90 °C to 50 °C in a 3 °C min−1 ramp) under oscillating stress at a defined frequency (1 Hz). While E′ is proportional to the material's stiffness and is related to the stored energy level, the tan
δ) as a function of temperature (from −90 °C to 50 °C in a 3 °C min−1 ramp) under oscillating stress at a defined frequency (1 Hz). While E′ is proportional to the material's stiffness and is related to the stored energy level, the tan![[thin space (1/6-em)]](https://www.rsc.org/images/entities/char_2009.gif) δ value is indicative of the material's capacity for energy dissipation when changes in the physical properties are applied and plainly translates into quantifying how good the material will be at absorbing energy.
δ value is indicative of the material's capacity for energy dissipation when changes in the physical properties are applied and plainly translates into quantifying how good the material will be at absorbing energy.
Synthesis of PUA hybrids
Polymerization reactions were conducted in a five-neck, 250 mL, round-bottom glass reactor equipped with an overhead anchor-type mechanical stirrer, a water-cooled condenser, a temperature probe and an Argon inlet. All the PUA hybrids were synthesized through an adapted two step polymerization procedure as follows: first, PU prepolymers were prepared by adding together 50 mL of THF with the calculated molar amount of PPG and heating them at 60 °C while stirring at 260 rpm for 1 h under an argon atmosphere. Once the temperature was reached, the required quantity of IPDI and three drops of the catalyst (DBTDL) were introduced and the mix was left to react for 2 h at 60 °C. Secondly, half of the stoichiometric quantity of the chain extender (BDO) was added slowly and allowed to react for 1 h. In parallel, 1 wt% of photoinitiator (PBO) was dissolved by magnetic stirring in the specified methacrylate (MA) monomer content in the dark. The acrylic mixture was then incorporated into the reactor while stirring at 200 rpm and kept at 60 °C until no further decrease in the NCO peak at 2272 cm−1 was observed by FTIR-ATR spectroscopy. Finally, the remaining half of the stoichiometric molar quantity of BDO was added until the complete disappearance of the NCO peak. A final drying process is carried out to remove the solvent from the synthesised product prior to storing it. As an example for the “H_HEMA5” sample (Table 1), 82 mmol PPG1000 was heated and stirred with 50 mL of THF before adding 180 mmol IPDI for the reaction, thus producing the prepolymer. After the completion of the prepolymer, 40 mmol BDO was added to the prepolymer mixture and allowed to react. Then, 50 mmol HEMA (or 50 mmol HPMA or 30 mmol PEGMA) was added. Finally, another 40 mmol BDO was used to complete the polymerization. The crude product was collected and the solvent was removed at 30 °C under high vacuum for 12 h to obtain the corresponding PUA hybrid as a transparent fluid.| Sample | Soft/hard ratio | Acrylate type | Acrylate wt% | Average molecular weight (Mw), (g mol−1) | Polydispersity index (PDI) |
|---|---|---|---|---|---|
| a Not determined due to the gelation of the polymerization mixtures. | |||||
| H_HEMA2.5 | 65![[thin space (1/6-em)]](https://www.rsc.org/images/entities/char_2009.gif) : :![[thin space (1/6-em)]](https://www.rsc.org/images/entities/char_2009.gif) 35 35 |
HEMA | 2.5 | 26![[thin space (1/6-em)]](https://www.rsc.org/images/entities/char_2009.gif) 190 190 |
2.03 |
| H_HEMA5 | 5 | 15![[thin space (1/6-em)]](https://www.rsc.org/images/entities/char_2009.gif) 600 600 |
1.92 | ||
| H_HEMA7.5 | 7.5 | 8972 | 2.44 | ||
| H_HPMA2.5 | HPMA | 2.5 | 24![[thin space (1/6-em)]](https://www.rsc.org/images/entities/char_2009.gif) 667 667 |
2.04 | |
| H_HPMA5 | 5 | 17![[thin space (1/6-em)]](https://www.rsc.org/images/entities/char_2009.gif) 192 192 |
2.02 | ||
| H_HPMA7.5 | 7.5 | 13![[thin space (1/6-em)]](https://www.rsc.org/images/entities/char_2009.gif) 552 552 |
1.89 | ||
| H_PEGMA2.5 | PEGMA 360 | 2.5 | 28![[thin space (1/6-em)]](https://www.rsc.org/images/entities/char_2009.gif) 400 400 |
2.25 | |
| H_PEGMA5 | 5 | 16![[thin space (1/6-em)]](https://www.rsc.org/images/entities/char_2009.gif) 545 545 |
2.11 | ||
| H_PEGMA7.5 | 7.5 | 10![[thin space (1/6-em)]](https://www.rsc.org/images/entities/char_2009.gif) 964 964 |
1.77 | ||
| S_HEMA2.5 | 80![[thin space (1/6-em)]](https://www.rsc.org/images/entities/char_2009.gif) : :![[thin space (1/6-em)]](https://www.rsc.org/images/entities/char_2009.gif) 20 20 |
HEMA | 2.5 | 20![[thin space (1/6-em)]](https://www.rsc.org/images/entities/char_2009.gif) 761 761 |
2.38 |
| S_HEMA5 | 5 | 17![[thin space (1/6-em)]](https://www.rsc.org/images/entities/char_2009.gif) 488 488 |
2.01 | ||
| S_HEMA7.5 | 7.5 | 10![[thin space (1/6-em)]](https://www.rsc.org/images/entities/char_2009.gif) 225 225 |
1.81 | ||
| S_HPMA2.5 | HPMA | 2.5 | 33![[thin space (1/6-em)]](https://www.rsc.org/images/entities/char_2009.gif) 260 260 |
2.01 | |
| S_HPMA5 | 5 | ||||
| S_HPMA7.5 | 7.5 | 22![[thin space (1/6-em)]](https://www.rsc.org/images/entities/char_2009.gif) 432 432 |
1.95 | ||
| S_PEGMA2.5 | PEGMA 360 | 2.5 | 41![[thin space (1/6-em)]](https://www.rsc.org/images/entities/char_2009.gif) 125 125 |
2.04 | |
| S_PEGMA5 | 5 | 38![[thin space (1/6-em)]](https://www.rsc.org/images/entities/char_2009.gif) 210 210 |
2.04 | ||
| S_PEGMA7.5 | 7.5 | ||||
1H NMR (400 MHz, CDCl3) δ ppm: 6.10 (s, 1H, H2C![[double bond, length as m-dash]](https://www.rsc.org/images/entities/char_e001.gif) C–), 5.57 (s, 1H, H2C
C–), 5.57 (s, 1H, H2C![[double bond, length as m-dash]](https://www.rsc.org/images/entities/char_e001.gif) C–), 4.88 (br s, 2HHPMA, –O–
C–), 4.88 (br s, 2HHPMA, –O–![[C with combining low line]](https://www.rsc.org/images/entities/char_0043_0332.gif)
![[H with combining low line]](https://www.rsc.org/images/entities/char_0048_0332.gif) 2–CH–), 4.80 (br s, 1HHPMA, –O–CH2–
2–CH–), 4.80 (br s, 1HHPMA, –O–CH2–![[C with combining low line]](https://www.rsc.org/images/entities/char_0043_0332.gif)
![[H with combining low line]](https://www.rsc.org/images/entities/char_0048_0332.gif) –), 4.07 (br s, 2HHPMA, –O–
–), 4.07 (br s, 2HHPMA, –O–![[C with combining low line]](https://www.rsc.org/images/entities/char_0043_0332.gif)
![[H with combining low line]](https://www.rsc.org/images/entities/char_0048_0332.gif) 2–CH–), 3.85–3.25 (m, 2HPPG, –CH2–, 1HPPG, –CH–, 4HBDO, –CH2–
2–CH–), 3.85–3.25 (m, 2HPPG, –CH2–, 1HPPG, –CH–, 4HBDO, –CH2–![[C with combining low line]](https://www.rsc.org/images/entities/char_0043_0332.gif)
![[H with combining low line]](https://www.rsc.org/images/entities/char_0048_0332.gif) 2–O), 2.90 (br s, 2HIPDI, -
2–O), 2.90 (br s, 2HIPDI, -![[C with combining low line]](https://www.rsc.org/images/entities/char_0043_0332.gif)
![[H with combining low line]](https://www.rsc.org/images/entities/char_0048_0332.gif) 2-NH), 1.94 (s, 3HHPMA, –CH3), 1.80–1.60 (m, 4HBDO, -
2-NH), 1.94 (s, 3HHPMA, –CH3), 1.80–1.60 (m, 4HBDO, -![[C with combining low line]](https://www.rsc.org/images/entities/char_0043_0332.gif)
![[H with combining low line]](https://www.rsc.org/images/entities/char_0048_0332.gif) 2-CH2–O, 4HIPDI, –CH2–), 1.45–0.75 (m, 2HIPDI, –CH2–, 3HPPG, –CH3, 3HHPMA, –CH3, 6HIPDI, –CH3).
2-CH2–O, 4HIPDI, –CH2–), 1.45–0.75 (m, 2HIPDI, –CH2–, 3HPPG, –CH3, 3HHPMA, –CH3, 6HIPDI, –CH3).
13C NMR (100 MHz, CDCl3) δ ppm: 167.3 (O![[C with combining low line]](https://www.rsc.org/images/entities/char_0043_0332.gif) OHPMA), 156.7 (N
OHPMA), 156.7 (N![[C with combining low line]](https://www.rsc.org/images/entities/char_0043_0332.gif) OIPDI), 155.5 (N
OIPDI), 155.5 (N![[C with combining low line]](https://www.rsc.org/images/entities/char_0043_0332.gif) OIPDI), 136.1 (H2C
OIPDI), 136.1 (H2C![[double bond, length as m-dash]](https://www.rsc.org/images/entities/char_e001.gif) C–HPMA), 126.1 (H2
C–HPMA), 126.1 (H2![[C with combining low line]](https://www.rsc.org/images/entities/char_0043_0332.gif)
![[double bond, length as m-dash]](https://www.rsc.org/images/entities/char_e001.gif) C–HPMA), 76.0–71.5 (–
C–HPMA), 76.0–71.5 (–![[C with combining low line]](https://www.rsc.org/images/entities/char_0043_0332.gif) H–CH2–PPG, –CH–
H–CH2–PPG, –CH–![[C with combining low line]](https://www.rsc.org/images/entities/char_0043_0332.gif) H2–PPG, CH2–
H2–PPG, CH2–![[C with combining low line]](https://www.rsc.org/images/entities/char_0043_0332.gif) H2–O–BDO), 70.0–62.0 (–
H2–O–BDO), 70.0–62.0 (–![[C with combining low line]](https://www.rsc.org/images/entities/char_0043_0332.gif) H2–HPMA, –
H2–HPMA, –![[C with combining low line]](https://www.rsc.org/images/entities/char_0043_0332.gif) H–HPMA), 55.0 (–
H–HPMA), 55.0 (–![[C with combining low line]](https://www.rsc.org/images/entities/char_0043_0332.gif) H2–NH–IPDI), 47.2–23.3 (–
H2–NH–IPDI), 47.2–23.3 (–![[C with combining low line]](https://www.rsc.org/images/entities/char_0043_0332.gif) H2–IPDI, (–
H2–IPDI, (–![[C with combining low line]](https://www.rsc.org/images/entities/char_0043_0332.gif) –IPDI,
–IPDI, ![[C with combining low line]](https://www.rsc.org/images/entities/char_0043_0332.gif) H2–CH2–O–BDO), 18.4 (–
H2–CH2–O–BDO), 18.4 (–![[C with combining low line]](https://www.rsc.org/images/entities/char_0043_0332.gif) H3
H3![[thin space (1/6-em)]](https://www.rsc.org/images/entities/char_2009.gif) HPMA), 17.6–17.0 (–
HPMA), 17.6–17.0 (–![[C with combining low line]](https://www.rsc.org/images/entities/char_0043_0332.gif) H3
H3![[thin space (1/6-em)]](https://www.rsc.org/images/entities/char_2009.gif) PPG, –
PPG, –![[C with combining low line]](https://www.rsc.org/images/entities/char_0043_0332.gif) H3
H3![[thin space (1/6-em)]](https://www.rsc.org/images/entities/char_2009.gif) IPDI).
IPDI).
Signal assignments were done with the aid of the HSQC experiment.
Specimen preparation
Polymer specimens of 10 × 80 × 2 mm3 were prepared by filling a Teflon mould with the uncured PUA hybrid to remove the residual THF, in a vacuum oven at 30 °C, with a tinted screen until no bubbles appeared. Then, the mold was covered with a glass slide to avoid the presence of oxygen during the photopolymerization process, and the sample was placed in a UV Form Cure (Formlabs) and irradiated for 5 min at 405 nm at room temperature while rotating at 1 rpm to ensure a fully cured sample.Results and discussion
Synthesis of PUA hybrids
Within the synthesis process, IPDI was selected as the diisocyanate monomer due to its reported lower toxicity and higher biosafety than its aromatic counterparts.31 Moreover, due to its asymmetric structure, each isocyanate group follows a different reaction kinetics, and thus it is possible to generate a more accurate synthesis process. From the wide range of potential polyol molecules, PPG was selected due to its asymmetric methylene group that prevents potential crystallization processes, thus enhancing the transparency and also providing an overall improved material softness.32 THF was selected as the synthesis solvent due to having a minor hazardous impact than other potential options (i.e., DMF or DMSO) while offering a good temperature reaction and having the capability of maintaining the polyurethane pre-polymer in solution with higher molecular weights than other solvents.33Finally, the 3 different acrylic monomers were selected due to presenting differences only in the chain length of the main structure between the acrylate and hydroxyl moieties, thus providing the single key variable of the chain length to the overall process.
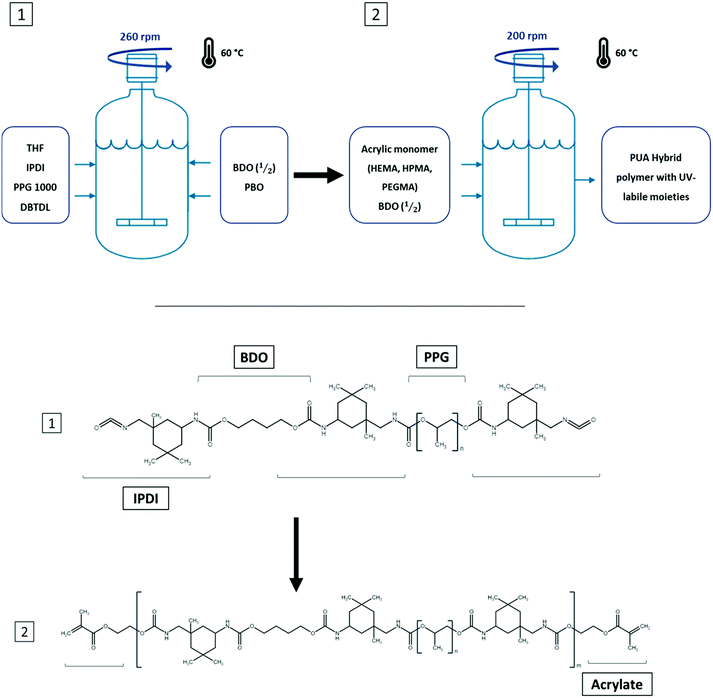
In this methodology, the polyurethane prepolymer was first synthesized with an excess of isocyanate end-groups to provide potential anchoring points for the successful incorporation of the following acrylic monomers (Fig. 1). The main adaptation produced to this well-known method4 was the addition of the chain extender monomer (BDO) that was incorporated in two different feedings. The first feeding was introduced before the acrylate monomer while the second one was the final step of the synthesis.
The changes in the feeding procedure aimed to lower the pre-polymer's intrinsic viscosity, thus allowing a homogeneous distribution of the acrylic monomer in the overall polymer attempting to improve thepolymer's fluidity prior to being UV-cured and generate a narrower molecular weight distribution. The molecule responsible for activating the UV-curing process (PBO) was dispersed in the last BDO feeding prior to completing the synthesis to obtain a homogeneous solution without compromising its stability and avoiding any unintentional photopolymerization.
Thanks to the acrylic groups at the end of each PU oligomer and the photoinitiator, it was possible to generate a soft thermoset elastomer when placed under UV-light for a few seconds by crosslinking the different PUA oligomers through radical polymerization. The overall process of PUA syntheses can be observed in Fig. 1.
Even though the acrylate composition–property relationship is pivotal in this study, the selection of two different base PU pre-polymers with varying softness (65![[thin space (1/6-em)]](https://www.rsc.org/images/entities/char_2009.gif) :
:![[thin space (1/6-em)]](https://www.rsc.org/images/entities/char_2009.gif) 35; 80
35; 80![[thin space (1/6-em)]](https://www.rsc.org/images/entities/char_2009.gif) :
:![[thin space (1/6-em)]](https://www.rsc.org/images/entities/char_2009.gif) 20) was introduced aiming to investigate the potential changes in the polymer's characteristics with the same crosslinking densities from the acrylate moieties, thus researching about which variable holds a higher impact in the properties within the polymer.
20) was introduced aiming to investigate the potential changes in the polymer's characteristics with the same crosslinking densities from the acrylate moieties, thus researching about which variable holds a higher impact in the properties within the polymer.
Progress of reactions was monitored by FTIR-ATR spectroscopy to observe the changes in the molecular structure of the PUA hybrids during their polymerization and to confirm the successful synthesis of the prepared hybrids. The decrease of the characteristic NCO stretching peak at 2272 cm−1 could be clearly seen as more components with hydroxyl moieties were added to the growing polymer. The complete absence of isocyanate groups was assured by the disappearance of this peak, which indicates the reaction completion. The representative FTIR-ATR spectra are shown in Fig. 2 for the sample S_HPMA5 (before and after UV-curing).
The appearance of the characteristic PU peaks, such as the stretching vibrations of NH at 3380 cm−1, the stretching vibrations of C![[double bond, length as m-dash]](https://www.rsc.org/images/entities/char_e001.gif) O of carbonyl groups at 1734 cm−1, the bending vibrations of N–H at 1644 cm−1, the peaks at 1350 and 1250 cm−1 associated with the stretching of the C–N bond and the C–O–C vibrations, respectively, indicates the presence of the ester linkage thus confirming the polyurethane formation.34,35
O of carbonyl groups at 1734 cm−1, the bending vibrations of N–H at 1644 cm−1, the peaks at 1350 and 1250 cm−1 associated with the stretching of the C–N bond and the C–O–C vibrations, respectively, indicates the presence of the ester linkage thus confirming the polyurethane formation.34,35
Moreover, the appearance of a peak at around 1644 cm−1 in the spectra before UV-curing, which corresponds to the stretching of the C![[double bond, length as m-dash]](https://www.rsc.org/images/entities/char_e001.gif) C bonds, indicates that methacrylate groups have been successfully incorporated into the polyurethane chains. The further disappearance of this peak in the spectra after UV-curing and the appearance of a peak at 815 cm−1 related to the methylene group in the methacrylate molecule confirms the UV-crosslinking procedure.
C bonds, indicates that methacrylate groups have been successfully incorporated into the polyurethane chains. The further disappearance of this peak in the spectra after UV-curing and the appearance of a peak at 815 cm−1 related to the methylene group in the methacrylate molecule confirms the UV-crosslinking procedure.
After irradiation by UV, it can be observed that the peak frequency bands assigned to disordered hydrogen-bonded carbonyl groups are narrower and weaker than before irradiation, while the frequency bands assigned to ordered hydrogen-bonded carbonyl groups are broadened thus indicating a higher degree of hydrogen bonding.36
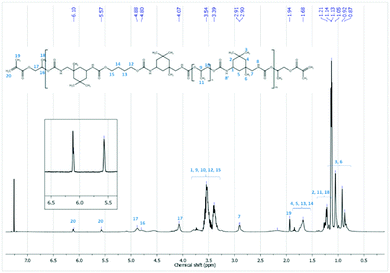
The chemical structure of the synthesized PUA hybrids was also analyzed by 1H NMR and 13C NMR spectroscopy in CDCl3. As an example, Fig. 3 shows the 1H NMR spectrum corresponding to the sample H_HPMA5. The assignation of peaks is also remarked and fully confirms the chemical structure of the PUA hybrid. The peaks in the range of 4.88–4.07 ppm are –CH2–CH– protons of HPMA and appear at a lower chemical shift than the free monomer. These peaks shifting to a lower field confirms that the acrylic monomer is attached to the OCO group of the urethane nitrogen atom of IPDI. Moreover, the existence of acrylic groups (–H2C![[double bond, length as m-dash]](https://www.rsc.org/images/entities/char_e001.gif) C–) is clearly observed by the characteristic peaks at 6.10 and 5.57 ppm, which are crucial to carry out the subsequent UV-curing of the polymer.
C–) is clearly observed by the characteristic peaks at 6.10 and 5.57 ppm, which are crucial to carry out the subsequent UV-curing of the polymer.
The GPC analysis of the synthesized polymers showed a single peak with a Gaussian symmetry around the highest point and a medium width distribution. Table 1 summarizes the GPC results of the PUA hybrids with varying contents of methacrylate monomers.
All the obtained values were found between 10![[thin space (1/6-em)]](https://www.rsc.org/images/entities/char_2009.gif) 000 and 40
000 and 40![[thin space (1/6-em)]](https://www.rsc.org/images/entities/char_2009.gif) 000 g mol−1. It can be observed in Table 1, that for any of the three methacrylate monomers under study, Mw decreases with the concentration of the methacrylate monomer.
000 g mol−1. It can be observed in Table 1, that for any of the three methacrylate monomers under study, Mw decreases with the concentration of the methacrylate monomer.
This effect can be attributed to the monofunctional methacrylate monomer acting as a chain stopper of the linear PU. As expected, by increasing the content of the methacrylate monomer, the PU yields chain ends lacking functional groups and therefore the polycondensation process terminates earlier, leading thus to lower Mw polymers.37
The increased content of the PPG monomer in the initial steps of the synthesis for softer PUA samples led to a higher prepolymer molecular weight and therefore an increment in the finalpolymer's molecular weight.
Comparing harder polymers with equal acrylic wt%, those containing HEMA exhibited a lower Mw than those with HPMA or PEGMA. Additionally, focusing on the differences between the softer and harder synthesized polymers, HPMA and PEGMA soft samples exhibit an overall higher average Mw over their harder counterparts. These results can be translated into HPMA and PEGMA monomers having a lower reactivity compared with HEMA, thus allowing the step-growth polymerization process for longer times.
The authors hypothesize that the decreased reactivity of PEGMA and HPMA monomers and the overall higher Mw of the synthesized polymers are related to steric hindrances generated by the increased volume of the monomer particles compared to HEMA. The increase for the HEMA to successfully find the free isocyanate group could produce a general decrease in the molecular weight of the prepolymer, thus explaining the obtained results.
Transparency
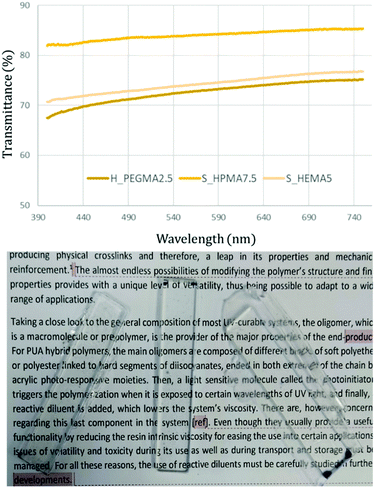
The optical transparency is a desirable property for most materials and utmost necessary in some applications.14,38 The transparency degree was measured by determining the light transmittance in 4 mm thick samples obtained by photocuring the UV-susceptible methacrylic end-groups from the synthesized flowable polymer. This procedure was performed for all the synthesized specimens. Fig. 4 (top) depicts three representative transmittance results in samples exhibiting the higher and lower limits obtained after irradiation from 400 to 750 nm. As observed, the measured samples exhibit good transparency levels and can be easily used as see-through materials (Fig. 4, bottom). Among the different PUA, HPMA-based formulations appear to exhibit higher transparency levels than their counterparts achieving transmittance values up to 85% throughout the overall wavelength range.Thermal properties
Aiming to assess the differences in the thermal behaviour, all the photocured samples were subjected to a cycle of heating to erase the material's thermal history, followed by cooling and reheating ramps. The glass transition temperature (Tg) and the width of the transition (ΔT) are shown in Table 2. The single Tg observed in all samples indicates a lack of separation between the soft and hard domains within the PU structure.| Sample | T g (°C) | T i (°C) | T f (°C) | ΔT (°C) | T 5% | T max |
|---|---|---|---|---|---|---|
| H_HEMA2.5 | −38.44 | −42.33 | −34.05 | 8.28 | 236.04 | 328 |
| H_HEMA5 | −27.29 | −35.42 | −13.53 | 21.89 | 263.75 | 336 |
| H_HEMA7.5 | −27.40 | −36.57 | −12.26 | 24.31 | 271.71 | 335 |
| H_HPMA2.5 | −28.33 | −37.06 | −13.73 | 23.33 | 256.57 | 338 |
| H_HPMA5 | −25.07 | −33.82 | −11.37 | 22.45 | 268.52 | 337 |
| H_HPMA7.5 | −25.49 | −38.08 | −26.93 | 11.15 | 282.40 | 343 |
| H_PEGMA2.5 | −30.81 | −38.58 | −17.24 | 21.34 | 264.90 | 321 |
| H_PEGMA5 | −29.73 | −37.61 | −13.68 | 23.93 | 258.09 | 349 |
| H_PEGMA7.5 | −27.71 | −38.32 | −12.35 | 25.97 | 269.12 | 342 |
| S_HEMA2.5 | −37.32 | −42.57 | −33.84 | 8.73 | 272.32 | 328 |
| S_HEMA5 | −35.94 | −39.74 | −29.57 | 10.17 | 276.38 | 336 |
| S_HEMA7.5 | −27.19 | −41.12 | −29.66 | 11.46 | 275.32 | 338 |
| S_HPMA2.5 | −36.21 | −41.56 | −33.52 | 8.04 | 258.29 | 339 |
| S_HPMA5 | −34.82 | −43.10 | −25.04 | 18.47 | 277.03 | 335 |
| S_HPMA7.5 | −27.49 | −36.26 | −10.73 | 25.53 | 273.75 | 349 |
| S_PEGMA2.5 | −38.42 | −42.30 | −34.76 | 7.54 | 257.43 | 352 |
| S_PEGMA5 | −37.26 | −43.61 | −34.64 | 8.97 | 259.35 | 358 |
| S_PEGMA7.5 | −35.89 | −42.63 | −32.25 | 10.35 | 261.76 | 349 |
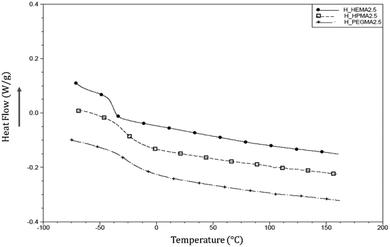
Moreover, the absence of any crystallization indicates that the synthesised polymers are completely amorphous. Fig. 5 shows the absence of melting peaks for hard segments, as demonstrated by previous studies when the hard segment content is lower than 23–35%.39
Accounting only for the acrylate wt% change, it is possible to observe that there is a trend pointing towards the increment of the Tg when there is a higher presence of acrylic moieties in the polymer structure, increasing up to 10 °C between the less and more cross-linked specimens (2.5 to 7.5 wt%) (Fig. 6).
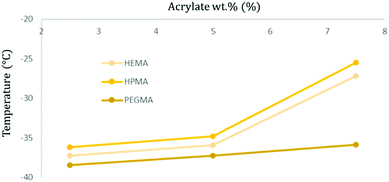 | ||
| Fig. 6 Graphical representation of the obtained Tg temperature values for soft samples with different acrylate types and concentrations. | ||
Additionally, the transition temperature width (Table 2) appears to broaden when the acrylic wt% is increased. The observed direct relationship between the simultaneous increase of cross-linking points and the Tg value due to mobility restrictions is already well known and has been described extensively.17
Comparing samples with the same acrylate wt% but varying its type, HPMA-based samples appear to have a higher Tg, followed by those containing HEMA and, finally, PEGMA polymers exhibit generally the transition at the lowest temperature (Fig. 6).
It can also be extracted from the results that the soft/hard ratio shows a lower Tg when containing higher softer components (80![[thin space (1/6-em)]](https://www.rsc.org/images/entities/char_2009.gif) :
:![[thin space (1/6-em)]](https://www.rsc.org/images/entities/char_2009.gif) 20) compared to its harder counterparts (65
20) compared to its harder counterparts (65![[thin space (1/6-em)]](https://www.rsc.org/images/entities/char_2009.gif) :
:![[thin space (1/6-em)]](https://www.rsc.org/images/entities/char_2009.gif) 35). This phenomenon is due to limitations in the freedom degree promoted by the harder segments.
35). This phenomenon is due to limitations in the freedom degree promoted by the harder segments.
The TGA thermograms of all the samples presented a very similar degradation profile where only a single weight decrease was measured when the temperature was increased. Table 2 also presents the onset degradation temperature determined at 5% weight loss (T5%) and the maximum degradation rate temperature (Tmax) determined from the first derivative's peak maximum were obtained for each polymer specimen by TGA. In all samples, the maximum weight loss rate was produced in the temperature range between 328 and 360 °C. This decomposition was attributed to the cleavage of both urethane and ether bonds.40
The degradation process takes place around the same temperature values independently from the acrylate concentration and type, as well as its soft/hard ratio. However, when comparing T5%, a higher thermal stability can be stated in the formulated specimens with a higher acrylate wt%. Additionally, when comparing samples with an equal acrylate wt% but different types, HPMA-based samples appear to have a slightly higher thermal stability than HEMA or PEGMA samples.
The lack of relevant differences in the main degradation temperature is derived from the presence of the identical type of chemical bonds through the polymer. Nonetheless, the findings regarding the polymer's thermal stability are in agreement with previous research already exhibiting a small better thermal stability of poly(HPMA) over poly(HEMA).41
The thermal stability of the synthesized materials, in the same range of typical TPU elastomers and coatings,42,43 points towards a good thermal compatibility with current conventional sterilization processes (reaching up to 140 °C) and therefore a potential use in biologically sensitive applications.
Dynamic mechanical assay
After the samples were photocured, the effects of the different methacrylate cross-linkers and their concentrations on the viscoelastic properties of the PUA hybrid were assessed by dynamic mechanical analysis (DMA).The obtained results were grouped and compared depending on the type of the acrylic monomer (HEMA, HPMA and PEGMA) and its weight percentages (2.5, 5, and 7.5 wt%) in the final polymer formulation and the soft/hard ratio.
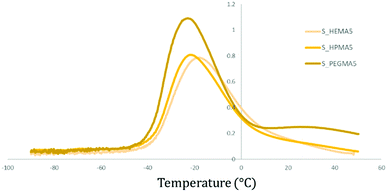
In Fig. 7, it can be seen that PEGMA samples present two thermal transitions (Tα and Tβ at around 20–30 °C and −20 °C, respectively), while in HEMA and HPMA only Tβ, related to the glass transition, can be identified.
The influence of the acrylate content while maintaining the same acrylate type (HPMA) and the soft/hard ratio (80![[thin space (1/6-em)]](https://www.rsc.org/images/entities/char_2009.gif) :
:![[thin space (1/6-em)]](https://www.rsc.org/images/entities/char_2009.gif) 20) is illustrated in Fig. 8. Samples exhibit peak broadening and an intensity diminution as the acrylate wt% is increased. Simultaneously, the tan
20) is illustrated in Fig. 8. Samples exhibit peak broadening and an intensity diminution as the acrylate wt% is increased. Simultaneously, the tan![[thin space (1/6-em)]](https://www.rsc.org/images/entities/char_2009.gif) δ peak (or Tβ) is shifted to higher temperatures.
δ peak (or Tβ) is shifted to higher temperatures.
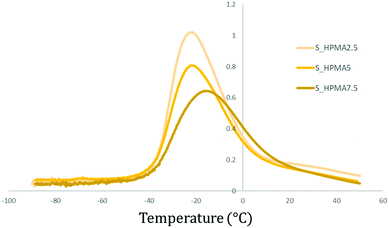 | ||
Fig. 8 Comparative tan![[thin space (1/6-em)]](https://www.rsc.org/images/entities/char_2009.gif) δ (DMA) graph between polymers with the same acrylate type (HPMA) and soft/hard ratio (80 δ (DMA) graph between polymers with the same acrylate type (HPMA) and soft/hard ratio (80![[thin space (1/6-em)]](https://www.rsc.org/images/entities/char_2009.gif) : :![[thin space (1/6-em)]](https://www.rsc.org/images/entities/char_2009.gif) 20) but different wt%. 20) but different wt%. | ||
This behaviour is more intense in HEMA and HPMA-based polymers than that in PEGMA samples and it is observed in both hard and soft samples (Table 3). Using the peak intensity and full width at half maximum (FWHM) values of samples containing 2.5 wt% of the acrylic monomer as the reference and comparing it to the obtained values for the 5 and 7.5 wt%, it is possible to observe the previously mentioned tendencies. In detail, peak intensity reductions of 28 and 41% and broadening of 22 and 59% are determined for the hard HEMA samples. In HPMA, the intensities also decrease to 28 and 39% while the peak widths are increased to 14 and 57%. For PUA samples with an 80![[thin space (1/6-em)]](https://www.rsc.org/images/entities/char_2009.gif) :
:![[thin space (1/6-em)]](https://www.rsc.org/images/entities/char_2009.gif) 20 soft/hard ratio, the peak reductions are about 19 and 43% for HEMA while 21 and 37% when increasing the HPMA wt% content.
20 soft/hard ratio, the peak reductions are about 19 and 43% for HEMA while 21 and 37% when increasing the HPMA wt% content.
![[thin space (1/6-em)]](https://www.rsc.org/images/entities/char_2009.gif) δ temperature (Tβ), its intensity and the full width at half maximum (FWHM). For reference, samples containing 2.5% of each acrylate type were determined to be 100% for the FWHM values
δ temperature (Tβ), its intensity and the full width at half maximum (FWHM). For reference, samples containing 2.5% of each acrylate type were determined to be 100% for the FWHM values
| Sample | T β (°C) | Peak intensity | Peak intensitya (%) | Peak intensityb (%) | Full width at half maximum (°C) | Full width at half maximuma (%) | Full width at half maximumb (%) |
|---|---|---|---|---|---|---|---|
| a In columns, samples with 2.5 wt% of the acrylate content are used as the reference. b HEMA-based polymers are the reference for comparing different acrylate types. | |||||||
| H_HEMA2.5 | −3.6 | 0.839 | 100 | 100 | 35 | 100 | 100 |
| H_HEMA5 | 3.6 | 0.601 | 71.6 | 100 | 42.6 | 121.8 | 100 |
| H_HEMA7.5 | 6.1 | 0.498 | 59.4 | 100 | 55.5 | 158.7 | 100 |
| H_HPMA2.5 | −4.0 | 0.868 | 100 | 103.4 | 33.3 | 100 | 95.1 |
| H_HPMA5 | 5.1 | 0.621 | 71.5 | 103.3 | 38.1 | 114.3 | 89.2 |
| H_HPMA7.5 | 3.7 | 0.533 | 61.4 | 107.0 | 52.3 | 157.1 | 94.2 |
| H_PEGMA2.5 | −6.1 | 1.036 | 100 | 123.5 | 35.1 | 100 | 100.4 |
| H_PEGMA5 | −2.1 | 0.945 | 91.2 | 157.2 | 29.7 | 84.5 | 69.7 |
| H_PEGMA7.5 | −0.6 | 0.951 | 91.8 | 190.9 | 30.5 | 110.4 | 54.9 |
| S_HEMA2.5 | −25.1 | 0.975 | 100 | 100 | 27.7 | 100 | 100 |
| S_HEMA5 | −18.0 | 0.786 | 80.6 | 100 | 31.2 | 112.5 | 100 |
| S_HEMA7.5 | −13.6 | 0.558 | 57.2 | 100 | 41.7 | 150.3 | 100 |
| S_HPMA2.5 | −22.3 | 1.021 | 100 | 104.7 | 26.4 | 100 | 95.2 |
| S_HPMA5 | −21.8 | 0.808 | 79.1 | 102.8 | 28.7 | 108.7 | 92.1 |
| S_HPMA7.5 | −15.4 | 0.644 | 63.1 | 115.4 | 38.8 | 115.4 | 93.1 |
| S_PEGMA2.5 | −25.4 | 1.346 | 100 | 138.1 | 24.4 | 100 | 88.0 |
| S_PEGMA5 | −22.7 | 1.090 | 81.0 | 138.7 | 26.8 | 109.9 | 86.0 |
| S_PEGMA7.5 | −22.3 | 1.046 | 77.7 | 187.4 | 28.6 | 117.0 | 68.5 |
The same analysis was performed for PEGMA-based samples, and the peak intensity comparison from 2.5 to 5 and 7.5 wt% of the acrylic monomer shows reductions of only 9 and 8%, respectively, in hard samples. With softer samples, the decrease follows up to 19 and 22%. In general, the peak widening effect in these PEGMA samples is minor, being 17% the maximum obtained for all of them. The temperature increase in Tβ can be explained by the reduction in the polymer's chain mobility due to an increase of crosslinking points as the acrylate wt% is increased. These samples with lower acrylate wt% inherently possess a higher number of freely moving polymer chains that cause more internal frictions or entanglement constrains among chains44 and subsequently, these polymers have a higher energy dissipation capability (higher tan![[thin space (1/6-em)]](https://www.rsc.org/images/entities/char_2009.gif) δ peak).45
δ peak).45
In parallel, the increase in the crosslinking density associated with the higher acrylate wt% produces a widening of the tan![[thin space (1/6-em)]](https://www.rsc.org/images/entities/char_2009.gif) δ peak due to a greater heterogeneity in the average length between crosslinking points.40,46,47
δ peak due to a greater heterogeneity in the average length between crosslinking points.40,46,47
Comparing HPMA or PEGMA samples with HEMA with the same acrylate wt%, an increase in the peak intensity is noticeable (Fig. 7). While only 3 to 15% differences in the peak intensity are seen between HEMA and HPMA, the peak intensity of PEGMA can be up to 90% higher (Table 3). Studying the FWHM, an inversely proportional relationship between the peak intensity and width can be detected again. HEMA-based samples appeared to exhibit the widest graphs when compared with the other acrylic moieties at the same wt%. This effect is most notorious for hard PEGMA samples with 7.5 wt%, where a maximum of a 45% decrease can be seen. Internal frictions caused by the long polyethylene chain from PEGMA are hypothesized to be mainly responsible for the increase in the peak intensity and thus, its higher capability to dissipate energy viscously. The differences between acrylate types are more significant in 7.5 wt% samples. This effect is related to the greater freedom of movement that chains with higher Mw have inherently and, therefore, a higher number of interactions. In other words, HEMA is the shortest chain; thus, the internal molecular packaging of highly crosslinked HEMA-based PUA is more restricted (and elastic) than PEGMA-based PUA. While having a similar cross-linking density with the same acrylate wt%, in PEGMA PUA, the longer polymer chains allow for more freedom of movements and an increased length for entanglement interactions.44 This increased interaction among the molecules is translated directly into an increased viscous behaviour.
Similarly, the widening effect of the tan![[thin space (1/6-em)]](https://www.rsc.org/images/entities/char_2009.gif) δ peak is hypothesized to be related to the non-homogeneous dispersion of the chain length between crosslinking points. Observing the width tendencies, it can be stated that, at low concentration values, the random bonding of the acrylic groups during photopolymerization is similar in all samples and, therefore, samples with HPMA and PEGMA moieties show stronger FWHM reductions when increasing the acrylate content compared to HEMA. So, as the acrylate concentration increases, the molecular weight between crosslinking points is more homogeneous compared to HEMA PUA.
δ peak is hypothesized to be related to the non-homogeneous dispersion of the chain length between crosslinking points. Observing the width tendencies, it can be stated that, at low concentration values, the random bonding of the acrylic groups during photopolymerization is similar in all samples and, therefore, samples with HPMA and PEGMA moieties show stronger FWHM reductions when increasing the acrylate content compared to HEMA. So, as the acrylate concentration increases, the molecular weight between crosslinking points is more homogeneous compared to HEMA PUA.
For HPMA and PEGMA samples, as the wt% is enhanced, so do their intermolecular steric hindrances, leading them to be relatively more evenly distributed compared to the HEMA references, therefore obtaining sharper peaks. The effect is enhanced with PEGMA, which has a much longer polymeric chain than the reference, than for HPMA, which only has the asymmetric methylene differing from the HEMA molecular structure.
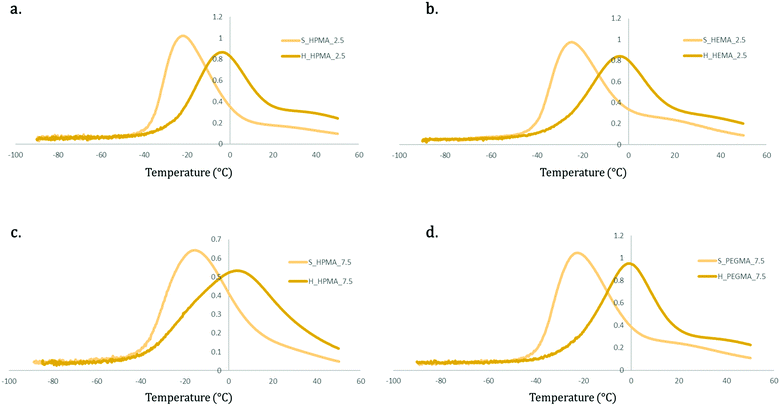
Fig. 9 shows the tan![[thin space (1/6-em)]](https://www.rsc.org/images/entities/char_2009.gif) δ curves of samples maintaining the acrylate type and wt% but changing the soft/hard ratio. Comparing these results, it is possible to notice that softer specimens (80
δ curves of samples maintaining the acrylate type and wt% but changing the soft/hard ratio. Comparing these results, it is possible to notice that softer specimens (80![[thin space (1/6-em)]](https://www.rsc.org/images/entities/char_2009.gif) :
:![[thin space (1/6-em)]](https://www.rsc.org/images/entities/char_2009.gif) 20) show a higher peak intensity and a much lower peak temperature (Tβ) in all samples. This effect can be also attributed to the higher presence of the hard and more rigid PU domains that limit the chain movement in the polymer segments in harder samples (65
20) show a higher peak intensity and a much lower peak temperature (Tβ) in all samples. This effect can be also attributed to the higher presence of the hard and more rigid PU domains that limit the chain movement in the polymer segments in harder samples (65![[thin space (1/6-em)]](https://www.rsc.org/images/entities/char_2009.gif) :
:![[thin space (1/6-em)]](https://www.rsc.org/images/entities/char_2009.gif) 35).
35).
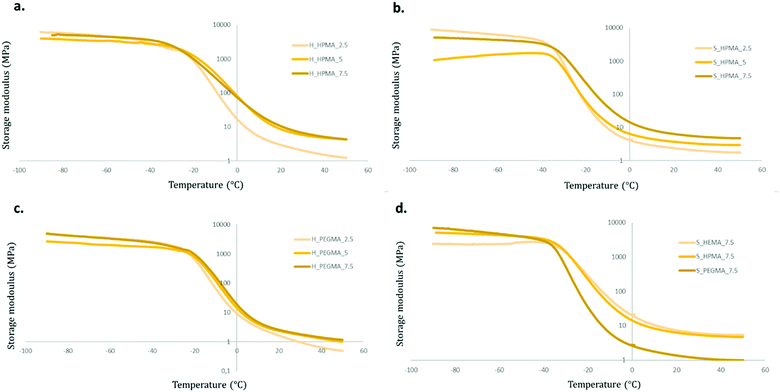
Storage modulus (E′) curves of the different samples are shown in Fig. 10. All materials exhibited a similar storage modulus evolution during heating. First, at low temperatures, the materials present a plateau at values around 1 GPa followed by a decrease during the transition from a glassy state to a rubbery state generated by the chain mobility and, finally, ending in a rubbery plateau at E′ values comprehended between 0.4 and 5.0 MPa.
There are, however, differences in the obtained E′ graphs between the acrylate wt% used, the type of acrylate, and the soft/hard ratio of their PU backbone.
Comparing first acrylate wt% modifications whilst maintaining the rest of the variables constant, samples with an acrylate content of 2.5 wt% exhibited the steepest slope during the transition process and reach a lower rubbery plateau value than their 5 or 7.5 wt% counterparts. These differences are clearer in HPMA-based polymers than those in PEGMA (Fig. 10a and c). Using the acrylate type as the only variable function, HEMA and HPMA perform very similarly while PEGMA-based formulations show a more intense decrease and reach lower E′ values in the rubbery plateau (Fig. 10d). This could be attributed to the increased molecular segment length between crosslinking points in the PEGMA-based samples in contrast with HEMA and HPMA samples that would present an identical length. This segment length increment could facilitate the chain movement resulting in a lower E′ when the temperature is increased, as shown in Fig. 10c. The HPMA thermograms were selected to illustrate the effect on the soft/hard ratio. While, in 65![[thin space (1/6-em)]](https://www.rsc.org/images/entities/char_2009.gif) :
:![[thin space (1/6-em)]](https://www.rsc.org/images/entities/char_2009.gif) 35 soft/hard samples, there are little differences when comparing 5 to 7.5 wt% graphs, in softer specimens, a proportional trend between the wt% of acrylate and the E′ values in the rubbery plateau appears (Fig. 10a and b). This can be linked to a relative increase of the chain movement restriction produced by the acrylate content in softer samples in contrast with those with the higher harder polyurethane segment composition, where the PU backbone seems to play a stronger role in the generation of its properties.
35 soft/hard samples, there are little differences when comparing 5 to 7.5 wt% graphs, in softer specimens, a proportional trend between the wt% of acrylate and the E′ values in the rubbery plateau appears (Fig. 10a and b). This can be linked to a relative increase of the chain movement restriction produced by the acrylate content in softer samples in contrast with those with the higher harder polyurethane segment composition, where the PU backbone seems to play a stronger role in the generation of its properties.
These results indicate that the number of acrylic moieties in the polymer are directly related to the material's stiffness. There is little to no difference between the different materials’ stiffness at temperatures below the glass transition, mostly due to the predominance of the PU structure. Whereas, at a temperature above the glass transition, the acrylic segments appear to have a greater impact on storage moduli. These differences are increased with the acrylate wt% and are seen in specimens with a higher polyol content (80![[thin space (1/6-em)]](https://www.rsc.org/images/entities/char_2009.gif) :
:![[thin space (1/6-em)]](https://www.rsc.org/images/entities/char_2009.gif) 20) due to the increased impact of the crosslinking effect in softer samples as explained previously.
20) due to the increased impact of the crosslinking effect in softer samples as explained previously.
Shore 00 hardness
The measurement of the PUA hardness according to a shore 00 methodology is shown in Fig. 11 for each specimen. As observed, the obtained levels of hardness are well distributed from extra soft (around 40 SU) for the S_PEGMA2.5 specimens to medium-hard values (around 95 SU) for the H_HEMA7.5 sample. Several tendencies can be spotted within the hardness quantification. First, the obtained results are aligned with the data presented so far, where PEGMA-based samples, due to their longer polymeric chains, present a more viscous behaviour that can be translated into softer materials compared to HEMA or HPMA polymers. Interestingly, the increment from 2.5 to 5 wt% in HEMA PUA appears to have a higher impact on the material hardness than in HPMA samples. This effect could be generated by the same inner frictions that induced a more viscous behaviour exhibited by DMA and caused by steric hindrances from HPMA. At 2.5 wt%, HEMA PUA exhibited slightly lower hardness values than their HPMA counterparts.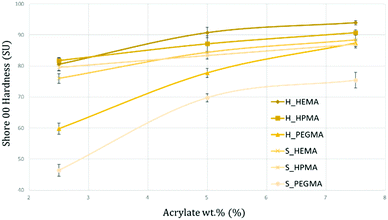 | ||
| Fig. 11 Graphical representation of the shore hardness for each synthesized PUA. The obtained results range from extra-soft (<50 SU) to medium-hard (>90 SU). | ||
However, from 5 and 7.5 wt%, samples containing HEMA were quantified as harder than the samples containing the same acrylate wt% of HPMA in both 80![[thin space (1/6-em)]](https://www.rsc.org/images/entities/char_2009.gif) :
:![[thin space (1/6-em)]](https://www.rsc.org/images/entities/char_2009.gif) 20 and 65
20 and 65![[thin space (1/6-em)]](https://www.rsc.org/images/entities/char_2009.gif) :
:![[thin space (1/6-em)]](https://www.rsc.org/images/entities/char_2009.gif) 35 compositions. Differences between 80
35 compositions. Differences between 80![[thin space (1/6-em)]](https://www.rsc.org/images/entities/char_2009.gif) :
:![[thin space (1/6-em)]](https://www.rsc.org/images/entities/char_2009.gif) 20 and 65
20 and 65![[thin space (1/6-em)]](https://www.rsc.org/images/entities/char_2009.gif) :
:![[thin space (1/6-em)]](https://www.rsc.org/images/entities/char_2009.gif) 35 formulations are also noticeable. At all times, 80
35 formulations are also noticeable. At all times, 80![[thin space (1/6-em)]](https://www.rsc.org/images/entities/char_2009.gif) :
:![[thin space (1/6-em)]](https://www.rsc.org/images/entities/char_2009.gif) 20 specimens showed a softer behaviour than 65
20 specimens showed a softer behaviour than 65![[thin space (1/6-em)]](https://www.rsc.org/images/entities/char_2009.gif) :
:![[thin space (1/6-em)]](https://www.rsc.org/images/entities/char_2009.gif) 35 samples, with differences up to a 28% between H_PEGMA2.5 and S_PEGMA2.5. Beyond the already interesting capability of obtaining the desired degree of softness with a well-known and specific formulation, the quantified values are in the same range of certain biological tissues such as heart,48 kidneys,49 muscles,50 fetal membranes,51 tendons, skin52 or cartilage.53 Moreover, it has been demonstrated by previous studies that although certain healthy tissues exhibit lower hardness values, changes in their inner structure (fibrotic or cancerous processes, among others) can lead them towards having a hardness behaviour with higher values similar to those presented herein.54,55
35 samples, with differences up to a 28% between H_PEGMA2.5 and S_PEGMA2.5. Beyond the already interesting capability of obtaining the desired degree of softness with a well-known and specific formulation, the quantified values are in the same range of certain biological tissues such as heart,48 kidneys,49 muscles,50 fetal membranes,51 tendons, skin52 or cartilage.53 Moreover, it has been demonstrated by previous studies that although certain healthy tissues exhibit lower hardness values, changes in their inner structure (fibrotic or cancerous processes, among others) can lead them towards having a hardness behaviour with higher values similar to those presented herein.54,55
Conclusions
A series of novel, soft photopolymerizable and transparent PUA hybrids were successfully synthesized by a modified two-step polymerization procedure. The synthesis was confirmed by FTIR-ATR and NMR analyses. GPC measurements corroborated the Mw variation on the synthesized PUA hybrids by the addition of different end-capping methacrylic molecules.The polymer composition of the resulting PUA varied by changing the soft/hard ratio and the acrylate monomer in the feed, which influenced the thermal, optical and mechanical properties of the final materials. DSC and TG analyses revealed the effect of the polymer composition on Tg and on the degradation temperature, confirming the possibility of adjusting thermal properties by modifying either the acrylate wt% or the soft/hard segment composition. TGA measurements showed that the decomposition takes place in one stage and PUA hybrids are stable up to high temperatures (around 340 °C), which is compatible with current conventional sterilization processes.
DMA analysis was used to investigate the viscoelastic properties of the photocured PUA. The results suggested that the network density grows with the increasing acrylic monomer content, thus decreasing the viscous response of the material. This behaviour is also affected by the acrylate type, showing a more intense decrease of the viscous response and lower E′ values in the rubbery plateau for PEGMA-based PUA, which possess a longer molecular segment length and a higher chain movement among physical crosslinks than those for HEMA or HPMA-based PUA. The photocured PUA hardness was classified between extra soft and medium-hard. PEGMA allowed the widest range of hardness customization while the incorporation of HPMA had less influence on this property.
The characteristics of the synthesized materials allow them to be used in photocurable 3D printing fields where materials with tuneable properties are needed while not being limited by viscosity requirements (as DIW). Moreover, the softness of these photocurable PUA fits within the one exhibited by certain biological tissues, so they can be considered promising candidates for the fabrication of surgical phantoms or models for biomedical applications.
Author contributions
G. Romero-Sabat contributed to the work by performing the investigation, formal analysis, and writing and editing of the original draft. L. A. Granda contributed to the conceptualization, the formal analysis and the reviewing of the presented work. S. Medel contributed to the conceptualization, supervision, formal analysis, and writing and reviewing of the presented manuscript.Conflicts of interest
The authors state that there are no conflicts to declare.Acknowledgements
The authors would like to thank Hector Linuesa for useful discussions, as well as Dr Aleix Conesa for technical assistance on GPC measurements and Dr Joan Pere López-Olmedo for technical assistance on DMA measurements. This work was co-financed by ACCIÓ and the European Union through the European Regional Development Fund (ERDF) under grant COMRDI16-1-0011-03. This work was performed in the framework of the doctorate in Material Sciences at the Autonomous University of Barcelona.Notes and references
- S.-Y. Park, J. Cheon, B. Y. Jeong, D. H. Lee, P. Huh and J. H. Chun, Mol. Cryst. Liq. Cryst., 2020, 706, 129–135 CrossRef CAS.
- H. Gong, X. Guo, D. Cao, P. Gao, D. Feng, X. Zhang, Z. Shi, Y. Zhang, S. Zhu and Z. Cui, J. Mater. Chem. B, 2019, 7, 744–754 RSC.
- H. Molavi, A. Shojaei and S. A. Mousavi, Polymer, 2018, 149, 178–191 CrossRef CAS.
- J. Huang, J. Sun, R. Zhang, R. Zou, X. Liu, Z. Yang and T. Yuan, Prog. Org. Coat., 2016, 95, 20–25 CrossRef CAS.
- S. K. Asha, M. Thirumal, A. Kavitha and C. K.-S. Pillai, Eur. Polym. J., 2005, 41, 23–33 CrossRef CAS.
- M. Asensio, V. Costa, A. Nohales, O. Bianchi and C. M. Gómez, Polymers, 2019, 11, 1910 CrossRef CAS PubMed.
- J.-H. Bae, J. C. Won, W. B. Lim, J. H. Lee, J. G. Min, S. W. Kim, J.-H. Kim and P. Huh, Polymers, 2021, 13, 844 CrossRef CAS PubMed.
- M. Kury, K. Ehrmann, G. A. Harakály, C. Gorsche and R. Liska, J. Polym. Sci., 2021, 59, 2154–2169 CrossRef CAS.
- G. Taormina, C. Sciancalepore, M. Messori and F. Bondioli, J. Appl. Biomater. Biomech., 2018, 16, 151–160 CAS.
- K. Chen, X. Kuang, V. Li, G. Kang and H. J. Qi, Soft Matter, 2018, 14, 1879–1886 RSC.
- A. Farzan, S. Borandeh, N. Zanjanizadeh Ezazi, S. Lipponen, H. A. Santos and J. Seppälä, Eur. Polym. J., 2020, 139, 109988 CrossRef CAS.
- M. Griffin, N. Castro, O. Bas, S. Saifzadeh, P. Butler and D. W. Hutmacher, Tissue Eng., Part B, 2020, 26, 272–283 CrossRef CAS PubMed.
- H. Quan, T. Zhang, H. Xu, S. Luo, J. Nie and X. Zhu, Bioactive Mater., 2020, 5, 110–115 CrossRef PubMed.
- S. Kim, J. Lee and H. Han, Macromol. Res., 2020, 28, 896–902 CrossRef CAS.
- Z. Chen, M. Yang, M. Ji, X. Kuang, H. J. Qi and T. Wang, Mater. Des., 2021, 197, 109189 CrossRef CAS.
- D. K. Chattopadhyay and D. C. Webster, Prog. Polym. Sci., 2009, 34, 1068–1133 CrossRef CAS.
- T. G. Fox and S. Loshaek, J. Polym. Sci., 1955, 15, 371–390 CrossRef CAS.
- S. Chen, Q. Wang and T. Wang, J. Polym. Res., 2012, 19, 9994 CrossRef.
- J. L. Gadley, R. J. Andrade and J. M. Maia, Macromol. Mater. Eng., 2016, 301, 953–963 CrossRef CAS.
- Y. M. Song, W. C. Chen, T. L. Yu, K. Linliu and Y. H. Tseng, J. Appl. Polym. Sci., 1996, 62, 827–834 CrossRef CAS.
- I. Javni, W. Zhang and Z. S. Petrović, J. Appl. Polym. Sci., 2003, 88, 2912–2916 CrossRef CAS.
- J. Blackwell, M. R. Nagarajan and T. B. Hoitink, Polymer, 1982, 23, 950–956 CrossRef CAS.
- B. Chu, T. Gao, Y. Li, J. Wang, C. R. Desper and C. A. Byrne, Macromolecules, 1992, 25, 5724–5729 CrossRef CAS.
- M. A. Semsarzadeh and A. H. Navarchian, J. Appl. Polym. Sci., 2003, 90, 963–972 CrossRef CAS.
- M. Sultan, S. Atta, H. N. Bhatti, A. Islam, T. Jamil, I. Bibi and N. Gull, Polym.-Plast. Technol. Eng., 2017, 56, 1608–1618 CrossRef CAS.
- F. Wang, J. Q. Hu and W. P. Tu, Prog. Org. Coat., 2008, 62, 245–250 CrossRef CAS.
- M. Alishiri, A. Shojaei and M. J. Abdekhodaie, RSC Adv., 2016, 6, 8743–8755 RSC.
- C. D. Vianna-Soares, K. Cherng-Ju, K. Ciftci and M. R. Borenstein, Mater. Res., 2004, 7, 473–477 CrossRef CAS.
- S. An, M. W. Lee, A. L. Yarin and S. S. Yoon, Chem. Eng. J., 2018, 344, 206–220 CrossRef CAS.
- S. A. Bird, D. Clary, K. C. Jajam, H. V. Tippur and M. L. Auad, Polym. Eng. Sci., 2013, 53, 716–723 CrossRef CAS.
- P. Król, Ł. Uram, B. Król, K. Pielichowska, M. Sochacka-Piętal and M. Walczak, Colloid Polym. Sci., 2020, 298, 1077–1093 CrossRef.
- M. Szycher, Szycher's handbook of polyurethanes, CRC Press, Boca Raton, 1999 Search PubMed.
- R. Janardhan, K. Ramamurthy and J. S. Anand, Polym. Test., 1994, 13, 397–404 CrossRef CAS.
- C. S. Wong and K. H. Badri, MSA, 2012, 03, 78–86 CrossRef CAS.
- G. Mashouf, M. Ebrahimi and S. Bastani, Pigm. Resin Technol., 2014, 43, 61–68 CrossRef CAS.
- M. Wang, S. Liang, W. Gao and Y. Qin, R. Soc. Open Sci., 2022, 9, 211393 CrossRef CAS PubMed.
- P. J. Flory, Principles of polymer chemistry, Cornell University Press, Ithaca (N.Y.) London, 1992 Search PubMed.
- Z. Di, Z. Shi, M. W. Ullah, S. Li and G. Yang, Int. J. Biol. Macromol., 2017, 105, 638–644 CrossRef CAS PubMed.
- W. J. Xu, J. J. Wang, S. Y. Zhang, J. Sun, C. X. Qin and L. X. Dai, RSC Adv., 2018, 8, 20701–20711 RSC.
- V. V. Krongauz, Thermochim. Acta, 2010, 503–504, 70–84 CrossRef CAS.
- K. Demirelli, M. F. Coşkun, E. Kaya and M. Coşkun, Polym. Degrad. Stab., 2002, 78, 333–339 CrossRef CAS.
- M. Herrera, G. Matuschek and A. Kettrup, Polym. Degrad. Stab., 2002, 78, 323–331 CrossRef CAS.
- A. Bahadur, M. Shoaib, A. Saeed and S. Iqbal, e-Polymers, 2016, 16, 463–474 CAS.
- D. Kong, M. Yang, X. Zhang, Z. Du, Q. Fu, X. Gao and J. Gong, Macro Mater. Eng., 2021, 306, 2100536 CrossRef CAS.
- I. M. Barszczewska-Rybarek, A. Korytkowska-Wałach, M. Kurcok, G. Chladek and J. Kasperski, Acta of Bioengineering and Biomechanics, 2017, ISSN 1509-409X DOI:10.5277/ABB-00590-2016-01.
- V. V. Krongauz, J. Therm. Anal. Calorim., 2010, 102, 435–445 CrossRef CAS.
- P. Jutrzenka Trzebiatowska, A. Santamaria Echart, T. Calvo Correas, A. Eceiza and J. Datta, Prog. Org. Coat., 2018, 115, 41–48 CrossRef CAS.
- A. Tejo-Otero, F. Fenollosa-Artés and I. Buj-Corral, Actas del XXXVII Congreso Anual de la Sociedad Española de Ingeniería Biomédica, Santander, España, 27 al 29 de noviembre, 2019, pp. 307–310 Search PubMed.
- A. Tejo-Otero, F. Fenollosa-Artés, I. Achaerandio, S. Rey-Vinolas, I. Buj-Corral, M. Á. Mateos-Timoneda and E. Engel, Gels, 2022, 8, 40 CrossRef CAS PubMed.
- C. T.-P. Choh, M. L. Wall, M. D. Brown, A. M. Nicolson and M. H. Simms, Phlebology, 2010, 25, 94–99 CrossRef CAS PubMed.
- H. Oflaz, Biocybernetics Biomed. Eng., 2016, 36, 138–144 CrossRef.
- A. Chanda, Biomimetics, 2018, 3, 18 CrossRef PubMed.
- G. Spahn, H. Plettenberg, H. Nagel, E. Kahl, H. M. Klinger, T. Mückley, M. Günther, G. O. Hofmann and J. A. Mollenhauer, Med. Eng. Phys., 2008, 30, 285–292 CrossRef PubMed.
- Y. C. Yoon, J. S. Lee, S. U. Park, J. H. Kwon, T. H. Hong and D. G. Kim, Ann. Surg. Treat Res., 2017, 93, 300 CrossRef PubMed.
- J. D. Hughes, N. Fattahi, J. Van Gompel, A. Arani, F. Meyer, G. Lanzino, M. J. Link, R. Ehman and J. Huston, Neurosurgery, 2015, 77, 653–659 CrossRef PubMed.
| This journal is © The Royal Society of Chemistry 2022 |

