 Open Access Article
Mesoporous Fe–Al-doped cellulose for the efficient removal of reactive dyes†
Maithili
Khapre
a,
Anita
Shekhawat
a,
D.
Saravanan
b,
Sadanand
Pandey
c and
Ravin
Jugade
 *a
*a
aDepartment of Chemistry, R. T. M. Nagpur University, Nagpur – 440010, Maharashtra, India. E-mail: ravinj2001@yahoo.co.in
bDepartment of Chemistry, National College, Tiruchirapalli – 620001, India
cDepartment of Chemistry, College of Natural Science, Yeungnam University, 280 Daehak-Ro, Gyeongsan, Gyeongbuk 38541, Republic of Korea
First published on 24th February 2022
Abstract
A highly efficient mesoporous bimetallic cellulose composite has been prepared by the simultaneous precipitation of Fe and Al metal solutions in a cellulose matrix. This Fe–Al doped cellulose (FADC) was characterized using XRD, FT-IR, SEM, EDAX, BET, and pHPZC. It was used for the removal of two reactive dyes namely Reactive red 21 (RR21) and Reactive blue 19 (RB19) by a batch adsorption technique. The batch experiments were carried out to optimize the various operational parameters. The adsorption isotherm study showed that the data fitted to the Langmuir isotherm with a monolayer adsorption capacity of 117.86 mg g−1 for RR21 dye and 95.62 mg g−1 for RB19 dye. The pseudo-second-order model was fitted well while the mechanism of adsorption was deduced using the Weber–Morris model of intraparticle diffusion. Adsorption thermodynamics calculations revealed that the mechanism of adsorption is impulsive and driven by negative enthalpy change.
Introduction
Biosorption is the most convenient method to remove industrial pollutants from natural water bodies. The various advantages offered by this technique are simple design, low cost and target specificity.1 Biosorption studies using a natural polymer in its native or modified state are gaining more importance nowadays. A number of naturally occurring polymers that are abundantly available in nature and upon proper treatment have been reported as effective adsorbents are cellulose,2–4 chitin5,6 and chitosan,7–11 alginates,12,13 clays,14 magnetic ferrites15,16 and resins.17,18 They are applied for the removal of various water pollutants such as heavy metals,19,20 dyes in single21,22 and binary systems,23 pesticides, paints etc. Formation of composites13,14 is another useful method that combines the essential properties of two or more polymers or a blend of polymer with transition metals leading to high adsorption capacity. Among all, cellulose is the most abundant natural polymer resource with an annual yield of nearly 1.5 trillion tones which makes it an almost inexhaustible source of raw material on planet earth. Cellulose is obtained from plant, algal cell walls and also from some bacteria.24 Cellulose is a linear chain of repeating β-D-glucopyranose units which are covalently linked through acetal functions (β-1,4-glucan).25Reactive dyes are the dyes that get covalently bonded with –OH or –NH2 groups of fibres thereby adhering very strongly to the fibre polymer. They are commonly used for dyeing cellulose fibres in the dye industry. Inhalation of reactive dyes may lead to respiratory problems including asthma. Many workers have reported removal of reactive dyes from water bodies using various biopolymers as well as their composites. However, most of the reported materials suffer from the limitation of very low adsorption capacities, which make them unsuitable for use as efficient adsorbents.
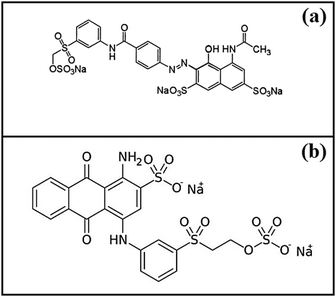
Doping of biopolymers with metals and metal oxides lead to enhanced porosity in their structures leading to improvement in the adsorption capacities. Many workers have reported similar kinds of composites for the efficient removal of fluoride ions.26–28 Our research group has reported various mesoporous composites for the adsorptive removal of fluoride,5,9 dyes,10–13 arsenic8 and Cr(VI).14 In the present study, a mesoporous composite of cellulose has been prepared by co-precipitation of iron and aluminium in the cellulose matrix. This doping resulted in the enhancement of adsorption sites as well as the porosity of the material. Two reactive dyes, Reactive red 21 (RR21) and Reactive blue 19 (RB19) (Fig. 1), have been chosen as representatives of anionic dyes in this study.
Materials and method
Chemicals
All chemicals and reagents used were of analytical grade. Cellulose microcrystalline powder was obtained from Molychem India Pvt. Ltd. Urea, thiourea, sodium hydroxide (NaOH) pellets, ferric chloride (FeCl3) anhydrous, ferrous sulfate (FeSO4·7H2O), aluminium chloride (AlCl3) anhydrous and hydrochloric acid (HCl) were obtained from S D Fine Chemicals Ltd. Mumbai. Reactive red 21 and Reactive blue 19 dyes were acquired from Loba chemicals, Mumbai. Deionized–distilled water was used for preparing all the solutions.Instrumentation
The synthesized material FADC was characterized using various techniques. The structural and functional details could be explained on the basis of the FT-IR spectra recorded using a BrukerAlphaE spectrometer in the range 500–4000 cm−1. The XRD pattern was recorded using an X-ray diffractometer system Rigaku-Miniflex 300. Surface morphology was studied using a scanning electron microscope (SEM) model TESCAN VEGA 3 SBH. Energy dispersive spectroscopy (EDAX) analysis was performed for elemental composition using an X-ray analyzer Oxford INCA Energy 250 EDS system during SEM observations. Thermal analysis was carried out using DTG-60 simultaneous DTA/TG instrument (Shimadzu) in nitrogen medium. The Brunauer–Emmett–Teller surface area was estimated by the nitrogen adsorption–desorption method on a Quantachrome Nova 2200e analyzer. The pHPZC was performed using Equiptronics EQ-615. The λmax and absorbance of the dyes were recorded using Equiptronics EQ-824 while Equiptronics magnetic stirrer model EQ-770 was used for batch adsorption stirring.Preparation of adsorbent
Cellulose solution was prepared by dissolving 2.5 g of microcrystalline cellulose powder in a mixture of NaOH/thiourea/urea/H2O in the ratio of 8![[thin space (1/6-em)]](https://www.rsc.org/images/entities/char_2009.gif) :
:![[thin space (1/6-em)]](https://www.rsc.org/images/entities/char_2009.gif) 6.5
6.5![[thin space (1/6-em)]](https://www.rsc.org/images/entities/char_2009.gif) :
:![[thin space (1/6-em)]](https://www.rsc.org/images/entities/char_2009.gif) 8
8![[thin space (1/6-em)]](https://www.rsc.org/images/entities/char_2009.gif) :
:![[thin space (1/6-em)]](https://www.rsc.org/images/entities/char_2009.gif) 77.5 by weight with continuous stirring for about an hour. A 0.1 M FeCl3 solution and 0.1 M AlCl3 solution were prepared in 100 mL of 0.01M HCl respectively and heated to 60 °C. The two metal solutions were mixed in a 500 mL beaker and the cellulose solution was dripped drop-wise to neutral pH. This solution was stirred for an hour at 1000 rpm for homogenous dispersion of the Fe–Al precipitate in the cellulose matrix and then aged for 48 hours. The precipitate was washed using de-ionized water and the supernatant liquid was removed using the decantation method until it tested negative for chloride ions. The resultant precipitate, Fe–Al doped cellulose (FADC) was kept in a hot air oven for 4 hours at 50 °C followed by sieving through a -100 micron mesh to get uniform grain size.
77.5 by weight with continuous stirring for about an hour. A 0.1 M FeCl3 solution and 0.1 M AlCl3 solution were prepared in 100 mL of 0.01M HCl respectively and heated to 60 °C. The two metal solutions were mixed in a 500 mL beaker and the cellulose solution was dripped drop-wise to neutral pH. This solution was stirred for an hour at 1000 rpm for homogenous dispersion of the Fe–Al precipitate in the cellulose matrix and then aged for 48 hours. The precipitate was washed using de-ionized water and the supernatant liquid was removed using the decantation method until it tested negative for chloride ions. The resultant precipitate, Fe–Al doped cellulose (FADC) was kept in a hot air oven for 4 hours at 50 °C followed by sieving through a -100 micron mesh to get uniform grain size.
Batch adsorption tests
Batch adsorption experiments were performed by taking 25 mL dye solution of fixed concentration administered with a known weight of FADC in a 50 mL conical flask. Adsorption systems were stirred in a magnetic stirrer equipped with magnetic needle for the desired interval of time at room temperature. The systems were centrifuged and the absorbance value of the supernatant was recorded. Triplicate readings were taken and averaged out to check reproducibility. The equilibrium adsorption efficiency in mg g−1 can be calculated using eqn (1).| qe = (Co − Ce) × V/W | (1) |
pH point of zero charge
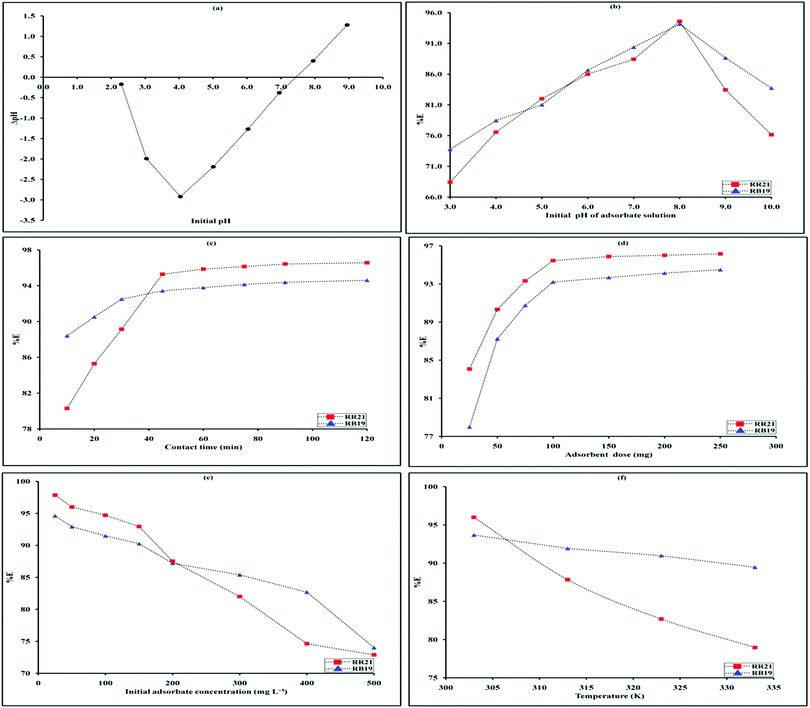
The pH point of zero charge (pHPZC) is the pH value at which there is no net charge on the surface of the adsorbent (Jeyaseelan 2018). Below this pH, the net charge on the adsorbent surface is positive while above this pH, it is negative. Hence pHPZC can be used for presuming the adsorbent–adsorbate interaction. For determination of pHPZC of the adsorbent, 25 mL of 0.01M sodium chloride solution was taken in a conical flask. The initial pH values were adjusted in the range 3.0 to 11.0 using dilute solutions of HCl and NaOH. To each of the flasks, 0.1g of the adsorbent was added and kept in contact for 24 hours. After that, the solutions were centrifuged and the solution pH was recorded again. The plot of change in pH as a function of initial pH crosses the X-axis at pHpzc.Adsorption isotherms
The adsorption isotherms were studied using the Langmuir, Freundlich and Temkin models. Adsorption isotherm models help in predicting various parameters such as adsorbate–adsorbent interaction, surface coverage, enthalpy of adsorption and nature of adsorption. The isotherms were studied by varying the concentration of the adsorbing systems (keeping other parameters at optimized levels) in the concentration range of 25 to 500 mg L−1. The details regarding each of the isotherm models studied along with the defining variables are summarized in Table S1, ESI.†Adsorption kinetics
For kinetics studies, pseudo first-order, pseudo second-order and intraparticle diffusion models were applied. For studying kinetics, adsorption systems were kept in contact for a time range of 10 to 90 minutes. Calculations leading to R2 values were used to obtain the appropriate model fitting the experimental data. The detailed information regarding these three models along with equations and variables is described in the table (S2, ESI†).Adsorption thermodynamics
Three important parameters namely ΔG, ΔH and ΔS were evaluated using the van’t Hoff plot. For this purpose, adsorption systems (with optimized values of other operational parameters) were run at four different temperatures. The details of the van’t Hoff plot are described in Table S3, ESI.†Results and discussion
Characterization of FADC
XRD pattern
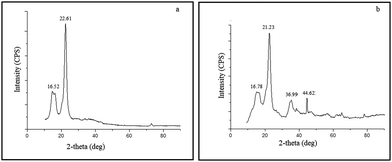
The characteristic peaks for cellulose (Fig. 3a) were obtained at 2θ = 16.52° and 22.61° which accounts for its crystalline behaviour.31,32 These two peaks have been attributed to (110) and (200) planes of cellulose. The XRD pattern of FADC (Fig. 3b) shows additional peaks at 2θ = 36.99° and 44.62° corresponding to the interaction between (110) planes of Fe2O3 and Al2O3 respectively.33SEM and EDAX studies
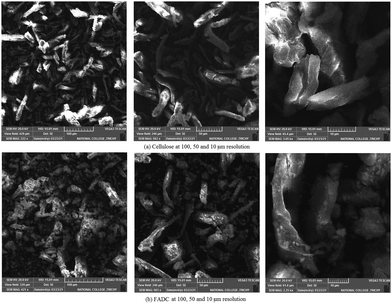
The SEM micrographs of cellulose and FADC (Fig. 4) were obtained at three different resolutions as shown in Fig. 3. Cellulose shows smooth fibrous morphology that has been modified to a rough granular form on interaction with Fe and Al metal. This granular morphology is also responsible for the high surface area value obtained using the BET technique. SEM micrographs give a clear picture of transformation of cellulose having a fibrous nature into the FADC composite with a mesoporous nature.28The EDAX studies of native cellulose shows the important peaks for carbon and oxygen, which are among the most abundant elements of polysaccharides (Fig. 5). The EDAX of FADC gives the compositional data. It shows the peaks for Fe, Al along with C and O. Small peaks are also obtained for S, Si and Cl which are present in a minute amount.
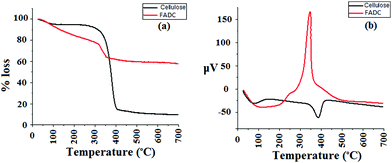
TGA-DTA analysis
The TGA curve of cellulose (Fig. 6a) shows a small weight loss of about 8% at 100 °C corresponding to loss of moisture and second major weight loss of about 80–85% between 220 and 400 °C, which indicate complete degradation.34 The TGA curve of FADC shows moisture loss of about 10–15% around 150 °C and a sharp degradation curve between 300 and 400 °C. Also, the weight loss in FADC is much less as compared to that in native cellulose due to the presence of metals that remain as residue and stable at very high temperature.The DTA curve of cellulose (Fig. 6b) shows two endothermic peaks, the first corresponding to moisture loss and the second corresponding to complete degradation. On the other hand, the DTA curve of FADC shows a sharp exothermic peak around 350 °C. This change in nature from endothermic to exothermic can be attributed to the formation of the composite with strong forces of attraction that undergo exothermic degradation on heating.
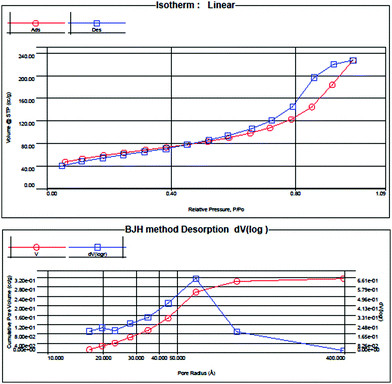
BET surface area analysis
The pore size distribution of the adsorbent material including the available surface area for adsorption and pore volume availability are important factors for obtaining good adsorption capacity. In order to determine the exact values of these factors, BET analysis was carried out. The BET surface area analysis is based on the adsorption–desorption of nitrogen gas on the surface of the adsorbent while the BJH method which is based on pore filling pressure is used to calculate the pore volume (Fig. 7).9The surface area of microcrystalline cellulose powder was found to be 0.092 m2 g−1. After formation of FADC composite, it increased to 205.988 m2 g−1 and the pore volume was 0.3561 cm3 g−1. This huge enhancement in surface area is suggestive of the porous nature of the adsorbent surface. The adsorption–desorption curve is of Type IV as per IUPAC nomination.35,36 The average pore radius was 3.414 nm indicating mesoporous nature as per IUPAC classification. The adsorption–desorption isotherm shows a small hysteresis loop as the H4 type. Such a loop is observed if the material is highly complex showing microporosity as well as mesoporosity. This observation is consistent with the granular appearance of the surface of the material as obtained in SEM micrographs. The isotherm shows desorption curve shifted to lower values than adsorption which can be attributed to cavitation persuaded desertion.37 The shape of the micro- and mesopores is the deciding factor for the lower limit of the hysteresis loop.38 Such an isotherm suggests that the micropores are initially filled with the inert gas and later multilayer physisorption and capillary condensation occurs. Also, the ‘C’ value in the BET equation was evaluated as 551.036 which show strong adsorbate–adsorbent interaction.39 The high adsorption capacity of FADC composite towards the two reactive dyes, RR21 and RB19 can be safely attributed to the high surface area, large pore volume and mesoporous nature of the adsorbent.
Optimization of operational parameters
Effect of contact time
The adsorbate–adsorbent systems having initial dye concentration of 50 mg L−1, pH 8.0 and 100 mg of adsorbent were kept in contact for a time range of 10 to 120 minutes with constant stirring. It was observed that with increase in the contact period, the removal efficiency increased regularly up to 45 min. But after 45 minutes, there was negligible hike in removal efficiency and so the contact time of 45 minutes was optimized for both the dyes (Fig. 8c).Effect of adsorbent dose
The effect of adsorbent dose on the process of adsorption was studied by varying the dose between 25 and 500 mg. The adsorbate–adsorbent systems (50 mg L−1) having optimized values of pH and contact time was taken and varying dose of the adsorbent was administered. It was observed that with increase in dose, the removal efficiency increases. This can be attributed to the availability of a large number of active adsorption sites as compared to the adsorbing dye molecules (Fig. 8d). But after a certain dose, there seems to be negligible increase in the removal efficiency as almost 95% of both the dyes have been adsorbed. This indicates establishment of equilibrium in the adsorbent–adsorbate interface. An adsorbent dose of 100 mg was optimized for both the dyes as after this there was only slight increase in the removal efficiency.Effect of initial adsorbate concentration
The initial dye concentration was varied from 25 to 500 mg L−1. Increase in dye concentration led to percentage removal decrease (Fig. 8e). This observation is consistent with the availability of the active adsorption sites on the surface of the adsorbent. As the number of incoming dye molecules increase, the availability of active adsorption sites decreases thus lowering the removal efficiency. With this context, an initial dye concentration of 50 mg L−1 was fixed for further studies.Effect of temperature
To study the effect of temperature, the temperature was varied from 303 to 333 K. It was observed that the maximum removal efficiency was obtained at 303 K and later on it decreased (Fig. 8f). This observation can be correlated with the usual observation that as the temperature increases, adsorption decreases. With increase in temperature, the kinetic energy of the molecules increases and hence their binding to the surface of the adsorbent decreases.Adsorption isotherms
On subjecting the data obtained in batch adsorption experiments to the Langmuir, Freundlich, Temkin and Dubinin–Radushkevich (D–R) isotherm models (Fig. S1, ESI†), it was observed that the Langmuir model is best fit model for both the dyes. This was concluded from the high values of correlation coefficient, R2. Also the RL values lie between 0 and 1 which are indicative of the favourability of the adsorption process. The maximum monolayer adsorption capacity (qmax) was found to be 117.86 mg g−1 for RR21 and 95.62 mg g−1 for Rb19 dye respectively. Furthermore, the values of n > 1 obtained from the Freundlich isotherm suggest strong interaction between the FADC and dye molecules. The values of enthalpy of adsorption (b) more than 120 J mol−1 given by the Temkin isotherm suggest that some extent of chemisorption is also involved during uptake of dyes. The average free energy of adsorption in excess of 100 kJ mol−1 obtained from D–R model also supports chemisorption phenomenon. The values of different parameters evaluated for the four isotherm models studied are summarized in Table 1.| Parameters | RR21 | RB19 |
|---|---|---|
| Langmuir isotherm model | ||
| K L (L g−1) | 1.346 | 1.225 |
| q m (mg g−1) | 117.86 | 95.62 |
| R L | 0.035 | 0.009 |
| R 2 | 0.990 | 0.990 |
| Freundlich isotherm model | ||
| K F (mg1−1/n g−1 L−1) | 5.189 | 8.566 |
| 1/n | 0.643 | 0.497 |
| n (g L−1) | 1.556 | 2.013 |
| R 2 | 0.979 | 0.973 |
| Temkin isotherm model | ||
| K T (L g−1) | 0.496 | 1.098 |
| b (J mol−1) | 120.45 | 159.19 |
| R 2 | 0.942 | 0.949 |
| D–R isotherm model | ||
| q m (mg g−1) | 47.48 | 46.13 |
| E (kJ mol−1) | 566 | 937 |
| R 2 | 0.697 | 0.700 |
Adsorption kinetics
On studying the three kinetic models, it was observed that the pseudo second-order is the best fit kinetic model (Fig. S2, ESI†). This was concluded on the basis of following two reasons. First, the values of correlation coefficient, R2 were found to be unity and second, the values of calculated qe obtained were found to be in good agreement with the values of experimental qe for both the dyes under study. The details of the variables evaluated using the kinetic models are summarized in Table 2.| Dyes | RR21 | RB19 |
|---|---|---|
| Experimental qe | 11.61 | 12.00 |
| Pseudo first order | ||
| k 1 (min−1) | 0.124 | 0.099 |
| q e (calculated) | 1.45 | 2.54 |
| R 2 | 0.927 | 0.953 |
| Pseudo second order | ||
| k 2 (mg g−1 min−1) | 18.353 | 14.590 |
| q e (calculated) | 11.92 | 12.39 |
| R 2 | 1.000 | 1.000 |
| Intraparticle diffusion | ||
| i int (mg g−1 min−1/2) | 0.095 | 0.268 |
| R 2 | 0.840 | 0.817 |
Adsorption thermodynamics
Adsorption thermodynamics shows that the process is spontaneous with negative values of ΔG at all the four temperatures were studied (Fig. S3, ESI†). The values of adsorption enthalpy and entropy are also found to be negative suggesting an exothermic process with decrease in the randomness of the mobile dye molecules due to adsorption on the surface of FADC. The values of ΔH are largely negative as compared to TΔS which indicates that the process is enthalpy driven in nature (Table 3).| Temperature | 303 K | 313 K | 323 K | 333 K |
|---|---|---|---|---|
| RR21 | ||||
| ΔG (kJ mol−1) | −7.25 | −6.51 | −5.77 | −5.03 |
| ΔH (kJ mol−1) | −29.673 | |||
| ΔS (kJ mol−1 K−1) | −0.074 | |||
| RB19 | ||||
| ΔG (kJ mol−1) | −6.61 | −5.52 | −4.43 | −3.34 |
| ΔH (kJ mol−1) | −39.637 | |||
| ΔS (kJ mol−1 K−1) | −0.109 | |||
Conclusions
An Fe–Al doped cellulose (FADC) adsorbent for adsorptive removal of RR21 and RB19 has been fabricated successfully by using the simultaneous co-precipitation method. FADC was characterized using various techniques which confirmed the formation of a composite having Fe and Al as intrinsic constituents. SEM micrographs and EDAX analysis showed the morphological transformation and composition of FADC respectively. BET surface area analysis using the nitrogen adsorption–desorption method revealed good surface area and pore volume and also confirmed the mesoporous nature of the adsorbent. Furthermore, the value of pHPZC was found to be 7.5 which favoured the adsorption of RR21 and RB19 at slightly basic pH. The adsorption isotherm was fitted to the Langmuir model with an adsorption capacity of 117.86 mg g−1 for RR21 and 95.62 mg g−1 for the RB19 dye respectively. Kinetics followed the second-order model while the thermodynamics of adsorption revealed spontaneous adsorption phenomena with negative values of enthalpy and entropy which indicated an exothermic nature and an ordered manner of process respectively. Various materials reported in the literature for the adsorptive removal of reactive dyes have been summarized and compared with FADC in Table 4.| Reactive dye | Adsorbent | Maximum adsorption capacity (qm) | Ref. |
|---|---|---|---|
| RB19 | Co-electrospun nanofibres | 61.2 mg g−1 | 40 |
| Lemna minor | 9.45 mg g−1 | 41 | |
| Fly ash (FA) | 47-86 mg g−1 | 42 | |
| Metal hydroxide waste sludge | 91.0 mg g−1 | 43 | |
| Fe–Al doped cellulose (FADC) | 95.62 mg g−1 | Present work | |
| RR133 | Aluminium residue | 6.88 mg g−1 | 44 |
| RR 120 | Sugarcane bagasse powder | 94.62% | 45 |
| RR 228 | Fe3O4-aminopropyltriethylsilane (Fe3O4/APTES) | 51.4 mg g−1 | 46 |
| RR 195 | Pinus sylvestris linneo | 6.69 mg g−1 | 47 |
| RR 21 | Fe–Al doped cellulose (FADC) | 117.86 mg g−1 | Present work |
Author contributions
MK and AS: methodology, validation, investigation, writing first draft. DS: formal analysis, resources. SP: review and editing. RJ: conceptualization, writing: review and editing, supervision.Conflicts of interest
There are no conflicts to declare.Acknowledgements
The authors are thankful to R. T. M. Nagpur University for URPS No. Dev. 2117, DST, New Delhi for DST-FIST grant and UGC, New Delhi, for UGC-SAP grant. MK acknowledges DST – INSPIRE while AS acknowledges CSIR-RA funding.References
- M. H. Rahaman, M. A. Islam, M. M. Islam, M. A. Rahman and S. M. Nur Alam, Curr. Res. Green Sustainable Chem., 2021, 4, 100119 CrossRef.
- B. Baghaei and M. Skrifvars, Molecules, 2020, 25, 2836 CrossRef CAS PubMed.
- Y. Tian, M. Wu, R. Liu, D. Wang, X. Lin, W. Liu, L. Ma, Y. Li and Y. Huang, J. Hazard. Mater., 2011, 185, 93 CrossRef CAS PubMed.
- M. Kaiser, A. Mudasir, A. Suhail and I. Saiqa, RSC Adv., 2019, 9, 7890 RSC.
- A. Shekhawat, S. Kahu, D. Saravanan and R. Jugade, RSC Adv., 2016, 6, 18936 RSC.
- X. Yang, J. Liu, Y. Pei, X. Zheng and K. Tang, Energy, Environ. Mater., 2020, 3, 492 CrossRef.
- S. A. Qamar, M. Ashiq, M. Jahangeer, A. Riasat and M. Bilal, Case Stud. Chem. Environ. Eng., 2020, 2, 100021 CrossRef.
- A. Shekhawat, S. Kahu, D. Saravanan and R. Jugade, Carbohydr. Polym., 2017, 172, 205 CrossRef CAS PubMed.
- S. Korde, S. Tandekar and R. M. Jugade, J. Environ. Chem. Eng., 2020, 8, 104360 CrossRef CAS.
- S. Korde, S. Deshmukh, S. Tandekar and R. Jugade, Carbohydr. Polym. Technol. Appl., 2021, 2, 100081 Search PubMed.
- M. A. Khapre and R. M. Jugade, Water Sci. Technol., 2020, 82, 715 CrossRef CAS PubMed.
- S. H. Vithalkar and R. M. Jugade, Mater. Today: Proc., 2020, 29, 1025 CAS.
- M. A. Khapre, S. Pandey and R. M. Jugade, Int. J. Biol. Macromol., 2021, 190, 862 CrossRef CAS PubMed.
- S. Korde, S. Tandekar, C. Jeyaseelan, D. Saravanan and R. Jugade, Mater. Lett., 2022, 311, 131513 CrossRef CAS.
- M. Kumar, H. S. Dosanjh and H. Singh, Fibers Polym., 2019, 20, 739 CrossRef CAS.
- M. Kumar and H. Singh, Environ. Sci.: Water Res. Technol., 2020, 6, 491 RSC.
- S. Popa, M. E. Radulescu-Grad and A. Perdivara, Sci. Rep., 2021, 11, 5889 CrossRef CAS PubMed.
- X. Feng, W. Fugang, C. Shuai, J. Shengui and X. Weihong, J. Chem. Eng. Data, 2017, 62, 4266 CrossRef.
- H. A. Alalwan, M. A. Kadhom and A. H. Alminshid, J. Water Supply: Res. Technol. – AQUA, 2020, 69, 99 CrossRef.
- N. A. A. Qasem, R. H. Mohammed and D. U. Lawal, npj Clean Water, 2021, 4, 36 CrossRef CAS.
- V. Gupta and K. Suhas, J. Environ. Manage., 2009, 90, 2313 CrossRef CAS PubMed.
- E. Forgacs, T. Cserhati and G. Oros, Environ. Int., 2004, 30, 953 CrossRef CAS PubMed.
- M. Kumar, H. S. Dosanjh and H. Singh, J. Inorg. Organomet. Polym. Mater., 2018, 28, 880 CrossRef CAS.
- L. M. J. Kroon-Batenburg and J. Kroon, Glycoconjugate J., 1997, 14, 677 CrossRef CAS PubMed.
- D. W. O’Connell, C. Birkinshaw and T. F. O. Dwyer, Bioresour. Technol., 2008, 99, 6709 CrossRef PubMed.
- S. Raghav, S. Nehra and D. Kumar, Process Saf. Environ. Prot., 2019, 127, 211 CrossRef CAS.
- A. Vázquez-Guerrero, R. Cortés-Martínez, R. Alfaro-Cuevas-Villanueva, E. M. Rivera-Muñoz and R. Huirache-Acuña, Water, 2021, 13, 89 CrossRef.
- N. Sankararamakrishnan, I. Srivastava and S. Mishra, Int. J. Biol. Macromol., 2019, 128, 556 CrossRef CAS PubMed.
- V. Hospodarova, E. Singovszka and N. Stevulova, Am. J. Anal. Chem., 2018, 9, 303 CrossRef CAS.
- M. Chaudhary, S. Rawat, N. Jain, A. Bhatnagar and A. Maiti, Carbohydr. Polym., 2019, 216, 140 CrossRef CAS PubMed.
- L. Du, J. Wang, Y. Zhang, C. Qi, M. P. Wolcott and Z. Yu, Nanomaterials, 2017, 7, 51 CrossRef PubMed.
- Y. Guo, X. Xing, Y. Shang, B. Gao, L. Zhang, Q. Yue and Z. Wang, J. Hazard. Mater., 2019, 379, 120634 CrossRef CAS PubMed.
- J. Zhao, Z. Lu, X. He, X. Zhang, Q. Li, T. Xia and C. Lu, ACS Sustainable Chem. Eng., 2017, 5, 7723 CrossRef CAS.
- G. F. Leal, L. A. Ramos, D. H. Barrett, A. A. S. Curvelo and C. B. Rodella, Thermochim. Acta, 2015, 616, 9 CrossRef CAS.
- K. Sing and R. Williams, Adsorpt. Sci. Technol., 2004, 22, 773 CrossRef CAS.
- M. Thommes, K. Kaneko, A. Neimark, J. Olivier, F. Rodriguez-Reinoso, J. Rouquerol and K. Sing, Pure Appl. Chem., 2015, 87, 1051 CrossRef CAS.
- S. Ahmed and A. Iqbal, Global Challenges, 2018, 1800056, 1 Search PubMed.
- M. Kruk, M. Jaroniec, T. Kim and R. Ryoo, Chem. Mater., 2003, 15, 2815 CrossRef CAS.
- M. Thommes, B. Smarsly, M. Groenewolt, P. Ravikovitch and A. Neimark, Langmuir, 2006, 22, 756 CrossRef CAS PubMed.
- R. A. Hakro, M. Mehdi, R. F. Qureshi, R. B. Mahar, M. Khatri, F. Ahmed, Z. Khatri and I. S. Kim, Mater. Res. Express, 2021, 8, 055502 CrossRef CAS.
- D. Balarak, Y. Mahdavi and A. Joghataeic, Archieves. Hyg. Sci., 2015, 4, 199 Search PubMed.
- N. Dizge, C. Aydiner, E. Demirbas, M. Kobya and S. Kara, J. Hazard. Mater., 2008, 150, 737 CrossRef CAS PubMed.
- S. C. Santos, V. J. Vílar and R. A. Boaventura, J. Hazard. Mater., 2008, 153, 999 CrossRef CAS PubMed.
- T. C. Silva, T. J. M. Fraga, M. Carvalho, V. L. Silva and M. A. Da Motta, Lat. Am. Appl. Res., 2018, 48, 101 CAS.
- S. Ahmed, Y. C. Wong and K. V. Veloo, IOP Conf. Ser.: Earth Environ. Sci., 2018, 140, 012027 CrossRef.
- T. G. Yan and L. J. Wang, Adsorpt. C.I. Water Sci. Technol., 2014, 69, 612 CrossRef CAS PubMed.
- O. Aksakal and H. Ucun, Equilib. J. Hazard. Mater., 2010, 181, 666 CrossRef CAS PubMed.
Footnote |
| † Electronic supplementary information (ESI) available. See DOI: 10.1039/d2ma00146b |
| This journal is © The Royal Society of Chemistry 2022 |

