
 Open Access Article
 This Open Access Article is licensed under a
 Creative Commons Attribution 3.0 Unported Licence
The fabrication of a highly conductive ceria-embedded gadolinium-stabilized bismuth oxide nanocomposite solid electrolyte for low-temperature solid oxide fuel cells†
Abjana
Parbin
and
Rafiuddin
 *
*
Physical Chemistry Division, Department of Chemistry, Aligarh Muslim University, Aligarh, 202002, India. E-mail: rafiuddin.chem11@gmail.com
First published on 10th March 2022
Abstract
We report the synthesis of a nanocomposite solid electrolyte, (1 − x)Bi2O3–Gd2O3:xCeO2 (GDBC), made up of ceria-embedded gadolinium-stabilized bismuth oxide (Bi2O3–Gd2O3, GDB) for low-temperature solid oxide fuel cell (LT-SOFC) applications. Different compositions of (1 − x)Bi2O3–Gd2O3:xCeO2 (where 0 ≤ x ≤ 50 wt%) were fabricated using a solid-state method. Detailed structural analysis of the nanocomposite solid electrolyte samples was done using SEM, TEM, XRD, and FT-IR techniques. The incorporation of CeO2 nanofiller enhances the ionic conductivity relative to Bi2O3–Gd2O3 nanocomposite solid electrolyte via creating new routes for oxygen-ion conduction within the parent network. Among the different compositions of nanocomposite material, GDBC with 40 wt% CeO2 nanofiller shows the maximum ionic conductivity, i.e., σ = 7.56 × 10⁻² S cm−1, and lowest activation energy (0.0954 eV) at low temperature (340 °C). Notably, challenges preventing the commercialization of LT-SOFCs include material conductivity, safety, and production costs. Hence, this superionic nanocomposite solid electrolyte with 40 wt% CeO2, having high conductivity at low temperature and low cost, could be a promising candidate for the fabrication of electrolytes for fuel-cell applications.
1. Introduction
The widespread use of renewable energy sources is entirely dependent on the development of efficient energy storage technologies. Stable batteries that can be safely operated and have high specific capacities are required to support environmentally friendly electric vehicles and grid storage.1,2 Liquid electrolytes are currently widely utilized in batteries, although they pose safety concerns, such as liquid spillage or ignition. Solid-state materials are much more suitable from the perspectives of device fabrication, stability, and safety.3 All solid-state batteries have a cathode, anode, and electrolyte, and the qualities of the batteries are mostly determined based on the properties of the electrolyte.4 As a result, electrolytes with high ionic conductivity are referred to as superionic conductors,5 and their strong electrochemical stability is predicted to create favorable electrochemical interfaces when coupled with appropriate electrodes.6 Solid electrolytes and superionic conductors have been investigated extensively to address the inherent issues mentioned above. Sensors, solid oxide fuel cells, capacitors, and solid-state batteries all make use of them.7 To date, the exploration and development of electrode materials for use with high-performance superionic conductors have received a lot of interest.Solid oxide fuel cells (SOFCs) are sophisticated electrochemical energy-conversion devices that convert chemical energy directly into electrical energy.8 They have excellent prospects for addressing the increasing demands for energy because of their high conversion efficiencies, low emissions, zero noise, and wide application potential.9 Solid oxide fuel cells (SOFCs) have drawn much interest as they are ecologically benign, highly efficient, and show excellent ionic conductivity. Zirconia doped with 8% yttria (YSZ) has been regarded as the best electrolyte.10–12 However, the high working temperature poses several issues, including material deterioration and the need for costly noble-metal electrodes.13 Solid electrolytes exhibiting high ionic conductivity in the low temperature range (below 600 °C) must be developed.
Nanoparticles of bismuth sesquioxide (Bi2O3) are frequently utilized as a fundamental precursor of various solid electrolytes.14 Many researchers have investigated the electrical conduction of pure Bi2O3 and found that α-Bi2O3 has poor conductivity, whereas δ-Bi2O3 exhibits significant oxide-ion conductivity at high temperatures due to the number of oxygen-ion vacancies in its defective fluorite-type structure.15 At high temperatures, bismuth sesquioxide tends to reduce under low oxygen pressure. However, as mentioned above, high operating temperatures pose challenges, including material deterioration and the need for costly noble-metal electrodes. As a result, reducing the operating temperature below 600 °C is a growing aim.13 Despite several drawbacks, the rapid ionic conduction of δ-Bi2O3 and similar materials means they are regarded as potential electrolytes for use in low-temperature solid oxide fuel cells (LT-SOFCs) and moderate-temperature oxygen sensors. As a result, significant research effort has been directed toward stabilizing δ-Bi2O3 and improving the chemical and structural stabilities of bismuth-based electrolytes.16 Thus, to use Bi2O3 as a solid electrolyte in fuel cells, the high-temperature cubic phase must be stabilized. Due to the comparable charges of Bi3+ and rare-earth doped metals, the use of their composites has been shown to be an appealing solution for this.17 It is widely known that the ionic radius and polarizability of dopants impact the conductivity and stability of bismuth-oxide-based electrolytes, and these two characteristics are linearly connected for the lanthanide dopants that have been studied. Dopants with a smaller ionic radius than Bi3+ (1.17 Å) are commonly employed to stabilize cubic bismuth oxides at room temperature.18,19 Rare earth elements have high chemical stabilities and melting points and high adsorption capacities for other elements. Under harsh conditions, Gd2O3 exhibits strong oxidation resistance, steady chemical activity, and impact resistance.20 As a result, adding 40 wt% Gd2O3 (the ionic radius of Gd3+ is 1.078 Å) to the material can significantly improve its performance.15 Although this substitution stabilizes the fast ionic conducting phase, the increased reactivity and the structural and chemical stabilities under heat cycling and repeated exposure to decreasing oxygen partial pressure are key concerns relating to practical use in SOFCs.21 To address the issue of reduction-induced electrolyte deterioration, the addition of nanofillers, such as CeO2, has been studied.22,23
In the present work, gadolinium-stabilized bismuth oxide (GDB) incorporating different amounts of CeO2 (x), abbreviated as GDBC, is reported. A series of homogeneous samples has been prepared via a direct mixing method and the samples were characterized via SEM, TEM, XRD, FT-IR, and impedance spectroscopy analysis. Electrochemical studies have been done to explore the use of these materials in LT-SOFCs.
2. Experimental section
2.1. Sample fabrication
Pellets of Bi2O3–Gd2O3–CeO2 (GDBC) were fabricated for electrochemical studies via a solid-state reaction. A stoichiometric mixture of Bi2O3 (Fisher Scientific, 99%) and Gd2O3 (SRL, extra pure) with a wt% ratio of 3![[thin space (1/6-em)]](https://www.rsc.org/images/entities/char_2009.gif) :2 was taken and finely ground in an agate mortar in acetone medium for 2 h to obtain a homogeneous mixture. This mixture was then calcined at 800 °C for 10 h in a muffle furnace and allowed to cool down to room temperature, and the final material was ground into fine powder. A series of (1 − x)Bi2O3–Gd2O3:xCeO2 (where 0 ≤ x ≤ 50 wt%) materials was prepared via a solid-state reaction. For the composite material, the required amount of CeO2 (Sigma Aldrich, nanopowder, <25 nm) was added to the parent solid electrolyte and this was then thoroughly ground to a fine powder and kept in a muffle furnace at 800 °C for 8 h; finally, the material was hand-ground and pressed into a cylindrical shape (radius: 0.65 cm, thickness: 0.2 cm) under 5 MPa pressure using a hydraulic press.
:2 was taken and finely ground in an agate mortar in acetone medium for 2 h to obtain a homogeneous mixture. This mixture was then calcined at 800 °C for 10 h in a muffle furnace and allowed to cool down to room temperature, and the final material was ground into fine powder. A series of (1 − x)Bi2O3–Gd2O3:xCeO2 (where 0 ≤ x ≤ 50 wt%) materials was prepared via a solid-state reaction. For the composite material, the required amount of CeO2 (Sigma Aldrich, nanopowder, <25 nm) was added to the parent solid electrolyte and this was then thoroughly ground to a fine powder and kept in a muffle furnace at 800 °C for 8 h; finally, the material was hand-ground and pressed into a cylindrical shape (radius: 0.65 cm, thickness: 0.2 cm) under 5 MPa pressure using a hydraulic press.
2.2. Sample characterization
Microscopic analyses of nanocomposite solid electrolyte pellets were carried out using a JEOL JSM-6510LV scanning electron microscope at an accelerating voltage of 20 kV and using a JEOL JEM-2100 transmission electron microscope. Powder X-ray diffractometry (PXRD) analysis was carried out to analyze the crystal phases of samples using a Shimadzu-6100 powder X-ray diffractometer in a Bragg angle range from 5° to 80° at room temperature using Cu kα radiation (λ = 1.5406 Å). To confirm the formation of composites, Fourier-transform infrared (FT-IR) spectroscopy analysis was carried out using a PerkinElmer spectrometer (version 10.03.09). The thermal stability of the nanocomposites was investigated using TGA/DTA (Shimadzu DTG-60 H) under an inert nitrogen atmosphere from 30 to 800 °C. The density of the solid electrolyte was calculated via the Archimedes method in deionized water.3. Results and discussion
3.1. Characterization of (1 − x)Bi2O3–Gd2O3:xCeO2 nanocomposite solid electrolyte
Fig. 1 depicts typical SEM images of Bi2O3, Gd2O3, CeO2, and Bi2O3–Gd2O3 (GDB), and the Bi2O3–Gd2O3–CeO2 (GDBC) nanocomposite solid electrolyte. Fig. 1(a)–(c) depicts SEM images of pristine Bi2O3, Gd2O3, and CeO2 before calcination. The pristine Bi2O3 sample shows densely packed nanorod bundles (Fig. 1(a)). The particles have sharp edges and angular form, as seen in SEM micrographs. The pristine Gd2O3 sample involves spheroid-like agglomerates with clear-edged boundaries and sizes ranging from approximately 0.6 to 0.7 μm (see Fig. 1b). An SEM image of pristine CeO2 nanoparticles is depicted in Fig. 1(c). Most particles are spherical, but some are elongated in form, and these particles are highly accumulated. However, after calcination, GDB (Fig. 1d) and the final Bi2O3–Gd2O3–CeO2 (Fig. 1e) nanocomposite solid electrolyte have different morphologies than the pristine materials. The surface morphology of 60Bi2O3–Gd2O3:40CeO2 (Fig. 1e) shows that the doped materials (CeO2 and Gd2O3) are clearly embedded into the Bi2O3 matrix, which can also be seen based on the elemental mapping results in Fig. S1 (ESI†). The average grain size of the nanocomposite solid electrolyte was determined using IMAGEJ software. The average grain size of the GDB nanocomposite was found to be 1.61 μm and that of the GDBC nanocomposite solid electrolyte with 40 wt% CeO2 was found to be around 1.4 μm. The density of the GDB nanocomposite was 5.044 g cm−3, whereas the density of the GDBC nanocomposite solid electrolyte with 40 wt% CeO2 was 5.72 g cm−3. TEM observations confirmed the above-mentioned morphological differences. The final Bi2O3–Gd2O3–CeO2 nanocomposites have spherical-like structures with unorganized arrangements. Micrographs depict the consistent arrangement and embedding of CeO2 nanoparticles in the matrix, as shown in Fig. 1(e).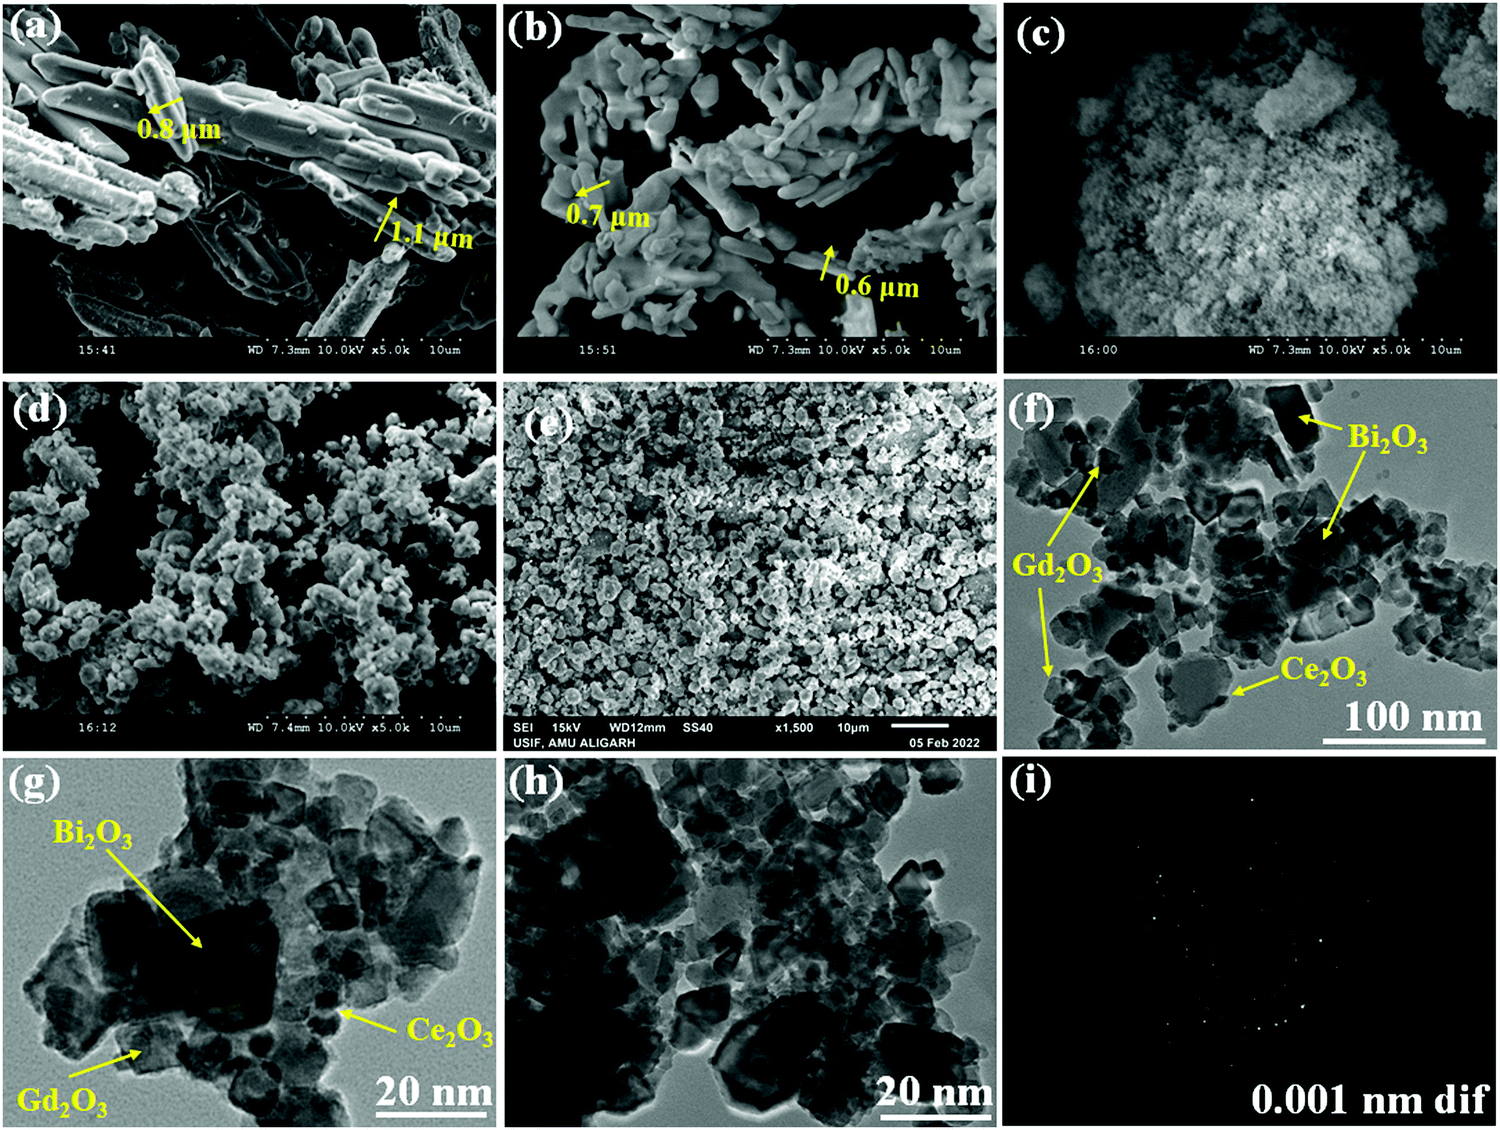 | ||
| Fig. 1 Structures and morphologies of the as-prepared compounds. SEM images of (a) Bi2O3, (b) Gd2O3, (c) CeO2, (d) Bi2O3–Gd2O3, and (e) 60Bi2O3–Gd2O3:40CeO2. (f)–(h) TEM images and (i) the SAED pattern of 60Bi2O3–Gd2O3:40CeO2 nanocomposite solid electrolyte. | ||
GDBC nanocomposite solid electrolyte with 40 wt% CeO2 was analyzed via TEM to understand the structural characteristics and confirm the generation of a nanocomposite material. It can be seen in Fig. 1(f)–(h) that the nanocomposite material comprised the cubic-like structure of δ-Bi2O3 and c-Gd2O3, matching well with the XRD results, and this confirms the formation of the material. The TEM images of 40 wt% CeO2 nanocomposite solid electrolyte illustrated in Fig. 1(f)–(h) reveal the embedded CeO2 nanoparticles on the surface of Bi2O3–Gd2O3, which are in touch with one another. Furthermore, the selected area electron diffraction (SAED) pattern displayed in Fig. 1(i) exhibits concentric rings, indicating the polycrystalline structure of the nanocomposite solid electrolyte.
The spatial distributions of different elements in the GDBC nanocomposite solid electrolyte with 40 wt% CeO2 were investigated via elemental mapping analysis (Fig. S1, ESI†). These images indicate that the Ce, Gd, Bi, and O elements are distributed throughout the entire nanocomposite.
The structural phases and crystallinity of Bi2O3, Gd2O3, CeO2, GDB, and the GDBC nanocomposite solid electrolyte calcined at 800 °C were studied via XRD, and the patterns are depicted in Fig. 2. The diffraction peaks obtained at 2θ values of 27.96° (111), 32.96° (200), 46.36° (220), and 55.15° (311) can be attributed to the planes of cubic δ-Bi2O3 (JCPDS card number: 27-0052).24 The diffraction peaks of Gd2O3 obtained at 2θ values of 20.16° (211), 28.62° (222), 33.26° (400), 47.48° (440), and 56.52° (622) can be attributed to the cubic phase of Gd2O3 (JCPDS card no: 12-0797).25 Furthermore, the CeO2 sample reveals diffraction peaks at 28.56°, 33.44°, 47.87°, 56.50°, and 69.80° which correspond to the (111), (200), (220), (311), and (222) planes, respectively (JCPDS card no: 34-0394).26
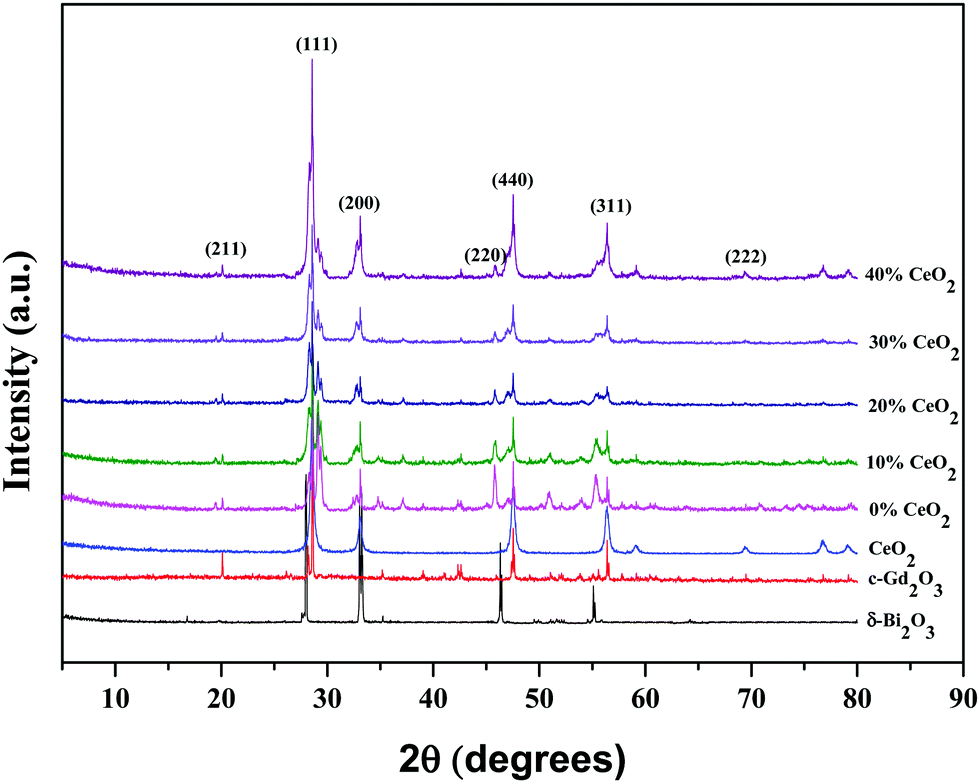 | ||
| Fig. 2 X-ray diffraction patterns of δ-Bi2O3, c-Gd2O3, CeO2, and (1 − x)Bi2O3–Gd2O3:xCeO2 nanocomposite solid electrolyte samples with different wt% levels of CeO2 nanofiller. | ||
Peaks from both δ-Bi2O3 and c-Gd2O3 particles coexist in the GDB material and match well with the JCPDS numbers of the individual components. Diffraction peaks from Bi2O3, Gd2O3, and CeO2 can be clearly seen in the GDBC nanocomposite solid electrolyte patterns, indicating the successful formation of GDBC nanocomposite solid electrolytes. The diffraction peaks of the as-synthesized Bi2O3–Gd2O3–CeO2 nanocomposite solid electrolytes are quite comparable to those of the pure pristine materials, although they are much wider than those of the pristine materials. This suggests that the final products may have a smaller particle size and that their diffraction peaks might overlap.27 Moreover, the main diffraction peak positions of Bi2O3–Gd2O3 and CeO2 are quite similar. It was observed that with an increase in the concentration of CeO2, the intensity of the CeO2(311) diffraction peak also increased simultaneously, while the Bi2O3(220) and (311) peak intensities decreased, indicating that CeO2 has been successfully incorporated into the nanocomposite solid electrolyte.28
FT-IR spectroscopy was used to distinguish the different functional groups of as-synthesized samples. Fig. 3 depicts the FTIR spectra of pure GDB and GDBC nanocomposite solid electrolyte. The absorption peak at 847.13 cm−1 is attributed to Bi–O stretching vibrations.29 The absorption peak at 1040.77 cm−1 is attributed to the bending vibrations of Bi–O bonds.30 The absorption peaks at 1382 cm−1 and 1634.25 cm−1 indicate the existence of carbon–oxygen double-bond stretching vibrations of absorbed CO2.31 The absorption peak at 541.31 cm−1 corresponds to Gd–O vibrations.32 The strong absorption peak at around 476.43 cm−1 is due to O–Ce–O vibrations.33 The broad absorption peak at 3426.31 cm−1 is attributed to the O–H stretching vibrations of water molecules that the nanocomposite solid electrolyte absorbed from surrounding moisture,34 and the peak at 2921.9 cm−1 is attributed to the presence of atmospheric CO2 in the sample.35 All the mentioned peaks confirm the formation of CeO2-embedded Bi2O3–Gd2O3 nanocomposite solid electrolyte.
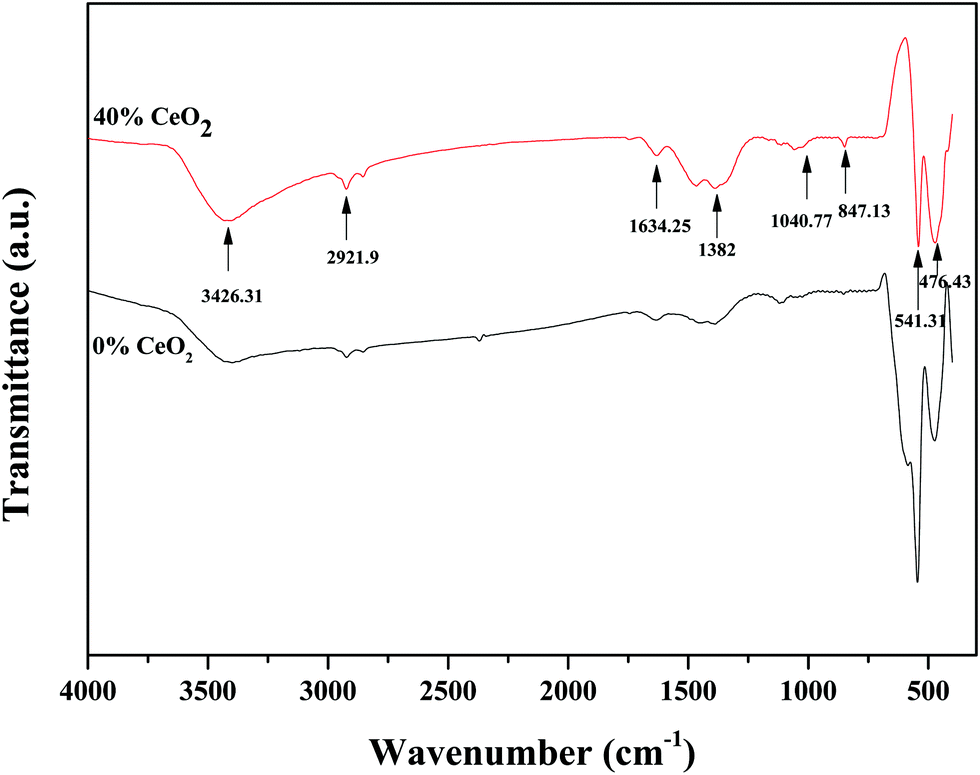 | ||
| Fig. 3 FT-IR spectra of GDB and GDBC nanocomposite solid electrolyte with 40 wt% CeO2. | ||
The thermal stability of the synthesized GDBC nanocomposite solid electrolyte with 40 wt% CeO2 was studied via TGA/DTA under an inert nitrogen atmosphere, which is shown in Fig. S2 (ESI†). Approximately 0.8% weight loss from the nanocomposite is detected before 200 °C, and this is mostly due to the removal of moisture. A further decrease in the TGA curve indicates weight loss of 2% from the nanocomposite material, which is attributed to the removal of lattice water in the temperature range of 300–480 °C.36 As shown in the plot, the sample is stable from 500 °C to 800 °C, as revealed by the small weight loss from the nanocomposite. A strong endothermic peak is observed at 700–750 °C in the DTA curve, which shows a Bi2O3 phase transformation from the α phase to the δ phase.
3.2. Electrochemical characterization of (1 − x)Bi2O3–Gd2O3:xCeO2 nanocomposite solid electrolyte: analysis of impedance spectra and an evaluation of conductivity
Nanocomposite pellets with a thickness of 0.2 cm were used for electrochemical tests. For better electrical connectivity between the sample and electrodes, the pellets were coated with silver paste. AC impedance measurements were carried out using the pellets over a frequency range of 20 Hz–1 MHz at various temperatures under an air atmosphere. The electric and dielectric properties of the samples were also studied using the same instrument.AC complex impedance spectroscopy is a popular non-destructive method for the analysis of the electrical processes and conductive mechanisms related to crystalline materials.37 Cole–Cole plots of (1 − x)Bi2O3–Gd2O3:xCeO2 solid electrolyte samples at 613 K are depicted in Fig. 4. AC complex impedance spectroscopy is a diagnostic tool for separating the contributions of grains, grain boundaries, and the electrode–electrolyte interface.38
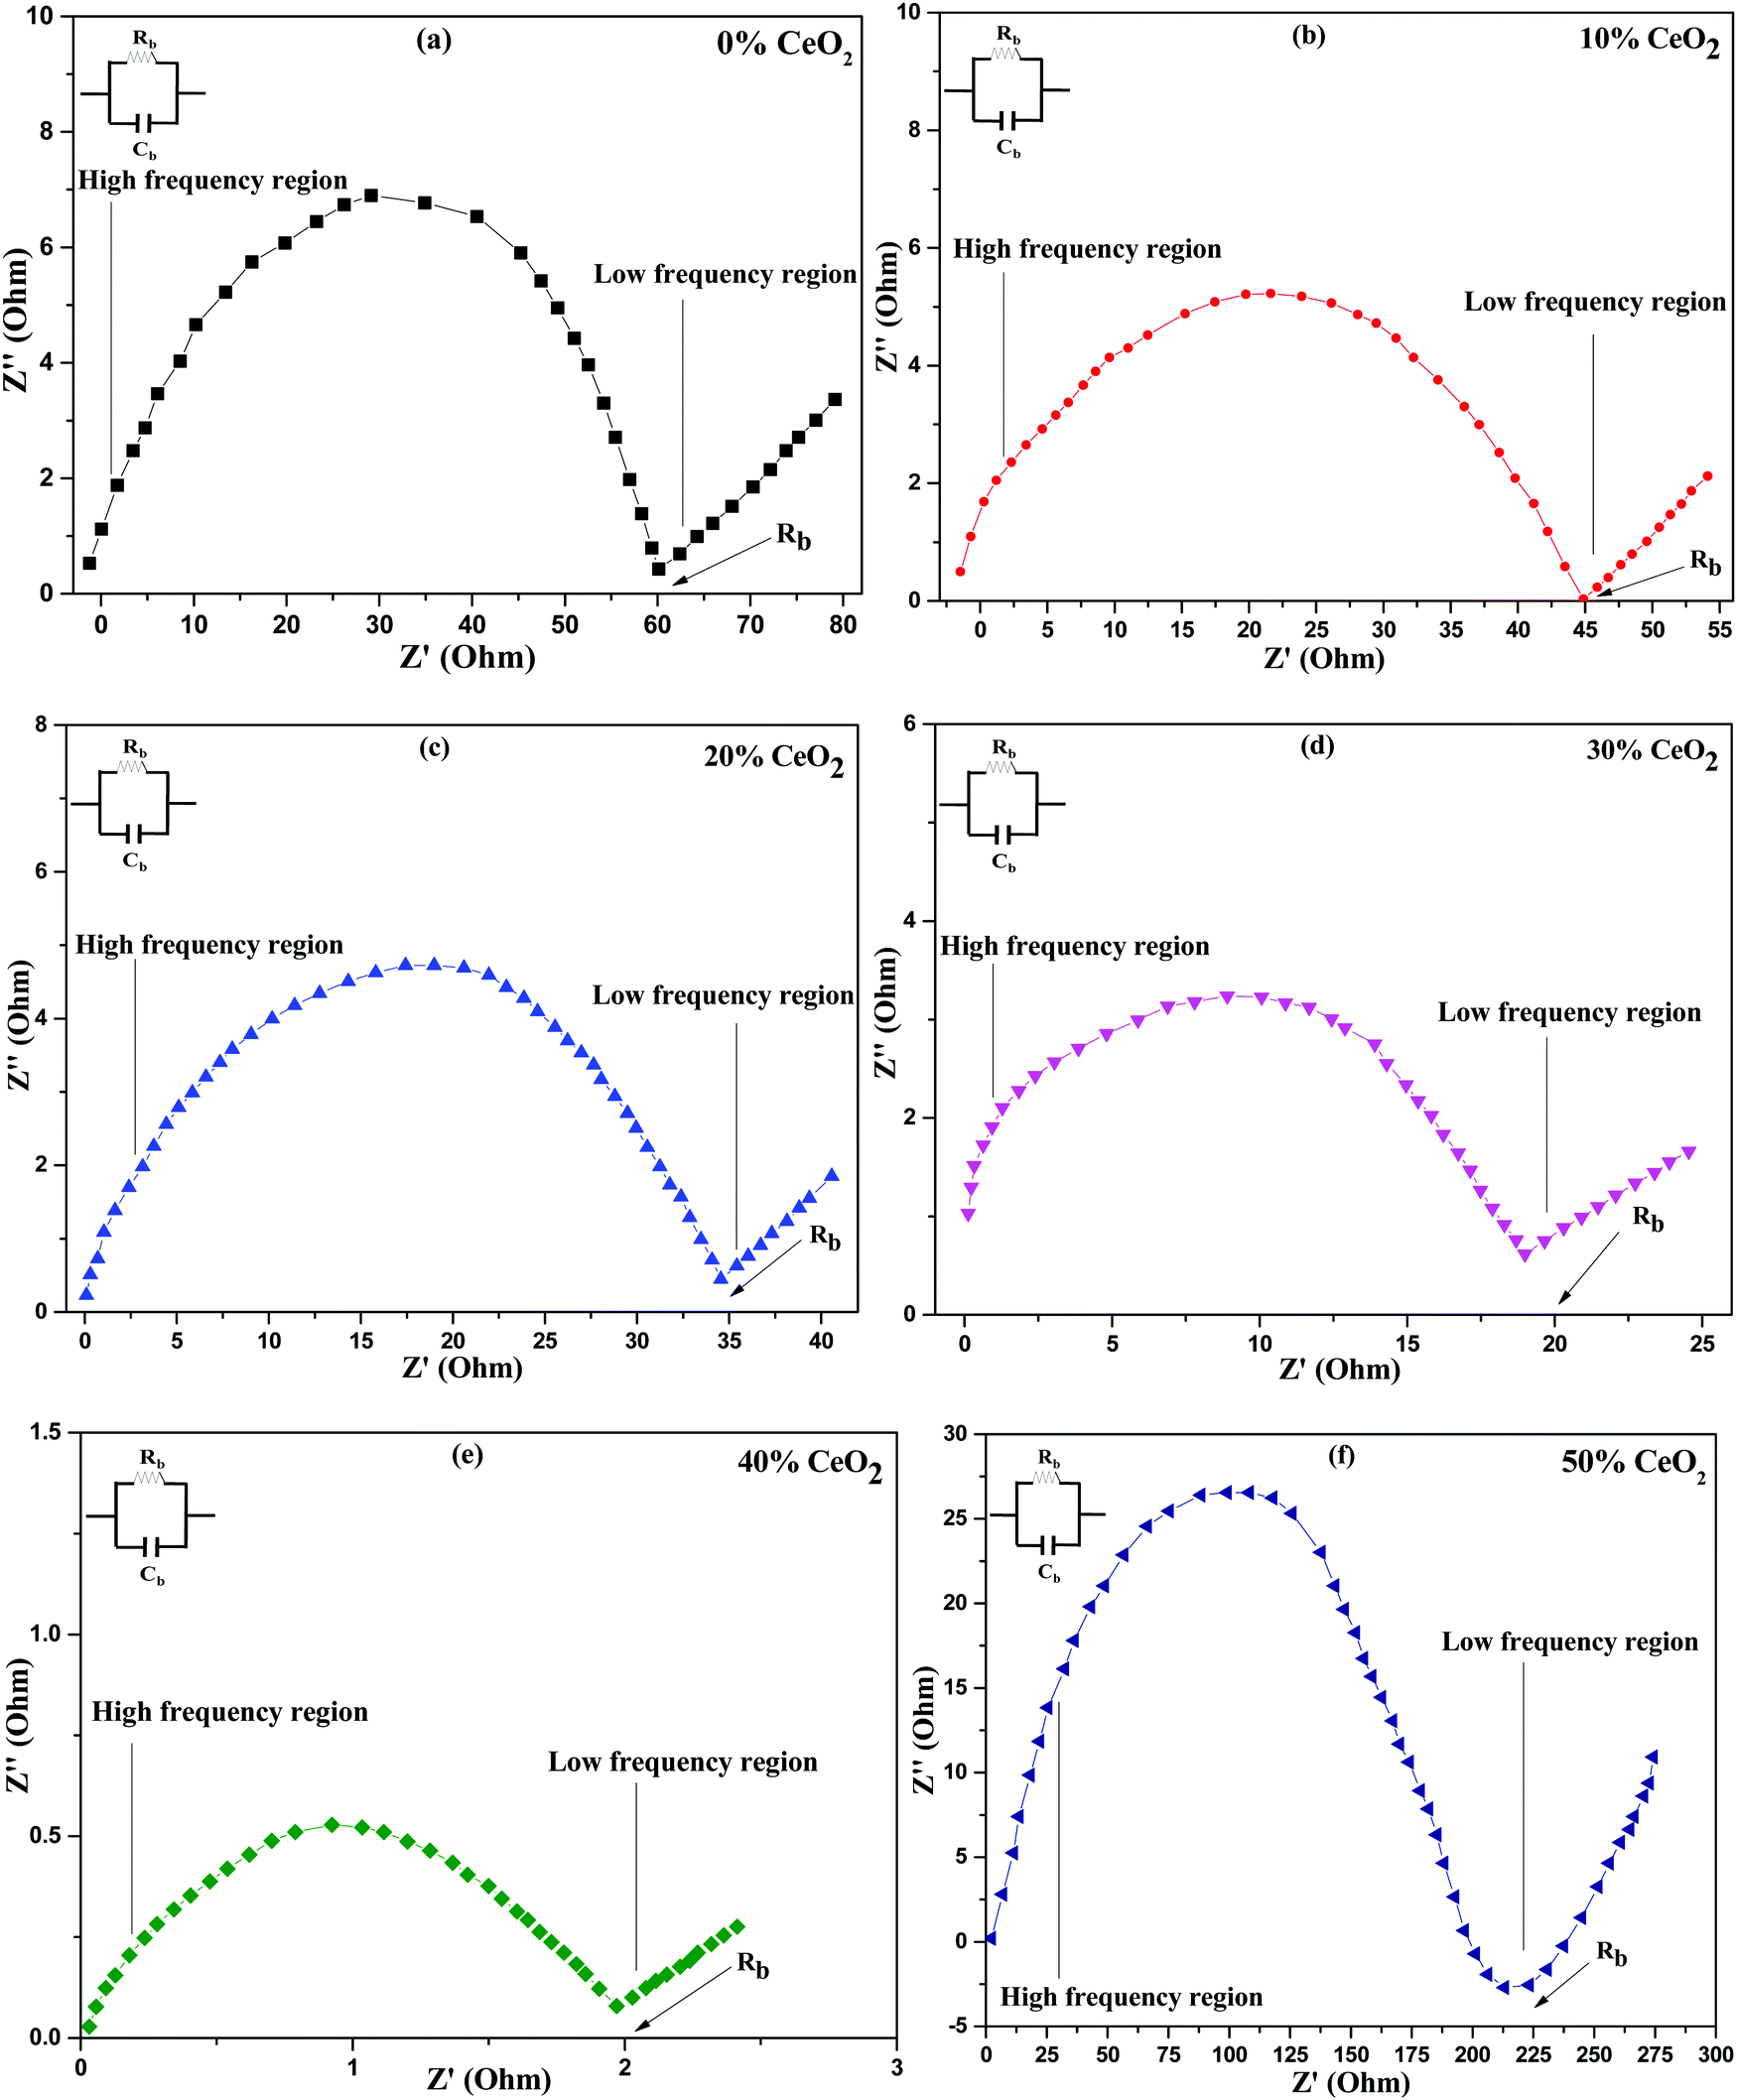 | ||
| Fig. 4 Cole–Cole (complex impedance) spectra of (1 − x)Bi2O3–Gd2O3:xCeO2 nanocomposite solid electrolyte samples with different wt% levels of CeO2 at a temperature of 613 K. | ||
Impedance data are illustrated in the form of imaginary z′′ (capacitive) impedance against real z′ (resistive) impedance. The Cole–Cole plots show typical impedance spectra shapes that consist of a semicircular arc in the higher frequency range, which is attributed to resistive (R) and capacitive (C) components,39 and an inclined spike in the lower frequency range, which is attributed to electrode processes.8,40 The low frequency spike is ascribed to ionic conductivity while the high frequency semicircle is ascribed to the effects of grain boundaries.41
From Fig. 4, it is noted that the radius of the grain boundary arc of the nanocomposite solid electrolyte decreases as the concentration of CeO2 nanofiller is increased. It is found that the radius of the semicircle is minimum for (1 − x)Bi2O3–Gd2O3:xCeO2 when x = 40 wt%, and the radius increases with further increases in the CeO2 content. The reason for this behavior may be an increase in the number of carrier ions and ionic mobility for 40 wt% CeO2, thus leading to a decline in the bulk resistance.42
The ionic conductivities of the nanocomposite materials with various concentrations of CeO2 can be evaluated using the following formula:
| σ = L/(R × S) | (1) |
Conductivity measurements were carried out on all synthesized nanocomposite materials to analyze the nature of conduction in the presence of CeO2 nanofiller. Impedance spectroscopy data is commonly used to calculate conductivity. This approach is preferred because it prevents electrode polarization and allows for the differentiation of grain and grain-boundary contributions to the total resistance, among other benefits.43 The intercept of the semicircle with the real axis in the low frequency domain was used to determine the bulk resistance at all concentrations, as shown in Fig. 4.44 The ionic conductivities of the nanocomposite materials at 613 K are shown in Table 1, where solid electrolyte containing 0 wt% CeO2 has ionic conductivity (σ = 2.52 × 10⁻³ S cm−1) that is comparable to the value for Bi2O3–Gd2O3 reported by T. Takahashi et al.15 However, the conductivity improves upon increasing the CeO2 concentration and reaches a maximum for 40 wt% CeO2 at 613 K (σ = 7.56 × 10⁻² S cm−1). When we compare the aforementioned conductivity values to the nanocomposite solid electrolytes that we have synthesized, i.e., (1 − x)Bi2O3–Gd2O3:xCeO2 with various weight percentages of CeO2, the difference is enormous. This might be owing to the presence of the nanofiller, which can enhance the ionic transport and the motion of constituent components.45 This activity is inhibited at a lower temperature but at a higher temperature the host matrix can expand, increasing the overall mobility of the ions and resulting in higher ionic conductivity.46 The main reasons for using nanofillers are two-fold: (i) to improve the ionic conductivity at low temperatures and (ii) to improve the stability at the electrode–electrolyte interface.47 Because of heterogeneous doping, ions are drawn to the surface of the dispersoid, resulting in a depletion zone with a higher concentration of ion vacancies. This depletion zone is characterized by a highly conducting space-charge layer that runs along the matrix–particle interface.40 This study found that conductivity is directly connected to the concentration of nanofiller, i.e., when the CeO2 wt% increases, the conductivity increases, before passing a threshold value and then decreasing. Defect generation in the interface zone, which is itself a disordered zone, contributes significantly to the high conductivity. The primary role of the nanofiller is to modify ion-ion mobility, which may result in improved ionic transport. This is due to the thermally stimulated process of CeO2 grains creating new empty sites within the parent network.42 However, a decrease in ionic conductivity is observed at CeO2 concentrations greater than 40 wt%. This is because the presence of excess nanofiller in the nanocomposite system can cause ion pairing and aggregation, impeding ionic transport and thus preventing conduction.48 The obtained conductivity value for 40 wt% CeO2 appears to be a maximum of 7.56 × 10⁻² S cm−1 at a more useful temperature of 613 K.
| Sample | σ (S cm−1) |
|---|---|
| 0% CeO2 | 2.52 × 10⁻³ |
| 10% CeO2 | 3.3 × 10⁻³ |
| 20% CeO2 | 4.58 × 10⁻³ |
| 30% CeO2 | 8.4 × 10⁻³ |
| 40% CeO2 | 7.56 × 10⁻² |
| 50% CeO2 | 7.03 × 10⁻⁴ |
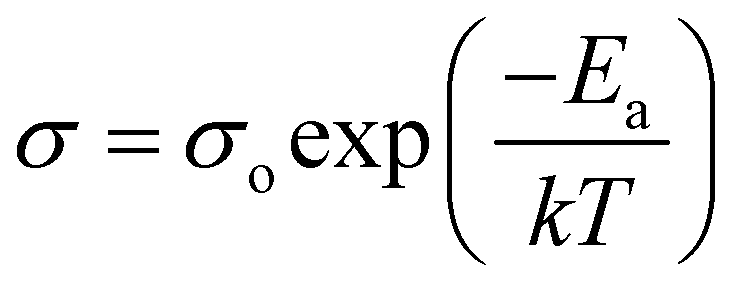
Conductivity and activation energy are two major characteristics used to evaluate electrolyte performance. Conductivity measurements were carried out on all the synthesized nanocomposite materials to analyze the nature of conduction in the presence of CeO2 nanofiller. The conductivities of the nanocomposite solid electrolytes are plotted against the inverse of absolute temperature (T) in Fig. 5. Activation energy is calculated on the assumption that ionic conduction in a solid electrolyte is a thermally stimulated process. In other words, according to an Arrhenius-type equation, the conductivity of an electrolyte tends to increase with an increase in temperature, as follows:43
 | (2) |
 | ||
| Fig. 5 Variation of ionic conductivity as a function of the inverse of temperature for (1 − x)Bi2O3–Gd2O3:xCeO2 nanocomposite solid electrolyte samples with different CeO2 concentrations. | ||
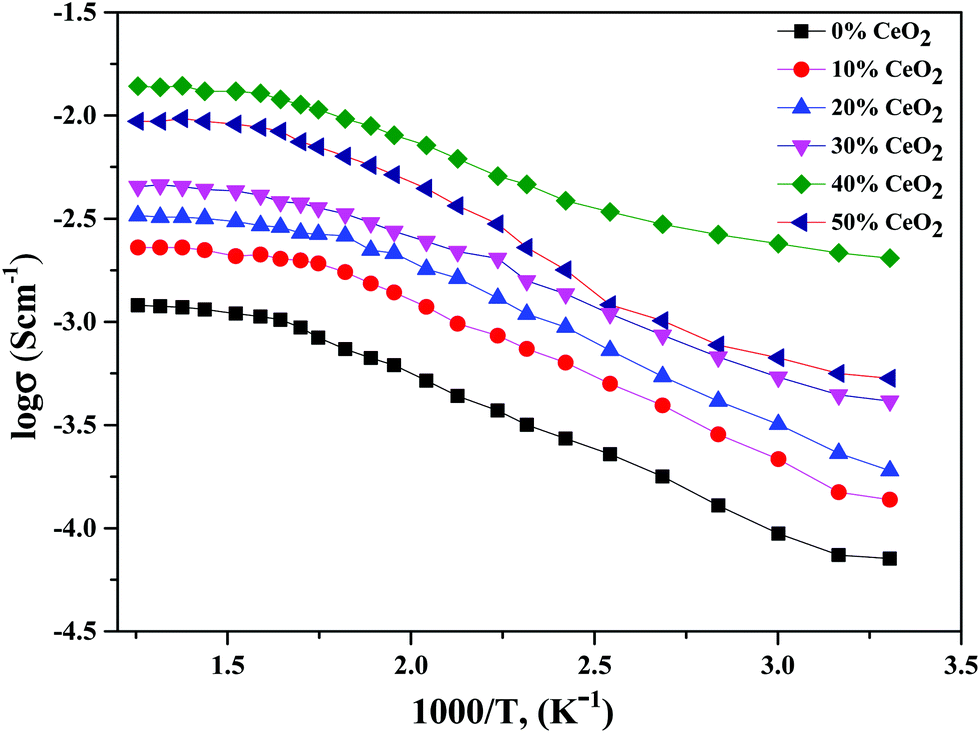
Using eqn (2), we can determine Ea based on the regression method across the entire temperature range, and the values of Ea for different wt% levels of CeO2 nanofiller are shown in Fig. 6. The activation energy decreases from 0.1334 to 0.0954 eV as the CeO2 nanofiller content increases from 10 to 40 wt%. Then the activation energy increases with increasing CeO2 content, attaining a value of 0.1444 eV for 50 wt% CeO2. The lowest activation energy is exhibited by the 40 wt% CeO2 nanocomposite solid electrolyte: 0.0954 eV. Thus, it can be inferred that ions require only 0.0954 eV of energy to migrate from one site to another, indicating that the ions in the nanocomposite solid electrolyte sample are highly mobile.
 | ||
| Fig. 6 Variation of the activation energy of (1 − x)Bi2O3–Gd2O3:xCeO2 nanocomposite solid electrolyte as a function of CeO2 wt%. | ||
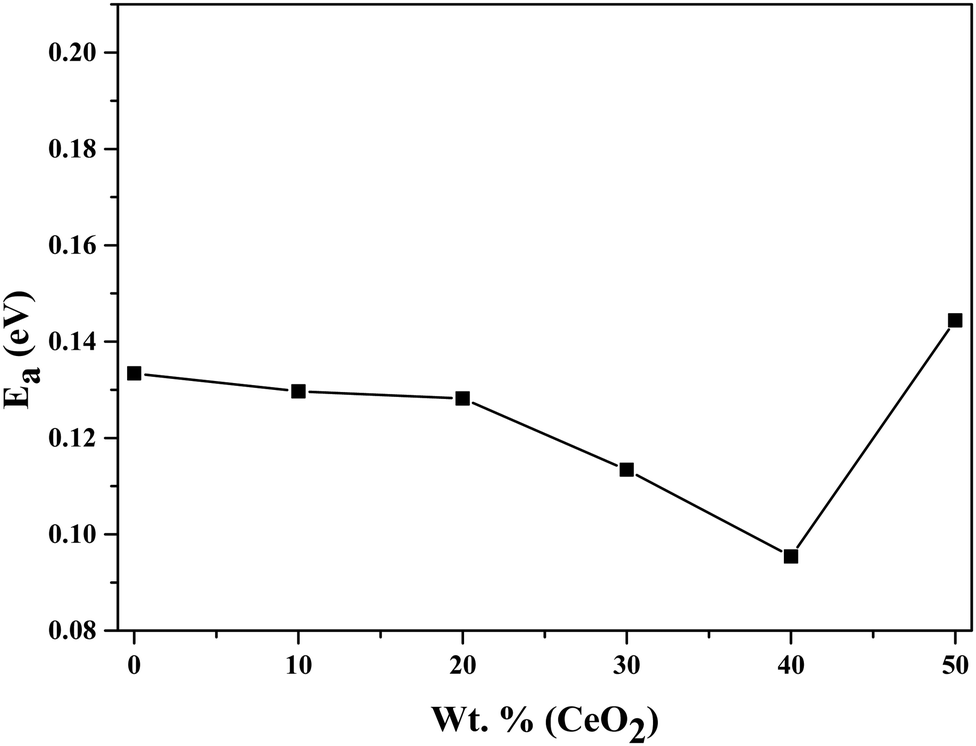
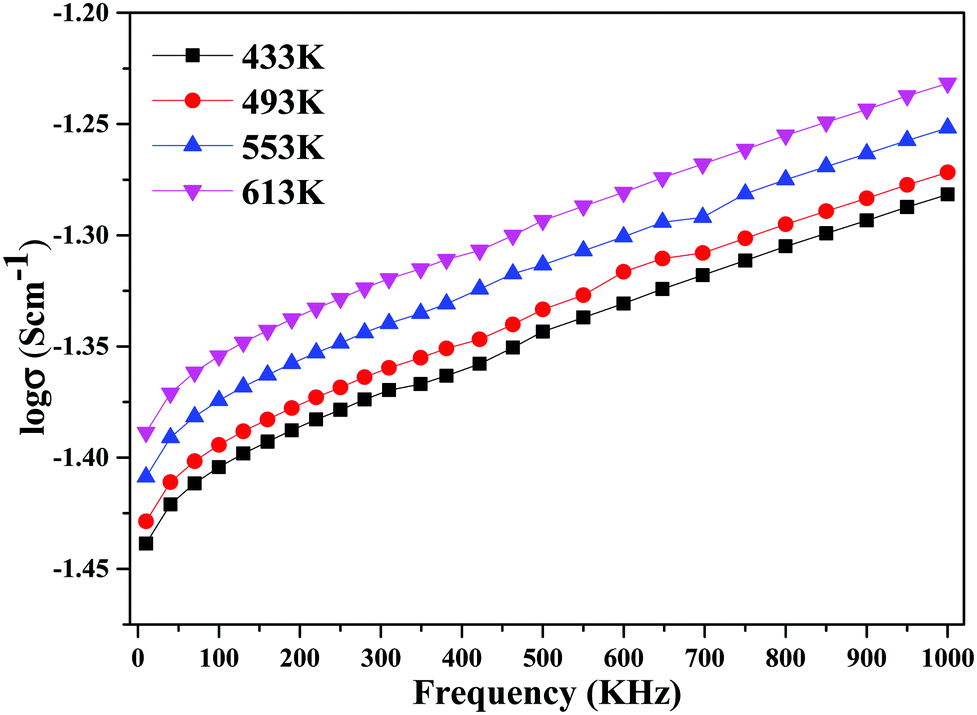
The decline in ionic conductivity above 40 wt% can also be seen in Fig. 7, which depicts the nanocomposite solid electrolyte ionic conductivity at various temperatures as a function of CeO2 wt%. Fig. 8 displays the frequency dependence of conductivity (σ) for 40 wt% CeO2 doped Bi2O3–Gd2O3 nanocomposite solid electrolyte at various temperatures. Each curve has a low frequency plateau corresponding to the bulk material DC conductivity and a high frequency dispersive portion corresponding to its AC conductivity. The conductivity plots exhibit dispersion, which shifts to a higher frequency as the temperature rises. This behavior implies that ionic conduction in the nanocomposite material proceeds via a hopping process, as described by the Jonscher universal power law.49,50Fig. 8 shows that σdc drops with a decrease in frequency and tends to become frequency independent below a specific value.
 | ||
| Fig. 7 Ionic conductivities for (1 − x)Bi2O3–Gd2O3:xCeO2 nanocomposite solid electrolyte samples as a function of CeO2 wt% at different temperatures. | ||
 | ||
| Fig. 8 Variation of ionic conductivity as a function of frequency for (1 − x)Bi2O3–Gd2O3:xCeO2 nanocomposite solid electrolyte with 40 wt% CeO2. | ||
3.3. Dielectric properties of (1 − x)Bi2O3–Gd2O3:xCeO2 nanocomposite solid electrolyte
For integrated circuits and sophisticated packaging technologies, the dielectric constant is an essential observable component affecting the design of capacitors, resistors, transformers, and inductors.51The frequency-dependent real part of the dielectric constant (ε′) can be calculated using the following equation:
 | (3) |
The imaginary part of the dielectric constant (ε′′) can be calculated via the following equation:
| ε′′ = ε′tanδ | (4) |
δ is the dielectric loss tangent.53
Real and imaginary dielectric constant and dielectric loss values for the selected compositions at various frequencies at a temperature of 613 K are shown in Fig. 9. It is shown that all samples had a high dielectric constant at low frequencies; this dropped as the frequency increased, eventually reaching saturation at higher frequencies. The values of the dielectric constant (real and imaginary parts) improved upon increasing the CeO2 nanofiller content, reaching a maximum at 40 wt% CeO2. Following that, when the concentration of CeO2 was increased further (50 wt% CeO2), the dielectric constant value fell because mobile oxide ions are unable to travel quickly due to obstruction from conduction channels. The slow movement of ions at a CeO2 concentration of 50 wt% results in a low dielectric constant value due to reduced conduction-related polarization.52
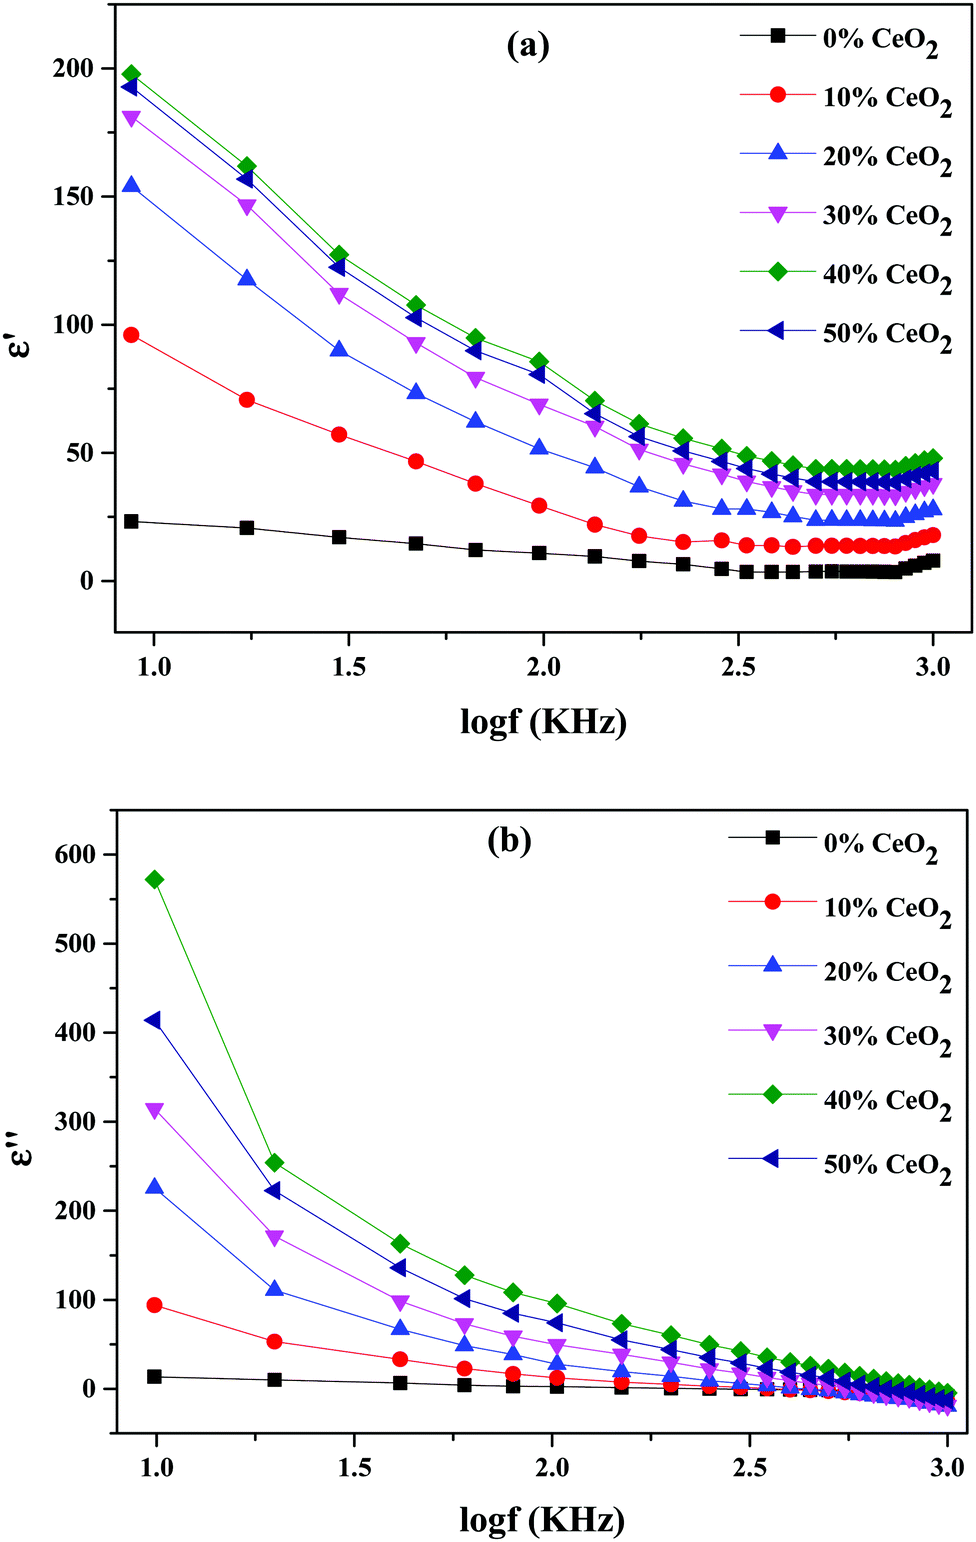 | ||
| Fig. 9 Variations of (a) the real part of the dielectric constant and (b) the imaginary part of the dielectric constant for (1 − x)Bi2O3–Gd2O3:xCeO2 nanocomposite solid electrolyte samples with different CeO2 concentration levels. | ||
At lower frequencies, the high dielectric constants for all wt% ratios of CeO2 nanofiller could be linked to a buildup of charge at the sample-electrode interface, which is known as space charge polarization, or it might be due to interfacial polarization, as predicted by Maxwell–Wagner theory. This is characteristic of ion-conducting materials.53
Fig. 10 depicts the frequency-dependent tangent loss (tanδ) of nanocomposite materials with different amounts of CeO2 at 613 K. The dielectric loss is the amount of energy lost in a dielectric material. It is shown that the value of tanδ progressively decreases as the frequency increases. The high value of tanδ at low frequency can be related to conductivity relaxation or it may be ascribed to free charge mobility in the material.54
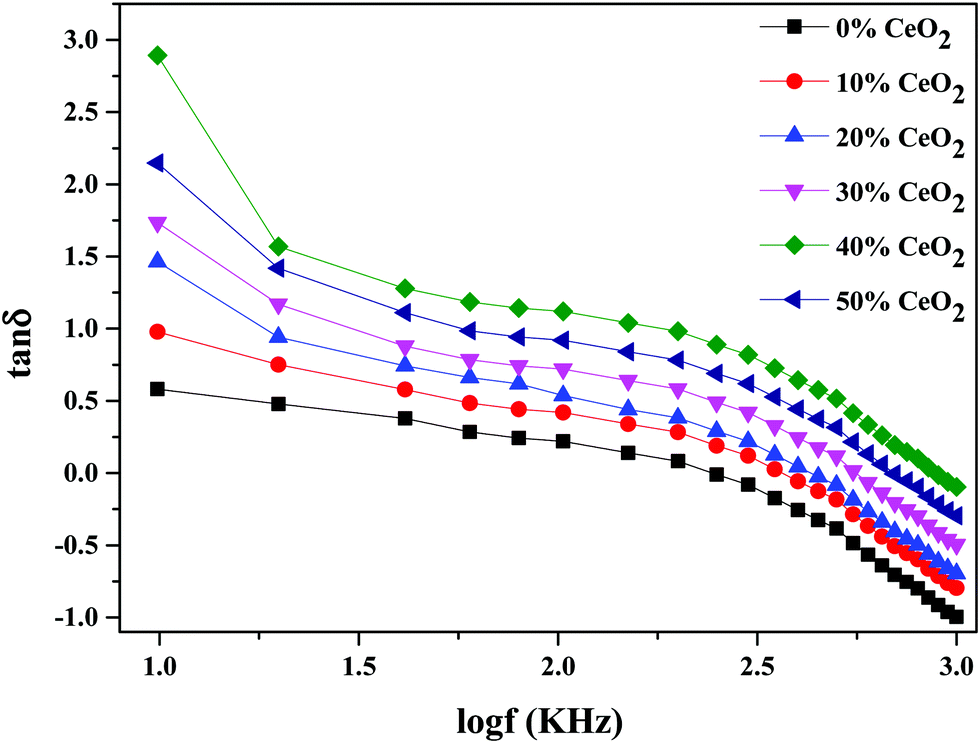 | ||
| Fig. 10 The variation of dielectric loss as a function of frequency for (1 − x)Bi2O3–Gd2O3:xCeO2 nanocomposite solid electrolyte with different amounts of CeO2 nanofiller. | ||
The temperature dependence of the dielectric constant at 1 MHz for (1 − x)Bi2O3–Gd2O3:xCeO2 nanocomposite solid electrolyte samples is shown in Fig. 11. It is observed that the dielectric constant increases with an increase in temperature for all compositions. This could be due to an increase in oxide-ion mobility through the solid electrolyte, which is thermally activated.55
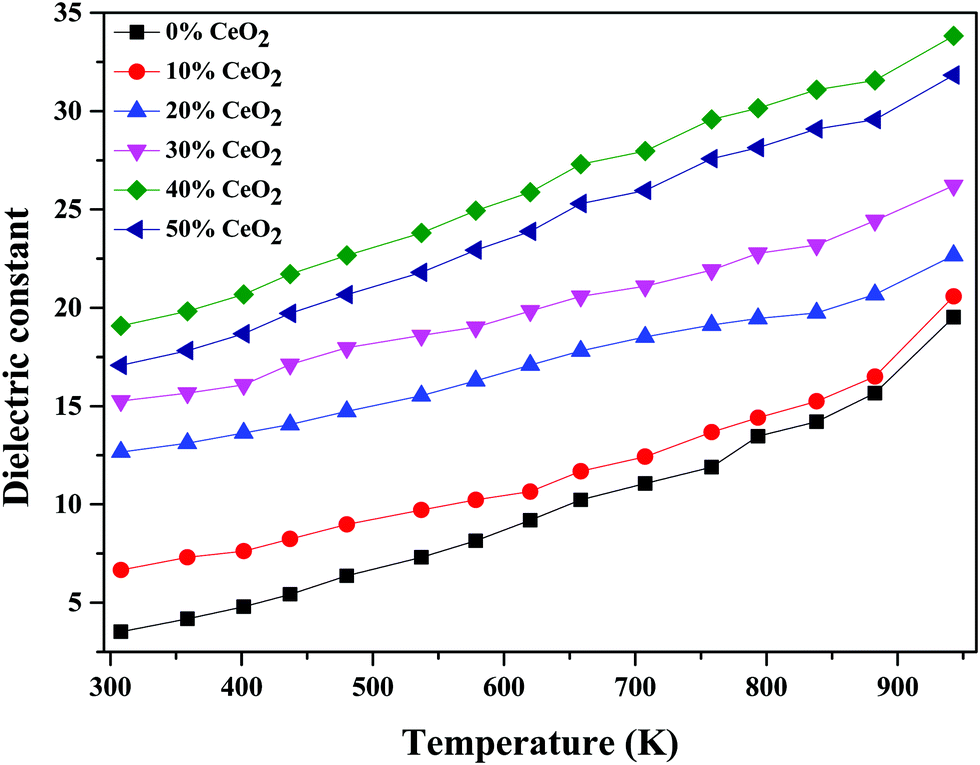 | ||
| Fig. 11 Temperature-dependent dielectric constant values of (1 − x)Bi2O3–Gd2O3:xCeO2 nanocomposite solid electrolyte samples with different CeO2 concentrations at 1 MHz. | ||
The highest dielectric constant values are observed for the 40 wt% CeO2 composition over the entire temperature range studied. This increase in dielectric constant value can be attributed to the concept of dielectric polarization. At lower temperature, charge carriers cannot always follow the applied field direction, resulting in a weak contribution to polarization and dielectric behavior. As the temperature increases, the charge carriers become excited and have adequate energy to raise the dielectric constant.56
As seen in Fig. 12, the dielectric constant decreases with an increase in frequency due to the low polarization. The high dielectric constant values might be due to space-charge polarization caused by ionic transport and structural distortion in the material.57
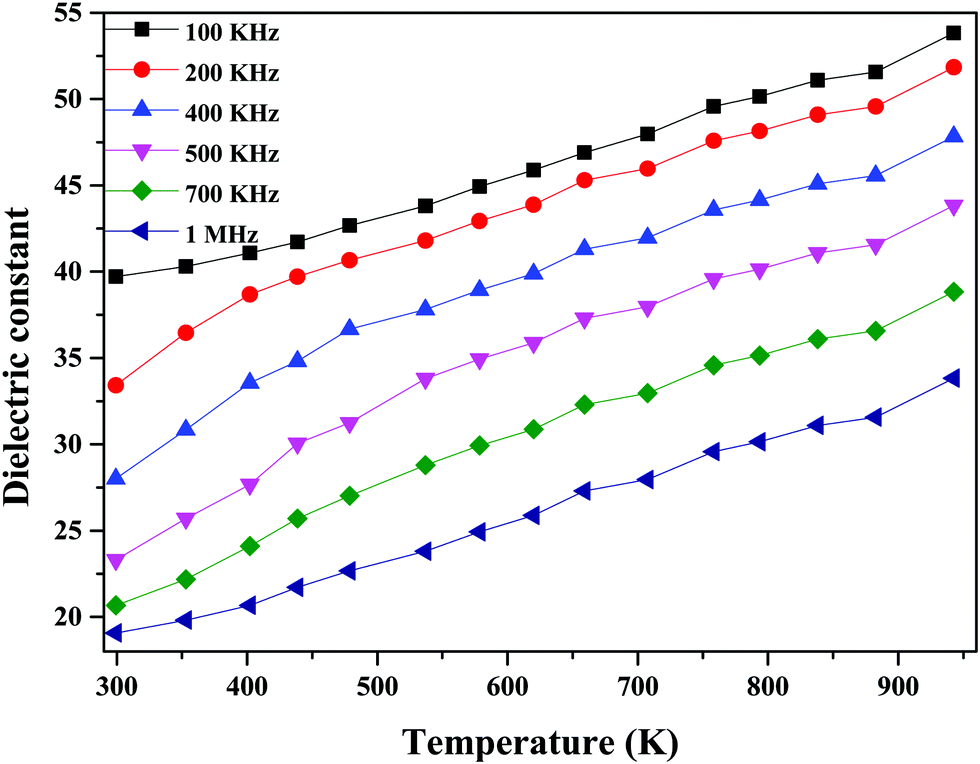 | ||
| Fig. 12 Dielectric constant values at different frequencies as a function of temperature for 60Bi2O3–Gd2O3:40CeO2 nanocomposite solid electrolyte. | ||
The material dielectric properties have a direct relationship with the AC conductivity, as follows:
| σAC = 2πfεoε′′ | (5) |
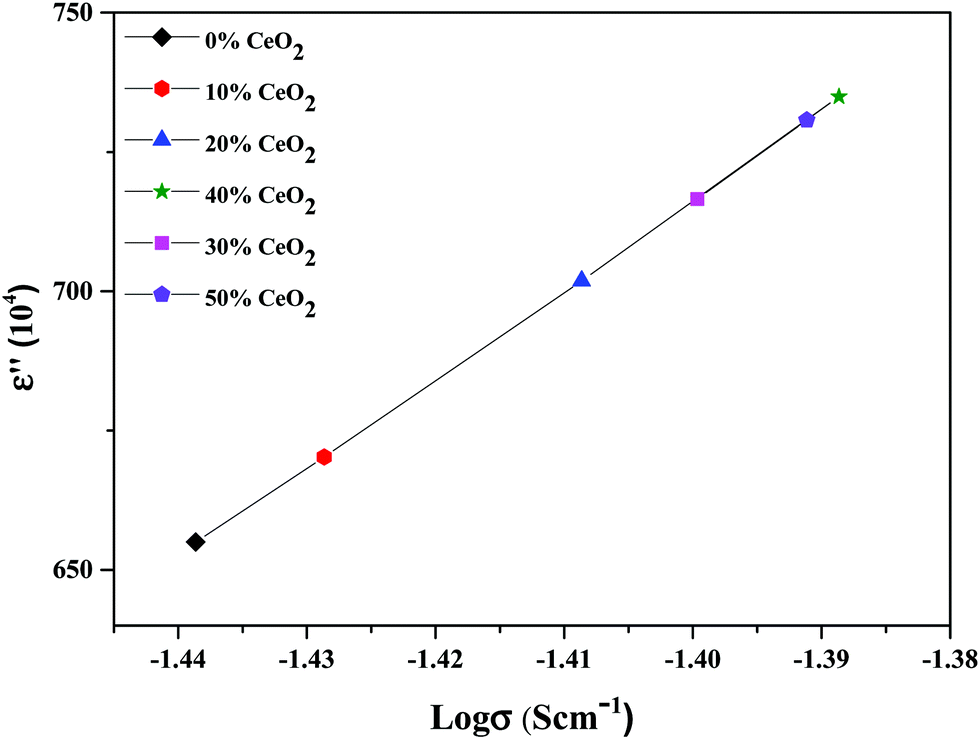 | ||
| Fig. 13 Variation of the dielectric constant as a function of conductivity for (1 − x)Bi2O3–Gd2O3:xCeO2 nanocomposite solid electrolyte samples with different amounts of CeO2 nanofiller at 10 kHz. | ||
The long-term stability of the ionic conductivity of GDBC nanocomposite solid electrolyte with 40 wt% CeO2 was tested at 613 K using EIS in an open circuit under an air atmosphere, and the results are shown in Fig. 14 as a function of time. While the initial conductivity was marginally reduced during the first 23 h, high ionic conductivity was maintained for more than 100 h without any detectable deterioration, confirming the great stability.
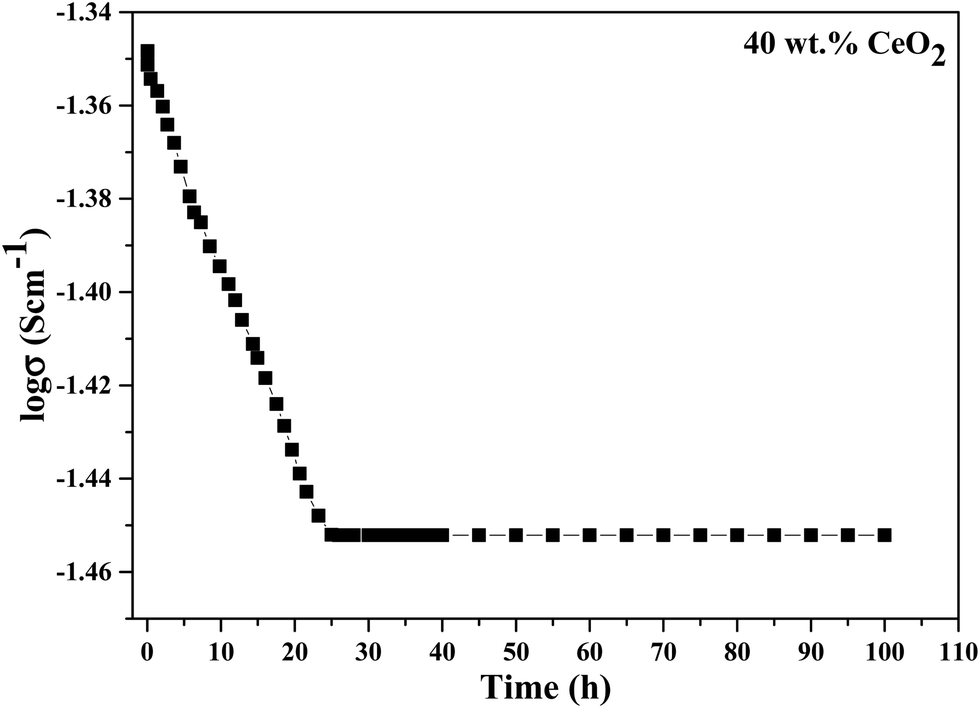 | ||
| Fig. 14 Long-term stability testing of the conductivity of GDBC nanocomposite solid electrolyte with 40 wt% CeO2. | ||
4. Conclusions
A simple and low-cost approach for fabricating (1 − x)Bi2O3–Gd2O3:xCeO2 nanocomposite solid electrolyte samples using a solid-state method followed by optimum thermal treatment at 800 °C was developed, and the resulting nanocomposite samples were characterized via SEM, TEM, XRD, and FT-IR analysis. The ionic conductivity increases significantly upon CeO2 addition and reaches a maximum value of σ = 7.56 × 10⁻² S cm−1 for 60(Bi2O3–Gd2O3):40CeO2 nanocomposite solid electrolyte with 40 wt% CeO2 nanofiller at 613 K. The enhancement in conductivity is mostly ascribed to increased mobility as a result of structural modifications caused by compositional changes. The activation energy of the most highly conducting sample (40 wt% CeO2 nanofiller) was found to be 0.0954 eV. Impedance studies reveal the significant role of grain effects on the conduction process. The dielectric constant and dielectric loss values are found to increase with a decrease in the applied frequency and they increase with increasing temperature. The improved electrical and dielectric properties of the synthesized nanocomposite solid electrolyte could further strengthen the practical use of bismuth-based materials in high-performance low-temperature SOFCs.Author contributions
Abjana Parbin designed the study, conceptualized the ideas, and carried out experimental analysis and the write-up of the scientific findings. Prof. Rafiuddin supervised the writing (review and editing) of this work. Both authors discussed the results and contributed to the final manuscript.Conflicts of interest
There are no conflicts to declare.Acknowledgements
The authors are highly obliged to the Chairman, Department of Chemistry, AMU Aligarh for providing research facilities. We express our gratitude to the Departmental Instrumentation facility for XRD and FT-IR assistance. We are also thankful to the USIF, AMU for SEM and TEM facilities. The authors also acknowledge UGC for providing financial assistance.References
- P. Simon and Y. Gogotsi, Nat. Mater., 2008, 7, 320–329 CrossRef PubMed.
- F. Zhu, H. Bao, X. Wu, Y. Tao, C. Qin, Z. Su and Z. Kang, ACS Appl. Mater. Interfaces, 2019, 11, 43206–43213 CrossRef CAS PubMed.
- M. Lechartier, L. Porcarelli, H. Zhu, M. Forsyth, A. Guéguen, L. Castro and D. Mecerreyes, Mater. Adv., 2022, 3, 1139–1151 RSC.
- M. Armand and J.-M. Tarascon, Nature, 2008, 451, 652–657 CrossRef CAS PubMed.
- C. Hu, Y. Shen, M. Shen, X. Liu, H. Chen, C. Liu, T. Kang, F. Jin, L. Li, J. Li, Y. Li, N. Zhao, X. Guo, W. Lu, B. Hu and L. Chen, J. Am. Chem. Soc., 2020, 142, 18035–18041 CrossRef CAS PubMed.
- Y. Kato, S. Hori, T. Saito, K. Suzuki, M. Hirayama, A. Mitsui, M. Yonemura, H. Iba and R. Kanno, Nat. Energy, 2016, 1, 1–7 Search PubMed.
- I. Garagounis, V. Kyriakou, C. Anagnostou, V. Bourganis, I. Papachristou and M. Stoukides, Ind. Eng. Chem. Res., 2011, 50, 431–472 CrossRef CAS.
- Y. Liu, L. Fan, Y. Cai, W. Zhang, B. Wang and B. Zhu, ACS Appl. Mater. Interfaces, 2017, 9, 23614–23623 CrossRef CAS PubMed.
- P. I. Cowin, C. T. G. Petit, R. Lan, J. T. S. Irvine and S. Tao, Adv. Energy Mater., 2011, 1, 314–332 CrossRef CAS.
- D. W. Joh, J. H. Park, D. Y. Kim, B.-H. Yun and K. T. Lee, J. Power Sources, 2016, 320, 267–273 CrossRef CAS.
- Q. L. Liu, S. H. Chan, C. J. Fu and G. Pasciak, Electrochem. Commun., 2009, 11, 871–874 CrossRef CAS.
- V. Gil, C. Moure, P. Durán and J. Tartaj, Solid State Ionics, 2007, 178, 359–365 CrossRef CAS.
- N. Jaiswal, B. Gupta, D. Kumar and O. Parkash, J. Alloys Compd., 2015, 633, 174–182 CrossRef CAS.
- T. Tunc, I. Uslu, S. Durmusoglu, S. Keskin, A. Aytimur and A. Akdemir, J. Inorg. Organomet. Polym., 2012, 22, 105–111 CrossRef CAS.
- T. Takahashi, T. Esaka and H. Iwahara, J. Appl. Electrochem., 1975, 5, 197–202 CrossRef CAS.
- N. M. Sammes, G. A. Tompsett, H. Nafe and F. Aldinger, J. Eur. Ceram. Soc., 1999, 19, 1801–1826 CrossRef CAS.
- M. Drache, P. Roussel and J.-P. Wignacourt, Chem. Rev., 2007, 107, 80–96 CrossRef CAS PubMed.
- E. D. Wachsman, S. Boyapati and N. Jiang, Ionics, 2001, 7, 1–6 CrossRef CAS.
- D. W. Jung, K. T. Lee and E. D. Wachsman, J. Electrochem. Soc., 2016, 163, F411–F415 CrossRef CAS.
- P.-H. Gao, S.-C. Zeng, C. Jin, B. Zhang, B.-Y. Chen, Z. Yang, Y.-C. Guo, M.-X. Liang, J.-P. Li, Q.-P. Li, Y.-Q. Lu, L. Jia and D. Zhao, Materials, 2021, 14(1–15), 7470 CrossRef CAS PubMed.
- K. Vasundhara, S. N. Achary, S. J. Patwe, A. K. Sahu, N. Manoj and A. K. Tyagi, J. Alloys Compd., 2014, 596, 151–157 CrossRef CAS.
- E. D. Wachsman and K. L. Duncan, Electrochem. Soc., 1999, 19, 264–274 Search PubMed.
- J.-Y. Park and E. D. Wachsman, Ionics, 2006, 12, 15–20 CrossRef CAS.
- X. Gao, Y. Shang, L. Liu and K. Gao, J. Alloys Compd., 2019, 803, 565–575 CrossRef CAS.
- S. Majeed and S. A. Shivashankar, J. Mater. Chem. C, 2014, 2, 2965–2974 RSC.
- Z. Wang, H. Du, Z. Liu, H. Wang, A. M. Asiri and X. Sun, Nanoscale, 2018, 10, 2213–2217 RSC.
- Q. He, Y. Ni and S. Ye, RSC Adv., 2017, 7, 27089–27099 RSC.
- M. S. Athar, M. Danish and M. Muneer, J. Environ. Chem. Eng., 2021, 9, 105754 CrossRef CAS.
- S. S. Raut, O. Bisen and B. R. Sankapal, Ionics, 2017, 23, 1831–1837 CrossRef CAS.
- N. Zeeshan and Rafiuddin, Measurement, 2019, 138, 1–7 CrossRef.
- S. Cui, R. Li, C. Zhu, J. Pei and Y. Wen, Sep. Purif. Technol., 2020, 239, 116520 CrossRef CAS.
- F. Chen, X. H. Zhang, X. D. Hu, W. Zhang, R. Zeng, P. D. Liu and H. Q. Zhang, J. Alloys Compd., 2016, 664, 311–316 CrossRef CAS.
- M. S. Pujar, S. M. Hunagund, V. R. Desai, S. Patil and A. H. Sidarai, AIP Conf. Proc., 2018, 1942, 050026 CrossRef.
- S. Imteyaz and Rafiuddin, RSC Adv., 2015, 5, 96008 RSC.
- Y. A. S. Khadar, A. Balamurugan, V. P. Devarajan and R. Subramanian, Orient. J. Chem., 2017, 33, 2405–2411 CrossRef CAS.
- S. Imteyaz and Rafiuddin, J. Mol. Struct., 2016, 1123, 116–123 CrossRef CAS.
- E. Radvanyi, K. V. Havenbergh, W. Porcher, S. Jouanneaua, J.-S. Bridel, S. Put and S. Franger, Electrochim. Acta, 2014, 137, 751–757 CrossRef CAS.
- S. Sultana and Rafiuddin, J. Alloys Compd., 2011, 509, 9842–9848 CrossRef CAS.
- A. R. C. Bredar, A. L. Chown, A. R. Burton and B. H. Farnum, ACS Appl. Energy Mater., 2020, 3, 66–98 CrossRef CAS.
- M. Z. Iqbal and Rafiuddin, Ceram. Int., 2015, 41, 13650–13657 CrossRef CAS.
- D. C. Onwudiwe, T. Arfin and C. A. Strydom, Electrochim. Acta, 2014, 127, 283–289 CrossRef CAS.
- P. Sharma, D. K. Kanchan, M. Pant, M. S. Jayswal and N. Gondaliya, New J. Glass Ceram., 2011, 1, 112–118 CrossRef CAS.
- J. A. Dias, S. H. Santagneli and Y. Messaddeq, J. Phys. Chem., 2020, 124(49), 26518–26539 CAS.
- N. Gondaliya, D. K. Kanchan, P. Sharma and M. S. Jayswal, Polym. Compos., 2012, 33, 2195–2200 CrossRef CAS.
- Y. L. Yap, A. H. You, L. L. Teo and H. Hanapei, Int. J. Electrochem. Sci., 2013, 8, 2154–2163 CAS.
- M. L. Verma, M. Minakshi and N. K. Singh, Ind. Eng. Chem. Res., 2014, 53, 14993–15001 CrossRef CAS.
- A. M. Stephan, Eur. Polym. J., 2006, 42, 21–42 CrossRef.
- S. I. Wani and Rafiuddin, Electrochim. Acta, 2020, 342, 136097 CrossRef CAS.
- M. Thambidurai, N. Muthukumarasamy, D. Velauthapillai, S. Agilan and R. Balasundaraprabhu, Powder Technol., 2012, 217, 1–6 CrossRef CAS.
- B. P. Dubey, A. Vinodhkumar, A. Sahoo, V. Thangadurai and Y. Sharma, ACS Appl. Energy Mater., 2021, 4, 5475–5485 CrossRef CAS.
- H.-M. Li, C.-H. Ra, G. Zhang and W. J. Yoo, J. Korean Phys. Soc., 2009, 54, 1096–1099 CrossRef CAS.
- M. Z. Iqbal and Rafiuddin, Measurement, 2016, 81, 102–112 CrossRef.
- D. M. Abdel-Basset, S. Mulmi, M. S. El-Bana, S. S. Fouad and V. Thangadurai, Inorg. Chem., 2017, 56, 8865–8877 CrossRef CAS PubMed.
- M. Ram, Physica B, 2010, 405, 1359–1361 CrossRef CAS.
- N. S. Salami and S. Beg, J. Alloys Compd., 2014, 586, 302–307 CrossRef.
- R. Ahmed, A. S. M. Moslehuddin, Z. H. Mahmood and A. K. M. A. Hossain, Mater. Res. Bull., 2015, 63, 32–40 CrossRef CAS.
- D. Maurya, J. Kumar and Shripal, J. Phys. Chem. Solids, 2005, 66, 1614–1620 CrossRef CAS.
- G. C. Psarras, E. Manolakaki and G. M. Tsangaris, Composites, Part A, 2002, 33, 375–384 CrossRef.
Footnote |
| † Electronic supplementary information (ESI) available. See DOI: 10.1039/d1ma01254a |
| This journal is © The Royal Society of Chemistry 2022 |