 Open Access Article
Strong and pure red-emitting Eu3+-doped phosphor with excellent thermal stability for warm WLEDs†
Liang
Zhang
ab,
Yonghui
Xu
ab,
Xiudi
Wu
ab,
Shuwen
Yin
a and
Hongpeng
You
 *abc
*abc
aState Key Laboratory of Rare Earth Resource Utilization, Changchun Institute of Applied Chemistry, Chinese Academy of Sciences, Changchun 130022, P. R. China. E-mail: hpyou@ciac.ac.cn; Fax: +86 431 85698041
bUniversity of Science and Technology of China, Hefei 230026, P. R. China
cGanjiang Innovation Academy, Chinese Academy of Sciences, Ganzhou 341000, China
First published on 4th February 2022
Abstract
Red-emitting phosphor, as an indispensable part of high-quality white-light-emitting diodes (WLEDs), has received extensive research attention. A red-emitting Eu3+-doped LiYO2 phosphor with excellent luminescence properties was prepared by solid phase reaction. Under the optimal excitation of 395 nm, the specimens displayed strong and pure red emission, the optimal doping concentration and color purity were 0.20 and as high as 98.9%, and the dipole–dipole interaction was found to be responsible for concentration quenching. According to crystallographic structure and Judd–Ofelt theory analysis, the Eu3+ ions were located at a low symmetry site, thereby obtaining a high bright red emission. Furthermore, the obtained LiYO2:0.20Eu3+ sample possesses outstanding emission thermal stability. Finally, a packaged WLED device based on a LiYO2:0.20Eu3+ phosphor with excellent performance was obtained. These results indicate that the as-prepared phosphor has potential for high-quality lighting applications.
Introduction
Today, the world energy shortage has become increasingly serious, and improving energy efficiency is an important approach to effectively relieve the situation.1 Compared with traditional light sources, phosphor-converted white light-emitting diodes (pc-WLEDs) have higher energy conversion efficiency, long lifetime, are environmentally benign, portable and fast switching, etc.2–5 Conversely, three monochromatic LEDs that realize a white light source, have disadvantages of high cost, different aging properties, complicated circuits, and so on.6 Therefore, white light from LED-excited phosphors are more promising. Presently, the frequently used methods to produce high-quality white light are blue LED chip excited yellow-emitting (YAG:Ce3+) phosphor, blue LED chip combined with green and red phosphors and near-ultraviolet (n-UV) chip blended with trichromatic phosphors.7 The former can cause a relatively poor color rendering index (CRI, Ra < 80) due to the insufficient red component of the single yellow phosphor.8 Hence, the red-emitting phosphor is indispensable for realizing high-quality general lighting. Currently, the main promising red phosphors are nitrides or fluorides. However, nitrides suffer from hash preparation conditions and high cost of raw materials; fluorides are poorly stable and are harmful raw materials.9,10 These disadvantages restrict their application. Hence, highly effective red phosphors with mild preparation conditions and excellent luminescence properties are in high demand.In general, the trivalent rare earth europium ion (Eu3+) has received great attention due to its narrow and strong pure red emission, resulting from 5D0 → 7FJ (J = 0, 1, 2, 3, 4) transitions.11–13 Among these transitions, the electric-dipole (ED) transition 5D0 → 7F0 can be seen at Cs, Cn, and Cnv symmetry. The 5D0 → 7F1 and 5D0 → 7F2 transitions, as the predominant transitions in most Eu3+-doped phosphor materials, are magnetic-dipole (MD) and hypersensitive ED transitions, respectively. The former intensity is almost irrelevant to the local environment of the Eu3+ ion, whereas the latter is greatly dependent on the ligand properties and local symmetry of the Eu3+ ion. The 5D0 → 7F3 and 5D0 → 7F4 transitions are forbidden transitions and dependent on the environment.14,15 However, the excitation spectrum of a common Eu3+-doped sample is broad, and a strong charge-transfer band is located in the UV region, which is difficult to use in commercial n-UV or blue LED chips. Recently, there have been some reports that Eu3+excitation has an abnormally weak charge transfer band, such as in Sr2LaNbO6:Eu3+, Cs3GdGe3O9:Eu3+, LaSc3(BO3)4:Eu3+, Ca2Ga2SiO7:Eu3+, and Ca19Mg2(PO4)14:Eu3+.16–20 Hence, a suitable host may lead to a stronger intra-4f transition absorption that matches well with the emission of n-UV or blue LED chips.
In this paper, we prepare a Eu3+-doped LiYO2 phosphor by the traditional high-temperature solid-phase method. Although LiYO2:Eu3+ has been reported before, only a brief study has been done.21 We prepared this material under different synthesis conditions and systematically studied and analyzed the phase purity and crystal structure. The excitation and emission spectra demonstrate excellent optical properties that contain strong and pure red emission and appropriate excitation, matching well with the LED chip. Furthermore, the relationship between the Eu3+-local environments and spectra is also explored by the Judd–Ofelt theory. The luminescence thermal stability of the sample was investigated by temperature-dependent spectra. Finally, a warm white light LED device is obtained with low correlated color temperature (CCT) and high CRI. These results illustrate that this specimen is an excellent red phosphor for potential application in WLEDs.
Experimental section
LiY1−xO2:xEu3+ (x = 0.15, 0.20, 0.25, 0.30, 0.35, 0.40, 0.45, abbreviated as LY:xEu3+) phosphors were prepared by a solid-phase approach. The raw materials containing Li2CO3 (99.99%), Y2O3 (99.99%) and Eu2O3 (99.99%) were weighed stoichiometrically and then poured into a grinding bowl and ground for 20 minutes. The obtained mixture was put into corundum crucibles and heated at 1273 K for 4 h. Finally, the products were furnace-cooled to room temperature and crushed to an even powder for further characterization.The phase purity of all specimens was obtained by X-ray diffraction (XRD) using a broker AXs D8 diffractometer (40 Kv × 40 mA, Cu-Kα, λ = 0.15405 nm). The morphologies and elemental mappings of the samples were identified by scanning electron microscopy (SEM, Hitachi S-4800) equipped with an energy dispersive spectrometer (EDS). The photoluminescence excitation (PLE) and photoluminescence (PL) spectra were recorded using a high-resolution spectrofluorometer (Edinburgh FLSP-920) equipped with a 450 W xenon lamp. The fluorescence decay curves were obtained from a Lecroy Wave Runner 6100 Digital Oscilloscope (1 GHz) using a tunable laser (pulse with = 4 ns, gate = 50 ns) as the excitation source (Continuum Sunlite OPO). Temperature-dependent PL spectra from 298 to 473 K were collected by Edinburgh Instruments FLSP-920 with a temperature controller.
Results and discussion
Fig. 1a shows the XRD patterns of the representative LY:xEu3+ samples and corresponding standard diffraction file card (PDF No. 97-004-5511). All the diffraction peaks of these samples are in agreement with the standard data, demonstrating that the obtained samples are pure phase. Fig. 1b displays the simplified crystal structure of the LiYO2 host. The host lattice contains a distorted YO6 octahedron in C1 site symmetry with corresponding bond lengths of 2.36547 (Y–O1), 2.22385 (Y–O1), 2.23650 (Y–O1), 2.22946 (Y–O2), 2.22966 (Y–O2) and 2.40068 (Y–O2) and a LiO4 polyhedron, and is a monoclinic crystal system with space group P21/c.22 According to the valence state and ionic radius, Eu3+ (R3+Eu = 0.0947 nm, CN (coordination number) = 6) ions should enter the Y (R3+Y = 0.09 nm, CN = 6) site instead of the Li (R+Li = 0.059 nm, CN = 4) site.23 | ||
| Fig. 1 (a) XRD patterns of LiYO2:xEu3+ (x = 0.20–0.40) and the standard XRD card (PDF No. 97-004-5511). (b) The unit cell structure of LiYO2 and (c) the bond lengths of the InO6 octahedra. | ||
The corresponding refined results of the LY:xEu3+ (x = 0.20, 0.25, 0.30, 0.35, 0.40) specimens, using the structure data of LiYO2 (ICSD No. 45511) as the starting model, are shown in Fig. 2a and Fig. S1 (ESI†). The detailed results are listed in Tables S2 and S3 (ESI†), which demonstrate that all results are reliable and rational. Fig. 2b plots the refined cell volume (V) and parameters (a, b, c) of the corresponding samples. It could be found that a, c and V are almost linearly elevated, but b decreases as the Eu3+-concentration increases. According to the previous reports, the decrease in parameter b may be relevant to the special rotation of polyhedra, and there is a sufficiently large (Y/Eu)–O–(Y/Eu) angle in the host. The introduction of larger Eu3+ ions increases the bond length and causes a decrease in the (Y/Eu)–O–(Y/Eu) angle.24,25 Hence, the distance (Y/Eu)–(Y/Eu) and parameter b, decrease.
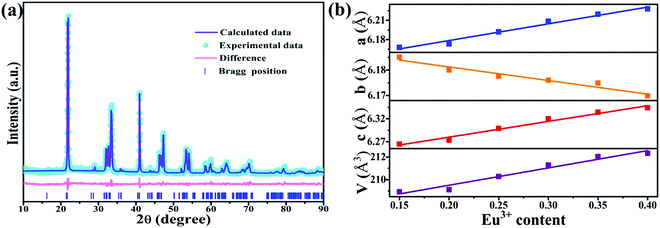 | ||
| Fig. 2 (a) The Rietveld refinements of LiYO2:0.20Eu3+ and (b) the relationship between lattice parameters and the differing amounts of Eu3+ in the LiYO2 host. | ||
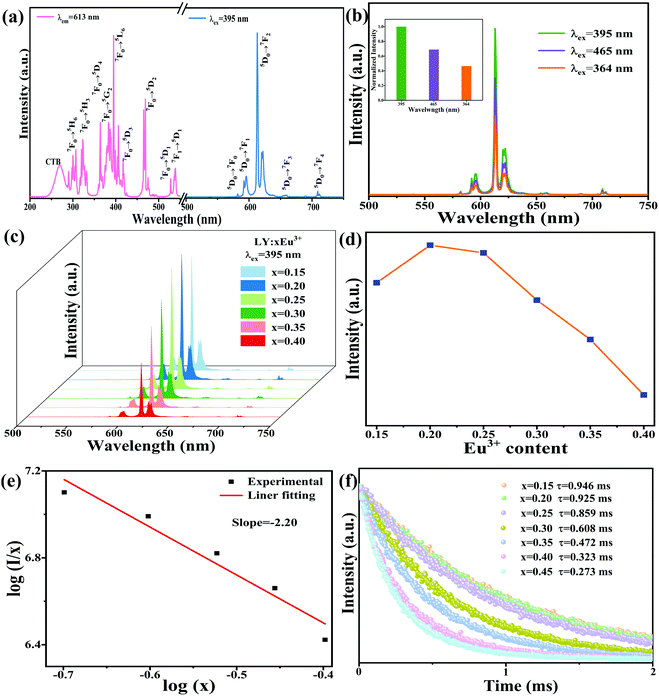
Fig. 3a displays the excitation (λem = 613 nm) and emission (λex = 395 nm) spectra of LY:0.20Eu3+. The PLE spectrum covering 200 to 550 nm comprises a relatively weak broad band ranging from 230 to 280 nm and a series of characteristic 4f–4f line bands; the peak values are 270, 307, 323, 364, 382, 395, 417, 468, 527, and 539 nm. These bands result from the charge transfer band, 7F0 → 5H6, 7F0 → 5H3, 7F0 → 5D4, 7F0 → 5G2, 7F0 → 5L6, 7F0 → 5D3, 7F0 → 5D2, 7F0 → 5D1, and 7F1 → 5D1 transitions of the Eu3+ ions, respectively.26 Under 395 nm light irradiation, the emission spectrum displays some distinct transition bands belonging to the 5D0 → 7FJ (J = 0, 1, 2, 3, 4) transitions of the Eu3+ ions with centers of 582, 595, 613, 658, and 709 nm.27 It is important to note that the excitation peak at 395 nm has maximum absorption and produces the strongest luminescence in comparison with the other excitations, as seen in Fig. 3b. Hence, the emission spectra of LY:xEu3+ samples with different Eu3+-content were recorded upon excitation with 395 nm light, as shown in Fig. 3c and d. When the Eu3+-concentration increases, the PL intensity presents a trend of increasing at first and then decreasing, and the optimum doped concentration is 0.20. The phenomenon of the decrease in PL intensity is caused by concentration quenching due to the existence of energy transfer between adjacent ions. Moreover, the mechanism of concentration quenching mainly includes electric multipolar and exchange interactions. The quenching mechanism can be further distinguished by the critical distance (Rc) obtained by the following expression.28,29
 | (1) |
 | (2) |
In which x and I are the concentration of doped ions (≥optimal concentration) and corresponding emission intensity, respectively, and C is the constant. Therein, we get a slope of −2.20 (Fig. 3e). The θ value is 6.60, closer to 6, which further suggests that the mechanism is predominated by d–d interactions.
The Commission Internationale de L’Eclairage (CIE) chromaticity coordinates of a series of LiYO2:xEu3+ and their corresponding color purity are shown in Fig. S2 and Table S4 (ESI†). The color purity be expressed as
 | (3) |
In order to further confirm the energy transfer, the fluorescence lifetime curves of LiY1−xO2:xEu3+ are plotted in Fig. 3f. All the curves are measured at 395 nm excitation and 613 nm emission, and the values of the corresponding lifetimes are estimated as follows.
 | (4) |
According to eqn (4), the lifetimes of Eu3+ are 0.946, 0.925, 0.859, 0.608, 0.472, 0.323, 0.273 ms, at Eu3+-concentrations 0.15, 0.20, 0.25, 0.30, 0.35, 0.40, 0.45, respectively. The lifetime monotonically decreases with increasing Eu3+-content, which is ascribed to the energy transfer among Eu3+ ions.
The Judd–Ofelt (J–O) theory is extensively used to understand and characterize the spectral properties of trivalent rare earth ions in hosts. Hence, we employ intensity parameters Ω2,4 based on J–O theory to obtain detailed insight into the relationship between the Eu3+ local environments and corresponding spectra. The intensity parameters of the optimal sample LiYO2:020Eu3+ could be estimated by the following expressions.16,32–34
 | (5) |
 | (6) |
| I7FJ = aA7FJ | (7) |
 | (8) |
 | (9) |
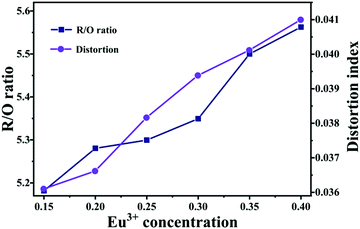
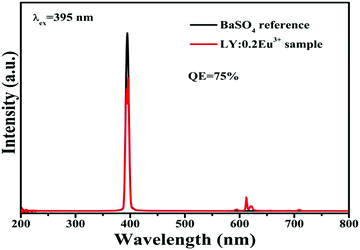
 .37 The results indicate that the distortion gradually increases as Eu3+ increases. As we know, the larger the distortion is, the lower the symmetry of the site. Hence, the results are consistent with the R/O ratio. These results further demonstrate that the obtained phosphor could provide a high level of bright red emission. In addition, the quantum yields are found to be 75% upon 395 nm excitation for the LY:0.20Eu3+ (Fig. 5).
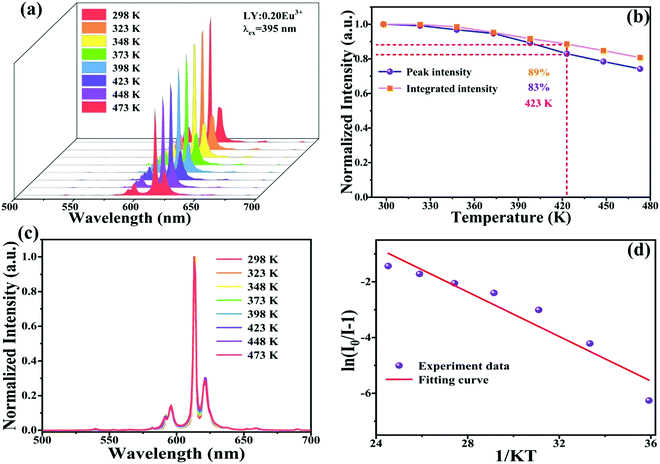
The thermal stability of the phosphor is a vital performance objective in practical applications because the working temperature of LED equipment is unavoidably over 400 K and affects the service life, light output and color rendering index.35,38Fig. 6a displays the temperature-dependent (recorded from 298 to 473 K) emission spectra of the optimum LiYO2:020Eu3+ sample with 395 nm excitation. Not surprisingly, the luminescence intensity gradually decreases as the temperature increases, which is due to the high working temperature aggravating molecular heat movement and thus enhancing nonradiative transitions. Unexpectedly, the normalized PL peak intensity and integrated emission intensity of the sample still retain 83% and 89% of the starting intensity recorded at 298 K when measured at 473 K (Fig. 6b), respectively, indicating that the LiYO2:020Eu3+ phosphor possesses excellent luminescence thermal stability, due to its excellent structural rigidity. From Fig. 6c, we can see that the PL spectrum profiles are almost the same, demonstrating that the phosphor sample has high color stability.
In order to further comprehend the luminescence thermal quenching phenomenon, the activation energy of the LiYO2:020Eu3+ specimen could be obtained using the Arrhenius equation.39
 | (10) |
I and I0 represent the emission intensities at T = T and T = 298 K, respectively. C is a constant, and K = 8.62 × 10⁻⁵ eV K−1. According to eqn (10), the activation energy (Ea) is found to be 0.399 eV obtained by fitting the ln(I0/I − 1) vs. 1/kT curve, as shown in Fig. 6d. In addition, the emission intensity remained essentially unchanged after the sample was placed in the air for two weeks (Fig. S3, ESI†), demonstrating that the sample has excellent chemical stability. A comparison of some reports of Eu3+-doped phosphors shows that the LY:0.20Eu3+ samples have good luminescence properties (Table S5, ESI†).
In view of the excellent luminescence performance, suitable synthetic methods and high thermal stability of the prepared LiYO2:Eu3+ red phosphor, a WLED prototype device was assembled based on an n-UV LED chip (395 nm) packed with commercial blue, green and synthesized red phosphors (BaMgAl10O17:Eu2+ + (Sr, Ba)2SiO4:Eu2+ + LiYO2:020Eu3+) to assess the potential application prospects in the field of lighting. The electroluminescence (EL) spectra and real scene photographs of the as-fabricated pc-LED devices under a current of 20 mA are shown in Fig. 7. The obtained LiYO2:0.20Eu3+ phosphor specimen could efficiently convert the light of the n-UV LED chip into highly pure red light. Simultaneously, an LED device with bright warm white light is obtained by blending trichromatic phosphors, and the CIE chromaticity coordinates, CRI and CCT are (0.364, 0.358), 85, and 4354 K, respectively.
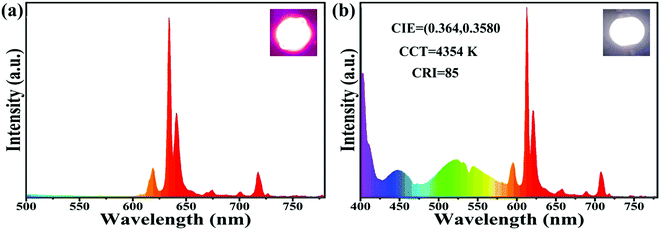 | ||
| Fig. 7 Electroluminescence spectra and photographs of (a) n-UV LED chip + LiYO2:0.20Eu3+ phosphor and (b) n-UV LED chip + BaMgAl10O17:Eu2+ + (Sr, Ba)2SiO4:Eu2+ + LiYO2:020Eu3+. | ||
Conclusion
To summarise, we synthesized a red Eu3+-doped LiYO2 phosphor and investigated the phase purity, crystal structure, luminescent properties and local environment of Eu3+ ions. By irradiating with light at 395 nm, the sample showed a strong red emission, mainly resulting from the 5D0 → 7F2 transition, and the color purity is up to 98.9%. The optimal doped concentration and concentration quenching mechanism are 0.20 and d–d interaction, respectively. Meanwhile, by J–O theory, the intensity parameters Ω2 and Ω4 of LiYO2:020Eu3+ are 5.948 × 10⁻²⁰ and 5.620 × 10⁻²¹, and the R/O ratio and polyhedral distortion index gradually enhance with increasing Eu3+-content. Additionally, the phosphor sample presented excellent thermal stability with an emission intensity at 423 K, 89% of 398 K. In addition, the activation energy (Ea) is 0.399 eV. The CCT, CRI and CIE chromaticity coordinates of the assembled warm WLED are 4354 K, 85, and (0.364, 0.358), respectively. Hence, the obtained LiYO2:Eu3+ can be applied for WLEDs as a promising red-emitting phosphor.Conflicts of interest
There are no conflicts of interest to declare.Acknowledgements
This study is financially supported by the National Natural Science Foundation of China (Grant No. 52072363 and 21771175), the Key Research Program of the Chinese Academy of Sciences (Grant No. ZDRW-CN-2021-3), and the Natural Science Foundation of Jilin Province (20200201106JC).References
- Z. Xia and Q. Liu, Prog. Mater. Sci., 2016, 84, 59–117 CrossRef CAS.
- B. Shao, J. Huo and H. You, Adv. Opt. Mater., 2019, 1900319 CrossRef.
- F. Hong, H. Xu, G. Pang, G. Liu, X. Dong and W. Yu, Chem. Eng. J., 2020, 390, 124579 CrossRef CAS.
- S. Ye, F. Xiao, Y. X. Pan, Y. Y. Ma and Q. Y. Zhang, Mater. Sci. Eng., R, 2010, 71, 1–34 CrossRef.
- L. Zhang, Y. Xu, S. Yin and H. You, J. Alloys Compd., 2022, 891, 162042 CrossRef CAS.
- M. S. Shur and R. Zukauskas, Proc. IEEE., 2005, 93, 1691–1703 CAS.
- L. Zhang, L. Dong, Y. Xu, S. Yin and H. You, Dalton Trans., 2021, 50, 1366–1373 RSC.
- F. Hong, H. Cheng, G. Liu, X. Dong, W. Yu and J. Wang, Inorg. Chem., 2018, 57, 9892–9901 CrossRef CAS PubMed.
- Z. Zhou, N. Zhou, M. Xia, M. Yokoyama and H. T. Hintzen, J. Mater. Chem. C, 2016, 4, 9143–9161 RSC.
- B. Wang, H. Lin, J. Xu, H. Chen and Y. Wang, ACS Appl. Mater. Interfaces, 2014, 6, 22905–22913 CrossRef CAS PubMed.
- Z. Mu, Y. Hu, L. Chen, X. Wang, G. Ju, Z. Yang and R. Chen, Ceram. Int., 2014, 40, 2575–2579 CrossRef CAS.
- Z. Mu, Y. Hu, L. Chen and X. Wang, J. Electrochem. Soc., 2011, 158, J287 CrossRef CAS.
- M. Liao, Z. Mu, S. Zhang, F. Wu, Z. Nie, Z. Zheng, X. Feng, Q. Zhang, J. Feng and D. Zhu, J. Lumin., 2019, 210, 202–209 CrossRef CAS.
- K. Binnemans, Coord. Chem. Rev., 2015, 295, 1–45 CrossRef CAS.
- E. Niyama, H. F. Brito, M. Cremona, E. E. S. Teotonio, R. Reyes, G. E. S. Brito and M. C. F. C. Felinto, Spectrochim. Acta, Part A, 2005, 61, 2643–2649 CrossRef CAS.
- Y. Hua, W. Ran and J. S. Yu, Chem. Eng. J., 2021, 406, 127154 CrossRef CAS.
- P. Dang, G. Li, X. Yun, Q. Zhang, D. Liu, H. Lian, M. Shang and J. Lin, Light: Sci. Appl., 2021, 10, 29 CrossRef CAS PubMed.
- S. Wang, Y. Xu, T. Chen, W. Jiang, J. Liu, X. Zhang, W. Jiang and L. Wang, Chem. Eng. J., 2021, 404, 125912 CrossRef CAS.
- G. K. Behrh, R. Gautier, C. Latouche, S. Jobic and H. Serier-Brault, Inorg. Chem., 2016, 55, 9144–9146 CrossRef CAS PubMed.
- G. Zhu, Z. Ci, Y. Shi, M. Que, Q. Wang and Y. Wang, J. Mater. Chem. C, 2013, 1, 5960–5969 RSC.
- M. D. Faucher, O. K. Moune, M. G. Alves, B. Piriou, P. Sciau and M. Pham-Thi, J. Solid State Chem., 1996, 121, 457–466 CrossRef CAS.
- O. Kyoung Moune, J. Dexpert-Ghys, B. Piriou, A. Marie-Gabrielle and M. D. Faucher, J. Alloys Compd., 1998, 275-277, 258–263 CrossRef CAS.
- R. Shannon, Acta Crystallogr., Sect. A, 1976, 32, 751–767 CrossRef.
- L. Yu, H. Yan, Y. Fan, J. Zhang, Z. Ma, W. Zhou, Y. Chen, F. Pan and S. Lian, J. Mater. Chem. C, 2018, 6, 10723–10729 RSC.
- M. Chen, Z. Xia, M. S. Molokeev, C. C. Lin, C. Su, Y.-C. Chuang and Q. Liu, Chem. Mater., 2017, 29, 7563–7570 CrossRef CAS.
- A. Tyagi, S. Nigam, V. Sudarsan, C. Majumder, R. K. Vatsa and A. K. Tyagi, Inorg. Chem., 2020, 59, 12659–12671 CrossRef CAS PubMed.
- J. Huo, A. Yu, Q. Ni, D. Guo, M. Zeng, J. Gao, Y. Zhang and Q. Wang, Inorg. Chem., 2020, 59, 15514–15525 CrossRef CAS PubMed.
- G. Blasse, Phys. Lett. A, 1968, 28, 444–445 CrossRef CAS.
- J. Xiang, Z. Zhou, J. Zheng, Y. Chen, H. Suo, X. Zhao, L. Zhao and C. Guo, Opt. Mater., 2020, 109, 110344 CrossRef CAS.
- N. Zhang, J. Zheng, J. Gao, Y. Wu, R. Zhang, T. Li and C. Guo, Dyes Pigm., 2017, 136, 601–611 CrossRef CAS.
- H. Xiong, Y. Zhang, Y. Liu, T. Gao, L. Zhang, Z.-A. Qiao, L. Zhang, S. Gan and Q. Huo, J. Alloys Compd., 2019, 782, 845–851 CrossRef CAS.
- B. Tian, B. Chen, Y. Tian, X. Li, J. Zhang, J. Sun, H. Zhong, L. Cheng, S. Fu, H. Zhong, Y. Wang, X. Zhang, H. Xia and R. Hua, J. Mater. Chem. C, 2013, 1, 2338 RSC.
- G. Bai, M.-K. Tsang and J. Hao, Adv. Opt. Mater., 2015, 3, 431–462 CrossRef CAS.
- M. H. V. Werts, R. T. F. Jukes and J. W. Verhoeven, Phys. Chem. Chem. Phys., 2002, 4, 1542–1548 RSC.
- N. Yang, J. Li, Z. Zhang, D. Wen, Q. Liang, J. Zhou, J. Yan and J. Shi, Chem. Mater., 2020, 32, 6958–6967 CrossRef CAS.
- X. Geng, Y. Xie, S. Chen, J. Luo, S. Li, T. Wang, S. Zhao, H. Wang, B. Deng, R. Yu and W. Zhou, Chem. Eng. J., 2021, 410, 128396 CrossRef CAS.
- J. Zhang, T. Zhang, Z. Qiu, S. Liu, J. Zhang, W. Zhou, L. Yu and S. Lian, Inorg. Chem., 2018, 57, 12354–12363 CrossRef CAS PubMed.
- Y. Wei, L. Cao, L. Lv, G. Li, J. Hao, J. Gao, C. Su, C. C. Lin, H. S. Jang, P. Dang and J. Lin, Chem. Mater., 2018, 30, 2389–2399 CrossRef CAS.
- D. Zhao, S.-R. Zhang, Y.-P. Fan, B.-Z. Liu, Y.-N. Li, L.-Y. Shi and S.-J. Dai, ACS Sustainable Chem. Eng., 2020, 8, 18992–19002 CrossRef CAS.
Footnote |
| † Electronic supplementary information (ESI) available See DOI: 10.1039/d1ma01221e |
| This journal is © The Royal Society of Chemistry 2022 |

![[thin space (1/6-em)]](https://www.rsc.org/images/entities/char_2009.gif)
