DOI:
10.1039/D1MA01214B
(Paper)
Mater. Adv., 2022,
3, 2749-2759
Hierarchically porous 2D carbon from bio-waste: a sustainable, rapid, and efficient oxidase mimic for the colorimetric detection of ascorbic acid†
Received
21st December 2021
, Accepted 4th February 2022
First published on 7th February 2022
Abstract
In the present work, a porous 2D carbon-based sustainable, rapid, and efficient oxidase mimic for ascorbic acid (A.A.) detection has been discussed. Here, Eichhornia crassipes (water hyacinth) biomass waste was used as a precursor, which resulted in advanced N, O-doped hierarchically porous 2D carbon. In this, the heteroatom-like N, O are well-dispersed while 2D carbon has a high surface area. For this, a one-step carbonizing technique was used in an inert environment without any surfactant/activating chemical aid. The structural parameters of such a 2D carbon material were characterized by Fourier transform infrared spectroscopy, X-ray diffraction, and X-ray photoluminescence spectroscopic techniques. The morphological investigations of 2D carbon were done by field emission scanning electron microscopy and transmission electron microscopy. Nanozymes, also called nanomaterials having the behaviors of enzymes, are promising materials for biomedical fields. Due to the absence of corrosive H2O2 in the reaction path, oxidase-like nanozymes are gaining more importance and attention. Due to the high surface area and N, O-doped hierarchical pores, the 2D carbon possessed more catalytic active sites and facilitated rapid oxidase-like activity for the chromogenic substrate 3,3′,5,5′-tetramethylbenzidine (TMB). The oxidation culminated in a charge-transfer product with an absorbance peak at 652 nm. Ascorbic acid is a biomolecules that displays concentration-dependent inhibition property over the oxidase activity of a nanozyme. We developed a colorimetric technique based on a 2D carbon oxidase nanozyme for A.A. sensing. Based on this principle, the presented colorimetric method showed an excellent linearity range from 1 to 70 μM with a 0.26 μM detection limit and the fastest A.A. detection among the other reported colorimetric methods. This work demonstrates a simple approach for preparing a complete metal-free and efficient nanozyme, and explored its use for A.A. detection in orange, lemon, grapes, and human serum. Also, it presents a new avenue to design a sustainable mimetic substrate and further a road map for transforming biowastes into new technology.
1. Introduction
Ascorbic acid (A.A.) is one of the crucial biochemical molecules of the vitamins group and plays a vital role in many biological functions, such as a free radical scavenger and in cancer inhibition and prevention.1–6 Unfortunately, the human body cannot produce A.A., so daily diet supplements are the only source to complete such needs. The standard range of A.A. in healthy humans is between 0.6–2 mg dL−1. However, disturbances in their concentration can cause various complications, like stomach pain, muscle pain, and diseases.2 Thus, a regular diagnosis of the A.A. content becomes paramount for a fair and healthy body and has received increasing worldwide attention. In this connection, various techniques, including electrochemical techniques,1,6,7 chromatography,8,9 chemiluminescence,10,11 enzyme-linked immunosorbent assay (ELISA),12 fluorescence,13,14 and colorimetric techniques,1,15 have been well studied and established. Biosensing platforms have a broad range of technological arrays and have been explored to detect various small biomolecules, tumor markers, the A.A. level, etc.16–20 Among these, the colorimetric technique has positioned itself as an excellent method to expedite a simple, quick, cost-effective, visual detection.21–25 The colorimetric method is based on a chromogenic substrate, which produces color upon oxidation under the effect of the enzymes. Therefore, the chromogenic substrate or reagents selection is a key point to manifest the colorimetric performance and to achieve an effective detection of the color transformation.26 Natural enzymes are particularly ultra-sensitive to their working environments, and if a bit of change occurs in their environmental conditions (pH, pressure, and temperature), they can lose their catalytic activities. Therefore, the regular application of natural enzymes faces a set of difficulties and creates a significant challenge in medical assays for performing enzyme-dependent reactions or processes.27 To counter such situations, researchers have started developing some new materials that can show enzyme-like activity.27 Based on the catalytic concept, the high surface area and reaction centers are the main factors that shift the equilibrium toward their completion. Since the nanostructure has a high surface area and unique properties, nano-science provides a unique platform for integrating the desired artificial enzymes (also called nanozyme or nanoenzyme). With the development of nanotechnology, several nanomaterials, including transition metals,22,28–30 noble metals,31,32 polymers,33,34 and carbons material,35 have been developed and have been reported for mimic or colorimetric sensing purposes. Artificial enzymes having large surface areas are easy to store and employ. In addition, they can adapt to harsh circumstances for denaturation, high substrate concentration, and low cost, and therefore, are getting prime attention as an alternative to the natural enzymes.36,37
There are four types of nanozymes: oxidase, peroxidase, catalases, and superoxidases have been reported to have advantages and disadvantages. Much research literature has been reported so far for the detection of A.A. via oxidase and peroxidase activity. According to the reaction mechanism, the oxidase nanozyme is denoted as a better means than the peroxidase because of the absence of corrosive H2O2,22 even though very little literature is available on oxidase nanozymes for A.A. detection. Thus, there is a high demand for sustainable, green, and efficient oxidase nanozymes for A.A. recognition. The colorimetric detection of biomolecules is based on electronic-transfer processes and co-related with the substrate surface area, porosity, and heteroatom in the lattice.38–40 Since porous 2D carbon has a vast surface area and unique electronic structures, it can play an exciting role in artificial enzymes. Presently, biowaste-derived 2D carbon nanomaterials are attracting much more attention in various recommended technological projects,41,42e.g., supercapacitors,43–45 batteries,46 and adsorbents.47 Despite this, some work has been published on carbon-based substrates for mimetic purposes, but still, there is a need for more explorations.
In this work, we derived N, O-doped highly porous 2D carbon (BET surface area is 781 m2 g−1) from a biowaste Eichhornia crassipes plant using a carbonization technique under an inert environment. Eichhornia crassipes (locally called jalkumbhi) is an unwanted aquatic herb that causes harm to aquatic agricultural, fisheries, and water transportations. To improve the marine agricultural-based economy, much manpower is consumed unnecessarily for netting such herbs, which are then usually dumped around water ponds and pools, causing environmental contamination. Thus, some scientific approaches are needed to convert this biowaste herb into a valuable material. Since, Eichhornia crassipes has massive moisture (∼9.95), volatile matter (∼56.30), fixed carbon (∼17.40), and ash content (wt 16.35%), respectively, the water and volatile matter content probably act as a self-activating means and provide high surface area 2D carbon.44 Motivated by the above facts, Eichhornia crassipes was used as a source for developing porous 2D carbon materials in this work, which satisfied both the techno- as well as socio-economical features. The structural parameters of the carbon materials were characterized using Fourier transform infrared spectroscopy (FTIR), X-ray diffraction (XRD), and X-ray photoluminescence spectroscopy (XPS). The surface morphology of the materials was analyzed under field emission scanning electron microscopy (FESEM) and transmission electron microscopy (TEM). The presented 2D carbon material showed an efficient affinity toward the chromogenic substrate 3,3′,5,5′-tetramethylbenzidine (TMB), forming a characteristic oxidized blue-colored product. A.A. delivered a concentration-dependent inhibition property over the 2D carbon oxidase activity and resulted in a decrease in color intensity. We developed a colorimetric method for sensing A.A. based on this principle, producing a color contrast with its different concentrations. The technique was further explored to detect A.A. in actual samples (orange, lemon, grapes juice, and human serum) with good recovery percentages obtained.
2. Materials and methods
2.1 Chemicals and reagents
The 3,3′,5,5′-tetramethylbenzidine (TMB), ascorbic acid (A.A.), hydrochloric acid (HCl), hydrofluoric acid (H.F.), copper(II) chloride (CuCl2), calcium chloride (CaCl2), potassium chloride (KCl), citric acid, glucose, glutathione (GSH), sodium acetate, and glacial acetic acid were purchased from Sigma Aldrich. N-Ethylmaleimide (NEM, 98%) was purchased from Avra. All the solutions were prepared in Milli-Q water (resistivity = 18.0 MΩ, pH 7) during the experiments. The human serum samples for the A.A. determination and recovery study were collected from the university hospital “the Institute of Medical Sciences, Banaras Hindu University” (courtesy Prof. D. Dash, IMS, BHU, Varanasi, India).
2.2 Characterization techniques
TEM micrographs of the drop-cast 2D carbon suspension in water were investigated on an FEI system, at an accelerating voltage of 200 kV on the TECHNAI G2 20 TWIN (Czech Republic) TEM instrument. The absorption spectra of the 2D carbon mimetic activity and colorimetric assay were obtained on a Biotek spectrophotometer (Epoch 2, USA). FT-IR analysis was carried out in the spectral range of 450–4000 cm−1 on a Thermo Scientific Nicolet 6700 FTIR spectrometer. X-Ray photoelectron spectroscopy (XPS) was performed on a Kratos analytical instrument (Shimadzu, Amicus XPS, U.K.) equipped with MgKα (λ = 1.254 Å) radiation. A Rigaku miniflex 600 X-ray diffractometer with Cu Kα1 radiation (λ = 1.54056 Å) was used for X-ray powder diffraction measurements of the prepared 2D carbon. The surface property of the material was investigated on a Nova Nano SEM-450 system (FEI, USA), and NTEGRA Prima, NT-MDT scanning probe microscope. For testing the method in an actual sample, orange, lemon, and grapes were used as bought from a Varanasi supermarket.
2.3 Synthesis of the porous carbon
The oxidase mimic porous 2D carbon was synthesized using our previous protocols as reported.44 In brief, Eichhornia crassipes leaves were washed thoroughly after collection in running water and dried in an oven at 80 °C. The dried leaves were deformed into fine powder form using a mortar and pestle. The obtained powder was allowed to carbonize at 800 °C under inert N2 conditions followed by an acid–base–water washing process. The carbon obtained was stored at R.T. for further application.
3. Results and discussions
3.1 Structural analysis
Since 2D carbons have a porous architecture and heteroatom doped sp2 and sp3 hybridized atom, which are fundamental for any activated carbon. In this work, XRD, FTIR, and XPS techniques were used to confirm a successful material synthesis. The obtained results showed great similarity with our earlier work.44Fig. 1(a) shows the FTIR spectrum of 2D carbon, exhibiting a vibration band corresponding to a hydroxyl group, C![[double bond, length as m-dash]](https://www.rsc.org/images/entities/char_e001.gif) C/C–C stretching vibrations, and advocates the occurrence of the sp2-hybridized graphitic system. A broadband (1000–1100 cm−1) was observed, indicating the C–O functionalities existence. Further, the XRD of such 2D carbon, as shown in Fig. 1(b), reflected two characteristic peaks as one broad peak around 2θ ∼ 25° consequent to the (002) plane, and the second peak at 2θ ∼ 43° for the (100) plane. Such XRD data (broadening spectra) revealed that the prepared carbonic material was amorphous. In order to understand the surface architecture of the 2D carbon, TEM and SEM image investigations were performed (as shown in Fig. 1(c and d) and ESI† file as Fig. S1(a and b)), respectively, which disclosed that the as-synthesized 2D carbon had a typical porous arrangement. As presented in Fig. 1c, the TEM image indicated that the reported 2D carbon was made up of very tiny particles.
C/C–C stretching vibrations, and advocates the occurrence of the sp2-hybridized graphitic system. A broadband (1000–1100 cm−1) was observed, indicating the C–O functionalities existence. Further, the XRD of such 2D carbon, as shown in Fig. 1(b), reflected two characteristic peaks as one broad peak around 2θ ∼ 25° consequent to the (002) plane, and the second peak at 2θ ∼ 43° for the (100) plane. Such XRD data (broadening spectra) revealed that the prepared carbonic material was amorphous. In order to understand the surface architecture of the 2D carbon, TEM and SEM image investigations were performed (as shown in Fig. 1(c and d) and ESI† file as Fig. S1(a and b)), respectively, which disclosed that the as-synthesized 2D carbon had a typical porous arrangement. As presented in Fig. 1c, the TEM image indicated that the reported 2D carbon was made up of very tiny particles.
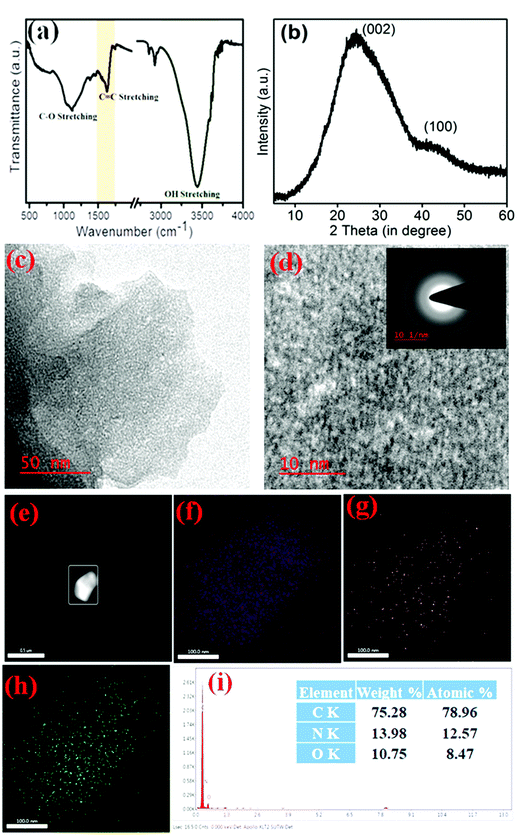 |
| | Fig. 1 Characterization of 2D carbon. (a) FTIR spectrum, (b) XRD, (c) TEM image at 50 nm scale, (d) at 10 nm scale (Inset shows the SAED pattern), (e) HAADF image area for mapping, (f) mapping image corresponding to C, (g) N, (h) O, respectively. | |
Further at high-resolution, the HRTEM image, as shown in Fig. 1d, reflected some prototype fringes, which suggests that the 2D carbon construction was not fully amorphous but had a few crystalline domains also in their matrix. This observation could be correlated to the presence of some sp3 hybridized centers and a heteroatom. The enlarged images of the fringes are given in the ESI† in Fig. S3. For additional insurance about the contamination-free 2D carbon, mapping (Fig. 1e–h) and EDX (see in Fig. 1(i)) were performed, which were further supported by the XPS observation44 (also can be seen in Fig. S2, ESI†) and vice-versa. The XPS survey spectrum study of 2D carbon, as represented in Fig. S2(a), (ESI†) showed three consequent peaks of C, N, and O elements. Further, with deconvolution of the XPS data, the C1s peak of the 2D carbon (see Fig. S2(b), ESI†) was disassembled into the following three peaks as 284.9, 286.3, and 288.7 eV, related to the C–C–C, C–N/C–O, and O–C![[double bond, length as m-dash]](https://www.rsc.org/images/entities/char_e001.gif) O bonds, respectively. Further, the O1s deconvoluted spectrum (see in Fig. S2(c), ESI†) exhibited three different oxygen moieties at 530.9, 532.7, and 534.7 eV for C–O–C of carboxyl groups, C
O bonds, respectively. Further, the O1s deconvoluted spectrum (see in Fig. S2(c), ESI†) exhibited three different oxygen moieties at 530.9, 532.7, and 534.7 eV for C–O–C of carboxyl groups, C![[double bond, length as m-dash]](https://www.rsc.org/images/entities/char_e001.gif) O, and chemisorbed O2, respectively. Finally, Fig. S2(d) (ESI†) showed the N1s peak disassembled into three sub-peaks at 398.7 eV for imine nitrogen, at 400.9 eV for pyrrolic, and 406.3 eV for quaternary nitrogen. These data confirmed that the reported 2D carbon had only C, N, and O elements as its constructing component and was free from contaminating features. The mapping showed that heteroatoms like N and O were distributed homogenously throughout the carbon matrix (see Fig. 1e–h). Summing these consequences, like the heteroatom, porous structure, and high surface area, the synthesized 2D carbon can be utilized as a fascinating mimetic substrate for establishing biosensors with high performances, which is explored in the next paragraph in the colorimetric detection of A.A.
O, and chemisorbed O2, respectively. Finally, Fig. S2(d) (ESI†) showed the N1s peak disassembled into three sub-peaks at 398.7 eV for imine nitrogen, at 400.9 eV for pyrrolic, and 406.3 eV for quaternary nitrogen. These data confirmed that the reported 2D carbon had only C, N, and O elements as its constructing component and was free from contaminating features. The mapping showed that heteroatoms like N and O were distributed homogenously throughout the carbon matrix (see Fig. 1e–h). Summing these consequences, like the heteroatom, porous structure, and high surface area, the synthesized 2D carbon can be utilized as a fascinating mimetic substrate for establishing biosensors with high performances, which is explored in the next paragraph in the colorimetric detection of A.A.
3.2 Oxidase mimetic activity of 2D carbon and A.A. inhibition
For the H2O2 free colorimetric sensing of A.A., the development of oxidase-like nanozymes is an essential call for researchers. Ensuing this, we have presented a sustainable 2D carbon material derived from biowaste, which demonstrated an excellent oxidase mimetic activity in the presence of dissolved O2. To investigate the oxidase property of 2D carbon material, the absorption spectra of TMB were recorded in the absence of 2D carbon (see Fig. 2 curve (a) and in the presence of 2D carbon (see Fig. 2 curve b)). The absorption spectra result, as in Fig. 2 curve (a), suggested that the TMB aqueous solution alone was colorless because there was no involvement of any charge-transfer reaction. Then upon the addition of 2D carbon into the TMB aqueous solution, a strong absorption peak appeared at 652 nm (Fig. 2 curve (b)). This peak occurrence at 652 nm is crystal-clear proof of a charge-transfer complex (CTC) between the oxidized and unoxidized TMB. TMB molecules get oxidized with the help of the added 2D carbon due to the oxidase activity. Further, upon the addition of A.A. into the reaction mixture of TMB + 2D carbon, the absorption intensity of 652 nm band gets diminished (see Fig. 2 curve (c)). This validated the inhibition of the oxidase activity of 2D carbon. Lastly, when the stop solution H2SO4 was added, the absorption band at 652 nm corresponding to CTC gets diminished, and a new peak was generated at λmax = 450 nm, as shown in Fig. 2 curve (d). A detailed discussion is provided in the later Section 3.5).
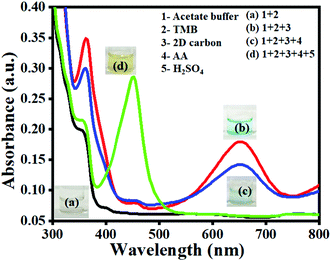 |
| | Fig. 2 Absorption spectra for the oxidase activity of 2D carbon and the inhibition property of A.A. | |
3.3 Role of the material and optimization toward the oxidase
Since the colorimetric sensing response of the nanozyme is concentration-dependent; therefore, 2D carbon material concentration optimization is compulsory. For the test of variation in the oxidase activity of 2D carbon toward TMB, a range of concentrations between 0.1 to 1 mg mL−1 of 2D carbon was applied. During the experiments, the absorbance at 652 nm was recorded after an incubation period of 15 min, as shown in Fig. 3. The absorbance result was verified in an approximately linear manner, and the response suggested that the saturation level happened after 0.8 mg L−1. Based on this observation, the optimum concentration of 2D carbon e.g., 0.8 mg mL−1, was chosen for the further experiments. In this way, even at a low concentration of 2D carbon (i.e., 0.08%), we could get an excellent catalytic response.
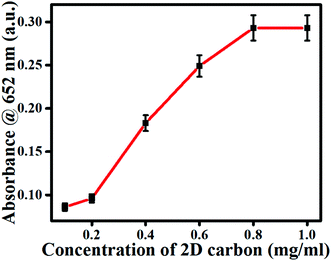 |
| | Fig. 3 Endpoint spectrum for 2D carbon optimization. | |
3.4 TMB optimization and its Lineweaver–Burk plot
In order to investigate the nature of the nanozyme kinetics, the oxidase activity was studied under different TMB concentrations from 100 μM to 1000 μM. In this, the absorbance at 652 nm was recorded at pH 4 (which was adjusted by adding the acetate buffer). Fig. 4(a) depicts the absorbance plot at 652 nm vs. TMB concentration, indicating a saturation point after 800 μM. This data showed that the intensity was directly proportional to the TMB concentration, but after 800 μM TMB, the peak intensity was almost constant. Fig. 4(b) shows the Lineweaver–Burk plot of the 2D carbon nanozyme having an R-square value of 0.99, which indicated a good linear response. Beer–Lambert's law was utilized to calculate the initial reaction rate using eqn (1).where C is the solution concentration, A represents the absorbance, b represents the thickness of the solution or path length, and ε is the molar absorptivity coefficient, having a value of 39![[thin space (1/6-em)]](https://www.rsc.org/images/entities/char_2009.gif) 000 M−1 cm−1. The Lineweaver–Burk plot for the nanozyme catalysis reaction was plotted against the reciprocal velocity and TMB concentration reciprocal. The Michaelis–Menten constant (Km) value for the 2D carbon as the nanozyme was calculated from the Lineweaver–Burk plot. The corresponding value of km was 0.121 μM, and Vmax was 5.3 μM s−1. The lower value of km of the proposed 2D carbon-based nanozyme showed the stronger affinity between the nanozyme and TMB substrate, resulting in a more efficient catalytic property of the 2D carbon. This relationship was because this 2D carbon had a high surface area (781 m2 g−1), giving more exposure for chromogenic substrate interactions and enhanced molecular interaction and electron transfer. For validating our appeal of the significance of the reported 2D carbon-based nanozyme, a comparison table was made with other carbon-based materials and natural enzymes, showing the superior catalytic properties of the 2D carbon (see Table S1, ESI†).
000 M−1 cm−1. The Lineweaver–Burk plot for the nanozyme catalysis reaction was plotted against the reciprocal velocity and TMB concentration reciprocal. The Michaelis–Menten constant (Km) value for the 2D carbon as the nanozyme was calculated from the Lineweaver–Burk plot. The corresponding value of km was 0.121 μM, and Vmax was 5.3 μM s−1. The lower value of km of the proposed 2D carbon-based nanozyme showed the stronger affinity between the nanozyme and TMB substrate, resulting in a more efficient catalytic property of the 2D carbon. This relationship was because this 2D carbon had a high surface area (781 m2 g−1), giving more exposure for chromogenic substrate interactions and enhanced molecular interaction and electron transfer. For validating our appeal of the significance of the reported 2D carbon-based nanozyme, a comparison table was made with other carbon-based materials and natural enzymes, showing the superior catalytic properties of the 2D carbon (see Table S1, ESI†).
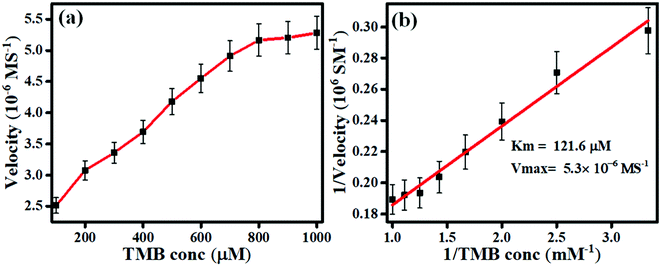 |
| | Fig. 4 Steady-state kinetic assay of 2D carbon as a nanozyme: (a) the variation of the enzyme velocity with the TMB concentration, (b) Lineweaver–Burk plot. | |
3.5 Principle of the colorimetric detection of A.A.
Joseph et al. (1982) well established the oxidation phenomenon of TMB in the presence of a catalyst using optical and EPR spectroscopy.48 In line with this, we demonstrated the reaction progress of the oxidation of the TMB molecule to di-imine (see Scheme 1). Since TMB in its reduced form absorbs electromagnetic radiation around the λmax = 285 nm region, the solution of TMB has no color. However, with the existence of dissolved oxygen and an oxidase nanozyme, the solution of TMB turned blue color. This is because a cation-free radical was generated, forming a CTC with unoxidized TMB giving a blue color product with absorbance peaks at λmax = 370 and 652 nm (see Scheme 1(i)). The radical cation was less stable and in rapid equilibrium with CTC. Upon the addition of the stop solution (H2SO4) (see Scheme 1(ii)), which lowered the pH from 4 to around 1, the enzymatic reaction became terminating. The lowering of the pH caused a shift in the equilibrium from CTC to its radical cation, favoring the formation of the yellow di-imine product with λmax = 450 nm and a significantly higher molar absorptivity.49
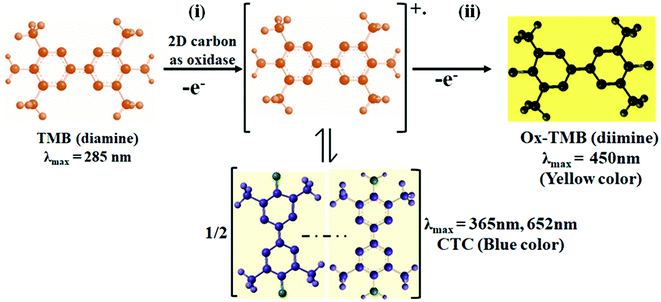 |
| | Scheme 1 Schematic representation of the oxidation of TMB. | |
Now understanding the oxidation reaction of TMB, we are in a position to elucidate the nanozyme activity of the proposed 2D carbon. The 2D carbon was synthesized from Eichhornia crassipes leaves by the carbonization technique, as shown in Scheme 2. Since the nanozyme mimicking oxidase functions as a catalyst that accelerates TMB oxidation by mediating the electron transfer from TMB to dissolved oxygen,50,51 this is a better means than from the peroxidase because of the absence of corrosive H2O2.22 So our interest was focused on the investigation of the oxidase-like nanozyme. The offered 2D carbon possessed an excellent surface area with profound oxidase activity corresponding to the chromogenic substrate TMB. Due to the large surface area, more TMB and O2 molecules get adsorbed over the 2D carbon. Due to such proximity, the reacting molecules become closer together, facilitating the electronic or redox reactions. There is a net transfer of electrons from TMB to the catalyst (2D carbon), forming oxidized TMB; further, oxygen receives an electron from the catalyst and gets reduced. 2D carbon bears another advantage as it has O, N heteroatoms, allowing making H-bonding and acting to better mimic the activity. A.A. is an antioxidant and has competitive inhibition properties concerning the oxidase activity of 2D carbon toward TMB. Therefore, with the addition of A.A., the oxidation of TMB was inhibited, resulting in a lowering of the peak intensity at 450 nm and producing yellow color contrasts. A linear response was achieved for absorbance at 450 nm for different A.A. concentrations. This oxidation reaction between 2D carbon and TMB is a corrosive H2O2-free process and has excellent sensitivity, stability, and reproducibility, which were due to the reported 2D carbon material.
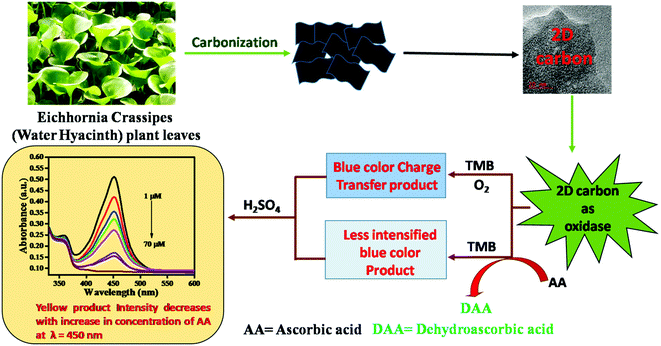 |
| | Scheme 2 Schematic representation of the principle for the colorimetric detection of A.A. | |
3.6 Optimal pH and temperature parameters
The catalytic properties of enzymes are susceptible to different parameters, such as pH and temperature. So, optimizing these parameters is crucial for developing an efficient sensor with better accuracy and precision. For temperature optimization, the oxidase activity experiments were performed at different temperatures ranging from 10 °C to 50 °C. Fig. 5a shows that 2D carbon exhibited good mimetic activity over a broad temperature spectrum with maximum activity at 20 °C. Further, to optimize the pH, the oxidase activity experiment was performed in buffer solutions with varying pH (2, 3, 4, 5, 6, 7), as shown in Fig. 5b. In Fig. 5b, it is shown that 2D carbon had a maximum activity at pH 4, which is consistent with earlier reports.22 Such results show the resistance of the 2D carbon catalytic property to pH and temperature compared to the natural enzyme and suggest the better stability and efficiency of the developed nanozyme.
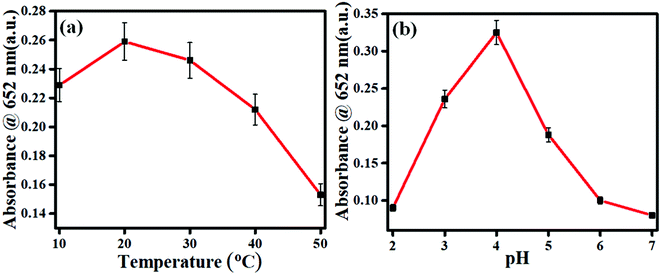 |
| | Fig. 5 Spectra for the optimization of the parameters for the nanozyme: (a) temperature, (b) pH. | |
3.7 Sensing
Under all the optimized conditions of temperature, pH, material concentration, and TMB, the developed methods were explored for the sensing of A.A. Since A.A. shows an inhibition property over the oxidase activity of 2D carbon and is concentration-dependent, this can tested as 2D carbon induces the oxidation reaction of TMB and displays a blue color as the charge-transfer complex is formed. This blue color is transformed to yellow upon adding the stop solution and gives a characteristic absorbance peak at 450 nm. The addition of A.A. gives a color contrast with its different concentrations. Fig. 6a represents the sensing of A.A., and shows the developed sensor had good linearity in the range of 1 to 70 μM with a regression coefficient of 0.99. Fig. 6b shows the linear calibration plot, which was plotted taking the average of ten replicates. The developed sensor showed good linearity with a detection limit of 0.26 μM calculated using the formula LOD = 3 × standard deviation of the blank/slope of the calibration plot.
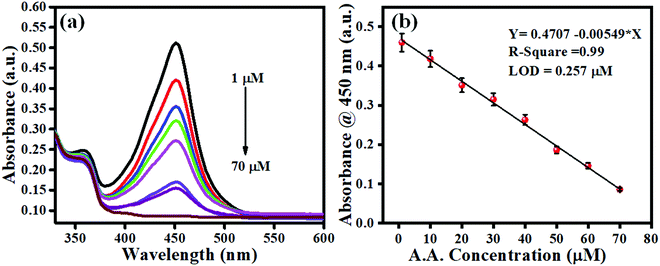 |
| | Fig. 6 (a) UV-Vis absorption spectra for A.A. sensing (1 to 70 μM). (b) Endpoint calibration plot at 450 nm. | |
3.8 Reproducibility and cycle stability
In order to elucidate the reproducibility of the developed sensor, we have repeated the experiment several times using freshly prepared solutions for all components as described in Fig. 7(a). It can be inferred from the result that the sensor's relative activity was similar over ten days with inefficient differences. Further, the recyclability test of the nanozyme has been tested by recovering it after the test through centrifugation at 8000 rpm for 10 min. For this purpose, 30 min incubation time has been reserved. As can be observed in Fig. 7(b), the relative activity of the nanozyme shows good cycle stability over six cycles with more than 94%. This minor reduction may be due to the sample loss during centrifugal treatment.52
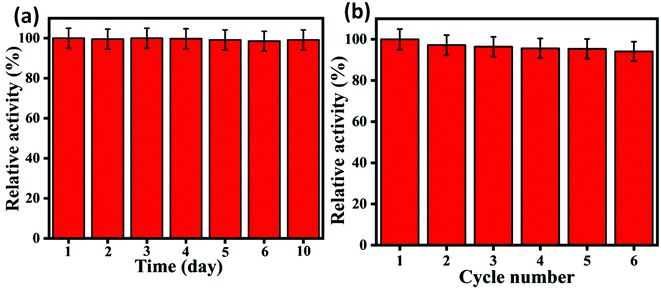 |
| | Fig. 7 (a) Reproducibility study over different days, (b) cycle stability of catalytic activity of 2D carbon. | |
3.9 Interference study
For any sensor, the specificity and selectivity are essential parameters. Before commercialization, an interference study is necessary to ensure the selectivity of sensors toward the targeted molecules. The real sample can encounter several molecules, which may interfere with the sample analysis and mislead the data interpretation. In this work, the method was examined with various interferences that may be encountered, like glucose, citric acid, glutathione, Cu2+, Ca2+, K+, and Cl−, taking their concentration as ten times as high as A.A. Since GSH has a reductive nature like A.A., it gives a very similar response to the reported method. The comparative responses of the interferences as mentioned above with A.A. are shown in Fig. 7. Thus, there is a critical step needed for investigation of GSH's effect. To understand this, similar experiments for the oxidase activity were performed in the absence and presence of NEM. NEM is an alkylating compound commonly used to protect the thiols group (-S.H.) of GSH. Thereby, we negotiated the effect of GSH in our A.A. sensing.53,54 The histogram of Fig. 8 depicts that the present method is particular for A.A., and can be effectively applied as a selective technique for sensing A.A. in actual samples.
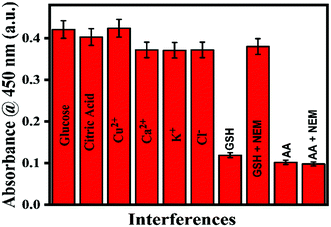 |
| | Fig. 8 Interference study of A.A. in the presence of glucose, citric acid, Cu2+, Ca2+, K+, Cl−, GSH (in the absence and presence of NEM). | |
3.10 Real sample analysis
Three different A.A.-rich fruits, like oranges, lemons, and grapes, and human serum were used for the objective sample analysis as tabulated in Table 1. In order to do this, the juices of oranges, lemons, and grapes were collected and centrifuged at 8000 rpm to get the extract. Consequently, each extract was diluted up to 50-fold (using the buffer) and used for the further experiments. The A.A. analysis was performed by spiking different A.A. concentrations (10 and 20 μM) for each fruit extract and the absorbance was recorded at λmax = 450 nm. By using the absorbance data, the concentration of A.A. was calculated from the calibration plot, and their respective concentrations are given in ESI† Table S1. The observed result clearly showed the potential of our method with excellent recovery between 97% to 106%. However, human serum (samples obtained from IMS-BHU Hospital) was diluted up to 10-fold using acetate buffer and an experiment was performed via spiking different A.A. concentrations (20 and 40 μM). The observed result clearly showed the potential of our method with an excellent recovery response between 93% to 103% (see Table 2). The comparative data of the projected colorimetric method with the previously reported nanozyme are also tabulated as ESI† Table S2. Thus, the present technique based on the 2D carbon nanozyme possessed good linearity and a lower LOD. Therefore, we can say that Eichhornia crassipes-derived 2D carbon-based colorimetric detection provides a reliable, highly sensitive, and convenient approach for detecting A.A.
Table 1 Real sample analysis of A.A. in orange, lemon, and grape extracts
| 50 Times diluted juice |
Spiked ascorbic acid (μM) |
Found ascorbic acid (μM) |
Recovery (%) |
| Orange (33.46 μM) |
0 |
33.46 |
100 |
| 10 |
43.56 |
100.2 |
| 20 |
52.38 |
97.9 |
| Lemon juice (24.44 μM) |
0 |
24.44 |
100 |
| 10 |
34.76 |
100.9 |
| 20 |
43.16 |
97.1 |
| Grape (18.04 μM) |
0 |
18.04 |
100 |
| 10 |
29.86 |
106 |
| 20 |
39.78 |
104.5 |
Table 2 Sensing of A.A. in human serum
| 10 Times diluted serum in buffer |
Spiked ascorbic acid (μM) |
Found ascorbic acid (μM) |
Recovery (%) |
| Human serum (21.3 μM) |
0 |
21.18 |
100 |
| 20 |
42.54 |
103.2 |
| 40 |
57.36 |
93.5 |
4. Conclusions
Herein, we presented a biomass waste-derived 2D carbon-based sustainable, rapid, and efficient oxidase mimic for A.A. colorimetric detection from Eichhornia crassipes. Such 2D carbon has a high surface area (781 m2 g−1) with self-doped O, N heteroatoms, which gives unique electronic or redox properties. The developed 2D carbon-based sensor showed an excellent linear response (R-square = 0.99) over the range of 1 to 70 μM. The detection limit was found to be 0.26 μM, by introducing a sensitive platform for the sensing of A.A. in real samples. Further, the reported oxidase 2D carbon-based sensor quantified the A.A. concentration in orange, lemon, and grape juice, and human serum with good recovery values. In conclusion, this work presents a complete metal-free and efficient nanozyme based on Eichhornia crassipes biowaste. It presents a new avenue to design a sustainable mimetic substrate for ascorbic detection from biowastes.
Conflicts of interest
The authors declare no conflicts of interest.
Acknowledgements
Authors are thankful to CIF, IDAPT @ IIT(BHU) (under DST NMCPS) for providing support. C. J. Verma and R. P. Ojha convey their acknowledgement to the IIT (BHU) for Institute fellowship, and P. Singh conveys their acknowledgment to the CSIR for SRF (File No 09/1217(0024)/2017-EMR-I).
References
- D. Navadeepthy, M. Thangapandian, C. Viswanathan and N. Ponpandian, A nanocomposite of NiFe2O4–PANI as a duo active electrocatalyst toward the sensitive colorimetric and electrochemical sensing of ascorbic acid, Nanoscale Adv., 2020, 2, 3481–3493 RSC.
- K. Dhara and R. M. Debiprosad, Review on nanomaterials-enabled electrochemical sensors for ascorbic acid detection, Anal. Biochem., 2019, 586, 113415–113431 CrossRef CAS PubMed.
- Y. Song, C. Gong, D. Su, Y. Shen, Y. Song and L. Wang, A novel ascorbic acid electrochemical sensor based on spherical MOF-5 arrayed on a three-dimensional porous carbon electrode, Anal. Methods, 2016, 8, 2290–2296 RSC.
- B. S. He and J. X. Zhang, Rapid Detection of Ascorbic Acid Based on a Dual-Electrode Sensor System Using a Powder Microelectrode Embedded with Carboxyl Multi-Walled Carbon Nanotubes, Sensors, 2017, 17, 1549–1562 CrossRef PubMed.
- K. S. V. Santhanam and V. R. Krishnan, Estimation of Ascorbic Acid by Controlled Potential Coulometry, Anal. Chem., 1961, 33(11), 1493–1495 CrossRef CAS.
-
V. S.
Sapner and B. R. Sathe, Metal-free graphene-based nanoelectrodes for the electrochemical determination of ascorbic acid (A.A.) and p-nitrophenol (p-NP): implication towards biosensing and environmental monitoring, New J. Chem., 2021, 45, 4666–4674 RSC.
- L. V. de Faria, T. P. Lisboa, D. M. de Farias, F. M. Araujo, M. M. Machado, R. A. de Sousa, M. A. C. Matos, R. A. A. Muñoz and R. C. Matos, Direct analysis of ascorbic acid in food beverage samples by flow injection analysis using reduced graphene oxide sensor, Food Chem., 2020, 319, 126509–126514 CrossRef PubMed.
- R. Cotrut and L. Badulescu, UPLC rapid quantification of ascorbic acid in several fruits and vegetables extracted using different solvents, Agric. Agric. Sci. Procedia, 2016, 10, 160–166 Search PubMed.
- M. Zhu, J. Tang, X. Tu and W. Chen, Determination of Ascorbic Acid, Total Ascorbic Acid, and Dehydroascorbic Acid in Bee Pollen Using Hydrophilic Interaction Liquid Chromatography-Ultraviolet Detection, Molecules, 2020, 25, 5696–56105 CrossRef CAS PubMed.
- C. Wang, M. I. Halawa, B. Lou, W. Gao, J. Li and G. Xu, Detection of ascorbic acid based on its quenching effect on luminol–artemisinin chemiluminescence, Analyst, 2021, 146, 1981–1985 RSC.
- Q. Zhu, D. Dong, X. Zheng, H. Song, X. Zhao, H. Chen and X. Chen, Chemiluminescence determination of ascorbic acid using graphene oxide@copper-based metal-organic frameworks as a catalyst, RSC Adv., 2016, 6, 25047–25055 RSC.
- W. Xie, M. Tian, X. Luo, Y. Jiang, N. He, X. Liao and Y. Liu, A dual-mode fluorescent and colorimetric immunoassay based on in situ ascorbic acid-induced signal generation from metal-organic frameworks, Sens. Actuators, B, 2020, 302, 127180–127186 CrossRef CAS.
- S. Zhu, C. Lei, Y. Gao, J. Sun, H. Peng, H. Gao, R. Zhang, R. Wang, X. E. Zhao and H. Wang, Simple and label-free fluorescence detection of ascorbic acid in rat brain microdialysates in the presence of catecholamines, New J. Chem., 2018, 42, 3851–3856 RSC.
- H. Meng, D. Yang, Y. Tu and J. Yan, Turn-on fluorescence detection of ascorbic acid with gold nanoclusters, Talanta, 2017, 165, 346–350 CrossRef CAS PubMed.
- X. Shu, Y. Chang, H. Wen, X. Yao and Y. Wang, Colorimetric determination of ascorbic acid based on carbon quantum dots as peroxidase mimetic enzyme, RSC Adv., 2020, 10, 14953–14957 RSC.
- T. Wu, W. Hou, Z. Ma, M. Liu, X. Liu, Y. Zhang and S. Yao, Colorimetric determination of ascorbic acid and the activity of alkaline phosphatase based on the inhibition of the peroxidase-like activity of citric acid-capped Prussian Blue nanocubes, Microchim. Acta, 2019, 186, 123 CrossRef PubMed.
- S. Zhang, R. Li, X. Liu, L. Yang, Q. Lu, M. Liu, Y. Zhang and S. Yao, A novel multiple signal amplifying immunosensor based on the strategy ofin situ-produced electroactive substance by ALP and carbon-based Ag–Au bimetallic as the catalyst and signal enhancer, Biosens. Bioelectron., 2017, 92, 457–464 CrossRef CAS PubMed.
- M. Liu, Q. Chen, C. Lai, Y. Zhang, J. Deng, H. Li and S. Yao, A double signal amplification platform for ultrasensitive and simultaneous detection of ascorbic acid, dopamine, uric acid and acetaminophen based on a nanocomposite of ferrocene thiolate stabilized Fe3O4@Au nanoparticles with graphene sheet, Biosens. Bioelectron., 2013, 48, 75–81 CrossRef CAS PubMed.
- Q. Wu, H. Chen, A. Fang, X. Wu, M. Liu, H. Li, Y. Zhang and S. Yao, Universal Multifunctional Nanoplatform Based on Target-Induced in Situ Promoting Au Seeds Growth to Quench Fluorescence of Upconversion Nanoparticles, ACS Sens., 2017, 2, 1805–1813 CrossRef CAS PubMed.
- H. Chen, Z. Zhou, Q. Lu, C. Wu, M. Liu, Y. Zhang and S. Yao, Molecular structure regulation and enzyme cascade signal amplification strategy for upconversion ratiometric luminescent and colorimetric alkaline phosphatase detection, Anal. Chim. Acta, 2019, 1051, 160–168 CrossRef CAS PubMed.
- Y. He, N. Li, J. Lian, Z. Yang, Z. Liu, Q. Liu, X. Zhang and X. Zhang, Colorimetric ascorbic acid sensing from a synergetic catalytic strategy based on 5,10,15,20-tetra(4-pyridyl)-21H,23H-porphyrin functionalized CuS nanohexahedrons with the enhanced peroxidase-like activity, Colloids Surf., A, 2020, 598, 1248553 CrossRef.
- R. P. Ojha, R. Mishra, P. Singh, N. R. Nirala and R. Prakash, A composite prepared from MoS2 quantum dots and silver nanoparticles and stimulated by mercury(II) is a robust oxidase mimetic for use in visual determination of cysteine, Microchim. Acta, 2020, 187, 74–82 CrossRef CAS PubMed.
- P. Singh, R. P. Ojha, S. Kumar, A. K. Singh and R. Prakash, Fe-doped MoS2 nanomaterials with amplified peroxidase mimetic activity for the colorimetric detection of glutathione in human serum, Mater. Chem. Phys., 2021, 267, 224684 CrossRef.
- R. P. Ojha, S. Pal and R. Prakash, Cu–Fe Prussian blue analog nanocube with intrinsic oxidase mimetic behaviour for the non-invasive colorimetric detection of Isoniazid in human urine, Michrochem. J., 2021, 171, 106854 CrossRef CAS.
- Vinita, M. Tiwari and R. Prakash, Colorimetric detection of picric acid using silver nanoparticles modified with 4-amino-3-hydrazino-5-mercapto-1,2,4-triazole, Appl. Surf. Sci., 2018, 449, 174–180 CrossRef CAS.
- M. Zhang, G. Qing, C. Xiong, R. Cui, D. W. Pang and T. Sun, Dual-Responsive Gold Nanoparticles for Colorimetric Recognition and Testing of Carbohydrates with a Dispersion-Dominated Chromogenic Process, Adv. Mater., 2013, 25749–25754 Search PubMed.
- N. Chaibakhsh and Z. M. Shoeili, Enzyme mimetic activities of spinel substituted nano ferrites (MFe2O4): A review of synthesis, mechanism and potential applications, Mater. Sci. Eng., C, 2019, 99, 1424–1447 CrossRef CAS PubMed.
- N. D. Navadeepthy, R. A. Rebekah, V. C. Viswanathan and P. N. Ponpandian, N-doped Graphene/ZnFe2O4: a novel nanocomposite for intrinsic peroxidase based sensing of H2O2, Mater. Res. Bull., 2017, 95, 1–8 CrossRef.
- Vinita, N. R. Nirala and R. Prakash, One-step synthesis of AuNPs@MoS2-QDs composite as a robust peroxidase- mimetic for instant unaided eye detection of glucose in serum, saliva and tear, Sens. Actuators, B, 2018, 263, 109–119 CrossRef CAS.
- A. Asati, S. Santra, C. Kaittanis, S. Nath and J. M. Perez, Oxidase-like activity of polymer-Coated cerium oxide nanoparticles, Angew. Chem., Int. Ed., 2009, 48, 2308–2312 CrossRef CAS PubMed.
- Z. Xi, K. Wei, Q. Wang, M. J. Kim, S. Sun, V. Fung and X. Xia, Nickel−Platinum Nanoparticles as Peroxidase Mimics with a Record High Catalytic
Efficiency, J. Am. Chem. Soc., 2021, 143, 2660–2664 CrossRef CAS PubMed.
- Y. Li, H. Zhou, T. Li, X. Jian, Z. Gao and Y. Y. Song, Designing ultrafine Pd–Co alloys in mesoporous silica nanospheres with peroxidase-like activity and catalase-like activity, J. Mater. Chem. B, 2021, 9, 2016–2024 RSC.
- H. J. Oh, B. J. Yeang, Y. K. Park, H. J. Choi, J. H. Kim, Y. S. Kang, Y. Bae, J. Y. Kim, S. J. Lim, W. Lee and W. Hahm, Washable Colorimetric Nanofiber Nonwoven for Ammonia Gas Detection, Polymers, 2020, 12, 1585–1596 CrossRef CAS PubMed.
- H. Zhang and S. Liu, Mixing concentrated sulfuric acid and diethylenetriamine at room temperature: A rapid and facile approach to synthesize fluorescent carbon polymer hollow spheres as peroxidase mimics, J. Colloid Interface Sci., 2021, 582, 405–411 CrossRef CAS PubMed.
- B. Wang, F. Liu, Y. Wu, Y. Chen, B. Weng and C. Ming Li, Synthesis of catalytically active multielement-doped carbon dots and application for colorimetric detection of glucose, Sens. Actuators, B, 2018, 255, 2601–2607 CrossRef CAS.
- S. Ray, R. Biswas, R. Banerjeeand and P. Biswas, A gold nanoparticle-intercalated mesoporous silica-based nanozyme for the selective colorimetric detection of dopamine, Nanoscale Adv., 2020, 2, 734–745 RSC.
- D. Jiang, D. Ni, Z. T. Rosenkrans, P. Huang, X. Yan and W. Cai, Nanozyme: new horizons for responsive biomedical applications, Chem. Soc. Rev., 2019, 48, 3683–3704 RSC.
- M. Liang and X. Yan, Nanozymes: From New Concepts, Mechanisms, and Standards to Applications, Acc. Chem. Res., 2019, 52, 2190–2200 CrossRef CAS PubMed.
- L. Hou, G. Jiang, Y. Sun, X. Zhang, J. Huang, S. Liu, T. Lin, F. Ye and S. Zhao, Progress and Trend on the Regulation Methods for Nanozyme Activity and Its Application, Catalysts, 2019, 9, 1057–1073 CrossRef CAS.
- S. K. Gurmessa, L. T. Tufa, J. Kim, K. I. Lee, Y. M. Kim, V. T. Tran, H. Q. Nguyen, T. S. Shim, J. Kim, T. J. Park, J. Leeand and H. J. Kim, Colorimetric Detection of Mycobacterium tuberculosis ESX-1 Substrate Protein in Clinical Samples Using Au@Pd NanoparticleBased Magnetic Enzyme-Linked Immunosorbent Assay, ACS Appl. Nano Mater., 2021, 4, 539–549 CrossRef CAS.
- A. S. Engelberth, S. P. M. Ventura, F. Vilaplana, P. Venkatesu, J. Y. Zhu and D. J. Carrier, ACS Sustainable Chemistry & Engineering Welcomes Manuscripts on the Circular Economy of Biomass, ACS Sustainable Chem. Eng., 2021, 9, 2410–2411 CrossRef CAS.
- M. Culebras, A. Barrett, M. Pishnamazi, G. M. Walker and M. N. Collins, Wood-Derived Hydrogels as a Platform for Drug-Release Systems, ACS Sustainable Chem. Eng., 2021, 9, 2515–2522 CrossRef CAS PubMed.
- M. Biswal, A. Banerjee, M. Deo and S. Ogale, Ogale From dead leaves to high energy density supercapacitors, Energy Environ. Sci., 2013, 6, 1249–1259 RSC.
- C. J. Verma, A. Kumar, S. Pal, S. Sinha, A. K. Singh, A. Jaiswal and R. Prakash, Polyaniline stabilized activated carbon from Eichhornia Crassipes: Potential charge storage material from bio-waste, Renew, Energy, 2020, 162, 2285–2296 CAS.
- C. Schütter, A. R. Neale, P. Wilde, P. Goodrich, C. Hardacre, S. Passerini, J. Jacquemin and A. Balducci, Microporous carbonaceous materials prepared from biowaste for supercapacitor application, Electrochim. Acta, 2016, 206, 452–457 CrossRef 453.
- T. J. Yokokura, J. R. Rodriguez and V. G. Pol, Waste Biomass-Derived Carbon Anode for Enhanced Lithium Storage, ACS Omega, 2020, 31, 19715–19720 CrossRef PubMed.
- M. M. Sabzehmeidani, S. Mahnaee, M. Ghaedi, H. Heidari and V. A. L. Roy, Carbon-based materials: a review of adsorbents for inorganic and organic compounds, Mater. Adv., 2021, 2, 598–627 RSC.
- P. D. Josephy, T. Eling and R. P. Mason, The Horseradish Peroxidase-Catalyzed Oxidation of 3,5,3′,5′-Tetramethylbenzidine. Free Radical and Charge-Transfer Complex Intermediates, J. Biol. Chem., 1982, 257, 3669–3675 CrossRef CAS.
- R. W. Bally and T. C. J. Gribnau, Some Aspects of the Chromogen 33′5,5′ Tetramethylbenzidine as Hydrogen Donor in a Horseradish Peroxidase Assay, J. Clin. Chem. Clin. Biochem., 1989, 27, 791–796 CAS.
- W. Qin, L. Su, C. Yang, Y. Ma, H. Zhang and X. Chen, Colorimetric Detection of Sulfite in Foods by a TMB-O2-Co3O4 Nanoparticles Detection System, J. Agric. Food Chem., 2014, 62, 5827–5834 CrossRef CAS PubMed.
- Y. Han, L. Luo, L. Zhang, Y. Kang, H. Sun, J. Dan, J. Sun, W. Zhang, T. Yue and J. Wang, Oxidase-like Fe–Mn bimetallic nanozymes for colorimetric detection of ascorbic acid in kiwi frui, LWT-Food Sci. Technol., 2022, 154, 112821 CrossRef CAS.
- C. Jin, J. Lian, Y. Gao, K. Guo, K. Wu, L. Gao, X. Zhang, X. Zhang and Q. Liu, Si Doped CoO Nanorods as Peroxidase Mimics for Colorimetric Sensing of Reduced Glutathione, ACS Sustainable Chem. Eng., 2019, 7, 13989–13998 CrossRef CAS.
- Z. Huang, L. Zheng, F. Feng, Y. Chen, Z. Wang, Z. Lin, X. Lin and S. Weng, A Simple and Effective Colorimetric Assay for Glucose Based on MnO2 Nanosheets, Sensors, 2018, 18, 2525 CrossRef PubMed.
- Y. Zhu, J. Wu, K. Wang, H. Xu, M. Qu, Z. Gao, L. Guo and J. Xie, Facile and sensitive measurement of GSH/GSSG in cells by surface-enhanced Raman spectroscopy, Talanta, 2021, 224, 121852 CrossRef CAS PubMed.
Footnotes |
| † Electronic supplementary information (ESI) available. See DOI: 10.1039/d1ma01214b |
| ‡ All authors have equally contributed to this work. |
|
| This journal is © The Royal Society of Chemistry 2022 |
Click here to see how this site uses Cookies. View our privacy policy here.  Open Access Article
 *
*
![[double bond, length as m-dash]](https://www.rsc.org/images/entities/char_e001.gif) C/C–C stretching vibrations, and advocates the occurrence of the sp2-hybridized graphitic system. A broadband (1000–1100 cm−1) was observed, indicating the C–O functionalities existence. Further, the XRD of such 2D carbon, as shown in Fig. 1(b), reflected two characteristic peaks as one broad peak around 2θ ∼ 25° consequent to the (002) plane, and the second peak at 2θ ∼ 43° for the (100) plane. Such XRD data (broadening spectra) revealed that the prepared carbonic material was amorphous. In order to understand the surface architecture of the 2D carbon, TEM and SEM image investigations were performed (as shown in Fig. 1(c and d) and ESI† file as Fig. S1(a and b)), respectively, which disclosed that the as-synthesized 2D carbon had a typical porous arrangement. As presented in Fig. 1c, the TEM image indicated that the reported 2D carbon was made up of very tiny particles.
C/C–C stretching vibrations, and advocates the occurrence of the sp2-hybridized graphitic system. A broadband (1000–1100 cm−1) was observed, indicating the C–O functionalities existence. Further, the XRD of such 2D carbon, as shown in Fig. 1(b), reflected two characteristic peaks as one broad peak around 2θ ∼ 25° consequent to the (002) plane, and the second peak at 2θ ∼ 43° for the (100) plane. Such XRD data (broadening spectra) revealed that the prepared carbonic material was amorphous. In order to understand the surface architecture of the 2D carbon, TEM and SEM image investigations were performed (as shown in Fig. 1(c and d) and ESI† file as Fig. S1(a and b)), respectively, which disclosed that the as-synthesized 2D carbon had a typical porous arrangement. As presented in Fig. 1c, the TEM image indicated that the reported 2D carbon was made up of very tiny particles.
![[double bond, length as m-dash]](https://www.rsc.org/images/entities/char_e001.gif) O bonds, respectively. Further, the O1s deconvoluted spectrum (see in Fig. S2(c), ESI†) exhibited three different oxygen moieties at 530.9, 532.7, and 534.7 eV for C–O–C of carboxyl groups, C
O bonds, respectively. Further, the O1s deconvoluted spectrum (see in Fig. S2(c), ESI†) exhibited three different oxygen moieties at 530.9, 532.7, and 534.7 eV for C–O–C of carboxyl groups, C![[double bond, length as m-dash]](https://www.rsc.org/images/entities/char_e001.gif) O, and chemisorbed O2, respectively. Finally, Fig. S2(d) (ESI†) showed the N1s peak disassembled into three sub-peaks at 398.7 eV for imine nitrogen, at 400.9 eV for pyrrolic, and 406.3 eV for quaternary nitrogen. These data confirmed that the reported 2D carbon had only C, N, and O elements as its constructing component and was free from contaminating features. The mapping showed that heteroatoms like N and O were distributed homogenously throughout the carbon matrix (see Fig. 1e–h). Summing these consequences, like the heteroatom, porous structure, and high surface area, the synthesized 2D carbon can be utilized as a fascinating mimetic substrate for establishing biosensors with high performances, which is explored in the next paragraph in the colorimetric detection of A.A.
O, and chemisorbed O2, respectively. Finally, Fig. S2(d) (ESI†) showed the N1s peak disassembled into three sub-peaks at 398.7 eV for imine nitrogen, at 400.9 eV for pyrrolic, and 406.3 eV for quaternary nitrogen. These data confirmed that the reported 2D carbon had only C, N, and O elements as its constructing component and was free from contaminating features. The mapping showed that heteroatoms like N and O were distributed homogenously throughout the carbon matrix (see Fig. 1e–h). Summing these consequences, like the heteroatom, porous structure, and high surface area, the synthesized 2D carbon can be utilized as a fascinating mimetic substrate for establishing biosensors with high performances, which is explored in the next paragraph in the colorimetric detection of A.A.![[thin space (1/6-em)]](https://www.rsc.org/images/entities/char_2009.gif) 000 M−1 cm−1. The Lineweaver–Burk plot for the nanozyme catalysis reaction was plotted against the reciprocal velocity and TMB concentration reciprocal. The Michaelis–Menten constant (Km) value for the 2D carbon as the nanozyme was calculated from the Lineweaver–Burk plot. The corresponding value of km was 0.121 μM, and Vmax was 5.3 μM s−1. The lower value of km of the proposed 2D carbon-based nanozyme showed the stronger affinity between the nanozyme and TMB substrate, resulting in a more efficient catalytic property of the 2D carbon. This relationship was because this 2D carbon had a high surface area (781 m2 g−1), giving more exposure for chromogenic substrate interactions and enhanced molecular interaction and electron transfer. For validating our appeal of the significance of the reported 2D carbon-based nanozyme, a comparison table was made with other carbon-based materials and natural enzymes, showing the superior catalytic properties of the 2D carbon (see Table S1, ESI†).
000 M−1 cm−1. The Lineweaver–Burk plot for the nanozyme catalysis reaction was plotted against the reciprocal velocity and TMB concentration reciprocal. The Michaelis–Menten constant (Km) value for the 2D carbon as the nanozyme was calculated from the Lineweaver–Burk plot. The corresponding value of km was 0.121 μM, and Vmax was 5.3 μM s−1. The lower value of km of the proposed 2D carbon-based nanozyme showed the stronger affinity between the nanozyme and TMB substrate, resulting in a more efficient catalytic property of the 2D carbon. This relationship was because this 2D carbon had a high surface area (781 m2 g−1), giving more exposure for chromogenic substrate interactions and enhanced molecular interaction and electron transfer. For validating our appeal of the significance of the reported 2D carbon-based nanozyme, a comparison table was made with other carbon-based materials and natural enzymes, showing the superior catalytic properties of the 2D carbon (see Table S1, ESI†).


