 Open Access Article
Facile synthesis of Ni-incorporated and nitrogen-doped reduced graphene oxide as an effective electrode material for tri(ammonium) phosphate electro-oxidation
Nasser A. M.
Barakat†
 *a,
Enas
Ahmed†
b,
A. A.
Farghali
c,
Mamdouh M.
Nassar
a,
Gehan M. K.
Tolba
a and
Ayman H.
Zaki
 c
c
aChemical Engineering Department, Faculty of Engineering, Minia University, El-Minia, Egypt. E-mail: nasbarakat@mu.edu.eg; Fax: +20862346674; Tel: +20862348005
bRenewable Energy Science and Engineering Department, Faculty of Postgraduate Studies for Advanced Sciences, Beni-Suef University, Egypt
cMaterials Science and Nanotechnology Department, Faculty of Postgraduate Studies for Advanced Sciences, Beni-Suef University, Egypt
First published on 7th February 2022
Abstract
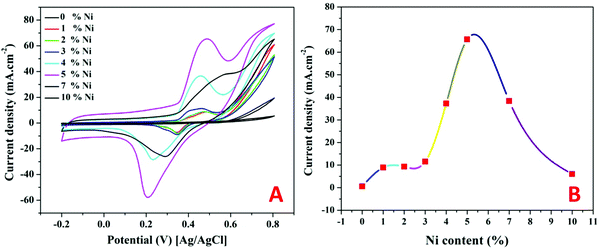
Tri(ammonium) phosphate is a cheap and commercially available compound and is used as a fertilizer. This substance possesses a considerable amount of hydrogen. Recently, it has been found that the embedded hydrogen could be extracted from tri(ammonium) phosphate using a Ni/C heterocatalytic reaction. In this study, for the first time based on our knowledge, extraction of hydrogen from tri(ammonium) phosphate was performed electrolytically using Ni-incorporated and N-doped reduced graphene oxide. The proposed electrocatalyst was prepared by a simple one-pot synthesis procedure. Typically, a well-mixed nickel acetate tetrahydrate/polyvinylpyrrolidone mixture has been calcined under a nitrogen atmosphere at 700 °C. X-Ray diffraction (XRD) analyses confirmed the formation of zero-valent nickel and reduced graphene oxide because of the clear appearance of the corresponding peaks. Moreover, X-ray photoelectron spectroscopy (XPS) analyses concluded the formation of graphene sheets functionalized by oxygenated groups and doped by pyrrolic and pyridinic nitrogen; however only pyrrolic nitrogen has been detected in Ni-free samples. Transmission electron microscopy (TEM) images indicated the formation of multilayer reduced graphene oxide. Electrochemical measurements indicated that the prepared composite is an effective electrocatalyst for tri(ammonium) phosphate oxidation when the nickel content is optimized. The electrode containing 31.9 wt% Ni shows the maximum generated current density; however, clear oxidation peaks were observed with 40.2 wt% formulation. Overall, the study introduces tri(ammonium) phosphate as a model for a new class of hydrogen-rich, cheap and available substances for hydrogen generation using non-precious electrodes. Besides that, the novel functionalized and N-doped reduced graphene oxide synthesis methodology may attract attention due to its distinct simplicity compared to the reported procedures.
1. Introduction
The global shortage of fossil fuels as a result of continued industrial growth and overpopulation led to the quest for new and sustainable alternative energy sources.1 Hydrogen has received significant attention as one of the most environmentally friendly and efficient energy sources to replace conventional fossil fuels. Hydrogen, unlike fossil fuels, is not abundant in nature. It may be generated from any main energy source and then utilized as a fuel, either directly in an internal combustion engine or in a fuel cell, with just water as a byproduct.2,3 Another benefit is that, with the help of suitable storage technologies, hydrogen can be used for household consumption since it can be securely delivered by ordinary routes and stored as compressed gas, cryogenic liquid or solid hydride to be supplied to stationary fuel cells.4–6For hydrogen production, a wide range of techniques are available, which may be divided into two groups based on the raw materials used: conventional and renewable technologies. The methods of hydrocarbon reformation and pyrolysis are included in the first category, which processes fossil fuels. Steam reforming, partial oxidation, and autothermal steam reforming are the chemical processes used in the hydrocarbon reforming process. The technologies that manufacture hydrogen from renewable resources, such as biomass or water, fall into the second group. Of course, water is the optimum source of hydrogen especially from the environmental point of view, but the water splitting technology is still far from the wide commercial scale due to the high cost of the required electrical energy.7 On the other hand, the reported photocatalyst for the water photo-splitting process did not satisfy all the requirements.8
Among the reported biomasses, methanol enticed most of the researchers because nickel-based materials, as non-precious electrodes, show good activity toward methanol electro-oxidation.9–11 Actually, nickel-based compounds have been first proposed as non-precious anode materials for alcohol proton exchange membrane fuel cells (APEM FCs) in a number of papers. However, most of these materials, to the best of our knowledge, are not suitable for use in fuel cells because of their high onset potentials.11 Generally, the anode material's onset potential should be less than 0.4 V [vs. NHE]; the usual oxygen reduction potential, because these materials can only endure alkaline media. Unfortunately, the majority of the introduced electrodes do not adhere to this constraint.12 As a result, the researchers chose to use these inexpensive electrodes in hydrogen production from methanol electrolysis with small potential compared to water.13
Ammonium phosphate is created in three forms based on the ammonium content: mono ((NH4)H2PO4), di ((NH4)2HPO4), and tri ((NH4)3PO4) ammonium phosphate.14 The three forms can be industrially synthesized by reaction between phosphate rock and ammonia or nitric acid.15,16 In comparison to mono- and diammonium phosphates, tri ammonium phosphate (TAP) has the highest hydrogen concentration. The hydrogen concentration of tri, di, and mono ammonium phosphate is typically 8.05, 6.82, and 5.22 wt%, respectively.6 In our previous work, a pure hydrogen gas could be effectively extracted from the ammonium phosphates using a Ni/C composite catalyst.1 Compared to methanol, ammonium phosphates are recommended due to non-toxicity and availability at low cost.
A carbon support for functional materials assists in increasing the electroactive surface area, stability, and catalytic activities, and decreasing electrode costs; however, improving the reactant adsorption affinity is the most important advantage. A variety of carbonaceous materials have been used as supports, including carbon black,17 active porous carbon,18 carbon nanotubes (CNTs),19 graphite,20 carbon nanofibers21,22 and graphene.10,23 Graphene is one of the most popular support materials because of its remarkable features, which include excellent mechanical, electrical, and thermal capabilities, chemical stability, and a huge specific surface area.24,25 Graphene can be synthesized by different methods such as mechanical exfoliation,26 chemical reduction10 and chemical vapor deposition (CVD).27 The aforementioned procedures are the most widely used, although they are expensive, provide modest yields, and take a long time. Anchoring oxygenated functional groups on the graphene sheets distinctly enhanced the catalytic activity and this is the main advantage of the chemical-based methodologies over the other techniques.28 Fortunately, graphene can also be made from inexpensive and readily available materials including plastics, dog faeces, cabbage, plants, fruit and vegetable waste, and industrial sugar utilizing relatively easy and low-cost procedures.29–32 Therefore, appropriate treatment of a convenient polymeric material might result in the production of graphene.
In this study, Ni-incorporated and N-doped reduced graphene oxide has been prepared by a simple one-pot procedure. Typically, calcination of a well-mixed nickel acetate/polyvinylpyrrolidone mixture under an inert atmosphere leads to the production of multilayer graphene functionalized by oxygenated groups, simulating the reduced graphene oxide obtained from graphene synthesis procedures through chemical routes. Moreover, due to calcination in a nitrogen atmosphere, the nitrogen present in the polymer chain did not abandon the formed graphene sheets; instead, it was inserted within layers in the form of pyrrolic and pyridinic nitrogen. The prepared catalyst was utilized as an electro-catalyst for tri(ammonium) phosphate oxidation. The results are promising as the electro-oxidation process could be performed successfully and high current density was observed at the optimum nickel concentration. Overall, this new hydrogen-rich substance can be utilized for sustainable hydrogen production using nickel-based electrocatalysts.
2. Experimental
2.1 Materials
Nickel acetate tetrahydrate (Ni(CH3COO)·4H2O, NiAc, 98% assay), polyvinylpyrrolidone (PVP, high molecular weight), methanol, tri(ammonium) phosphate (TAP), isopropyl alcohol, potassium hydroxide (KOH) and Nafion 117 (10 wt%) were purchased from Sigma-Aldrich. These chemicals were used as received without any further treatment. Distilled water was used as the solvent.2.2 Electrocatalyst preparation
First, the PVP stock sol–gel was prepared by dissolving a determined amount of PVP in the corresponding value of DI to get a 12 wt% solution. Later on, NiAc/PVP solutions were prepared by dissolving calculated amounts of NiAc in certain volumes from the prepared PVP stock solution to get solutions having 0, 1, 2, 3, 4, 5, 7 and 10 wt% NiAc. Then, the prepared solutions were dried under atmosphere pressure at 80 °C for 24 h. The acquired hard materials were well crushed and then calcined under a nitrogen atmosphere at 1 atm and 700 °C for 5 h with a heating rate of 2.5 °C min−1.2.3 Characterization
The crystalline structure and internal morphology of the produced catalyst were determined using an X-ray diffractometer (XRD, Rigaku, Japan, Cu K (λ = 1.5406 Å)) and a transmission electron microscope (TEM, JEOL JEM-2010, Japan, operated at 200 kV), respectively. Thermogravimetric analysis was carried out using a TA Instruments Q500 TGA, USA, to study the thermal properties. X-Ray Photoelectron Spectroscopy (XPS, AXIS-NOVA, Kratos analytical Ltd, UK) analysis was used to investigate the surface composition. XPS analysis was carried out under the following conditions: base pressure, 6.5 × 10⁻⁹ torr; resolution (pass energy), 20 eV; and scan step, 0.05 eV per step. Three electrode cells were used to examine the electrochemical characteristics of the produced catalysts. The counter electrode (CE), reference electrode (RE), and working electrode in this cell were Pt, Ag/AgCl, and glassy carbon electrode (GCE), respectively. 2 mg of catalyst was dispersed in 400 μL of isopropanol and 20 μL of Nafion to make catalyst ink. The solution was then sonicated for 30 minutes. The functioning electrode was made by applying 15 μL of catalyst ink three times to the surface of a clean GCE and drying it for 30 minutes at 80 °C. The catalytic activity of the catalyst produced in 1.0 M KOH solution with varied TAP contents (0, 0.01, 0.03, 0.05, 0.07, 0.1, 0.5 g) in 100 ml deionized water was measured using a potentiostat (cyclic voltammetry).3. Results and discussion
3.1 Catalyst characterization
Because it is a crystalline material, XRD is a powerful analytical technique to prove the formation of reduced graphene oxide. For the as-obtained metal-free sample (0% Ni; Fig. 1), a well-resolved diffraction peak of the (002) plane was found at 24.9°, indicating a lattice spacing of 0.36 nm in the generated nickel-free powder. This value is 0.34 nm in crystalline graphite, and the presence of oxygen functional groups is indicated by an increase in the lattice spacing in the produced material.33 Moreover, the obtained broad peak that corresponds to a few layers of rGO sheets in the particles indicates the existence of multilayer domains as well as a few mono-layered rGO sheets.34 Another diffraction peak at 2θ of 44.8° corresponds to the (102) plane of the rGO structure.31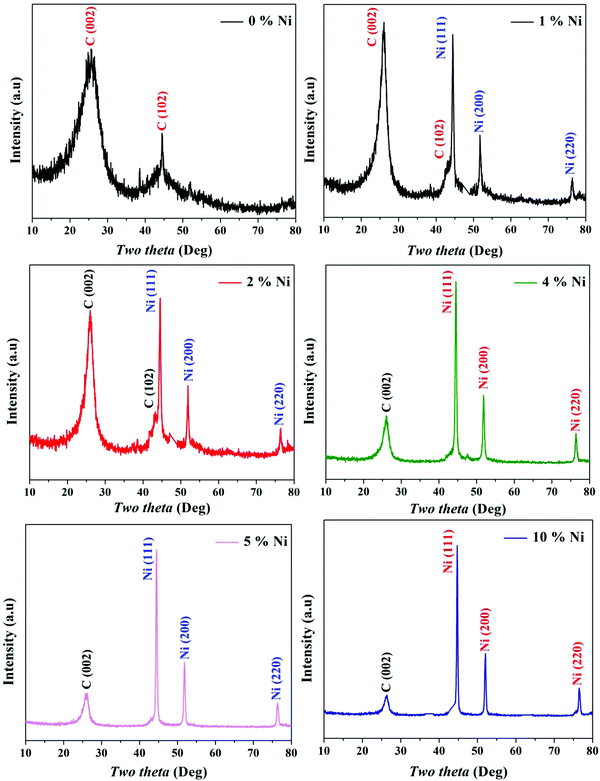 | ||
| Fig. 1 XRD patterns for the prepared Ni-incorporated and N-doped reduced graphene oxide powders at different metal contents, namely, 0, 1, 2, 4, 5 and 10%. | ||
Among the various kinds of nickel salts, several introduced reports have concluded that sintering of nickel acetate in an inert atmosphere leads to the evolution of strong reducing power gases (H2 and CO). As a result, instead of the predicted metal oxide form, this metal salt is entirely reduced to zero-valent nickel.35,36 Moreover, the required calcination temperature for full reduction of the nickel ion was investigated, and it was estimated via thermal gravimetric analysis through this study by authors and others; the results indicated that 700 °C (or higher) calcination temperature is convenient to achieve the task.36–38 This supposition was further proved in this study as shown in the nickel-containing samples in Fig. 1. According to the JCPDS database (Card no. 04-004-6807), the acquired reflections at 2θ values of 44.43°, 51.76° and 76.31°, corresponding to the (111), (200) and (220) crystal planes, confirm the formation of pure nickel. The average crystallite size of the metal nanoparticles was calculated using the Scherer equation:
 | (1) |
| Ni content (%) | 1 | 2 | 3 | 4 | 5 | 7 | 10 |
|---|---|---|---|---|---|---|---|
| Size (nm) | 18.54 | 20.81 | 20.95 | 21.44 | 22.04 | 22.95 | 26.22 |
Our earlier study, as well as past attempts, described the formation of pure metal. According to the following equations, heating nickel acetate salt in an inert environment produces an anomalous breakdown of the acetate anion, resulting in the generation of reducing gases (carbon mono oxide and hydrogen) and pure metal:39–41
 | (2) |
 | (3) |
 | (4) |
 | (5) |
Fig. 2 displays the internal structure as investigated using TEM analysis. Fig. 2A shows that the obtained material is incorporated by different size nickel nanoparticles. On the other hand, the high resolution TEM image (Fig. 2B) indicates the formation of multiple layers of reduced graphene oxide. The loading of oxygen functional groups on the graphene sheets causes surface corrugation, which is connected to localized intrinsic strain.42,43
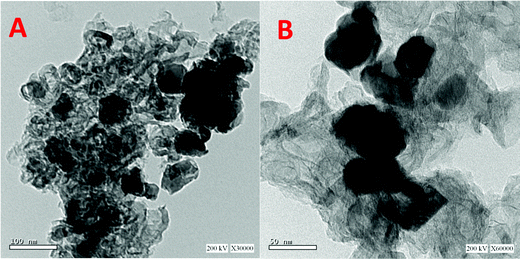 | ||
| Fig. 2 TEM images at two magnifications for the prepared Ni-incorporated & N-doped reduced graphene oxide composite (5% Sample). | ||
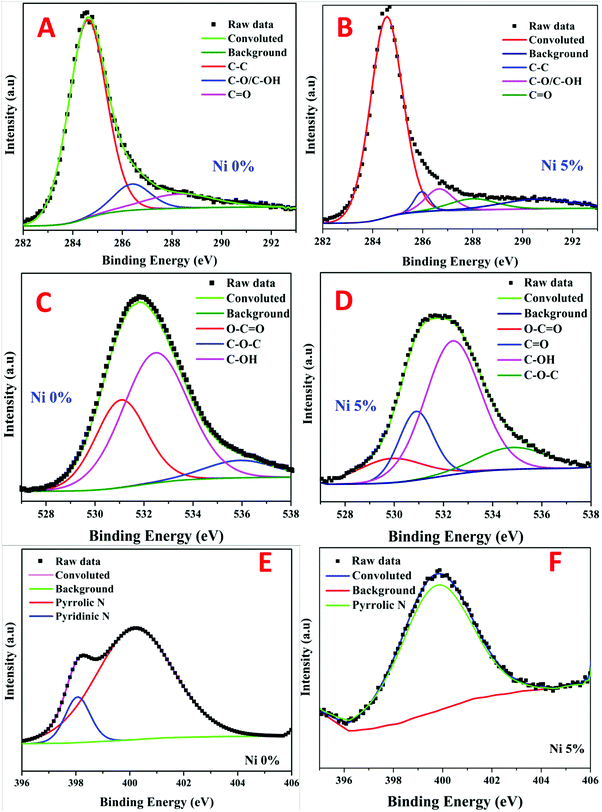
The chemical states of different elements and the presence of functional groups were further evaluated using X-ray photoelectron spectroscopy (XPS). The presence of carbon was mostly visible in the survey scan spectra of all samples with small peaks representing nickel, nitrogen and oxygen (the full survey spectra are not shown). The C1s peaks obtained in the survey of the nickel, free and containing (5%), samples were de-convoluted into three chemically shifted segments (Fig. 3a and b).34,44 The first segment was assigned to the non-oxygenated carbon of C–C/C–H representing the graphene structure.33,44 This conclusion is well supported by XRD and TEM analyses. The second segment described the interaction of carbon atoms with oxygen in either hydroxyl (C–OH) or epoxide (C–O) functional groups. The carbonyl (C![[double bond, length as m-dash]](https://www.rsc.org/images/entities/char_e001.gif) O) was identified in the third segment, which corresponds to the carbon functionalized in COOH. It is worth mentioning that the ratio of the C–C peak intensity to the sum of the second and third peak intensities became very small upon the existence of nickel which indicates a higher content of oxygen functionalities in the nickel-containing sample. This is presumably associated with the known catalytic activity of nickel nanoparticles. In other words, the presence of nickel results in catalyzing C–O bond formation reactions.
O) was identified in the third segment, which corresponds to the carbon functionalized in COOH. It is worth mentioning that the ratio of the C–C peak intensity to the sum of the second and third peak intensities became very small upon the existence of nickel which indicates a higher content of oxygen functionalities in the nickel-containing sample. This is presumably associated with the known catalytic activity of nickel nanoparticles. In other words, the presence of nickel results in catalyzing C–O bond formation reactions.
Deconvolution of the singlet O1s peaks into distinct segments was used to look into the phenolic functional groups. As shown in the metal-free rGO (Fig. 3C), three segments are observed, namely, C![[double bond, length as m-dash]](https://www.rsc.org/images/entities/char_e001.gif) O (oxygen double bond to aromatic carbon), C–O (oxygen single bond to carbon), and C–OH (carbon single bond to the hydroxyl group). On the other hand, besides the aforementioned three groups, the presence of nickel results in having a new oxygenated group (C–O–C) as shown in Fig. 3D. Moreover, incorporation of nickel nanoparticles results in chemical shifting of similar peaks from 531.1, 535.9, and 532.5 eV to 529.87, 530.89 and 532.38 eV for the Ni-free and -containing samples, respectively. This finding suggests lower binding energies and higher electronic charges on the oxygen atoms. Overall, the phenolic (C–OH) group is the dominant oxygenated group in both formulations. However, besides the appearance of the carbonyl (C
O (oxygen double bond to aromatic carbon), C–O (oxygen single bond to carbon), and C–OH (carbon single bond to the hydroxyl group). On the other hand, besides the aforementioned three groups, the presence of nickel results in having a new oxygenated group (C–O–C) as shown in Fig. 3D. Moreover, incorporation of nickel nanoparticles results in chemical shifting of similar peaks from 531.1, 535.9, and 532.5 eV to 529.87, 530.89 and 532.38 eV for the Ni-free and -containing samples, respectively. This finding suggests lower binding energies and higher electronic charges on the oxygen atoms. Overall, the phenolic (C–OH) group is the dominant oxygenated group in both formulations. However, besides the appearance of the carbonyl (C![[double bond, length as m-dash]](https://www.rsc.org/images/entities/char_e001.gif) O) group, the presence of nickel nanoparticles led to the enhancement of the oxygen atom insertion inside the carbon network as the C–O–C/O–C
O) group, the presence of nickel nanoparticles led to the enhancement of the oxygen atom insertion inside the carbon network as the C–O–C/O–C![[double bond, length as m-dash]](https://www.rsc.org/images/entities/char_e001.gif) O peak ratio increased from 0.198 to 1.553 for the Ni-free and -containing samples, respectively. Therefore, it can be claimed that the presence of nickel nanoparticles enhances the oxidation of the reduced graphene oxide.
O peak ratio increased from 0.198 to 1.553 for the Ni-free and -containing samples, respectively. Therefore, it can be claimed that the presence of nickel nanoparticles enhances the oxidation of the reduced graphene oxide.
N-Vinylpyrrolidone (the monomer of the used PVP polymer) consists of a 5-membered lactam linked to a vinyl group. Accordingly, the nitrogen atom is a main constituent in the polymer chain. Fig. 3E and F confirms the presence of the remaining nitrogen atoms after the proposed calcination process. Typically, deconvolution of the singlet N1s peaks results in the appearance of pyrrolic and pyridinic nitrogen in the case of the nickel-free sample. However, only pyrrolic nitrogen could be observed due to metal-incorporation. Therefore, similar to oxygen, nickel forced nitrogen to be inserted inside the carbon atom network.
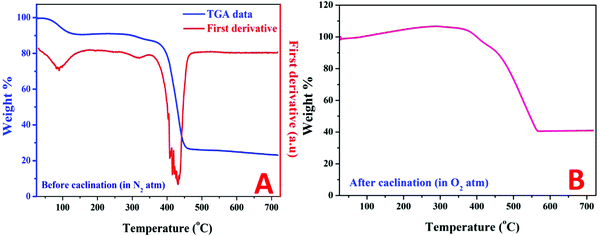
Thermal gravimetric analysis (TGA) can help in understanding the changes in the sample weight during the calcination process. Moreover, the first derivatives of TGA data can strongly detect the variations in main temperatures. Fig. 4A displays the TGA pattern along with the first derivatives for the original NiAC/PVP mixture (5 wt% sample) under a nitrogen atmosphere. As shown in the figure, a little decrease in the weight started at ∼71 °C and continued until 140 °C which reflects a clear peak in the first derivative plot at ∼88 °C. This slight decrease in weight can be explained as evaporation of the physical and the bonded with the metal precursor (nickel acetate tetrahydrate) waters. Later on, a relatively no weight change was observed until the appearance of another small peak at 311.7 °C in the first derivative chart, representing a further decrease in weight. This peak is attributed to the decomposition of nickel acetate according to eqn (2)–(5).39–41 Then, polymer degradation tends to have a sudden and sharp decrease in weight which is represented by a high intensity peak in the first derivative plot at 432.5 °C. Finally, a trivial change in weight can be observed which cannot be detected in the first derivative chart. Fig. 4B depicts the TGA pattern of the obtained Ni-incorporated rGO (5 wt% sample) under an oxygen atmosphere. The gradual increase in weight is understandable as it represents the oxidation of nickel by oxygen in the surrounding atmosphere. Later on, the combustion of the carbonaceous materials results in a high decrease in weight. Finally, the absence of any combustible substances and the high thermal stability of the formed oxide (NiO) give steadiness for weight with the temperature change. As shown in the figure, the last weight percentage of the remaining sample is about 41.6%. It is difficult to expect the reduced graphene oxide to withstand any amount at 700 °C under an oxygen atmosphere; instead, complete combustion of the carbonaceous material is highly predicted. Then, it is safe now to claim that the remaining mass is mainly nickel oxide. Therefore, a simple calculation can be performed to estimate the nickel content in the initial Ni-incorporated and N-doped rGO. Accordingly, the nickel contents in all samples were estimated and are summarized in Table 2. Accordingly, as can be concluded from the TGA results, nickel was formed before polymer degradation so it is believed that the formed Ni NPs catalyzed the formation of more oxygenated groups and showed enhanced nitrogen doping.
| NiAc in the original mixture (%) | 1 | 2 | 3 | 4 | 5 | 7 | 10 |
|---|---|---|---|---|---|---|---|
| Ni in the final powder (%) | 8.26 | 15.39 | 21.61 | 27.08 | 31.93 | 40.16 | 49.76 |
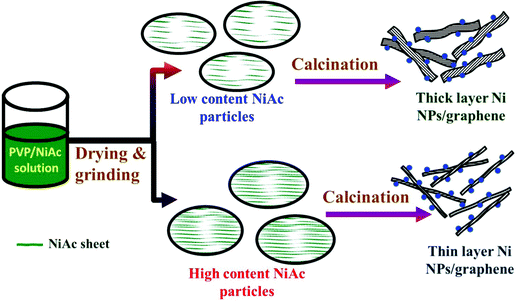
The surface areas of the prepared composites have been determined using a BET surface area analyzer (Microtrac, USA) based on Brunauer, Emmett and Teller theory. Table 3 summarizes the obtained results. As shown, increasing the nickel acetate content in the initial PVP/NiAc solution resulted in enlarging the total surface area of the produced Ni/rGO composite. However, the 3% metal precursor content is considered a threshold as a little enhancement in the surface area was obtained in the cases of 1 and 2% samples while a considerable change was starting from 3% NiAc. Therefore, it can be hypothesized that increasing the metal precursor content leads to a decrease in the thickness of the produced reduced graphene oxide layers, resulting in an increase of the produced surface area. To clearly understand the aforementioned hypothesis, Fig. 5 presents a conceptual illustration of the preparation mechanism of the proposed electrocatalyst. Briefly, an increase in the NiAc content in the mother solution shows the presence of this precursor in the form of numerous very thin films inside the dried PVP/NiAc fine particles. Accordingly, due to the formation of many gases upon decomposition of this metal acetate, a thin layer of rGO is produced as is illustrated in the figure.
| NiAc in the original mixture (%) | 0 | 1 | 2 | 3 | 4 | 5 |
|---|---|---|---|---|---|---|
| Surface area (m2 g−1) | 0.0121 | 2.4894 | 2.5145 | 17.6089 | 60.9066 | 91.7411 |
3.2 Electrocatalytic activity
 | (6) |
The second redox reaction can be seen on the positive potential side; the matching peaks are conspicuous and are due to the redox Ni(OH)2/NiOOH transition (eqn (7)).46–48
 | (7) |
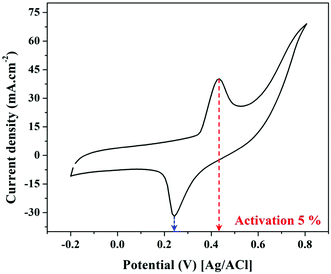
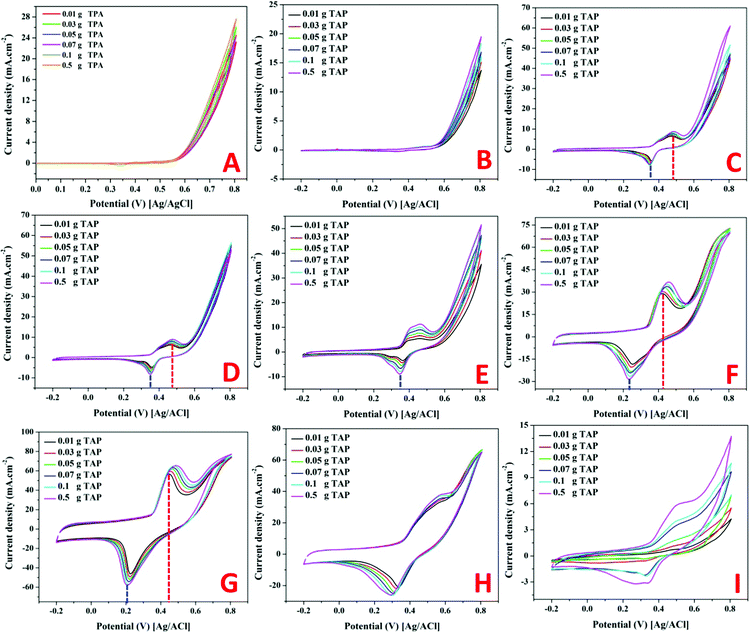
Increasing the number of potential sweeps produces an increase in the peak current density, leading to the eventual formation of a thicker Ni(OOH) layer due to the entry of hydroxide ions into the Ni(OH)2 surface layer.45 The redox peaks corresponding to the Ni(OH)2/Ni(OOH) transition are clearly visible in Fig. 6 as illustrated, at around 0.235 and 0.431 V. As a result, it can be said that the produced catalyst has been coated with a thin coating of Ni(OOH)/Ni(OH)2 and is ready to catalyze electro-oxidation processes.
As shown in the remaining panels in Fig. 7, the electrocatalytic activity of the Ni-containing composites mainly depends on the metal content. For 1 and 2 wt% samples (Fig. 7C and D), clear redox peaks appear with a considerable shift from the Ni(OH)2/Ni(OOH) transformation peaks. Typically, the oxidation and reduction peaks of the Ni(OH)2/Ni(OOH) transformation are observed at 0.431 and 0.235 V, respectively. However, the oxidation and reduction peaks in the cases of utilizing 1 and 2 wt% samples as electrodes for TAP oxidation appeared at 0.491 and 0.482 V, and 0.375 and 0.371 V, respectively. That means more energy was required to perform the redox reaction representing these peaks compared to that required for the simple Ni(OH)2/Ni(OOH) transformation. However, the generated current densities are relatively small with these two electrodes with a small impact on the TAP solution concentration. No considerable change in the peak current with the TAP concentration change infers that the reaction kinetics is the main controlling step in the oxidation process using these electrodes.
Increasing the nickel acetate content in the original NiAc/PVP solution to 3 wt% did not enhance the generated current compared to the first two formulations; however, the oxidation peak became wide with a flat head starting from 0.395 V and ending at 0.491 V as shown in Fig. 7E. Moreover, increasing the TAP content shows an observable increase in the current density.
The second two electrodes (4 and 5 wt% samples; Fig. 7F and G, respectively) show high peak current densities (especially 5 wt% electrode) with Gaussian shaped peaks. Furthermore, for the electrodes displaying high current densities, the peak potentials are close to Ni(OH)2/Ni(OOH) transformation peaks while a negative shift can be seen in the reduction peak of the 4 wt% electrode. Also, for both formulations, the oxidation peak potential moves to the positive direction upon increasing the TAP concentration. The faradaic current is a direct measure of the rate of the electrochemical reaction at the electrode surface in general. Furthermore, the pace at which the material moves from the bulk of the solution to the electrode affects the current. Diffusion occurs satisfactorily at low TAP concentrations, while the diffusion process is disturbed at high concentrations. In this situation, mass transportation will be disrupted; thus, to compensate for these issues and restore mass transport, the electrochemical system would apply additional potential, shifting the peak potential.49
Close to the behavior of the 3 wt% electrode (Fig. 6E), the electrode prepared from an original NiAc/PVP solution containing 7 wt% metal precursors strongly supports the TAP electrooxidation process as the behavior resembles the electrooxidation of alcohols over the Ni-based electrodes, Fig. 7H.11,50 The obtained ascended peak indicates the oxidation of a substance and other formed intermediates from the oxidation reactions.51 In the same fashion, the last electrode (10 wt%; Fig. 7I) confirms the electrooxidation of TAP over the proposed electrodes. However, there is a distinct dependence on the TAP concentration as shown in the figure; there is a high improvement in the generated current density upon increasing the TAP content in the electrolyte solution which concludes that the mass transfer process is the main controlling step for the electrooxidation of TAP over this electrode. This finding reflects the high catalytic activity of the used electrode. Moreover, it is worth mentioning that TAP is an ionic compound, so adsorption is an important operation in the electrocatalytic oxidation process. Therefore, pristine nickel does not have activity because it does not have adsorption capacity and the Ni-free catalyst does not have catalytic activity. Consequently, both formulations did not exhibit electrocatalytic activity toward TAP oxidation.
3.3 Electro-oxidation mechanism
Because this is the first time TAP electro-oxidation has been discussed in the literature, the electro-oxidation mechanism will be anticipated using the obtained data and analogous to the electro-oxidation of other substances. Chemical tests revealed that hydrogen may be recovered from TAP with the generation of nitric and phosphoric acids as byproducts, according to a previous study.53 TAP is a rather complicated molecule; hence its electro-oxidation process is unlikely to follow a straightforward path. As shown in the previous sections, in the case of nickel-containing electrodes and at 50 mV s−1 scan rate, the electro-oxidation of TAP accompanied redox peaks around those representing Ni(OH)2/Ni(OOH) transformation. Therefore, it can be expected that Ni(OH)2 and Ni(OOH) are reactants and/or products in the TAP electrooxidation reactions. Consequently, the electro-oxidation reactions can be explicated as follows: | (8) |
 | (9) |
The overall orders of the TAP electrooxidation reactions were estimated by detecting the algebraic model describing the rate of the concentration change. However, due to the difficulty in utilizing the TAP concentration change because it is too small to be monitored analytically, hydrogen production rate, which was estimated from the current density, was exploited in the kinetic calculations. The overall orders of TAP electro-oxidation reactions were determined from the following equations:
 | (10) |
 | (11) |
Integration of this equation is based on the order of reaction n as follows:
 | (12) |
 | (13) |
Table 4 summarizes the obtained overall order of reaction values according to the highest R-squared factor (R2; it indicates the percentage of the variance in the dependent variable that the independent variables explain collectively). As shown, almost the overall order of reactions for all formulations is zero. This finding is understandable due to the very small size of the used catalyst compared to the amount of the TAP concentration.
| NiAc in the original mixture (%) | 1 | 2 | 3 | 4 | 5 | 7 | 10 |
|---|---|---|---|---|---|---|---|
| k | 0 | 0 | 0.4 | 0 | 0 | 0.5 | 0.3 |
Understanding the effects of the scan rate will help in better grasping the peculiarities of redox processes. The difference between the potentials of the oxidation and reduction peaks (ΔEp), for example, is independent of the scan rate for rapid electron transport in reversible electrochemical processes. Increasing (ΔEp) values as a function of the scan rate, on the other hand, shows the presence of electrochemical irreversibility.54 Furthermore, given reversible electron transfer processes in both directions, the peak current recorded for the return potential scan should be identical to that observed for the forward potential scan if the product is stable on the time scale of the experiment. As a result, redox peaks appear in both the forward and reverse directions for simple electrochemical reactions at any scan rate; the nature of the reaction may be determined from the peak potentials and current densities.55
Fig. 9 shows the effect of changing the scan rate on the electrocatalytic activity of a 5 wt% electrode for TAP oxidation (0.5 g). The redox peaks are clearly visible at low scan rates, as seen in the figure, indicating that relatively simple oxidation processes are taking place at low electron transfer rates. However, if the scan rate is increased, the peaks get wider, implying that numerous reactions can be carried out concurrently while the electron transfer rates are increased. Furthermore, the peaks totally vanish at high scan rates (500 mV s−1) with very low onset potentials. As a result, at high scan rates, it can be said that the electro-oxidation mechanism does not follow the given equations (eqn (8) and (9)). In other words, the proposed mechanism is only trustable at low scan rates. Finally, the change in scan rate analysis shows that if TAP electro-oxidation is carried out at high scan rates over the suggested Ni-incorporated and N-doped reduced graphene oxide electrode, a minimal bias is required and the hydrogen gas produced is high due to the high current density generated.
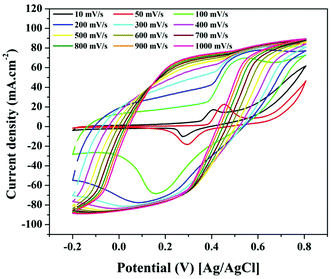 | ||
| Fig. 9 Effect of the scan rate on the cyclic voltammogram of the electro-oxidation of TAP using Ni-incorporated and N-doped graphene oxide (5 wt% sample). | ||
Overall, this study calls researchers' attention to ammonium phosphate fertilizer as a cheap, plentiful, and practical chemical for hydrogen production in small bias-electrolysis cells utilizing nickel-based electrodes.
4. Conclusions
A Ni-incorporated and N-doped reduced graphene oxide electrode can be prepared by sintering a well-mixed polyvinylpyrrolidone polymer and nickel acetate mixture under an inert atmosphere at elevated temperature. Decomposition of the metal acetate results in producing reducing gases (hydrogen and carbon mono-oxide gases) that lead to the complete reduction of the metal salt to zero-valent nickel. The formation of nickel nanoparticles catalyzes the decomposition of the polymer as it results in improving the functionalization of the graphene sheet by several kinds of oxygenated groups as well as doping the carbon support by pyrrolic nitrogen. The electro-oxidation of tri(ammonium) phosphate can be done with the proposed Ni-incorporated and N-doped reduced graphene oxide electrodes. However, in order to get the highest current density, the nickel content must be tuned; the ideal amount is that corresponds to the original nickel acetate/polyvinylpyrrolidone solution containing a 5 wt% metal precursor. Overall, the idea of this study is still in its early stages; further effort is required to develop innovative nickel-based electrocatalysts that will increase hydrogen production from ammonium phosphates.Conflicts of interest
There are no conflicts to declare.References
- B. M. Thamer, M. H. El-Newehy, S. S. Al-Deyab, M. A. Abdelkareem, H. Y. Kim and N. A. Barakat, Appl. Catal., A, 2015, 498, 230–240 CrossRef CAS.
- N. A. Barakat, A. Zaki, E. Ahmed, A. Farghali and F. S. Al-Mubaddel, Int. J. Hydrogen Energy, 2018, 43, 7990–7997 CrossRef CAS.
- P. Nikolaidis and A. Poullikkas, Renewable Sustainable Energy Rev., 2017, 67, 597–611 CrossRef CAS.
- J. Zheng, X. Liu, P. Xu, P. Liu, Y. Zhao and J. Yang, Int. J. Hydrogen Energy, 2012, 37, 1048–1057 CrossRef CAS.
- H. J. Pasman and W. J. Rogers, J. Loss Prev. Process Ind., 2010, 23, 697–704 CrossRef CAS.
- D. Das and T. N. Veziroglu, Int. J. Hydrogen Energy, 2008, 33, 6046–6057 CrossRef CAS.
- M. Carmo, D. L. Fritz, J. Mergel and D. Stolten, Int. J. Hydrogen Energy, 2013, 38, 4901–4934 CrossRef CAS.
- W. Guo, Q. V. Le, A. Hasani, T. H. Lee, H. W. Jang, Z. Luo and S. Y. Kim, Polymers, 2018, 10, 1309 CrossRef PubMed.
- N. A. Barakat, M. A. Abdelkareem, A. Yousef, S. S. Al-Deyab, M. El-Newehy and H. Y. Kim, Int. J. Hydrogen Energy, 2013, 38, 183–195 Search PubMed.
- N. A. Barakat and M. Motlak, Appl. Catal., B, 2014, 154, 221–231 CrossRef.
- N. A. Barakat, M. A. Yassin, F. S. Al-Mubaddel and M. T. Amen, Appl. Catal., A, 2018, 555, 148–154 CrossRef CAS.
- R. A. Hameed and K. El-Khatib, Int. J. Hydrogen Energy, 2010, 35, 2517–2529 CrossRef.
- J.-H. Yang, X. Song, X. Zhao, Y. Wang, Y. Yang and L. Gao, Int. J. Hydrogen Energy, 2019, 44, 16305–16314 CrossRef CAS.
- D. R. Lide, CRC Handbook of Chemistry and Physics, CRC press, 2004 Search PubMed.
- J. Steen, E. H. Aasum, T. Heggeboe and F. Nielsson, Manual of Fertilizer Processing, Fert. Sci. Technol. Ser., 1987, 5, 393–419 CAS.
- A. Magda, R. Pode, C. Muntean, M. Medeleanu and A. Popa, J. Serb. Chem. Soc., 2010, 75, 951–963 CrossRef CAS.
- P. Song, Y. Zhang, J. Pan, L. Zhuang and W. Xu, Chem. Commun., 2015, 51, 1972–1975 RSC.
- F. Su, Z. Tian, C. K. Poh, Z. Wang, S. H. Lim, Z. Liu and J. Lin, Chem. Mater., 2010, 22, 832–839 CrossRef CAS.
- P. Mardle, X. Ji, J. Wu, S. Guan, H. Dong and S. Du, Appl. Catal., B, 2020, 260, 118031 CrossRef CAS.
- M. Chourashiya, S. T. Vindt, A. A. V. Palenzuela, C. M. Pedersen, C. Kallesøe and S. M. Andersen, Int. J. Hydrogen Energy, 2018, 43, 23275–23284 CrossRef CAS.
- N. A. Barakat, M. El-Newehy, S. S. Al-Deyab and H. Y. Kim, Nanoscale Res. Lett., 2014, 9, 1–10 CrossRef CAS PubMed.
- N. A. Barakat, M. Motlak, B.-S. Kim, A. G. El-Deen, S. S. Al-Deyab and A. Hamza, J. Mol. Catal. A: Chem., 2014, 394, 177–187 CrossRef CAS.
- N. A. Barakat, M. Motlak, B. H. Lim, M. H. El-Newehy and S. S. Al-Deyab, J. Electrochem. Soc., 2014, 161, F1194–F1201 CrossRef.
- S. Hossain, A. M. Abdalla, S. B. Suhaili, I. Kamal, S. P. Shaikh, M. K. Dawood and A. K. Azad, J. Energy Storage, 2020, 29, 101386 CrossRef.
- M. Z. Iqbal, A.-U. Rehman and S. Siddique, J. Energy Chem., 2019, 39, 217–234 CrossRef.
- M. Yi and Z. Shen, J. Mater. Chem. A, 2015, 3, 11700–11715 RSC.
- H. C. Lee, W.-W. Liu, S.-P. Chai, A. R. Mohamed, C. Voon, U. Hashim, M. M. Arshad, P. Adelyn, A. Huda and S. Kahar, Procedia Eng., 2017, 184, 460–468 CrossRef CAS.
- A. G. El-Deen, N. A. Barakat and H. Y. Kim, Desalination, 2014, 344, 289–298 CrossRef CAS.
- G. Ruan, Z. Sun, Z. Peng and J. M. Tour, ACS Nano, 2011, 5, 7601–7607 CrossRef CAS PubMed.
- O. Akhavan, K. Bijanzad and A. Mirsepah, RSC Adv., 2014, 4, 20441–20448 RSC.
- S. S. Gupta, T. S. Sreeprasad, S. M. Maliyekkal, S. K. Das and T. Pradeep, ACS Appl. Mater. Interfaces, 2012, 4, 4156–4163 CrossRef CAS PubMed.
- R. Wang, X. Wang, X. Li, L. Pei, X. Gu and Z. Zheng, Int. J. Hydrogen Energy, 2021, 46, 197–208 CrossRef CAS.
- B. Gupta, N. Kumar, K. Panda, V. Kanan, S. Joshi and I. Visoly-Fisher, Sci. Rep., 2017, 7, 1–14 CrossRef CAS PubMed.
- S. Pei and H.-M. Cheng, Carbon, 2012, 50, 3210–3228 CrossRef CAS.
- J. C. De Jesus, I. González, A. Quevedo and T. Puerta, J. Mol. Catal. A: Chem., 2005, 228, 283–291 CrossRef CAS.
- N. A. Barakat, B. Kim and H. Y. Kim, J. Phys. Chem. C, 2009, 113, 531–536 CrossRef CAS.
- M. Afzal, P. Butt and H. Ahmad, J. Therm. Anal., 1991, 37, 1015–1023 CrossRef.
- N. A. Barakat, M. Motlak, A. A. Elzatahry, K. A. Khalil and E. A. Abdelghani, Int. J. Hydrogen Energ, 2014, 39, 305–316 CrossRef CAS.
- N. A. Barakat, K. A. Khalil, I. H. Mahmoud, M. A. Kanjwal, F. A. Sheikh and H. Y. Kim, J. Phys. Chem. C, 2010, 114, 15589–15593 CrossRef CAS.
- C. Juan, J. Mol. Catal. A: Chem., 2005, 228, 283–291 CrossRef.
- N. A. Barakat, B. Kim, C. Yi, Y. Jo, M.-H. Jung, K. H. Chu and H. Y. Kim, J. Phys. Chem. C, 2009, 113, 19452–19457 CrossRef CAS.
- J. W. Suk, R. D. Piner, J. An and R. S. Ruoff, ACS Nano, 2010, 4, 6557–6564 CrossRef CAS PubMed.
- D. R. Dreyer, S. Park, C. W. Bielawski and R. S. Ruoff, Chem. Soc. Rev., 2010, 39, 228–240 RSC.
- L. Stobinski, B. Lesiak, A. Malolepszy, M. Mazurkiewicz, B. Mierzwa, J. Zemek, P. Jiricek and I. Bieloshapka, J. Electron Spectrosc. Relat. Phenom., 2014, 195, 145–154 CrossRef CAS.
- A. Rahim, R. Abdel Hameed and M. Khalil, J. Power Sources, 2004, 134, 160–169 CrossRef.
- M. Fleischmann, K. Korinek and D. Pletcher, J. Electroanal. Chem. Interfacial Electrochem., 1971, 31, 39–49 CrossRef CAS.
- M. Vuković, J. Appl. Electrochem., 1994, 24, 878–882 CrossRef.
- O. Enea, Electrochim. Acta, 1990, 35, 375–378 CrossRef CAS.
- M. Giz and G. Camara, J. Electroanal. Chem., 2009, 625, 117–122 CrossRef CAS.
- N. R. Stradiotto, K. E. Toghill, L. Xiao, A. Moshar and R. G. Compton, Electroanalysis, 2009, 21, 2627–2633 CrossRef CAS.
- C. J. Weiss, P. Das, D. L. Miller, M. L. Helm and A. M. Appel, ACS Catal., 2014, 4, 2951–2958 CrossRef CAS.
- N. A. Barakat, M. A. Yassin, A. S. Yasin and S. Al-Meer, Int. J. Hydrogen Energ, 2017, 42, 21741–21750 CrossRef CAS.
- N. A. Barakat, E. Ahmed, M. A. Abdelkareem, T. Farrag, S. Al-Meer, S. Al-Deyab, K. Elsaid and M. Nassar, Int. J. Hydrogen Energy, 2015, 40, 10103–10110 CrossRef CAS.
- E. Kusmierek, Electrocatalysis, 2020, 11, 555–566 CrossRef CAS.
- E. S. Rountree, B. D. McCarthy, T. T. Eisenhart and J. L. Dempsey, Inorg. Chem., 2014, 53, 9983–10002 CrossRef CAS PubMed.
Footnote |
| † These two authors contributed equally. |
| This journal is © The Royal Society of Chemistry 2022 |

