 Open Access Article
Creative Commons Attribution 3.0 Unported Licence
Realization of the dehydrogenation pathway of formic acid oxidation by ultra-small core–shell Au–Pt nanoparticles with discrete Pt shells†
Yi
Cao‡
a,
Xiang
Zhang‡
a,
Xinru
Yue
a,
Mengmeng
Zhang
a,
Wei
Du
 b and
Haibing
Xia
 *a
*a
aState Key Laboratory of Crystal Materials, Shandong University, Jinan, 250100, P. R. China. E-mail: hbxia@sdu.edu.cn
bSchool of Environment and Material Engineering, Yantai University, Yantai 264005, P. R. China
First published on 7th February 2022
Abstract
In this work, ultra-small core–shell Au–Pt nanoparticles with discrete Pt shells (denoted as USCSD Au–Pt NPs) were successfully prepared by Fe(II)-assisted one-pot co-reduction of Au(III) ions and an ultra-low concentration of Pt(II) ions in citrate solution. In the as-prepared USCSD Au–Pt NPs, the Pt atoms on their outer surfaces are effectively isolated by Au atoms (denoted as a discrete shell, CSD). Furthermore, the as-prepared USCSD Au–Pt NPs are determined to be USCSD Au61.2@Au27.3Pt11.5 NPs with an average size of 2.3 nm using a number of characterization techniques, including transmission electron microscopy (TEM), energy dispersive X-ray spectroscopy (EDS), cyclic voltammetry (CV), CO stripping voltammetry and X-ray photoelectron spectroscopy (XPS). Moreover, the as-prepared USCSD Au61.2@Au27.3Pt11.5-NP/C catalysts towards the formic acid oxidation reaction (FAOR) proceed through the direct pathway (dehydrogenation). In addition, their mass activity and specific activity towards the FAOR are 6.91 A mgPt−1 and 4.88 mA cm−2, which are about 16.8 and 7.33 times higher than those (0.4 A mgPt−1 and 0.67 mA cm−2) of commercial Pt/C catalysts, respectively.
1. Introduction
It is well known that the catalytic performance of electrocatalysts is highly dependent on their composition, structure and morphology.1–3 Moreover, the same electrocatalysts may show different catalytic performances for different reactions. For instance, in our previous work, ultra-small core–shell Au–Pt nanoparticles (denoted as USCS Au–Pt NPs) with Au-decorated Pt surfaces were successfully prepared.4 Furthermore, they exhibited improved electrocatalytic performance towards the HER and ORR in acidic media, compared with commercial Pt/C catalysts. However, their performance towards the formic acid oxidation reaction (FAOR) is not satisfactory (Fig. S1, ESI†). In the as-prepared USCS Au–Pt NPs, Pt atoms on the outer surfaces are almost continuous and doped with a small fraction of Au atoms, which are demonstrated by their CO stripping voltammograms. Accordingly, they exhibit strong adsorption toward the CO species, which are the main intermediates produced from the indirect pathway (dehydration of formic acid) in the FAOR, thus leading to the loss of active sites on the surfaces.5–10Meanwhile, it is known that Au has good anti-poison ability to CO.11–13 Therefore, continuous Pt atoms on the outer surfaces are well dispersed by a high fraction of Au atoms, which would display an improved anti-poison ability to CO due to the decreasing density of Pt atoms and the presence of Au atoms.14–17 In addition, the formation of atomically dispersed Pt atoms on the outer surfaces of Au–Pt NPs would promote the direct pathway (dehydrogenation of formic acid), thus improving the catalytic performance towards the FAOR.18–20 Note that although Au would not directly involve the FAOR, the presence of Au can improve the anti-poison ability of Pt to CO and further enhance their FAOR performance.
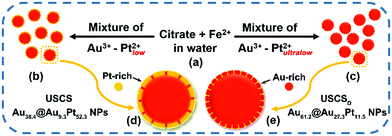
In this work, ultra-small core–shell structured Au–Pt nanoparticles with discrete Pt shells (denoted as USCSD Au–Pt NPs) were first synthesized on the basis of our previous work (Scheme 1).4 Accordingly, USCS Au38.4@Au9.3Pt52.3 NPs with Pt-rich shells obtained in previous work (Schemes 1b and d) can become USCSD Au61.2@Au27.3Pt11.5 NPs with Au-rich shells (Schemes 1c and e) by just reducing the concentration of Pt(II) ions in the reaction mixture solution in the presence of citrate and Fe ions (Scheme 1a), since the concentration of Au(III) ions remains constant and the number and size of in situ Au cores also keep unchanged. In our case, due to the weaker reducing ability of citrate, Fe(II) ions and citrate ions mainly act as the reductant and the stabilizer, respectively.4 The optimal concentration of Pt(II) ions for the formation of USCSD Au61.2@Au27.3Pt11.5 NPs with optimal electrocatalytic performance towards the formic acid oxidation reaction (FAOR) in acidic media was investigated in an ultralow concentration range. Then, the size, composition and structure of the as-prepared USCSD Au61.2@Au27.3Pt11.5 NPs were characterized by transmission electron microscopy (TEM), energy dispersive X-ray spectroscopy (EDS), cyclic voltammetry (CV), CO stripping voltammetry and X-ray photoelectron spectroscopy (XPS) measurements. Lastly, the electrocatalytic performance of USCSD Au61.2@Au27.3Pt11.5 NP/C catalysts (USCSD Au61.2@Au27.3Pt11.5 NPs loaded on carbon black) as well as commercial Pt/C catalysts and USCS Au38.4@Au9.3Pt52.3-NP/C catalysts towards the FAOR was investigated in acidic media for comparison.
2. Experimental
2.1 Synthesis of USCSD Au–Pt NPs
USCSD Au61.2@Au27.3Pt11.5 NPs with discrete Pt shells were prepared as follows. Firstly, 1.0 mL of sodium citrate (1 wt%) and 130 μL of FeSO4·7H2O (0.05 M) were sequentially added into 47.0 mL of boiling water in a two-neck bottle, followed by the quick addition of 2.0 mL of the mixture solution containing HAuCl4 (30 μL, 1 wt%) and K2PtCl4 (4 μL, 1 wt%), which was premixed just for 1 minute at room temperature before its addition. Then, the above mixture solution in the two-neck bottle was further boiled for 30 minutes with stirring to confirm the formation of uniformly quasi-spherical USCSD Au61.2@Au27.3Pt11.5 NPs. Eventually, the color of the reaction mixture solution in the two-neck bottle was pale yellow. In our case, Fe(II) ions are oxidized into Fe(III) ions by Pt(II) ions and Au(III) ions. Accordingly, the Fe species in the solution would be Fe(III) ions and the remaining Fe(II) ions. Therefore, there is hardly any Fe species in the final USCSD Au61.2@Au27.3Pt11.5 NPs. Moreover, both Fe(III) ions and Fe(II) ions can be washed away during the fabrication of USCSD Au61.2@Au27.3Pt11.5-NP/C catalysts. For the sake of a better comparison with commercial Pt/C catalysts, the as-prepared USCSD Au61.2@Au27.3Pt11.5 NPs were also loaded onto carbon black (Cabot, Vulcan XC-72R) with a Pt loading of ∼20% as catalysts (named USCSD Au61.2@Au27.3Pt11.5-NP/C catalysts). The detailed preparation procedure is as follows. Firstly, the suspension of carbon black post-treatment was added into the dispersion solution of USCSD Au61.2@Au27.3Pt11.5 NPs, followed by ultrasonication for 1 h at room temperature and centrifugation treatment twice (at 10000 rcf for 10 min) and drying at 80 °C.2.2 Electrochemical measurements
Before the FAOR test, all the electrolytes were purged with N2 for 30 min and bubbled all the time during the whole test. Cyclic voltammetry (CV) curves were first recorded in a N2-saturated 0.25 M H2SO4 solution with and without 1.0 M HCOOH by cycling between −0.22 and 1.48 V (vs. Ag/AgCl) at a scan rate of 50 mV s−1. The chronoamperometric (CA) tests of all the catalysts were performed at 0.3 V (vs. Ag/AgCl) in a N2-saturated 0.25 M H2SO4 solution containing 1.0 M HCOOH for 1000 s.3. Results and discussion
3.1 Synthesis and characterization of USCSD Au61.2@Au27.3Pt11.5 NPs
Firstly, a series of concentrations of Pt(II) ions were investigated in the ultralow concentration range between 1.46 and 2.43 μM for synthesis of USCSD Au–Pt NPs on the basis of our previously reported procedure.4 After their successful preparation, the as-prepared Au–Pt NPs were loaded on Vulcan XC-72R carbon black as catalysts for evaluation of their electrocatalytic performance towards the FAOR. In these tests, their forward scanning voltammograms were measured in the potential range of −0.2 to 1.0 V (vs. Ag/AgCl) and their mass activity was normalized by the amount of Pt loaded on the working electrode (Fig. 1). The dehydrogenation and dehydration of formic acid are named the direct pathway and indirect pathway, respectively. Although the final products obtained through the two pathways are the same (CO2), the active intermediates are totally different. HCOOH is directly electrooxidized into CO2via the active intermediates (HCOOads) through the direct pathway, while HCOOH is electrooxidized into CO2via COads through the indirect pathway. Since Pt has a strong absorption ability to CO, the low ratio of Pt on the surfaces of the USCSD Au–Pt NP/C catalysts would favor the occurrence of the FAOR through the direct pathway, instead of through the indirect pathway. Meanwhile, the peak potentials in the CV curves of the FAOR through the different pathways should be different. Moreover, the FAORs through the two pathways occur simultaneously and are competitive. Therefore, the main pathway during the FAOR can be identified by the relative peak intensity at the two potentials for the occurrence of the FAOR through the direct pathway and the indirect pathway. Accordingly, the CV curves of the FAOR with peak potentials centered at about 0.28 V should follow the direct pathway (Fig. 1), while those with peak potentials centered at about 0.7–0.8 V should follow the indirect pathway (Fig. S1, ESI†).21–23 It can be seen that, with the decrease of the concentration of Pt(II) ions, their mass activity first increases from 5.12 to 6.91 A mgPt−1 and then decreases to 4.24 and 0.98 A mgPt−1 (Fig. 1 and Table S1, ESI†). Thus, the USCSD Au–Pt–NP/C catalysts prepared at a concentration of Pt(II) ions of 1.95 μM (sample b in Fig. 1) show the largest mass activity. As for the same type of FAOR, the catalysts have the largest mass-normalized current density towards the FAOR, indicating that they display optimal performance. Accordingly, the optimum Pt precursor content should be the one used for their synthesis. Thus, the optimum Pt precursor content is 1.95 μM.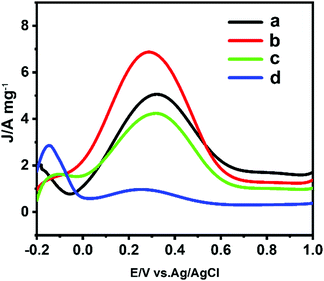 | ||
| Fig. 1 Mass-normalized current density towards the FAOR of a series of Au–Pt NP/C catalysts prepared at different Pt(II) ion concentrations: 2.43 μM (a), 1.95 μM (b), 1.70 μM (c), and 1.46 μM (d). | ||
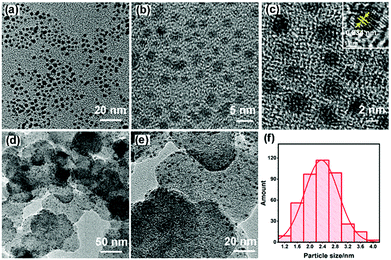
In the low magnification TEM images, the as-prepared USCSD Au61.2@Au27.3Pt11.5 NPs are well-dispersed (Fig. 2a and b) and display a relatively broad particle size distribution (Fig. 2f). Furthermore, the as-prepared USCSD Au61.2@Au27.3Pt11.5 NPs with an average size of about 2.3 nm show clear lattice fringes in the high-resolution TEM image (inset in Fig. 2c), indicating their highly crystalline state.24,25 In addition, the lattice spacing is 0.234 nm, which is slightly smaller than that (0.236 nm) of the Au(111) plane due to the presence of Pt.
In addition, on the basis of the EDS results of USCSD Au61.2@Au27.3Pt11.5-NP/C catalysts (Fig. 2d and e), the molar ratio of Pt to Au is about 0.13 (11.5% Pt and 88.5% Au, respectively), which is basically the same as that of Pt precursor-to-Au precursor (0.130). Note that, due to its ultra-small size and the detection limit of HAADF-STEM-EDS mapping, the cross-sectional compositional line profile of a single USCSD Au61.2@Au27.3Pt11.5 NP cannot be obtained.
3.2 Difference between USCS Au38.4@Au9.3Pt52.3 NPs and USCSD Au61.2@Au27.3Pt11.5 NPs
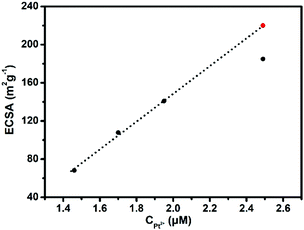
To be honest, it is hard to differentiate between USCS Au38.4@Au9.3Pt52.3 NPs and USCSD Au61.2@Au27.3Pt11.5 NPs. Fortunately, the electrochemical measurement is a surface-sensitive testing method, which allows us to identify the difference between them. On the basis of their CVs (Fig. S2, ESI†), their ECSA values were calculated accordingly, which are shown in Fig. 3 and listed in Table S1, ESI.† Since the ECSA value of the USCS Au@Pt NPs is mass-normalized by Pt mass, it would continuously increase before the Au cores are fully covered by one layer of Pt atoms in general. One can clearly see that when the concentration of Pt(II) ions is below 1.95 μM, their ECSA value linearly increases with the increasing concentration of Pt(II) ions (solid points on the dotted line in Fig. 3). When the concentration of Pt(II) ions reaches 2.43 μM, the real ECSA value (separate solid points) is below the theoretical one (the red point on the dotted line in Fig. 3). These results indicate that the surfaces of the as-prepared USCSD Au61.2@Au27.3Pt11.5 NPs are not fully covered by Pt atoms when the concentration of Pt(II) ions is below 1.95 μM. In a word, the Pt atoms on their surfaces are in a certain degree of discontinuity.CO stripping voltammetry of commercial Pt/C catalysts, USCS Au38.4@Au9.3Pt52.3-NP/C catalysts and USCSD Au61.2@Au27.3Pt11.5-NP/C catalysts was further carried out to illustrate the formation of discrete Pt shells by comparison (Fig. 4). Clearly, both the commercial Pt/C catalysts and USCS Au38.4@Au9.3Pt52.3-NP/C catalysts show pronounced and sharp CO oxidation peaks (red and blue curves in Fig. 4). In addition, their positions are both centered at about ∼0.7 V. These results indicate that USCS Au38.4@Au9.3Pt52.3-NP/C catalysts are fully covered by Pt atoms and have a strong adsorption ability for CO. In contrast, the CO oxidation peak of USCSD Au61.2@Au27.3Pt11.5-NP/C catalysts is more diffused from −0.1 to 1.05 V, accompanied by a broader peak from 0.7 to 1.05 V caused by electronic effects between the Au-core and discrete Au-rich Pt shell (the black curve in Fig. 4).10 The results further indicate that the Pt atoms on the surface of the USCSD Au61.2@Au27.3Pt11.5 NPs are not continuous and have a weak adsorption ability for CO, which is consistent with those reported in the literature.26
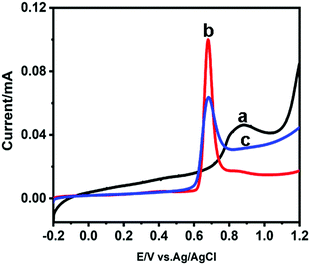 | ||
| Fig. 4 CO stripping voltammograms of USCSD Au61.2@Au27.3Pt11.5-NP/C catalysts (a), commercial Pt/C catalysts (b) and USCS Au38.4@Au9.3Pt52.3-NP/C catalysts (c). | ||
However, the large potential range of the CO-stripping peak of USCSD Au61.2@Au27.3Pt11.5-NP/C catalysts would offset the decreasing adsorption ability for CO due to the increasing amount of adsorption sites, which is indicated by the presence of a broad adsorption potential range for CO (from −0.1 to 1.05 V).10,27 That is, USCSD Au61.2@Au27.3Pt11.5-NP/C catalysts would promote the desorption of intermediate products in the catalytic process towards the FAOR due to the decreasing adsorption ability and make them convert to the direct pathway, thereby enhancing the FAOR catalytic performance.7
3.3. Determination of the elemental composition of USCSD Au61.2@Au27.3Pt11.5 NPs
According to the method reported in our previous work,4,28–31 the bulk composition and surface composition of the USCSD Au–Pt NPs can also be determined by cyclic voltammetry in alkaline media. The surface composition of the as-prepared USCSD Au–Pt NPs can be calculated on the basis of the surface areas of Au and Pt obtained, which can be deduced as follows:where m represents the Pt content and SPt and SAu are the surface areas covered by Pt and Au oxides, respectively.
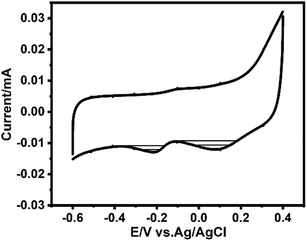
Accordingly, the atomic fractions of elemental Pt and elemental Au in the shell and Au in the core of the as-prepared USCSD Au–Pt NPs were determined to be 11.5 at%, 27.3 at%, and 61.2 at%, respectively, based on the results from their CVs (Fig. 5 and Fig. S3 and Table S2, ESI†). Thus, the composition of the as-prepared USCSD Au–Pt NPs was determined to be USCSD Au61.2@Au27.3Pt11.5 NPs, which have the CS structure with an Au core and a discrete Pt shell.
3.4 XPS characterization of USCSD Au61.2@Au27.3Pt11.5 NPs
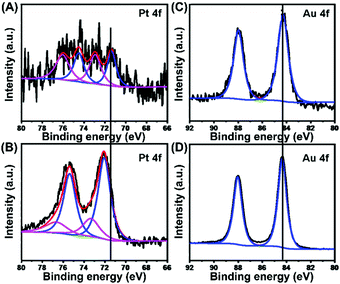
The chemical states of elemental Pt and elemental Au in USCSD Au61.2@Au27.3Pt11.5 NP/C catalysts were further studied by XPS (Fig. 6). On the one hand, the Pt 4f signals in the XPS spectra of USCSD Au61.2@Au27.3Pt11.5-NP/C catalysts are similar to those of commercial Pt/C catalysts (Fig. 6A and B), except that their peak intensity is rather weak due to their low Pt content (Fig. 6A). In addition, the peaks located at 71.4 and 74.5 eV belong to the 4f7/2 and 4f5/2 signals of metallic Pt(0), while the peaks located at 73.0 and 76.1 eV belong to the 4f7/2 and 4f5/2 signals of Pt(II) oxide, respectively. Based on the de-convolution XPS results, the USCSD Au61.2@Au27.3Pt11.5-NP/C catalysts are composed of 48% metallic Pt(0) and 52% Pt(II) oxide. On the other hand, the binding energy (BE) of metallic Pt(0) 4f7/2 in the USCSD Au61.2@Au27.3Pt11.5-NP/C catalysts is 71.4 eV, which is negatively shifted about 0.7 eV than that (72.1 eV) of commercial Pt/C catalysts (Fig. 6A and B and Table S3, ESI†).Meanwhile, the BEs of Au(0) 4f7/2 and 4f5/2 in USCSD Au61.2@Au27.3Pt11.5-NP/C catalysts are 84.3 and 88.0 eV, respectively, which are both negatively shifted about 0.1 eV than those (84.4 and 88.1 eV) of Au–NP/C catalysts (Fig. 6C and D and Table S4, ESI†). In our previous work, the Au 4f signals and Pt 4f signals in the XPS spectra of USCS Au38.4@Au9.3Pt52.3-NP/C catalysts show a negative shift and a positive shift, respectively (Fig. S4, ESI†). However, both the Pt and Au 4f signals in the XPS spectra of USCSD Au61.2@Au27.3Pt11.5-NP/C catalysts show negative shifts. These results indicate that USCSD Au61.2@Au27.3Pt11.5-NP/C catalysts contain Au–Pt alloyed surfaces.32–34 Furthermore, the Pt atoms on their Au–Pt alloyed surfaces are isolated by Au atoms due to the ultralow Pt content, combined with the results above.
3.5 Electrocatalytic performance of USCSD Au61.2@Au27.3Pt11.5-NP/C catalysts towards the FAOR
The electrocatalytic performance of the as-prepared USCSD Au61.2@Au27.3Pt11.5-NP/C catalysts towards the FAOR in acidic media was investigated as well as that of commercial Pt/C catalysts (Johnson Matthey, 20 wt%) for comparison (Fig. 7 and Table 1). Fig. 7A shows the typical mass-normalized CV curves of USCSD Au61.2@Au27.3Pt11.5-NP/C catalysts, commercial Pt/C catalysts and USCS Au38.4@Au9.3Pt52.3-NP/C catalysts measured in the presence of N2-saturated 0.25 M H2SO4 containing 1.0 M HCOOH at a sweep rate of 50 mV s−1. Note that the mass-normalized CV curve of USCS Au38.4@Au9.3Pt52.3-NP/C catalysts is also shown in Fig. S1 (ESI†) for a better comparison. One can see that, during the forward scan, a larger oxidation peak in the potential range of 0.0–0.6 V (vs. Ag/AgCl) can be observed in the CV curve of USCSD Au61.2@Au27.3Pt11.5-NP/C catalysts (the black curve in Fig. 7A), indicating that the FAOR occurs in the direct pathway (the dehydrogenation of formic acid).| Samples | Mass activity [A mgPt−1] | Mass activity [A mgmetal−1] | Specific activity [mA cm−2] | Peak position [V vs. Ag/AgCl] |
|---|---|---|---|---|
| USCSD Au61.2@Au27.3Pt11.5-NP/C catalysts | 6.91 | 0.79 | 4.88 | 0.28 |
| Commercial Pt/C catalysts | 0.41 | 0.41 | 0.67 | 0.71 |
| USCS Au38.4@Au9.3Pt52.3-NP/C catalysts | 0.32 | 0.17 | 0.32 | 0.82 |
In contrast, a weak peak in the potential range of 0.7–0.8 V (vs. Ag/AgCl) was observed in the CV curve of commercial Pt/C catalysts (the red curve in Fig. 7A). Furthermore, the CV curve of USCS Au38.4@Au9.3Pt52.3-NP/C catalysts (the blue curve in Fig. 7A) is rather similar to that of commercial Pt/C catalysts, except the difference in their intensities. The results indicate the occurrence of dehydration in the FAOR (the indirect pathway) catalysed by both commercial Pt/C catalysts and USCS Au38.4@Au9.3Pt52.3-NP/C catalysts.
In addition, the current density of USCS Au38.4@Au9.3Pt52.3-NP/C catalysts is lower than that of commercial Pt/C catalysts, indicating that the performance of USCS Au38.4@Au9.3Pt52.3-NP/C catalysts towards the FAOR is worse than that of commercial Pt/C catalysts. That is, the Pt-rich shell of USCS Au38.4@Au9.3Pt52.3-NP/C catalysts cannot change the pathway of the FAOR and enhance the FAOR performance due to the great similarity between commercial Pt/C catalysts and USCS Au38.4@Au9.3Pt52.3-NP/C catalysts. The difference in the oxidation potentials between the USCSD Au61.2@Au27.3Pt11.5-NP/C catalysts, commercial Pt/C catalysts and USCS Au38.4@Au9.3Pt52.3-NP/C catalysts (Fig. 7A and Table 1) also indicates that FAORs catalysed by them proceed through different pathways. Consequently, the Au-rich, discrete Pt shells of USCSD Au61.2@Au27.3Pt11.5-NP/C catalysts indeed change the pathway of the FAOR and enhance the FAOR performance. Accordingly, the mass-normalized current density of USCSD Au61.2@Au27.3Pt11.5-NP/C catalysts is about 6.91 A mgPt−1, which is about 16.8 and 21.6 times higher than that (0.41 A mgPt−1) of commercial Pt/C catalysts and that (0.32 A mgPt−1) of USCS Au38.4@Au9.3Pt52.3-NP/C catalysts, respectively (Fig. 7A and Table 1). When the mass of Au is also taken into account, the mass activity of USCSD Au61.2@Au27.3Pt11.5-NP/C catalysts is about 0.79 A mgmetal−1, which is still about 1.9 and 4.6 times higher than that (0.41 A mgmetal−1) of commercial Pt/C catalysts and that (0.17 A mgmetal−1) of USCS Au38.4@Au9.3Pt52.3-NP/C catalysts, respectively. Moreover, the specific activity of USCSD Au61.2@Au27.3Pt11.5-NP/C catalysts is about 4.88 mA cm−2, which is about 7.3 and 15.3 times higher than that (0.67 mA cm−2) of commercial Pt/C catalysts and that (0.32 mA cm−2) of USCS Au38.4@Au9.3Pt52.3-NP/C catalysts, respectively (Fig. 7B). Furthermore, the electrocatalytic performance in terms of the mass activity and specific activity of the as-prepared USCSD Au61.2@Au27.3Pt11.5-NP/C catalysts towards the FAOR in acidic media is rather satisfactory compared with the Pt-based catalysts recently reported in the literature (Table S5, ESI†).
In addition to their catalytic activity, stability is also an important factor in their performance. Fig. 7C shows the results of chronoamperometric (CA) tests of USCSD Au61.2@Au27.3Pt11.5-NP/C catalysts and commercial Pt/C catalysts, which were performed for 1000 s at a constant potential of 0.3 V (vs. Ag/AgCl) in the presence of N2-saturated 0.25 M H2SO4 containing 1.0 M HCOOH. Generally, the sintering of electrocatalysts during the electrochemical measurements is unavoidable. This phenomenon is common to NP-based electrocatalysts, which would lead to variations in their outer surfaces. However, the outer surfaces of electrocatalysts gradually change during the electrochemical measurements. As for our USCSD Au61.2@Au27.3Pt11.5-NP/C catalysts, the change in their outer surfaces should be similar to that of commercial Pt/C due to their comparable size. Accordingly, the mass-normalized current density of USCSD Au61.2@Au27.3Pt11.5-NP/C catalysts also remarkably decreased at the initial stage of the chronoamperometric test. However, the decrease in the current density gradually becomes slow, possibly due to the formation of the Pt–Au alloy on their surfaces. One can clearly see that the current density of USCSD Au61.2@Au27.3Pt11.5-NP/C catalysts is always higher than that of commercial Pt/C catalysts during the entire stability test. In addition, the final current density of USCSD Au61.2@Au27.3Pt11.5-NP/C catalysts is also higher than the initial current density of commercial Pt/C catalysts. Thus, these results indicate that USCSD Au61.2@Au27.3Pt11.5-NP/C catalysts display a higher long-term stability than commercial Pt/C catalysts.
4. Conclusions
In summary, USCSD Au–Pt NPs with discrete Pt shells were first successfully prepared by extending our previous method. It is found that USCSD Au61.2@Au27.3Pt11.5 NPs are indeed different from USCS Au–Pt NPs based on the ECSA values, CO stripping voltammograms and XPS data. Moreover, the as-prepared USCSD Au61.2@Au27.3Pt11.5-NP/C catalysts towards the FAOR proceed through the direct pathway (dehydrogenation) which can effectively avoid the poisoning of intermediate products and produce hydrogen through the direct route. Furthermore, the mass activity and specific activity of the as-prepared USCSD Au61.2@Au27.3Pt11.5-NP/C catalysts towards the FAOR are 6.91 A![[thin space (1/6-em)]](https://www.rsc.org/images/entities/char_2009.gif) mgPt−1 and 4.88 mA cm−2, which are about 16.8 and 7.33 times higher than those (0.4 A mgPt−1 and 0.67 mA cm−2) of commercial Pt/C catalysts, respectively. In addition, they also show a better long-term stability. Our results demonstrate that our synthetic strategy indeed can be extended to directly prepare ultra-small Au-based bimetallic NPs via a one-pot reaction as electrocatalysts for application in energy storage and conversion.
mgPt−1 and 4.88 mA cm−2, which are about 16.8 and 7.33 times higher than those (0.4 A mgPt−1 and 0.67 mA cm−2) of commercial Pt/C catalysts, respectively. In addition, they also show a better long-term stability. Our results demonstrate that our synthetic strategy indeed can be extended to directly prepare ultra-small Au-based bimetallic NPs via a one-pot reaction as electrocatalysts for application in energy storage and conversion.
Conflicts of interest
There are no conflicts to declare.Acknowledgements
This work was financially supported by the National Natural Science Foundation of China (22072076 and 21773142), the Taishan Scholarship in Shandong Provinces (No. tsqn20161001), and the Fundamental Research Funds of Shandong University.References
- M. A. Ahsan, A. R. P. Santiago, Y. Hong, N. Zhang, M. Cano, E. Rodriguez-Castellon, L. Echegoyen, S. T. Sreenivasan and J. C. Noveron, J. Am. Chem. Soc., 2020, 142, 14688–14701 CrossRef CAS PubMed.
- P. Li, C. Du, X. Gao, Z. Zhuang, D. Xiang, C. Zhang and W. Chen, Nanoscale, 2020, 12, 13688–13696 RSC.
- X. X. Wang, J. Sokolowski, H. Liu and G. Wu, Chin. J. Catal., 2020, 41, 739–755 CrossRef CAS.
- Y. Cao, Y. Xiahou, L. Xing, X. Zhang, H. Li, C. Wu and H. Xia, Nanoscale, 2020, 12, 20456–20466 RSC.
- A. Cuesta, G. Cabello, M. Osawa and C. Gutierrez, ACS Catal., 2012, 2, 728–738 CrossRef CAS.
- G. Samjeske, A. Miki, S. Ye and M. Osawa, J. Phys. Chem. B, 2006, 110, 16559–16566 CrossRef CAS PubMed.
- Y. Yu, X. Wang and K. H. Lim, Catal. Lett., 2011, 141, 1872–1882 CrossRef CAS.
- R. V. Niquirilo, E. Teixeira-Neto, G. S. Buzzo and H. B. Suffredini, Int. J. Electrochem. Sci., 2010, 5, 344–354 CAS.
- M. Ahn and J. Kim, J. Phys. Chem. C, 2013, 117, 24438–24445 CrossRef CAS.
- C. Wu, H. Li, H. He, Y. Song, C. Bi, W. Du and H. Xia, ACS Appl. Mater. Interfaces, 2019, 11, 46902–46911 CrossRef CAS PubMed.
- Y. J. Jang, J.-W. Jang, J. Lee, J. H. Kim, H. Kumagai, J. Lee, T. Minegishi, J. Kubota, K. Domen and J. S. Lee, Energy Environ. Sci., 2015, 8, 3597–3604 RSC.
- Y. Hori, H. Wakebe, T. Tsukamoto and O. Koga, Electrochim. Acta, 1994, 39, 1833–1839 CrossRef CAS.
- J. Jia, L. Cao and Z. Wang, Langmuir, 2008, 24, 5932–5936 CrossRef CAS PubMed.
- J. Luo, M. M. Maye, N. N. Kariuki, L. Y. Wang, P. Njoki, Y. Lin, M. Schadt, H. R. Naslund and C. J. Zhong, Catal. Today, 2005, 99, 291–297 CrossRef CAS.
- L. Lu, Y. Nie, Y. Wang, G. Wu, L. Li, J. Li, X. Qi and Z. Wei, J. Mater. Chem. A, 2018, 6, 104–109 RSC.
- M. Eyrich, T. Diemant, H. Hartmann, J. Bansmann and R. J. Behm, J. Phys. Chem. C, 2012, 116, 11154–11165 CrossRef CAS.
- W. Ye, H. Kou, Q. Liu, J. Yan, F. Zhou and C. Wang, Int. J. Hydrogen Energy, 2012, 37, 4088–4097 CrossRef CAS.
- D. Li, F. Meng, H. Wang, X. Jiang and Y. Zhu, Electrochim. Acta, 2016, 190, 852–861 CrossRef CAS.
- S. Zhang, Y. Shao, G. Yin and Y. Lin, J. Power Sources, 2010, 195, 1103–1106 CrossRef CAS.
- Y.-H. W. Dan Zhao and B.-Q. Xu, J. Phys. Chem. C, 2009, 113, 20903–20911 CrossRef.
- C. Li, Y. Xu, H. Yu, K. Deng, S. Liu, Z. Wang, X. Li, L. Wang and H. Wang, Nanotechnology, 2020, 31, 045401 CrossRef CAS PubMed.
- X. Jiang, X. Yan, W. Ren, Y. Jia, J. Chen, D. Sun, L. Xu and Y. Tang, ACS Appl. Mater. Interfaces, 2016, 8, 31076–31082 CrossRef CAS PubMed.
- X. Hu, J. Zou, H. Gao and X. Kang, J. Colloid Interface Sci., 2020, 570, 72–79 CrossRef CAS PubMed.
- W. Z. Wang, B. Poudel, Y. Ma and Z. F. Ren, J. Phys. Chem. B, 2006, 110, 25702–25706 CrossRef CAS PubMed.
- C. Zhang, L. Xu, N. Shan, T. Sun, J. Chen and Y. Yan, ACS Catal., 2014, 4, 1926–1930 CrossRef CAS.
- P. Tonda-Mikiela, T. W. Napporn, C. Morais, K. Servat, A. Chen and K. B. Kokoh, J. Electrochem. Soc., 2012, 159, H828–H833 CrossRef CAS.
- S. Strbac, S. Petrovic, R. Vasilic, J. Kovac, A. Zalar and Z. Rakocevic, Electrochim. Acta, 2007, 53, 998–1005 CrossRef CAS.
- A. Habrioux, E. Sibert, K. Servat, W. Vogel, K. B. Kokoh and N. Alonso-Vante, J. Phys. Chem. B, 2007, 111, 10329–10333 CrossRef CAS PubMed.
- A. Habrioux, W. Vogel, M. Guinel, L. Guetaz, K. Servat, B. Kokoh and N. Alonso-Vante, Phys. Chem. Chem. Phys., 2009, 11, 3573–3579 RSC.
- T. Miao, Y. Song, C. Bi, H. Xia, D. Wang and X. Tao, J. Phys. Chem. C, 2015, 119, 18434–18443 CrossRef CAS.
- C. Bi, C. Feng, T. Miao, Y. Song, D. Wang and H. Xia, Nanoscale, 2015, 7, 20105–20116 RSC.
- A. J. Wang, K.-J. Ju, Q.-L. Zhang, P. Song, J. Wei and J.-J. Feng, J. Power Sources, 2016, 326, 227–234 CrossRef CAS.
- W. Ye, J. Yu, Y. Zhou, D. Gao, D. Wang, C. Wang and D. Xue, Appl. Catal., B, 2016, 181, 371–378 CrossRef CAS.
- P. Wu, Y. Cao, Y. Wang, W. Xing, Z. Zhong, P. Bai and Z. Yan, Appl. Surf. Sci., 2018, 457, 580–590 CrossRef CAS.
Footnotes |
| † Electronic supplementary information (ESI) available: experimental section; additional CV curves, XPS spectra and summarized data in Tables S1–S5. See DOI: 10.1039/d1ma01204e |
| ‡ These authors contributed equally. |
| This journal is © The Royal Society of Chemistry 2022 |

