 Open Access Article
Low-intermediate-temperature, high-pressure thermoelastic and crystallographic properties of thermoelectric clausthalite (PbSe-I)
Kevin S.
Knight
 *abc,
Alexandra S.
Gibbs
 de,
Craig L.
Bull
 ef,
Anthony V.
Powell
 g,
Nicholas P.
Funnell
 e and
Christopher J.
Ridley
 e
e
aDepartment of Earth Sciences, The Natural History Museum, Cromwell Road, London SW7 5BD, UK. E-mail: kevinstevenknight@gmail.com
bDepartment of Earth Sciences, University College London, Gower Street, London WC1E 6BT, UK
cDepartment of Materials Science and Engineering, University of Sheffield, Sheffield S1 3JD, UK
dSchool of Chemistry, University of St Andrews, North Haugh, St Andrews, KY16 9ST, UK
eISIS Neutron Spallation Source, Rutherford Appleton Laboratory, Harwell Campus, Didcot, Oxfordshire OX11 0QX, UK
fSchool of Chemistry, University of Edinburgh, Edinburgh, EH9 3FJ, UK
gDepartment of Chemistry, University of Reading, Whiteknights, Reading, Berkshire RG6 6AH, UK
First published on 17th January 2022
Abstract
The thermoelastic properties of the rock-salt structured thermoelectric lead selenide (clausthalite, PbSe-I) have been determined using neutron powder diffraction techniques for the temperature interval 10–500 K at ambient pressure, and 0–5.2 GPa at 298, and 150 K. Within this temperature range, lead selenide can be described using the same self-consistent phenomenological model developed for the isostructural phases lead sulfide (PbS) and lead telluride (PbTe) in which the cations and anions behave as independent Debye oscillators (vibrational Debye temperatures of PbSe-I: Pb 111(1) K, Se 205(1) K). Simultaneous fitting of the unit cell volume and isochoric heat capacity to a two-term Debye internal energy function gives characteristic temperatures of 104(3) K and 219(5) K in excellent agreement with the two vibrational Debye temperatures derived from fitting the individual atomic displacement parameters. Grüneisen constants for the two term fits are 1.79 and 2.28 for the lower and upper characteristic temperature respectively. The calculated thermodynamic Grüneisen parameter increases monotonically from 2.03 at 10 K, to a maximum 2.22 at 100 K before decreasing back to 2.00 at 298 K and is broadly in agreement with the average of the two Grüneisen parameters associated with the two-term internal energy function. Despite the simplicity of the model, the calculated phonon density of states that is implicit within the two-term Debye model is found to show fair agreement with the full and partial vibrational densities of states derived from density functional theory (DFT). The bulk modulus and its pressure derivative at 298 K are 47.9(4) GPa and 5.4(2) respectively by fitting the pressure dependence of the unit cell volume to a 3rd order Birch-Murnaghan equation-of-state. For lower temperatures (T < 300 K) the high-pressure transition to PbSe-II is associated with a steep initial Clapeyron slope of 151 K GPa−1.
Introduction
Lead chalcogenides of general formula PbX (X = S, Se, Te) crystallize in the rocksalt structure in space group Fm![[3 with combining macron]](https://www.rsc.org/images/entities/char_0033_0304.gif) m (phase I) at ambient temperature and pressure.1,2 In PbSe, a structural phase transition to an orthorhombic phase, PbSe-II, has been identified by pressure-dependent resistivity and volumemtric measurements to occur at 4.2 GPa at ambient temperature.1 The space group and crystal structure of this phase still remain contentious but do not form part of this submission which only concerns the thermoelastic properties of thermoelectric PbSe-I.
m (phase I) at ambient temperature and pressure.1,2 In PbSe, a structural phase transition to an orthorhombic phase, PbSe-II, has been identified by pressure-dependent resistivity and volumemtric measurements to occur at 4.2 GPa at ambient temperature.1 The space group and crystal structure of this phase still remain contentious but do not form part of this submission which only concerns the thermoelastic properties of thermoelectric PbSe-I.
The narrow-band-gap PbX semiconductors have been intensively studied due to their electronic structure and properties2–5 and the band gap behaviour under pressure.6 They have also attracted considerable interest as functional materials for a range of applications, which includes thin-film field-effect transistors7 thermophotovoltaic energy converters8 laser diodes9 and infra-red sensors.10
Much of the recent interest in lead chalcogenides and their derivatives arises from their promising thermoelectric properties.11,12 The ability to convert otherwise waste heat directly into electrical power, afforded by a thermoelectric device, offers the potential to achieve efficiency savings across a range of industrial and transportation sectors.13 The efficiency of a device is determined by the performance of the component semiconductors, embodied in the figure of merit, ZT = S2σT/κ comprising the Seebeck coefficient (S), electrical conductivity (σ) and thermal conductivity (κ), where the last has contributions from lattice vibrations (κL) and charge carriers (κe).
Lead telluride, PbTe, is one of the most studied of thermoelectric materials as doping provides access to both n- and p-type semiconducting variants.14 Nanostructuring,15 using approaches that include the introduction of nanoinclusions in the LAST-m (lead–antimony–silver–tellurium) phases,16 solid-solution formation,17 hierarchical nanostructuring18 and the formation of nanoprecipitates of a second phase in the rocksalt matrix,19 has a beneficial impact on ZT. This arises principally from reductions in κL, due to increased scattering of heat-carrying phonons over a range of wavelengths. Maximum figures of merit that lie in the range ZT ≈ 1.4–1.7 have been attained in both n-20,21 and p-type22,23 nanostructured PbTe.
Concerns over relative scarcity of tellurium have led to renewed interest in the lighter chalcogen congeners of lead telluride,24 since both selenium and sulfur are more abundant than tellurium. Parker and Singh first identified the possibility of high thermoelectric performance in optimally-doped PbSe on the basis of the presence of a flat heavy band with a high density of states, located near the top of the valence band.3 Subsequent synthetic studies have led to reports of figures of merit in excess of unity at relatively modest temperatures (673 ≤ T/K ≤ 873) for a range of hole and electron dopants17,25–30 despite a lower valley degeneracy. Common to the electronic structure of PbTe and PbSe-I is the presence of a light upper valence band (L-band) and a second heavy hole band (Σ band), separated by an energy (ΔE) that is larger in the selenide (0.26 eV) than the telluride (0.15 eV). Tuning ΔE towards convergence of the L- and Σ-bands through band structure engineering31 has been shown to be an effective strategy to improve the thermoelectric performance of PbSe.
A significant factor in the unexpectedly high thermoelectric performance of PbSe-I is the low lattice thermal conductivity (κL 1.7–1.9 W m−1 K−1 at 300 K), which despite the lighter anion, is comparable with, or even slightly lower than, that of the corresponding telluride at 300 K.17 The origin of this unexpectedly low lattice thermal conductivity remains the subject of some debate. It has been suggested that the smaller unit cell of PbSe compared to PbTe17 or a weaker bond strength, and hence a reduction in the speed of sound32 may be the cause. Alternatively, an exceptionally strong anharmonicity reflected in a high Grüneisen parameter33 resulting in an intrinsic localized mode,34,35 or strong resonant bonding36 resulting in the softening of phonons,37 may play a role.
The thermal conduction properties of PbSe are therefore critically dependent on the bulk elastic properties. In our concluding article concerning the thermoelastic properties of the lead chalcogenides, we describe the results of neutron powder diffraction conducted as a function of both temperature and pressure, which provide new insights into the elastic properties of PbSe. These results are consistent with our previously published analysis of PbS and PbTe that cations and anions in rock-salt structured lead chacides can be modelled as independent Debye oscillators with a two-term internal energy function, leading to Grüneisen constants that are self-consistent and exhibit a high degree of anharmonicity.
Methods
High pressure
High pressure crystallographic data were collected at room temperature, 298 K, and at 150 K using the PEARL diffractometer38 of the ISIS Facility of the Rutherford Appleton Laboratory. Approximately 60 mm3 of powdered PbSe-I (Sigma-Aldrich) was loaded into a null neutron coherent scattering Ti–Zr alloy capsule gasket.39 A small pellet of lead was located in the centre of the sample to act as a pressure marker, and to enable hydrostatic conditions, the sample was moistened with a few drops of perdeuterated 4![[thin space (1/6-em)]](https://www.rsc.org/images/entities/char_2009.gif) :
:![[thin space (1/6-em)]](https://www.rsc.org/images/entities/char_2009.gif) 1 methanol–ethanol pressure transmitting fluid. The capsule was placed in zirconia-toughened-alumina anvils38 and loaded into a type V4 pentane driven Paris Edinburgh press. The press assembly was mounted into a liquid nitrogen cryostat tank and cooled by immersion of the cell body in liquid nitrogen, the sample temperature was maintained, and controlled by warming the press body against a liquid nitrogen reservoir using a pair of band heaters.38 Temperature stability was ±1 K for both temperatures measured. Data were collected to a maximum load of 65 tonnes for both temperatures.
1 methanol–ethanol pressure transmitting fluid. The capsule was placed in zirconia-toughened-alumina anvils38 and loaded into a type V4 pentane driven Paris Edinburgh press. The press assembly was mounted into a liquid nitrogen cryostat tank and cooled by immersion of the cell body in liquid nitrogen, the sample temperature was maintained, and controlled by warming the press body against a liquid nitrogen reservoir using a pair of band heaters.38 Temperature stability was ±1 K for both temperatures measured. Data were collected to a maximum load of 65 tonnes for both temperatures.
Neutron diffraction data for the d-spacing interval 0.46 < d/Å < 4.1 were collected using the main 2θ = 90° bank of the PEARL diffractometer. Data sets suitable for profile refinement40,41 were obtained after electronically focusing the individual detector element spectra, normalizing the summed patterns with respect to the incident beam monitor and the scattering from a standard vanadium sample. Finally, a correction for the wavelength and scattering-angle dependence of the neutron attenuation by the anvil and gasket materials37 was applied. Data were collected at 29 loads at 298 K, and 27 loads at 150 K.
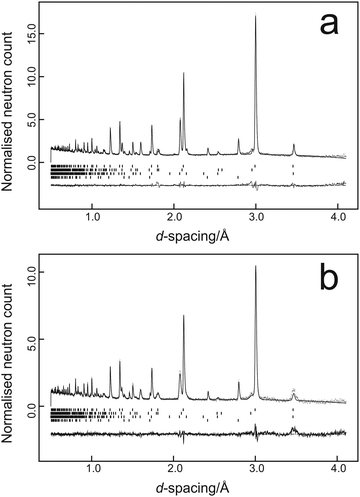
Data were fitted using the GSAS suite of programs42,43 with typical results from the two temperatures being illustrated in Fig. 1a for the data collected at 37 tonnes load at 298 K and Fig. 1b for the data collected at 38 tonnes load at 150 K.
Low temperature
Low temperature neutron powder diffraction data were collected using the high resolution neutron diffractometer HRPD at the ISIS neutron spallation source of the Rutherford Appleton Laboratory. Initial data were collected in the time-of-flight window 30–130 ms at 1.2 K using an AS Scientific ‘orange’ cryostat from an equimolar mixture of PbS/PbSe/PbTe powders to which NIST standard silicon reference powder SRM640c had been added as an internal calibrant.44 These data permit direct comparison of the three lattice parameters at close to 0 K, which should be of value in athermal density functional calculations of the lead chalcogenides, and, in addition, provides a calibration base line for the data collections made at higher temperature. At 1.2 K the lattice parameters of the rock-salt structured lead chalcogenides are: PbS 5.907641(28) Å, PbSe 6.096764(20) Å, PbTe 6.429392(22) Å.For the full low-intermediate temperature data collections (10–500 K), data were collected using a Sumitomo RDK-415D closed cycle refrigerator (CCR) from a 25.1 g sample of PbSe-I contained in a 1.5 cm thick aluminium slab can. Details of the configuration of the sample container are given in ref. 45–47 and diagrammatically in ref. 44. Data were collected at 11.5 K, the base temperature of the CCR on the first cooling cycle, for 80 μA h, approximately 2 hours, then at 20 K, and in 10 K steps to 500 K, for data collections of 17 μA h, approximately 24 minutes duration. The sample was then cooled to 10 K and measured for 80 μA h, heated to 15 K and measured at this temperature, and in 10 K intervals to 495 K for 17 μA h per temperature step. Finally, the sample was heated to 500 K and measured in 100 K intervals on cooling to 100 K for 80 μA h per temperature interval. To ensure thermal equilibrium was achieved at all temperatures, data collections were only commenced 5 minutes after the set point temperature was achieved; temperature stability was better than ±0.1 K of the set point temperature for all data collections.
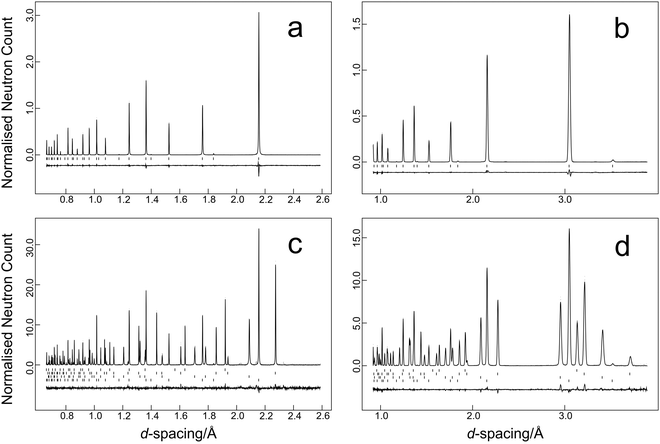
The time-of-flight data were focused, normalised to the incident flux distribution, and corrected for solid angle and detector efficiency variations. The data were finally corrected for self-shielding for a sample of number density 8.506 × 1021 cm−3 with scattering cross section of 11.871 b48 and for the effects of wavelength-dependent absorption (absorption cross section 19.418 b48 at a wavelength of 1.798 Å). Two data sets were generated for each temperature in the time-of-flight range 32–120 ms that corresponds to 0.64–2.40 Å in the high-resolution backscattering detector bank, and 0.9–3.4 Å in the high-count rate medium resolution detector bank. Data were fitted using the GSAS suite of programs.42,43 Typical results from the temperature scan are illustrated in Fig. 2a and b for the data collected at 11.5 K and Fig. 2c and d for the multiphase sample collected at 1.2 K. Average estimated standard uncertainties for the short duration scans were 1 × 10⁻⁵ Å in the lattice parameter and 1.7 × 10⁻⁴ Å2 for the isotropic atomic displacement parameters of both lead and selenium.
Crystallographic parameters for PbSe-I refined from the seven long duration data collections are listed in Table 1.
| T/K | Lattice parameter/Å | Pb uiso/Å2 | Se uiso/Å2 |
|---|---|---|---|
PbSe, Fm![[3 with combining macron]](https://www.rsc.org/images/entities/char_0033_0304.gif) m, Pb 1a (0.0, 0.0, 0.0), Se 1b (0.5, 0.5, 0.5). m, Pb 1a (0.0, 0.0, 0.0), Se 1b (0.5, 0.5, 0.5). |
|||
| 10.0 | 6.096876(7) | 0.00298(8) | 0.00398(9) |
| 11.5 | 6.096764(8) | 0.00278(8) | 0.00373(9) |
| 100.0 | 6.103738(7) | 0.00695(9) | 0.00617(10) |
| 200.0 | 6.115331(8) | 0.01173(13) | 0.00989(13) |
| 300.0 | 6.127348(8) | 0.01724(15) | 0.01441(16) |
| 400.0 | 6.139847(9) | 0.02319(19) | 0.01902(20) |
| 500.0 | 6.152639(10) | 0.02950(24) | 0.02421(25) |
Results and discussion
High pressure
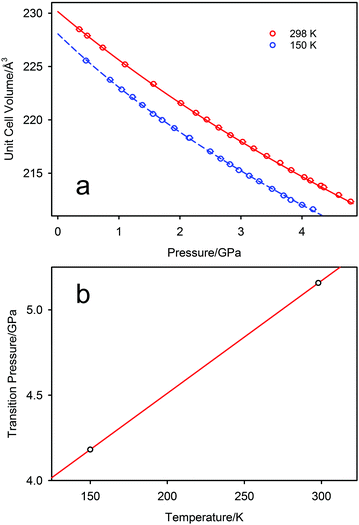
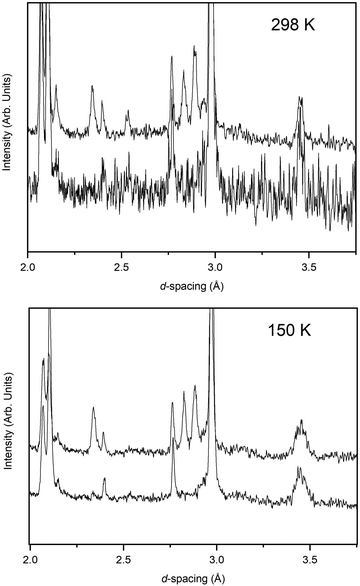
The pressure variation of the unit cell volume of PbSe-I at 298 K and 150 K are shown in Fig. 3a; the first appearance of the higher-pressure phase (PbSe-II) within the diffraction data was used to define the phase boundary PbSe-I–PbSe-II. At 298 K PbSe-II was first observed at 5.16(1) GPa, and, at the lower pressure of 4.18(1) GPa, at 150 K defining an initial steep phase boundary of ∼151 K GPa−1 as shown in Fig. 3b. Data just below and just above the phase boundary for both temperatures is illustrated in Fig. 4 where the presence of PbSe-II may be observed as new Bragg peaks between 2.7 and 3.0 Å. The phase boundary does not cut the temperature axis at a physically realisable temperature (∼−481 K) and hence rock-salt-structured PbSe-I is the stable ground state phase.The ambient-temperature bulk modulus (K0) and its pressure derivative (K′) were calculated from fitting the pressure (P) – volume (V) data to a third order Birch-Murnaghan equation-of-state49 with the fit being shown in Fig. 3a as the full line, and the equation-of-state being given by
To our knowledge there are no experimental determinations of the third order elastic constants of PbSe-I at room temperature, and hence we have only ab initio calculations of K′ for comparison purposes (K′ = −(c111 + 6c112 + 2c123)/(9K0) for point group m![[3 with combining macron]](https://www.rsc.org/images/entities/char_0033_0304.gif) m56). Calculations of the third order elastic constants for PbSe-I using a Born-Mayer potential57,58 appear to be in conflict, quite possibly related to a typographical error in the quoted units of Raju.57 The early work of Thakur58 gives K′ = 338.1/K0 whereas the most recent work of Raju57 gives K′ a factor of 10 smaller, K′ = 34.03/K0 (K0 in GPa). The former relationship gives a reasonable order of magnitude for K′ (expectation value ∼449), whilst the latter gives a clearly non-physical result. A compendium of experimental and calculated bulk moduli and their pressure derivatives are listed in Table 2.
m56). Calculations of the third order elastic constants for PbSe-I using a Born-Mayer potential57,58 appear to be in conflict, quite possibly related to a typographical error in the quoted units of Raju.57 The early work of Thakur58 gives K′ = 338.1/K0 whereas the most recent work of Raju57 gives K′ a factor of 10 smaller, K′ = 34.03/K0 (K0 in GPa). The former relationship gives a reasonable order of magnitude for K′ (expectation value ∼449), whilst the latter gives a clearly non-physical result. A compendium of experimental and calculated bulk moduli and their pressure derivatives are listed in Table 2.
| K 0/GPa | K′ | Method | Ref. |
|---|---|---|---|
| a Physically implausible values. | |||
| 47.9(4) | 5.4(2) | Neutron diffraction (298 K) | This work |
| 49 | 4 (fixed) | SXRD | 50 |
| 45 | 4 (fixed) | EDXRD | 51 |
| 54.1 | — | Ultrasonic | 52 |
| 54.9 | — | Phonon dispersion | 53 |
| 347a | — | Ultrasonic | 54 |
| 49.12 | 4.09 | DFT | 87 |
| 58.1 | — | DFT LDA | 33 |
| 49.2 | — | DFT GGA | 33 |
| 60.8 | 4.56 | DFT LDA | 88 |
| 44.5 | — | DFT LDA/GGA | 89 |
| 44.56 | — | QHA | 59 |
| 54.1 | — | DFT LDA/GGA | 90 |
| 338.1/K0 | Born-Mayer potential | 58 | |
| 34.03/K0a | Born-Mayer potential | 57 | |
For calculations of the isochoric heat capacity and the thermodynamic Grüneisen parameter it is necessary to evaluate the temperature-dependence of the bulk modulus. We have used the temperature variation of the second order elastic constants c11 and c12 determined from ultrasonic measurements52 and then fitted the calculated bulk modulus (c11 + 2c12)/3 to a saturating function of the form K0(T) = K0(0 K) + A/(exp(B/T) − 1). For consistency with our equation-of-state derived bulk modulus, we have retained the temperature dependence implied in the expression above but with K0(0 K) scaled to fit our 298 K value (K0(0 K) = 53 GPa, A = −22.11 GPa, B = 465 K). An experimental redetermination of the temperature variation of the second order elastic constants and a determination of the third order elastic constants of PbSe-I would be of great benefit to future thermoelastic investigations.
The nature of the high-pressure phase, PbSe-II, is still under investigation and will be reported elsewhere.
Low-intermediate temperature
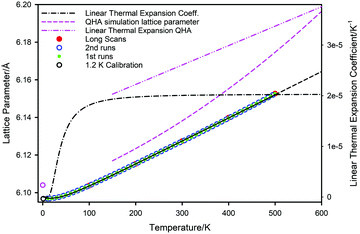
Consideration of Fig. 5 shows the results of the QHA calculations59 slightly overestimates the 0 K lattice parameter, but at higher temperatures (T > 150 K) the simulated lattice parameter is significantly in error. This difference increases rapidly with increasing temperature and hence the calculated behaviour grossly overestimates the linear thermal expansion coefficient of PbSe; αL = 3.8 × 10⁻⁵ K−1 at 600 K by QHA calculation compared to 2.03 × 10⁻⁵ K−1 by extrapolation of the experimental curve. According to the QHA calculations, strong anharmonic contributions apparently start at temperatures of approximately 300 K where the lattice parameter temperature variation begins to move away from linear behaviour. By contrast, non-linear effects are barely apparent in the experimental lattice parameter data even at 500 K. It is evident, therefore, that any deductions made from the QHA calculations that explicitly rely on distance measurements derived from the simulation of the lattice parameter are substantially in error.
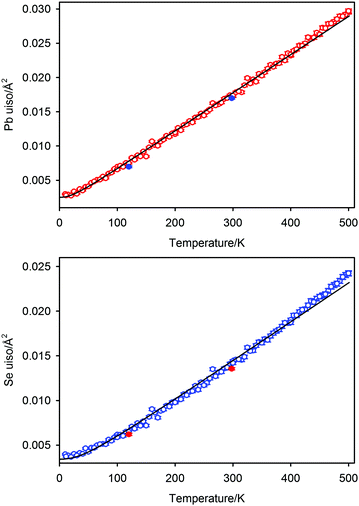
where h is Planck's constant, kB is Boltzmann's constant and θD is the vibrational Debye temperature.61 In practice, for anything other than mono-elemental compounds, this expression is too restrictive, and the zero-point term is permitted to be an additional refinable variable, with the difference between the calculated and refined zero-point term being considered a measure of static disorder at the site under consideration.62,63 The full lines on Fig. 6 are weighted fits to the atomic displacement parameters according to a harmonic Debye model including the free zero-point refinement with results, Pb: θD = 112.1(1) K, zero-point = 2.50(2) × 10−3 Å2, r2 = 0.998, Se: θD = 205.3(3) K, zero-point = 3.41(2) × 10−3 Å2, r2 = 0.995. The differences between the fitted zero-point terms from those calculated from the vibrational Debye temperatures are small for both cation and anion, 9.5 × 10⁻⁴ Å2 in the former, and 1.18 × 10⁻³ Å2 in the latter. Furthermore, noting the X-ray single crystal results are in good agreement with the neutron powder diffraction results, and further making the assumption that these data extend significantly above the vibrational Debye temperature, analysis of the X-ray diffraction results finds vibrational Debye temperatures of 109 K for the lead cation and 199 K for the selenium anion, consistent with our neutron powder diffraction results.
It is clear from the atomic displacement parameter data and their associated fits according to the modified Debye model that anharmonic effects are visible for temperatures greater than 400 K where the observed data are systematically higher than calculated. This is in marked contrast to the temperature dependence of the lattice parameter which shows no significant deviation from a harmonic model at the highest temperature measured. Root mean square atomic displacements calculated using QHA59 are in fair agreement with the values calculated from the atomic displacement parameters of PbSe derived from the neutron diffraction data, however, as noted above, this agreement may be superficial considering the differences between the calculated and measured lattice parameters.
Within the first Grüneisen approximation that treats thermal expansion as equivalent to elastic strain, the molar volume at zero pressure, or equivalently the unit cell volume under the same conditions, is related to the internal energy by the equation of state V(T) = V0 + (γ/K0)U(T) where U(T) is the internal energy, V0 the volume at 0 K, γ is a Grüneisen parameter and K0 is the isothermal bulk modulus.64,65 For a two-term Debye model, the unit cell volume is given by
ref. 65 and Ni are the number of atoms of type i in volume V.
The isochoric heat capacity, CV, is found by standard thermodynamic transformation to be related to the experimentally determined isobaric heat capacity CP, by CV = CP–TαV2K0Vm where αV is the volume thermal expansion coefficient and Vm is the molar volume.66 Noting that CV = ∂U/∂T,66 the isochoric heat capacity in the two-term Debye model is therefore
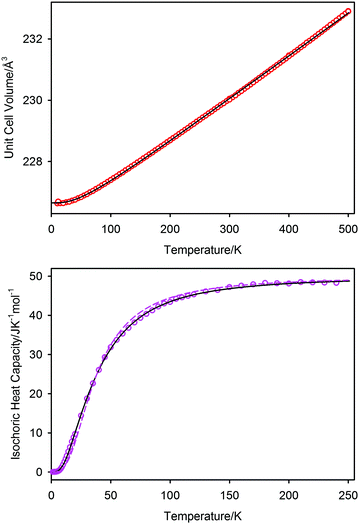
Concatenated isobaric heat capacity data for PbSe measured in the temperature interval 1.2–20 K,70 and 20–260 K71 were converted to the isochoric form using the expression shown above, with the molar volume and volume expansivity calculated by an independent fit to the unit cell volume using a simpler, and adequate for the purpose, Einstein internal energy function. The temperature dependence of the bulk modulus was calculated assuming the 298 K value determined from the PEARL experiment complemented by the temperature variation implied from the measurements of the sound velocities as a function of temperature.52
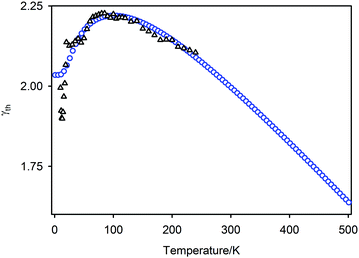
In Fig. 7 we show the unit cell volume and the isochoric heat capacity of PbSe; the simultaneous fit to these data using the two-term Debye model are shown as the full black lines. The inadequacy of a single Debye model to fit the isochoric heat capacity is shown as the dashed line in the lower graph of Fig. 7, where it can be seen to underestimate the heat capacity at low temperatures and overestimate it at intermediate temperatures. The two-term model can be seen to fit both sets of data well, with resultant characteristic temperatures of θD1 = 104(3) K and θD2 = 219(3) K; the unit cell volume at 0 K is 226.65(1) Å3. The associated Grüneisen constants, assuming a bulk modulus of 47.9 GPa, are γ1 = 1.79, and γ2 = 2.28 with an average of 2.03. The single term Debye fit to the isochoric heat capacity gave a characteristic temperature of 153 K, and a Grüneisen constant of 2.01. A comparison of the characteristic temperatures and their associated Grüneisen constants for the three lead chalcogenides are listed in Table 3 where the quoted values are derived from re-refined data sets of PbS, and PbTe based on the new 1.2 K calibration shown earlier. Differences between the new values quoted here and the previously reported values44–47 are within estimated standard deviations of the latter and do not affect the conclusions drawn in these works.
| Compound | V 0/Å3 | γ 1 | θ D1/K | γ 2 | θ D2/K | θ vib/K (Pb) | θ vib/K (X) |
|---|---|---|---|---|---|---|---|
| PbS | 206.17(7) | 3.09 | 110(3) | 1.69 | 326(5) | 120(1) | 324(2) |
| Single Debye | 206.23 | 2.40 | 202 | ||||
| PbSe | 226.65(1) | 1.79 | 104(3) | 2.28 | 219(3) | 111(1) | 202(1) |
| Single Debye | 226.63 | 2.01 | 153 | ||||
| PbTe | 265.8(1) | 1.83 | 92(3) | 2.23 | 175(5) | 99(1) | 155(1) |
| Single Debye | 265.8 | 2.01 | 128 |
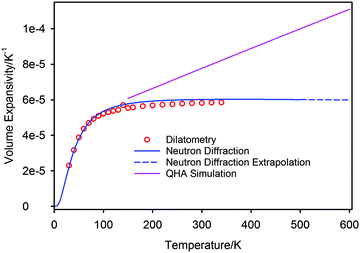
The volume thermal expansion coefficient (αV) of PbSe, calculated from the unit cell volume and the temperature derivative of the fitted curve shown in Fig. 7, is illustrated in Fig. 8 where the results are compared to those determined experimentally from dilatometry72 and those calculated by QHA.59 Extrapolation of the experimental volume expansivity using the fitted neutron diffraction results up to a temperature of 600 K is shown as the dashed line. There is gratifying agreement in the magnitude of the volume expansivity between the experimental dilatometry and the neutron diffraction results for PbSe, however, the QHA calculated volume expansivity significantly overestimates its magnitude and gradient for temperatures greater than 150 K.
The high temperature extrapolation of the unit cell volumes shows that within the harmonic approximation, the volume expansion coefficients of the three lead chalcogenides are remarkably similar; PbS αV ∼ 6.12 × 10⁻⁵ K−1,45,46 PbSe αV ∼ 6.09 × 10⁻⁵ K−1, PbTe αV ∼ 6.18 × 10⁻⁵ K−1.47
where c is the speed of light. The position of the vibrational Debye temperatures determined from fitting the atomic displacement parameters are also included on this graph. Both the DFT calculated full vibrational density-of states (VDOS) and that from the two-term Debye model have been normalized to unit area. The assumption implicit within the Debye model that the frequency is a linear function of wave vector cannot replicate the fine structure of the DFT calculated vibrational density-of states (VDOS), however there is surprisingly good agreement between the two-term model and the theoretical calculation. The high frequency cut offs agree almost exactly; the mean frequencies of the lead PPDOS agree to within 3%; the agreement of the mean frequencies of the selenium (PPDOS), ∼10%. The position of the transverse optic mode at the Brillouin zone centre53 is found to lie close to the positions of the mean lead (PPDOS).
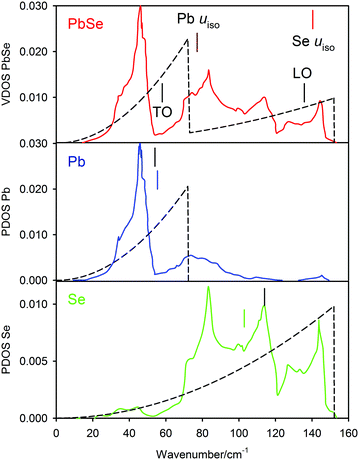 | ||
| Fig. 9 Upper figure, comparison of the vibrational density of states of PbSe-I calculated using first principles methods as the full line with that calculated from the two-term Debye model shown as the dashed line; both densities of states are normalized to unit area. The positions of the transverse optic and longitudinal optic modes derived from neutron inelastic scattering53 are shown together with the positions of the vibrational Debye temperatures of the lead and selenium. The lower two figures show the calculated partial phonon density of states for the two atomic species where the mean frequencies are compared to those calculated from the two-term Debye model. | ||
Discussion
Neutron powder diffraction has shown that at low temperatures PbSe-I behaves crystallographically in the same way as the isostructural chalcogenides PbS, and PbTe, i.e. the temperature dependence of the unit cell volume and isochoric heat capacity within a two-term Debye model are consistent with the Debye-like behaviour of the individual atomic displacement parameters.45–47 As only Bragg reflections are utilised in profile refinement, it is formally invalid to draw conclusions concerning pair correlations, and hence the contentious issue of emphanisis in the lead chalcogenides73,74 cannot be commented on in the particular case of PbSe-I. The data presented in this submission, however, may be useful in any future total scattering or XAS study of PbSe-I.Simple inorganic solids, such as the group 4 elemental solids and III–V semiconductors generally have Grüneisen parameters, γ, close to unity. High-performance thermoelectric materials frequently exhibit Grüneisen parameters in excess of 1, as exemplified by PbTe (γ = 1.45) and AgSbTe2 (γ = 2.05)75. The high values of γ for PbSe, determined from fitting the two-term Debye model to isochoric heat capacity and unit-cell volume data, indicate significant vibrational anisotropy. The calculated thermodynamic Grüneisen parameter of γ = 2.00, is broadly in line with the average of the two values determined from the two-term model and is consistent with previous reports of values in the range 1.5 ≤ γ ≤ 2.25. The QHA calculations of Skelton et al.59 conclude that the mode softening seen in all lead chalcogenides leads to significant thermal motion, while the ab initio calculations of Shulumba et al.35 reveal an anomalously large anharmonic interaction in PbSe. This is associated with a localised vibrational mode in the acoustic region. Calculation of the radial distribution function reveals that although this mode is asymmetric, it does not involve a change in the centre of mass.
The bulk modulus determined experimentally (K0 47.9(4) GPa) is somewhat higher than the value of 39.9 GPa at 300 K determined by Zhang et al.33 from the lattice parameter dependence of the calculated free energy. This deviation may arise from the use in the energy calculations of the QHA, in which phonons are treated as harmonic but volume dependent. The average (![[small theta, Greek, macron]](https://www.rsc.org/images/entities/i_char_e0c9.gif) D = 161.5 K) of the Debye temperatures determined using a two-term model is comparable with those determined from speed of sound measurements by Wang et al.76 (θD = 191 K) and Pei et al.21 (θD = 141 K).
D = 161.5 K) of the Debye temperatures determined using a two-term model is comparable with those determined from speed of sound measurements by Wang et al.76 (θD = 191 K) and Pei et al.21 (θD = 141 K).
Knowledge of the Debye temperature and Grüneisen parameter enable the lattice contribution to thermal conductivity to be estimated through77
![[M with combining macron]](https://www.rsc.org/images/entities/i_char_004d_0304.gif) is the average atomic mass in a.m.u; δ is the cube root of the average volume per atom in Å3 and n is the number of atoms in the primitive unit cell (Table 4). We have shown above that the Grüneisen parameter at room temperature determined from thermoelastic data is in good agreement with the mean of individual Grüneisen constants determined from the fitting of the unit cell volume and isochoric heat capacity. We use this mean value,
is the average atomic mass in a.m.u; δ is the cube root of the average volume per atom in Å3 and n is the number of atoms in the primitive unit cell (Table 4). We have shown above that the Grüneisen parameter at room temperature determined from thermoelastic data is in good agreement with the mean of individual Grüneisen constants determined from the fitting of the unit cell volume and isochoric heat capacity. We use this mean value, ![[small gamma, Greek, macron]](https://www.rsc.org/images/entities/i_char_e0c4.gif) , in estimating the thermal conductivity using the above expression. Similarly, we take the mean of the two Debye temperatures (
, in estimating the thermal conductivity using the above expression. Similarly, we take the mean of the two Debye temperatures (![[small theta, Greek, macron]](https://www.rsc.org/images/entities/i_char_e0c9.gif) D) as approximating to the acoustic mode Debye temperature (θa = θDn−1/3). These assumptions lead to an estimate of κL = 0.028 W cm−1 K−1 for PbSe at 300 K. This compares with reported experimental values that span the range 0.016–0.021 W cm−1 K−1. While the estimated value of κL is slightly higher than experimentally determined values, it is consistent with the observation that the lattice contribution to the thermal conductivity of PbSe-I is lower than expected on the basis of atomic masses. The corresponding estimates of κL for the analogous telluride and sulfide, using data from Table 4, are respectively 0.020 and 0.040 W m−1 K−1. These are broadly in-line with experimental data which demonstrate the sulfide has a significantly larger lattice thermal conductivity than the selenide. The ratio of the estimated values, κL(PbS)/κL(PbSe) ≈ 1.4, is also similar to that of the experimentally-determined values (1.5), although the telluride/selenide ratio(κL(PbTe)/κL(PbSe) ≈ 0.7) is somewhat lower than expected. The low lattice thermal conductivity of PbSe may be traced to a Debye temperature that is relatively low for the average atomic mass and to a fairly large Grüneisen parameter that is comparable with that of the heavier telluride and consistent with anharmonic character of the vibrational modes.
D) as approximating to the acoustic mode Debye temperature (θa = θDn−1/3). These assumptions lead to an estimate of κL = 0.028 W cm−1 K−1 for PbSe at 300 K. This compares with reported experimental values that span the range 0.016–0.021 W cm−1 K−1. While the estimated value of κL is slightly higher than experimentally determined values, it is consistent with the observation that the lattice contribution to the thermal conductivity of PbSe-I is lower than expected on the basis of atomic masses. The corresponding estimates of κL for the analogous telluride and sulfide, using data from Table 4, are respectively 0.020 and 0.040 W m−1 K−1. These are broadly in-line with experimental data which demonstrate the sulfide has a significantly larger lattice thermal conductivity than the selenide. The ratio of the estimated values, κL(PbS)/κL(PbSe) ≈ 1.4, is also similar to that of the experimentally-determined values (1.5), although the telluride/selenide ratio(κL(PbTe)/κL(PbSe) ≈ 0.7) is somewhat lower than expected. The low lattice thermal conductivity of PbSe may be traced to a Debye temperature that is relatively low for the average atomic mass and to a fairly large Grüneisen parameter that is comparable with that of the heavier telluride and consistent with anharmonic character of the vibrational modes.
| PbTe | PbSe | PbS | |
|---|---|---|---|
| A | 3.029 × 10⁻⁸ | 3.028 × 10⁻⁸ | 2.95 × 10⁻⁸ |
![[M with combining macron]](https://www.rsc.org/images/entities/i_char_004d_0304.gif) /amu /amu |
167.4 | 143.08 | 119.63 |
| δ/Å | 3.23 | 3.06 | 2.97 |
| n 2/3 | 1.587 | 1.587 | 1.587 |
![[small theta, Greek, macron]](https://www.rsc.org/images/entities/i_char_e0c9.gif) D/K
D/K |
133.5 | 161.5 | 218 |
![[small theta, Greek, macron]](https://www.rsc.org/images/entities/i_char_e0c9.gif) D
3/K3
D
3/K3 |
2.379 × 10⁶ | 4.212 × 10⁶ | 10.36 × 10⁶ |
![[small gamma, Greek, macron]](https://www.rsc.org/images/entities/i_char_e0c4.gif)
|
2.03 | 2.035 | 2.39 |
![[small gamma, Greek, macron]](https://www.rsc.org/images/entities/i_char_e0c4.gif) 2
2
|
4.12 | 4.14 | 5.71 |
| κ L/W cm−1 K−1 (calc.) | 0.020 | 0.028 | 0.040 |
| κ L/W cm−1 K−1 (exp.) | 0.025 | 0.020 | 0.030 |
Finally, we note that the vibrational Debye temperatures of both the lead and the chalcogenide anion are approximately linear with the reduced mass of the compound PbX. On this basis, the calculated vibrational Debye temperatures for the potential thermoelectric phase PbPo are estimated as θD Pb = 91 K, and θD Po = 67 K. Verification of these estimates for PbPo we leave to more intrepid experimental investigators, or alternatively, the first principles calculations that are now being carried out on this phase.78–86
Conclusions
The temperature dependence of the crystal structure and lattice parameter of PbSe-I, coupled with literature values of the isochoric heat capacity, show that the thermoelastic properties of this compound may be approximated by the two-term Debye oscillator model that was developed for the isostructural compounds PbS-I and PbTe-I. Fitting of the unit cell volume and isochoric heat capacity to this model finds two characteristic temperatures of 104(3) K and 219(5) K with associated Grüneisen constants of 1.79 and 2.28. Vibrational Debye temperatures derived from fitting the temperature variation of the atomic displacement parameters (Pb 111(1) K, Se 205(1) K) are in excellent agreement with the characteristic temperatures derived from the volume/heat capacity fitting. At 298 K the bulk modulus of PbSe-I is 47.9(4) GPa with pressure derivative 5.5(2) and a structural phase transition to PbSe-II is observed at a pressure of 5.16(1) GPa. At 150 K the identical transition is observed at the lower pressure of 4.18(1) GPa, and, in the absence of intermediate temperature data,defines an initial Clapeyron slope of 151 K GPa−1.Conflicts of interest
There are no conflicts top declare.Acknowledgements
We are grateful to the two anonymous reviewers for their comments and improvements to the submission and to Prof. Ghim Wei Ho for editorial handling of the manuscript. We thank The Science and Technology Facilities Council for access to the HRPD and PEARL instruments of the ISIS neutron spallation source. KSK would like to thank Dr Paul F. Schofield (The Natural History Museum), Prof. Neil C. Hyatt (University of Sheffield) and Prof. Ian G. Wood (University College, London) for kindly arranging visiting positions.Notes and references
- E. Yu. Tonkov, High Pressure Phase Transformations, A Handbook, Vol. 2, Gordon and Breach, Philadelphia, 1988 Search PubMed.
- Y. I. Ravich, B. A. Efimova and I. A. Smirnov, Semiconducting Lead Chalcogenides, Springer, New York, 1970 Search PubMed.
- D. Parker and D. J. Singh, Phys. Rev. B: Condens. Matter Mater. Phys., 2010, 82, 035204 CrossRef.
- T. C. Chasapis, Y. Lee, E. Hatzikraniotis, K. M. Paraskevopoulos, H. Chi, C. Uher and M. G. Kanatzidis, Phys. Rev. B: Condens. Matter Mater. Phys., 2015, 91, 085207 CrossRef.
- D. Parker, D. J. Singh, Q. Zhang and Z. Ren, J. Appl. Phys., 2012, 111, 123701 CrossRef.
- S. V. Ovsyannikov and V. V. Shchennikov, Chem. Mater., 2010, 22, 635 CrossRef CAS.
- D. V. Talapin and C. B. Murray, Science, 2005, 310, 86 CrossRef CAS PubMed.
- T. K. Chaudhuri, Int. J. Energy Res., 1992, 16, 481 CrossRef CAS.
- H. Preier, Appl. Phys., 1979, 20, 189 CAS.
- H. Zogg, A. Fach, C. Maissen, J. Masek and S. Blunier, Opt. Eng., 1994, 33, 1440 CrossRef CAS.
- A. V. Powell and P. Vaqueiro in Thermoelectric Materials and Devices, ed. I Nandhakumar, N M White and S Beeby, RSC Energy & Environment Series No. 17, 2016, Chapter 2, pp. 27–59 Search PubMed.
- X. Shi, L. Chen and C. Uher, Int. Mater. Rev., 2016, 61, 379 CrossRef CAS.
- R. Freer and A. V. Powell, J. Mater. Chem. C, 2020, 8, 441 RSC.
- C. Gayner and K. K. Kar, Prog. Mater. Sci., 2016, 83, 330 CrossRef CAS.
- M. G. Kanatzidis, Chem. Mater., 2010, 22, 648 CrossRef CAS.
- K. F. Hsu, S. Loo, F. Guo, W. Chen, J. S. Dyck, C. Uher, T. Horgan, E. K. Polychroniadis and M. G. Kanatzidis, Science, 2004, 303, 818 CrossRef CAS PubMed.
- H. Wang, A. D. LaLonde, Y. Pei and G. J. Snynder, Adv. Funct. Mater., 2013, 23, 1586 CrossRef CAS.
- K. Biswas, J. He, I. D. Blum, C.-I. Wu, T. P. Hogan, D. N. Seidman, V. P. Dravid and M. G. Kanatzidis, Nature, 2012, 489, 414 CrossRef CAS PubMed.
- Y. Pei, N. A. Heinz, A. LaLonde and G. J. Snyder, Energy Environ. Sci., 2011, 4, 3640 RSC.
- J. Androulakis, C. H. Lin, H.-J. Kong, C. Uher, C.-I. Wu, T. Hogan, B. A. Cook, T. Caillat, K. M. Paraskevopoulos and M. G. Kanatzidis, J. Am. Chem. Soc., 2007, 129, 9780 CrossRef CAS PubMed.
- Y. Pei, J. Lensch-Falk, E. S. Toberer, D. L. Medlin and G. J. Snyder, Adv. Funct. Mater., 2011, 21, 241 CrossRef CAS.
- K. Biswas, J. He, Q. Zhang, G. Wang, C. Uher, V. P. Dravid and M. G. Kanatzidis, Nat. Chem., 2011, 3, 160 CrossRef CAS PubMed.
- P. F. P. Poudeu, J. D’Angelo, A. Downey, J. Short, T. Hogan and M. Kanatzidis, Angew. Chem., Int. Ed., 2006, 45, 3835 CrossRef CAS PubMed.
- T.-R. Wei, C.-F. Wu, F. Li and J.-F. Li, J. Materiomics, 2018, 4, 304 CrossRef.
- C. Gayner, K. K. Kar and W. Kim, Mater. Today Energy, 2018, 9, 359 CrossRef.
- S. Wang, G. Zheng, T. Luo, X. She, H. Li and X. Tang, J. Phys. D: Appl. Phys., 2011, 44, 475304 CrossRef.
- Q. Zhang, F. Cao, W. Liu, K. Lukas, B. Yu, S. Chen, C. Opeil, D. Broido, G. Chen and Z. Ren, J. Am. Chem. Soc., 2012, 134, 10031 CrossRef CAS PubMed.
- Q. Zhang, H. Wang, W. Liu, H. Wang, B. Yu, Q. Zhang, Z. Tian, G. Ni, S. Lee, K. Esfarjani, G. Chen and Z. Ren, Energy Environ. Sci., 2012, 5, 5246 RSC.
- Q. Zhang, E. K. Chere, K. McEnaney, M. Yao, F. Cao, Y. Ni, S. Chen, C. Opeil, G. Chen and Z. Ren, Adv. Energy Mater., 2015, 5, 1401977 CrossRef.
- Y. Lee, S.-H. Lo, C. Chen, H. Sun, D.-Y. Chung, T. C. Chasapis, C. Uher, V. P. Dravid and M. G. Kanatzidis, Nat. Commun., 2014, 5, 3640 CrossRef CAS PubMed.
- H. Wang, Z. M. Gibbs, Y. Takagiwa and G. J. Snyder, Energy Environ. Sci., 2014, 7, 804 RSC.
- Y.-F. Pei and Y. Liu, J. Alloys Compd., 2012, 514, 40 CrossRef CAS.
- Y. Zhang, X. Ke, C. Chen, J. Yang and P. R. C. Kent, Phys. Rev. B: Condens. Matter Mater. Phys., 2009, 80, 024304 CrossRef.
- M. E. Manley, O. Hellman, N. Shulumba, A. F. May, P. J. Stonaha, J. W. Lynn, V. O. Garlea, A. Alatas, R. P. Hermann, J. D. Budai, H. Wang, B. C. Sales and A. J. Minnich, Nat. Commun., 2019, 10, 1928 CrossRef CAS PubMed.
- N. Shulumba, O. Hellmann and A. J. Minnich, Phys. Rev. B, 2017, 95, 014302 CrossRef.
- S. Lee, K. Esfarjani, T. Luo, J. Zhou, Z. Tian and G. Chen, Nat. Commun., 2014, 5, 3525 CrossRef PubMed.
- M. Xu, S. Jakobs, R. Mazzarello, J.-Y. Cho, Z. Yang, H. Hollermann, D. Shang, X. Miao, Z. Yu, L. Wang and M. Wuttig, J. Phys. Chem. C, 2017, 121, 25447 CrossRef CAS.
- C. L. Bull, N. P. Funnell, M. G. Tucker, S. Hull, D. J. Francis and W. G. Marshall, High Pressure Res., 2016, 36, 493–511 CrossRef.
- W. G. Marshall and D. J. Francis, J. Appl. Crystallogr., 2002, 35, 122–125 CrossRef CAS.
- B. O. Loopstra and H. M. Rietveld, Acta Crystallogr., Sect. B: Struct. Sci., 1969, 25, 787 CrossRef CAS.
- B. van Laar and H. Schenk, Acta Crystallogr., Sect. A: Found. Adv., 2018, 74, 88 CrossRef PubMed.
- A. C. Larson and R. B. Von Dreele, General Structure Analysis System (GSAS), Los Alamos National Laboratory Report LAUR, pp. 86–748 ( 1986) Search PubMed.
- B. H. Toby, J. Appl. Crystallogr., 2001, 34, 210–213 CrossRef CAS.
- A. D. Fortes, Acta Crystallogr., Sect. B: Struct. Sci., Cryst. Eng. Mater., 2018, 74, 196–216 CrossRef CAS PubMed.
- K. S. Knight, J. Phys.: Condens. Matter, 2014, 26, 385403 CrossRef CAS PubMed.
- K. S. Knight, Phys. Chem. Miner., 2015, 42, 235–242 CrossRef CAS.
- K. S. Knight, Can. Mineral., 2016, 54, 1–11 CrossRef.
- V. F. Sears, Neutron News, 1992, 3, 26–37 CrossRef.
- J. P. Poirier, Introduction to the Physics of the Earth's Interior, 2nd edition, Cambridge University Press, Cambridge, UK, 2000 Search PubMed.
- Y. Li, G. Li, C. Lin, X. Li and J. Liu, J. Appl. Phys., 2014, 116, 053502 CrossRef.
- S. Wang, C. Zang, Y. Wang, L. Wang, J. Zhang, C. Childs, H. Ge, H. Xu, H. Chen, D. He and Y. Zhang, Inorg. Chem., 2015, 54, 4981–4989 CrossRef CAS PubMed.
- G. Lippmann, P. Kästner and W. Wanninger, Phys. Status Solidi A, 1971, 6, K159–K161 CrossRef CAS.
- P. R. Vijayaraghaven, S. K. Sinha and P. K. Iyengar, Proc. Nucl. Phys. Solid State Phys. Symp., 1963, 16C, 208–210 Search PubMed.
- A. A. Chudinov, Kristallografiya, 1963, 8, 473–475 CAS.
- D. B. Sirdeshmukh and K. G. Subhadra, J. Appl. Phys., 1986, 59, 276–277 CrossRef CAS.
- S. Haussühl, Physical Properties of Crystals, An Introduction, Wiley-VCH, Weinheim, 2007 Search PubMed.
- K. M. Raju, Acta Phys. Pol., A, 2010, 118, 600–605 CrossRef CAS.
- K. P. Thakur, J. Phys. Chem. Solids, 1980, 41, 465–472 CrossRef CAS.
- J. M. Skelton, S. C. Parker, A. Togo, I. Tanaka and A. Walsh, Phys. Rev. B: Condens. Matter Mater. Phys., 2014, 89, 205203 CrossRef.
- Y. Noda, K. Masumoto, S. Ohba, Y. Saito, K. Toriumi, Y. Iwata and I. Shibuya, Acta Crystallogr., Sect. C: Cryst. Struct. Commun., 1987, 43, 1443–1445 CrossRef.
- R. W. James, The Optical Principles of the Diffraction of X-rays, G. Bell and Sons Limited, London, England, 1962.
- I. G. Wood, K. S. Knight, G. D. Price and J. A. Stuart, J. Appl. Crystallogr., 2002, 35, 291–295 CrossRef CAS.
- B. C. Sales, D. G. Mandrus and B. C. Chakoumakos, Semiconduct. Semimet., 2001, 70, 1–36 CAS.
- D. C. Wallace, Thermodynamics of Crystals, Wiley, New York, USA, 1972 Search PubMed.
- D. C. Wallace, Statistical Physics of Crystals and Liquids, World Scientific, Singapore, 2002 Search PubMed.
- F. Reif, Fundamentals of Statistical and Thermal Physics, McGraw-Hill, New York, USA, 1965 Search PubMed.
- K. S. Knight and N. Bonanos, Solid State Ionics, 2013, 232, 112–122 CrossRef CAS.
- K. S. Knight and C. L. Bull, Solid State Sci., 2016, 62, 90–104 CrossRef CAS.
- K. S. Knight, C. L. Bull and P. McIntyre, Mater. Chem. Phys., 2017, 199, 393–407 CrossRef CAS.
- S. N. Lykov and I. A. Chernik, Fiz. Tverd. Tela, 1982, 24, 3102–3105 CAS.
- D. H. Parkinson and J. E. Quarrington, Proc. Phys. Soc., London, Sect. A, 1954, 67, 569–579 CrossRef.
- S. I. Novikova and N. K. Abrikosov, Fiz. Tverd. Tela, 1963, 5, 1913–1916 CAS.
- E. S. Božin, C. D. Malliakas, P. Souvatzis, T. Proffen, N. A. Spaldin, M. G. Kanazidis and S. J. Billinge, Science, 2010, 330, 1660 CrossRef PubMed.
- T. Keiber, F. Bridges and B. C. Sales, Phys. Rev. Lett., 2013, 111, 095504 CrossRef CAS PubMed.
- D. T. Morelli, V. Jovovic and J. P. Heremans, Phys. Rev. Lett., 2008, 101, 035901 CrossRef CAS PubMed.
- H. Wang, Y. Pei, A. D. LaLonde and G. J. Snyder, Adv. Mater., 2011, 23, 1366 CrossRef CAS PubMed.
- D. T. Morelli and G. A. Slack ( 2006) High Lattice Thermal Conductivity Solids. in High Thermal Conductivity Materials, ed. Shindé S. L. and Goela J. S., Springer, New York, NY Search PubMed.
- Y.-P. Wang, W.-X. Ji, C.-W. Zhang, P. Li and P.-J. Wang, J. Mater. Chem. C, 2016, 4, 8745 RSC.
- D. C. Gupta and I. H. Bhat, J. Mol. Model., 2013, 19, 3481 CrossRef CAS PubMed.
- C.-J. Kang and B. I. Min, Phys. Rev. B: Condens. Matter Mater. Phys., 2016, 93, 041104 CrossRef.
- Y. Bencherif, A. Boukra, A. Zaoui and M. Ferhat, Phys. B, 2012, 407, 3520 CrossRef CAS.
- P. Bhardwaj and S. Singh, Phase Transit., 2015, 88, 859 CrossRef CAS.
- S. Rabii, Phys. Rev. B: Condens. Matter Mater. Phys., 1978, 10, 1876 CrossRef.
- S. Nie, X. Y. Xu, G. Xu and Z. Fang, Chin. Phys. B, 2016, 25, 037311 CrossRef.
- S. Rabii and R. H. Lasseter, Phys. Rev. Lett., 1974, 33, 703 CrossRef CAS.
- D. Singh, V. Bhalla, J. Bala and S. Wadhwa, Z. Naturforsch., A: Phys. Sci., 2017, 72, 977 CrossRef CAS.
- Y. Bencherif, A. Boukra, A. Zaoui and M. Ferhat, Infrared Phys. Technnol., 2011, 54, 39–43 CrossRef CAS.
- S.-H. Wei and A. Zunger, Phys. Rev. B: Condens. Matter Mater. Phys., 1997, 55, 13605–13610 CrossRef CAS.
- K. Hummer, A. Grüneis and G. Kresse, Phys. Rev. B: Condens. Matter Mater. Phys., 2007, 75, 195211 CrossRef.
- E. A. Albanesi, C. M. I. Okoye, C. O. Rodriguez, E. L. Peltzer y Blanca and A. G. Petukhov, Phys. Rev. B: Condens. Matter Mater. Phys., 2000, 61, 16589–16595 CrossRef CAS.
| This journal is © The Royal Society of Chemistry 2022 |

