 Open Access Article
Near-infrared absorbing aza-BODIPYs with 1,7-di-tert-butyl groups by low-barrier rotation for photothermal application†
Sicheng
Li‡
a,
Meiheng
Lv‡
ab,
Jie
Wang‡
c,
Dongxiang
Zhang‡
a,
Zhangrun
Xu
 c and
Xin-Dong
Jiang
 *a
*a
aLiaoning & Shenyang Key Laboratory of Functional Dye and Pigment, Shenyang University of Chemical Technology, Shenyang, 110142, China. E-mail: xdjiang@syuct.edu.cn
bState Key Laboratory of Molecular Reaction Dynamics, Dalian Institute of Chemical Physics, Chinese Academy of Sciences, Dalian 116023, P. R. China
cDepartment of Chemistry, College of Sciences, Northeastern University, Shenyang 110819, China
First published on 30th November 2021
Abstract
Near-infrared absorbing aza-BODIPYs with 1,7-di-tert-butyl groups (tBuazaBDP) were successfully synthesized. Based on X-ray crystal analysis, S-tBuazaBDP is found to be more twisted than the reported dye tetraphenyl aza-BODIPY. tBuazaBDPs possess excellent optical properties such as high molar extinction coefficients, broad full width at half maxima, and large Stokes shifts. Experimental results and theoretical calculations proved that the distal –tBu groups in S-tBuazaBDP can undergo a low-barrier rotation. Although this low-barrier rotation of the distal –tBu groups in tBuazaBDP leads to a low quantum yield, the photothermal conversion efficiency and the singlet oxygen generation ability of S-tBuazaBDP-NPs are obviously enhanced, which are highly desirable for a photothermal therapy agent.
1. Introduction
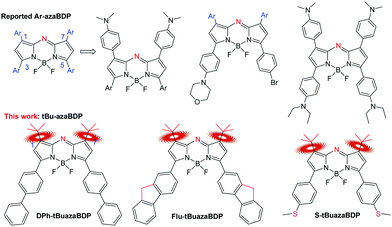
Since azadipyrromethene was first reported in 1943 by M. Rogers, aza-BODIPYs have been attracting increasing attention.1–3 Owing to their near-infrared (NIR) absorption, high molar extinction coefficient and adjustable wavelength, aza-BODIPYs are widely applied in NIR dyes, fluorescent chemosensors, sensitized solar cells, photodynamic therapy (PDT), photothermal therapy (PTT) and so forth.4–10 All these applications directly reflect one or more of three pathways they follow to return to the ground state from the excited state, that is, emitting photons (fluorescence), following non-radiative relaxation pathways (heat generation), or exiting from the singlet to the triplet state (T1) via intersystem crossing (ISC) to generate singlet oxygen with oxygen.11–15 Recently, PTT and PDT, which correspond to the latter two pathways, have aroused widespread interest in the phototherapeutic field. Therefore, the closing of the fluorescent channel is key to establishing their application for PTT and/or PDT.16–23Compared with PDT, PTT has the advantage of not being restricted by the tumor hypoxic environment. To enhance photothermal conversion efficiency, first of all, it is necessary to select a NIR light. High tissue penetration requires a photothermal transduction agent (PTA) for NIR absorption, enhancing light absorption, and decreasing light scattering.24–26 Enhancement of energy conversion is achieved by the charge induced effect or the rotation of the bulk groups (such as –CF3) for nonradiative decay.27–29 On the one hand, intramolecular photoinduced electron transfer is successfully established between the dimethylamino unit and the dye, contributing largely to the enhanced photothermal conversion efficiency (PCE) via nonradiative decay of the excited photons.30,31 Based on theoretical calculations and steady-state and time-resolved photoluminescence spectra, the intramolecular photoinduced electron transfer was proved to increase the probability of the excited photons to follow a nonradiative decay path for enhancing photothermal conversion.32–35 On the other hand, the rotational mode can also promote efficient nonradiative decay, that is, by enhancing the conversion of light into heat. For example, Peng et al. reported a NIR light-driving barrier-free group rotation (–CF3) with high photothermal conversion efficiency.36–39 Therefore, when a PTA absorbs light, heat and/or cytotoxic ROS can be produced via non-radiative decay or intersystem crossing (ISC) for PTT and/or PDT to induce apoptosis or necrosis of tumor cells.40–43 So, the temperature of the tumor tissue surrounding the PTA rapidly increases (> 50 °C) and achieves tumor ablation.44–47 Most inorganic nanomaterials are known to usually suffer from the defects of poor biodegradability and heavy metal leakage, which hinder their comprehensive application.48–51 In contrast, organic phototherapy reagents are found to show prominent biodegradability and low toxicity in phototherapy.52–58 Some literatures about organic phototherapy reagents have reported to enhance nonradiative decay pathways.59–61 The traditional organic dye aza-BODIPY displays more favorable red-shifted absorbance compared with the common organic phototherapy reagents like porphyrin and phthalocyanine derivatives.62,63 Furthermore, aza-BODIPYs have high molar extinction coefficients in the NIR region with good photostability, and are therefore promising candidates for tumor theranostics. For example, the groups of Huang, Dong, Zhao and others have reported valuable structures related to “NMe2-bearing” aza-BODIPY derivatives (Fig. 1).64–66 In their systems, the dialkylamino group caused photoinduced electron transfer, which quenched the fluorescence of aza-BODIPYs, resulting in the creation of a PTT effect. Moreover, when combining PTT and PDT effects, highly efficient therapeutics was obtained.67,68 However, based on this mechanism of the charge induced effect, only 1,7,3,5-tetra-aryl aza-BODIPY-based PTAs in the aza-BODIPY system were reported to act as PTT/PDT synergetic agents for anticancer. Therefore, a highly efficient NIR aza-BODIPY-based phototherapy agent is still desired and remains to be developed. Up to now, only two examples of non-aryl substituted aza-BODIPY structures have been reported.69,70 So, the unique spectral properties and rules of non-aryl substituted aza-BODIPY dyes are still unknown, and the new applications of the functional enhancement are not clear. Our previous work on aza-BODIPYs paved the way to the discovery of non-aryl substituted aza-BODIPYs.71–74 Herein, a novel non-aryl substituted aza-BODIPY, that is, aza-BODIPY with the –tBu groups at 1,7-positions (tBuazaBDP), was skillfully constructed to undertake an original research work (Fig. 1). Since the rotation of the bulk groups for nonradiative decay can promote energy conversion, tBuazaBDP as a promising platform is further explored for photothermal conversion and singlet oxygen generation in this work.
2. Experimental
All the chemicals and solvents used in this work were of analytical grade and were purchased from Energy Chemical & Technology (Shanghai) Co. Ltd and used without further purification. 1H NMR spectra were recorded on a VARIAN Mercury 400 or 500 MHz spectrometer. 1H NMR chemical shifts (δ) are given in ppm downfield from Me4Si, determined by residual chloroform (δ = 7.26 ppm). 13C NMR spectra were recorded on a VARIAN Mercury 125 MHz spectrometer in CDCl3; all signals are reported in ppm with the internal chloroform signal at δ 77.0 ppm as the standard. Fluorescence spectra were recorded on an F-4600 spectrophotometer and are reported in cm−1. UV/Vis spectra were recorded on a UV-2550 spectrophotometer at room temperature. The refractive index of the medium was measured by using a 2 W Abbe's refractometer at 20 °C.The fluorescence quantum yields (Φf) of the aza-BODIPY systems were calculated using the following relationship (eqn (1)):
| Φf = ΦrefFsamplArefn2sampl/FrefAsampln2ref | (1) |
Here, F denotes the integral of the corrected fluorescence spectrum, A is the absorbance at the excitation wavelength, n is the refractive index of the medium, and ref and sampl denote parameters from the reference and unknown experimental samples, respectively.
The reference system used was aza-BODIPY as the standard (Φf = 0.36 in chloroform, λabs = 688 nm)14 for S/DPh/Flu-tBuazaBDP.
Crystals suitable for X-ray structure determination were mounted on a Mac Science DIP2030 imaging plate diffractometer and irradiated with graphite monochromated Mo-Kα radiation (λ = 0.71073 Å) for data collection. The unit cell parameters were determined by separately auto-indexing several images in each data set using the DENZO program (MAC Science).75 For each data set, the rotation images were collected in 3° increments with a total rotation of 180° about the φ axis. The data were processed using SCALEPACK. The structures were solved by a direct method with the SHELX-97 program.76 Refinement on F2 was carried out using the full-matrix least-squares method with the SHELX-97 program. All non-hydrogen atoms were refined using the anisotropic thermal parameters. The hydrogen atoms were included in the refinement along with the isotropic thermal parameters.
All theoretical calculations of this work were performed based on density functional theory (DFT) and time-dependent density functional theory (TDDFT) methods via the Gaussian 16 program suite.77 Becke's three-parameter hybrid exchange function with the Lee–Yang–Parr gradient-corrected correlation functional augmented by Grimme's D3-dispersion correction with the Becke–Johnson damping function (B3LYP-D3BJ) and the 6-31G(D) basis set were selected for the calculations. And the solvation effects of dichloromethane were also taken into consideration with the solvation model based on density (SMD).
The singlet oxygen (1O2) quantum yields of DPh-tBuazaBDP, Flu-tBuazaBDP and S-tBuazaBDP were determined by the equation ΦΔ = ΦΔst × (S/Sst) × (Fst/F) × (PFst/PF), where S is the slope of the change in the absorbance of DPBF at the absorbance maxima with the irradiation time. F is the absorption correction factor, which is given as F = 1–10−A, and PF is the absorbed photonic flux (μEinstein dm−3 s−1). Singlet oxygen yield with 2,6-diiodobodipy (ΦΔ = 0.85 in toluene) was used as the standard. The optical power density was measured by using a CEL-NP 2000 power meter.
The nanoparticles of Flu-tBuazaBDP and S-tBuazaBDP were prepared by nanoprecipitation with F127. A mixture of F127 (5 mg) and S-tBuazaBDP (2 mg) was dissolved in THF (1 ml). The solution was subjected to ultrasound for 1 min. Then, 200 μL of this solution was injected into distilled water (10 ml) with ultrasound at room temperature. The mixture was stirred overnight for the removal of THF. Subsequently, the desired S-tBuazaBDP-NPs could be obtained by centrifugation at 6000 rpm for 5 min. With the same procedure, Flu-tBuazaBDP-NPs were prepared.
Photothermal conversion efficiency calculation. For the purpose of evaluating the photothermal ability of S-tBuazaBDP-NPs and Flu-tBuazaBDP-NPs, the effect of solution on conversion efficiency was discussed. S-tBuazaBDP-NPs or Flu-tBuazaBDP-NPs were irradiated by a 690 nm laser at a power density of 0.8 W cm−2. The temperature changes were monitored by using a FLIR-1910582 thermal camera. S-tBuazaBDP-NPs or Flu-tBuazaBDP-NPs at 20 μM concentration were prepared and irradiated with a 690 nm laser (0.8 W cm−2) for 5 min. The temperature changes were monitored during irradiation. To measure the photothermal conversion efficiency, S-tBuazaBDP-NPs or Flu-tBuazaBDP-NPs were exposed to 690 nm irradiation at 0.8 W cm−2 for 5 min, and then the solution was cooled down to room temperature. The temperature of the solution was recorded at an interval of 30 s during this process.
The photothermal conversion efficiency (η) was measured according to the reported method:
| η = (hs(Tmax–Tsurr)–QDis)/(I × (1–10−A690)) |
h is the heat transfer coefficient and s is the surface area of the container. QDis represents heat dissipated from the laser mediated by the solvent and container. For both S-tBuazaBDP-NPs and Flu-tBuazaBDP-NPs, I is the laser power and A is the absorbance at 690 nm.
| hs = mCH2O/τs |
m is the mass of the solution containing the photoactive material, C is the specific heat capacity of the solution (CH2O = 4.2 J g−1 °C), and τs is the associated time constant.
T = −τsln![[thin space (1/6-em)]](https://www.rsc.org/images/entities/char_2009.gif) (θ) (θ) |
θ is a dimensionless parameter, known as the driving force temperature.
| θ = (T–Tsurr)/(Tmax–Tsurr) |
T max and Tsurr are the maximum steady state temperature and the environmental temperature, respectively.
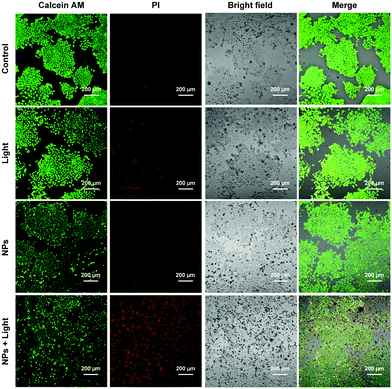
For the live and dead cell staining tests, human colon cancer cells (LoVo) were seeded onto 35 mm confocal dishes for 24 h, and then the cells were subjected to the following treatments: Control, where cells were incubated without any treatments; Control + Light, where cells were irradiated with a 635 nm laser (10 mW cm−2) for 20 min followed by incubation with 20 μM S-tBuazaBDP-NPs at 37 °C for 4 h; S-tBuazaBDP-NPs + Light, where cells were incubated with 20 μM S-tBuazaBDP-NPs at 37 °C for 4 h, followed by 635 nm laser irradiation (10 mW cm−2) for 20 min. After incubation for 4 h, cells were stained with the Calcein AM/PI Apoptosis Detection Kit according to the manufacturer's instructions, and imaged by confocal laser scanning microscopy (Olympus FV-3000). Calcein AM was excited with a 488 nm laser, and detected in the range from 500 to 540 nm; PI was excited with a 488 nm laser, and detected in the range from 650 to 690 nm.
Full information on synthesis, NMR, HRMS and so forth is provided in the ESI.†
3. Results and discussion
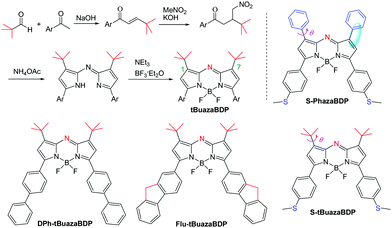
Using 3,3-dimethylbutan-2-one, aza-BODIPYs with the −tBu groups at 1,7-positions (tBuazaBDPs) were prepared (Scheme 1). 4,4-Dimethyl-1-(thiophen-2-yl)pent-2-en-1-one was obtained by aldol condensation. After that, nitro derivatives of chalcones were synthesized by using 1,4-Michael addition. Then, by the formation of a bridge between an imino group and the complex of BF3·Et2O, the target dyes tBuazaBDPs with the −tBu groups at 1,7-positions were obtained. NMR and HRMS spectra of them further verified their formulation. Moreover, the structure of S-tBuazaBDP was distinctly confirmed by X-ray crystal analysis (Fig. 2). The C1–C23 bond (1.507 Å) in S-tBuazaBDP is shorter than the classical C–C bond (1.54 Å) of alkanes. The sp3 hybridized boron center in S-tBuazaBDP appeared in a distorted tetrahedral geometry with the angles N1–B1–N2 of 105.5° and F1–B1–F2 of 110.0°, which deviated from the ideal value of 119.5°. Surprisingly, the C2–C3–N1–B1 dihedral angles were 170.1° and deviated from the ideal value 180, indicating that the boron atom more upwarped from the core structure of S-tBuazaBDP (Fig. 2b). Especially, the C23–C1–C4–N3 dihedral angles were 8.2° and the C16–C13–C12–N3 dihedral angles were 3.7°; the two –tBu groups in S-tBuazaBDP were located at both sides of the core (Fig. 2b). In brief, the molecular structure of S-tBuazaBDP was severely twisted.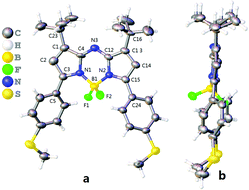 | ||
| Fig. 2 ORTEP views of S-tBuazaBDP (CCDC: 2117398). (a) Front and (b) side views of the molecular structures. The C, H, B, N, F and S atoms are depicted with thermal ellipsoids set at the 30% probability level. | ||
Since the −tBu group was directly introduced into the parent nucleus of aza-BODIPY, we were curious to gain insight into the spectral properties (Fig. 3 and Table 1). Compared to the reported dye S-PhazaBDP with the phenyl groups at 1,7-positions (λabs/λem= 702/746 nm, Φf = 0.06) (Scheme 1 and Table 1),78 the maxima of the absorption (666 nm) and fluorescence spectra (713 nm) of S-tBuazaBDP were indeed blue-shifted by 36 nm and 33 nm respectively, but were still located at the NIR region. These results are mainly due to the reduction of the conjugated system, when replacing –Ph with the –tBu group. And, its fluorescence quantum yield was found to be reduced to 0.04, and the molar extinction coefficient was also reduced to 85![[thin space (1/6-em)]](https://www.rsc.org/images/entities/char_2009.gif) 000 M−1 cm−1, owing to the ICT effect of the electron-rich methylthioether substituents and non-radiative relaxation offered by the rotation of the −tBu group. Although the spectral properties have some attenuation after the −tBu substitution, they are still in the tolerance range, which is comparable to those of the classical dyes BODIPYs or rhodamines.2,3 Especially, 1,7-di-tert-butyl substituted S-tBuazaBDP showed a larger Stokes shift (SS: 47 nm) and a broader full width at half maxima (FWHM: 73 nm), compared to those of S-PhazaBDP (SS: 43 nm; FWHM: 52 nm). Taken together, the large Stokes shift for S-tBuazaBDP may be indicative of significant differences between the geometry of S-tBuazaBDP in its S0 and S1 states, leading to an unfavorable Franck–Condon factor. In addition, compared to DPh-tBuazaBDP with the biphenyl groups, Flu-tBuazaBDP with the luorine substituents by freezing biphenyl rotation has a longer wavelength and higher molar extinction coefficients. Due to non-radiative relaxation by the rotation of the −tBu group, both DPh-tBuazaBDP (Φf = 0.13) and Flu-tBuazaBDP (0.12) were found to have low quantum yields, and these are just potentially suitable for phototherapeutic application.
000 M−1 cm−1, owing to the ICT effect of the electron-rich methylthioether substituents and non-radiative relaxation offered by the rotation of the −tBu group. Although the spectral properties have some attenuation after the −tBu substitution, they are still in the tolerance range, which is comparable to those of the classical dyes BODIPYs or rhodamines.2,3 Especially, 1,7-di-tert-butyl substituted S-tBuazaBDP showed a larger Stokes shift (SS: 47 nm) and a broader full width at half maxima (FWHM: 73 nm), compared to those of S-PhazaBDP (SS: 43 nm; FWHM: 52 nm). Taken together, the large Stokes shift for S-tBuazaBDP may be indicative of significant differences between the geometry of S-tBuazaBDP in its S0 and S1 states, leading to an unfavorable Franck–Condon factor. In addition, compared to DPh-tBuazaBDP with the biphenyl groups, Flu-tBuazaBDP with the luorine substituents by freezing biphenyl rotation has a longer wavelength and higher molar extinction coefficients. Due to non-radiative relaxation by the rotation of the −tBu group, both DPh-tBuazaBDP (Φf = 0.13) and Flu-tBuazaBDP (0.12) were found to have low quantum yields, and these are just potentially suitable for phototherapeutic application.
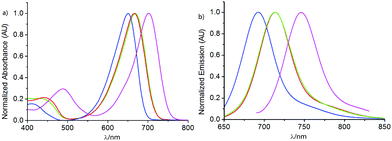 | ||
| Fig. 3 (a) Normalized absorption and (b) fluorescence spectra of DPh-tBuazaBDP (blue curve), Flu-tBuazaBDP (green), S-tBuazaBDP (red) and S-PhazaBDP (pink) in CH2Cl2 at 298 K. | ||
| Dye | λ abs/λem [nm] | Stokes shift [nm] | FWHM [nm] | ε [M−1 cm−1] | Φ f | Φ Δ |
|---|---|---|---|---|---|---|
| DPh-tBuazaBDP | 650/693 | 43 | 69 | 83![[thin space (1/6-em)]](https://www.rsc.org/images/entities/char_2009.gif) 000 000 |
0.13 | 0.06 |
| Flu-tBuazaBDP | 668/713 | 45 | 74 | 84![[thin space (1/6-em)]](https://www.rsc.org/images/entities/char_2009.gif) 000 000 |
0.12 | 0.04 |
| S-tBuazaBDP | 666/713 | 47 | 73 | 85![[thin space (1/6-em)]](https://www.rsc.org/images/entities/char_2009.gif) 000 000 |
0.04 | 0.05 |
| S-PhazaBDP | 702/746 | 44 | 52 | 105![[thin space (1/6-em)]](https://www.rsc.org/images/entities/char_2009.gif) 000 000 |
0.06 | — |
To further gain an insight into the optical difference between DPh-tBuazaBDP and Flu-tBuazaBDP, solvent effect experiments were carried out in solvents ranging from n-hexane to DMSO (Fig. S1, S2 and Table S1, ESI†). The absorption maximum of DPh-tBuazaBDP is 644 nm in the non-polar solvent n-hexane, compared to 658 nm in the polar solvent DMSO. The absorption maximum is scarely affected by the solvent polarity with all maxima found in a narrow interval of 14 nm, indicating that the solvent–solute interaction is indeed inappreciable in the ground state of DPh-tBuazaBDP. In contrast to the absorption spectra, the increase of the maximum fluorescence peaks and the increase of the half-width of the fluorescence band with increasing solvent polarity were remarkable. The maxima of the fluorescence spectra showed a considerable red-shift (23 nm) on going from n-hexane (682 nm) to DMSO (705 nm). But, the full width at half maxima (FWHM) and the molar extinction coefficients in the different solvents were not obviously changed. In Flu-tBuazaBDP, the introduction of the luorine substituents by freezing biphenyl rotation led to a red shift of about 20 nm and a wider FWHM in various solvents, compared to those of DPh-tBuazaBDP (Fig. 3). However, the Stokes shifts of Flu-tBuazaBDP were smaller than those of DPh-tBuazaBDP.
To unravel the secret of different luminescence properties of S-tBuazaBDP and S-PhazaBDP, theoretical simulations were conducted based on DFT and TDDFT methods. The calculated electronic spectra of both molecules (Fig. S1 and Table S1, ESI†) are in accordance with the experimental results, which manifests the reliability of the theoretical results. The primary absorption and emission peaks of S-tBuazaBDP both correspond to the S0–S1 transition, which consists of the transition between the highest occupied molecular orbital (HOMO) and the lowest unoccupied molecular orbital (LUMO). As shown in Fig. 4, the electron density of the HOMO is mainly distributed on non-tBu groups, whereas that of the LUMO is mainly located on the core of the BODIPY, which indicates that the S0–S1 transition has a slight charge-transfer property. Similar to S-tBuazaBDP, the primary absorption and emission peaks of S-PhazaBDP also correspond to the S0–S1 transition, which is contributed by the HOMO–LUMO transition. Different from S-tBuazaBDP, both HOMO and LUMO orbitals of S-PhazaBDP show a π electron distribution on the top phenyl group. The elongated conjugation system leads to red shift of the absorption and emission peak of S-PhazaBDP.
The molecular rotation can be restrained in viscous media, and the corresponding fluorescence enhancement could be observed.79 However, the emission intensities of S-tBuazaBDP were not sensitive to solvent viscosity (Fig. S4, ESI†), indicating that the −tBu rotation is not strictly limited. Moreover, to reveal the better photothermal effect of S-tBuazaBDP, the rotation process of the top substituted groups of S-tBuazaBDP and S-PhazaBDP was compared, as shown in Fig. 5. The scan process covers 180° rotation divided into 6 steps. The small energy barrier for the −tBu group rotation of S-tBuazaBDP, 2.1 kcal mol−1, suggests its free rotation in solution, which causes more system energy to be released through the non-radiative way. In comparison, the –Ph group rotation of S-PhazaBDP is more difficult in view of the higher energy barrier of 4.2 kcal mol−1, which may be attributed to the conjugation between phenyl parts and the pyrrole segment in S-PhazaBDP (Scheme 1).
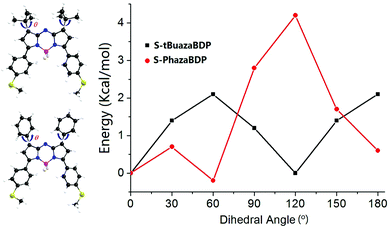 | ||
| Fig. 5 Energy levels of the S0 states of the chemical bond for S-tBuazaBDP and S-PhazaBDP with the dihedral angle θ. | ||
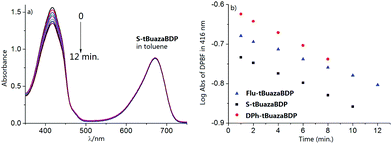
PDT is recognized as a clinical noninvasive modality for the treatment of solid tumors, and the photosensitizer is the critical component of PDT. To gain further insight into singlet oxygen generation of tBuazaBDP dyes, experiments were carried out. tBuazaBDPs in toluene were irradiated with monochromatic light at 650 nm by using a 150 W xenon lamp at 0.5 mW cm−2. By utilizing 1,3-diphenylisobenzofuran (DPBF) as the singlet oxygen indicator, the efficiency of singlet oxygen generation was evaluated by detecting the decrease of DPBF absorbance at 416 nm (Fig. 6a and Fig. S2, S3, ESI†). According to the linear relationship of the decay curves (Fig. 6b), the 1O2 quantum yields of Flu-tBuazaBDP, S-tBuazaBDP and DPh-tBuazaBDP were calculated to be 0.04, 0.05 and 0.06 respectively, which are slightly higher than that (0.02) of the reported dye tetraphenyl aza-BODIPY (Fig. S4, ESI†).80 These results indicated that attaching the −tBu groups at 1,7-positions in the aza-BODIPY system is still a slightly effective strategy to enhance the singlet oxygen generation. No photobleaching of such dyes was observed during these experiments.
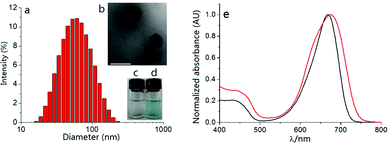
The self-assembly method of dye S-tBuazaBDP and the hydrophilic polymer poloxamer (F127) into nanoparticles was employed (Fig. 7a and b). S-tBuazaBDP-NPs were water soluble (Fig. 7d). The morphology and size of the nanoparticles were measured by utilizing transmission electron microscopy (TEM). As depicted in Fig. 7b, S-tBuazaBDP-NPs were spherical nanoparticles with a diameter below 110 nm. The polydispersity experiments were performed by using dynamic light scattering (DLS). As illustrated in Fig. 7a, the mean hydrodynamic diameter and polydispersity (PDI) of S-tBuazaBDP-NPs were about 50.23 nm and 0.186. There was no precipitation after S-tBuazaBDP-NPs were placed in water for ten days, suggesting that the nanoparticles have favourable stability (Fig. 7c and d). In the absorption spectra, we can perceive that the maximum absorption wavelength of S-tBuazaBDP-NPs produced a significant red-shift effect and showed a broader peak than S-tBuazaBDP in CH2Cl2 (Fig. 7e), which is attributed to the π–π stacking interaction.
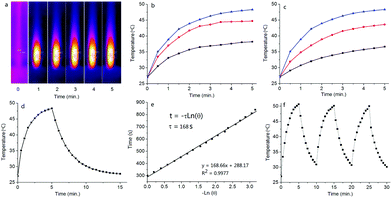
The photothermal conversion effect of S-tBuazaBDP-NPs was further investigated. When employing a 690 nm laser (0.8 W cm−2) as a light source to irradiate S-tBuazaBDP-NPs in water solutions with different concentrations (20, 40 and 80 μM) (Fig. 8b), the temperature of the S-tBuazaBDP-NPs solution significantly increased along with the light irradiation time and concentrations. For instance, the temperature of S-tBuazaBDP-NPs can be rapidly increased by 8.1 °C after 1 min light irradiation, and the temperature can reach 48.3 °C after 5 min light irradiation, which is beneficial for photothermal therapy in biological systems (Fig. 8a and b). As shown in Fig. S5 (ESI†), it can be clearly seen that the temperature of the blank solution almost does not change (ΔT: 0.9–1.1 °C) under light irradiation. These results showed that S-tBuazaBDP-NPs have a good potential capacity for photothermal therapy. Moreover, when we adjust the 690 nm laser at different power densities (0.4, 0.6 and 0.8 W cm−2) to irradiate 80 μM S-tBuazaBDP-NPs, we found that the solution temperature gradually increased with the increase of power density, indicating that the photothermal effect of S-tBuazaBDP-NPs was also power density-dependent (Fig. 8c). To study the photothermal conversion efficiency, a photothermal generation-dissipation curve was recorded and depicted, based on the temperature changes of the heating and cooling curves (Fig. 8d and e). Then, the photothermal conversion efficiency of S-tBuazaBDP-NPs was calculated to be 49%, which is near to the highest one (50.5%) in the aza-BODIPY system.81 Next, in order to evaluate the photothermal stability of S-tBuazaBDP-NPs, we used a 690 nm laser (0.8 W cm−2) to irradiate the dyes in aqueous solution (80 μM) for 5 min and then cooled them naturally, and the temperature changes were recorded during the process of heating–cooling cycles. As shown in Fig. 8f, the solution temperature increased gradually under light irradiation; upon stopping irradiation, the solution temperature began to decrease gradually. Three heating–cooling cycles were conducted, and the temperature variation was negligible (Fig. 8f), suggesting that S-tBuazaBDP-NPs have excellent thermal stability.
For Flu-tBuazaBDP NPs, the temperature of the solution reached 47.6 °C after 5 min of illumination (0.8 W cm−2) (Fig. S6, ESI†), but was slightly less than that (48.3 °C) of S-tBuazaBDP-NPs. The photothermal effect of Flu-tBuazaBDP-NPs was also optical density- and concentration-dependent. According to the temperature changes of the heating and cooling curves (Fig. S6d, e, ESI†), the photothermal conversion efficiency of Flu-tBuazaBDP-NPs was calculated to be 47%, which is comparable to that (35–50.5%) of the reported aza-BODIPY-based PTAs.60
MTT assay was conducted to further assess the effects of light irradiation and S-tBuazaBDP-NPs concentrations on human colon cancer cell (LoVo) viability. As shown in Fig. S7 (ESI†), the results showed that S-tBuazaBDP-NPs have low dark-toxicity and high photo-toxicity. To visualize the effect of phototherapeutic performance of S-tBuazaBDP-NPs, live–dead cell staining was carried out. After human colon cancer cells were cultured to a certain density, cells in different dishes were treated with the control group, the sole light treatment group, the sole dye treatment group, and dye treatment followed by light irradiation. A 635 nm NIR laser (10 mW·cm−2, 20 min) was employed as the light source, and the S-tBuazaBDP-NPs concentration was 20 μM. AM indicated living cells (green fluorescence) and PI indicated dead cells (red fluorescence). From laser confocal microscope imaging observation, the initial three groups showed significant green fluorescence (Fig. 9), and almost no red fluorescence was observed. Once light irradiation was applied after S-tBuazaBDP-NPs were added to cells, red fluorescence was obviously observed, and almost no green fluorescence was observed. In addition, the bright field imaging revealed that the cancer cells became round and showed an obvious state of death, while the other three groups of cancer cells grew well. Therefore, it can be stated that S-tBuazaBDP-NPs could produce effective heat to kill cancer cells under light irradiation, while the dark toxicity was negligible. According to intracellular phototherapeutic experiments, S-tBuazaBDP-NPs had good biocompatibility, low dark-toxicity, and the ability of effectively killing cancer cells and inhibiting the growth of cancer cells under the condition of light irradiation, which are highly desirable for an effective and potential tumor phototherapeutic reagent.
4. Conclusions
Using 3,3-dimethylbutan-2-one, aza-BODIPYs with −tBu groups at 1,7-positions (tBuazaBDPs) were prepared. Based on X-ray crystal analysis, two –tBu groups in S-tBuazaBDP were found to be located at both sides of the core resulting in a severely twisted structure. tBuazaBDPs with the –tBu groups at 1,7-positions were indeed blue-shifted, but still locating in the NIR region. The fluorescence quantum yield of S-tBuazaBDP was found to be lower, owing to the ICT effect of the electron-rich methylthioether substituents and non-radiative relaxation offered by the rotation of the −tBu group. Compared to DPh-tBuazaBDP with the biphenyl groups, Flu-tBuazaBDP with the fluorene substituents by freezing biphenyl rotation has a longer wavelength and higher molar extinction coefficients. The electron density of the HOMO is mainly distributed on non-tBu groups in S-tBuazaBDP, whereas that of the LUMO is mainly located on the core of aza-BODIPY, indicating that the S0–S1 transition has a slight charge-transfer property. Different from S-tBuazaBDP, both HOMO and LUMO orbitals of S-PhazaBDP show a π electron distribution on the top phenyl group. Experimental results and theoretical calculations proved that the distal –tBu groups in S-tBuazaBDP can undergo a low-barrier rotation. The 1O2 quantum yields (0.04–0.06) of tBuazaBDPs were calculated to be low, but are slightly higher than that (0.02) of the classical dye tetraphenyl aza-BODPY. According to the temperature changes of the heating and cooling curves, the photothermal conversion efficiency of S-tBuazaBDP-NPs was calculated to be 49%, which is near to the highest one (50.5%) in the aza-BODIPY system. S-tBuazaBDP-NPs had good biocompatibility, low dark-toxicity, and the ability of effectively killing cancer cells and inhibiting the growth of cancer cells under the condition of light irradiation, which are highly desirable for an effective and potential tumor phototherapeutic reagent.Conflicts of interest
There are no conflicts to declare.Acknowledgements
This work was supported by the National Natural Science Foundation of China (22078201, U1908202), “Chunhui Program” cooperative research project of Education Ministry, Natural Science Foundation of Liaoning (2021-NLTS-12-06), Liaoning BaiQianWan Talents Program, serving local project of Education Department of Liaoning (LZ2020005) and Distinguished Professor Project of Liaoning (20183532). We thank Prof. Yohsuke Yamamoto and Dr Rong Shang (Hiroshima University) for their help.Notes and references
- M. A. T. Rogers, Nature, 1943, 151, 504–505 CrossRef CAS.
- A. Loudet and K. Burgess, Chem. Rev., 2007, 107, 4891–4932 CrossRef CAS PubMed.
- G. Ulrich, A. Harriman and R. Ziessel, Angew. Chem., Int. Ed., 2008, 47, 1184–1201 CrossRef CAS PubMed.
- T. Rappitsch and S. M. Borisov, Chem. – Eur. J., 2021, 27, 10685–10692 CrossRef CAS PubMed.
- S. I. Reja, M. Minoshima, Y. Hori and K. Kikuchi, Chem. Sci., 2021, 12, 3437–3447 RSC.
- X. Li, S. Kolemen, J. Yoon and E. U. Akkaya, Adv. Funct. Mater., 2017, 1604053 CrossRef.
- F. W. Dagnaw, Y. Cai and Q. Song, Dyes Pigm., 2021, 189, 109257 CrossRef CAS.
- H. Klfout, A. Stewart, M. Elkhalifa and H. He, ACS Appl. Mater. Interfaces, 2017, 46, 39873–39889 CrossRef PubMed.
- Y. Cakmak, S. Kolemen, S. Duman, G. Y. Dede, Y. Dolen, B. Kilic, Z. Kostereli, L. Tatar-Yildirim, A. L. Dogan, D. Guc and E. U. Akkaya, Angew. Chem., Int. Ed., 2011, 50, 11937–11941 CrossRef CAS PubMed.
- H. Zhu, P. Cheng, P. Chen and K. Pu, Biomater. Sci., 2018, 6, 746–765 RSC.
- Y. Dong, B. Dick and J. Zhao, Org. Lett., 2020, 22, 5535–5539 CrossRef CAS PubMed.
- J. Jiménez, R. Prieto-Montero, B. L. Maroro, F. M. Jiménez, M. J. Ortiz, A. Oliden-Sánchez, Í. López-Arbeloa, V. Martínez-Martínez and S. M. Cerero, Chem. – Eur. J., 2020, 22, 601–605 CrossRef PubMed.
- Y. Dong, B. Dick and J. Zhao, Org. Lett., 2020, 22, 5535–5539 CrossRef CAS PubMed.
- A. Gorman, J. Killoran, C. O’Shea, T. Kenna, W. M. Gallagher and D. F. O’Shea, J. Am. Chem. Soc., 2004, 126, 10619–10631 CrossRef CAS PubMed.
- V. Nguyen, Y. Yan, J. Zhao and J. Yoon, Acc. Chem. Res., 2021, 54, 207–220 CrossRef CAS PubMed.
- G. Li, X. Zhang, W. Zhao, F. Li, K. Xiao, Q. Yu, S. Liu and Q. Zhao, ACS Appl. Mater. Interfaces, 2020, 12, 20180–20190 CrossRef CAS PubMed.
- M. Kang, H. Liu and J. C. Kah, J. Mater. Chem. B, 2020, 47, 10812–10824 RSC.
- J. Feng, W. Ren, F. Kong and Y. Dong, Inorg. Chem. Front., 2021, 8, 848–879 RSC.
- Z. Shi, X. Han, W. Hu, H. Bai, B. Peng, L. Ji, Q. Fan, L. Li and W. Huang, Chem. Soc. Rev., 2020, 49, 7533–7567 RSC.
- H. S. Jung, J. H. Lee, K. Kim, S. Koo, P. Verwilst, J. L. Sessler, C. Kang and J. S. Kim, J. Am. Chem. Soc., 2017, 139, 9972–9978 CrossRef CAS PubMed.
- J. H. Zou, P. Wang, Y. Wang, G. Y. Liu, Y. W. Zhang, Q. Zhang, J. J. Shao, W. L. Si, W. Huang and X. C. Dong, Chem. Sci., 2019, 10, 268–276 RSC.
- X. Miao, W. Hu, T. He, H. Tao, Q. Wang, R. F. Chen, L. Jin, H. Zhao, X. Lu, Q. Fan and W. Huang, Chem. Sci., 2019, 10, 3096–3102 RSC.
- W. Hu, X. Miao, H. Tao, A. Baev, C. Ren, Q. Fan, T. He, W. Huang and P. N. Prasad, ACS Nano, 2019, 13, 12006–12014 CrossRef CAS PubMed.
- M. J. Schnermann, Nature, 2017, 551, 176–177 CrossRef CAS PubMed.
- W. Sun, S. Guo, C. Hu, J. Fan and X. Peng, Chem. Rev., 2016, 116, 7768–7817 CrossRef CAS PubMed.
- X. Zhao, Q. Yao, S. Long, W. Chi, Y. Yang, D. Tan, X. Liu, H. Huang, W. Sun, J. Du, J. Fan and X. Peng, J. Am. Chem. Soc., 2021, 143, 12345–12354 CrossRef CAS PubMed.
- S. Liu, X. Zhou, H. Zhang, H. Ou, J. W. Y. Lam, Y. Liu, L. Shi, D. Ding and B. Z. Tang, J. Am. Chem. Soc., 2019, 141, 5359–5368 CrossRef CAS PubMed.
- S. Sasaki, G. P. C. Drummen and G. Konishi, J. Mater. Chem. C., 2016, 4, 2731–2743 RSC.
- X.-D. Jiang, T. Fang, X. Liu and D. Xi, Eur, J. Org. Chem., 2017, 5074–5079 CAS.
- Y. Liu, N. Song, L. Chen, S. Liu and Z. Xie, Chem. – Asian J., 2018, 16, 989–995 CrossRef PubMed.
- Y. Zhang, Z. Yang, X. Zheng, L. Chen and Z. Xie, J. Mater. Chem. B, 2020, 8, 5305–5311 RSC.
- G. Feng, G. Zhang and D. Ding, Chem. Soc. Rev., 2020, 49, 8179–8234 RSC.
- Y. Xu, T. Feng, T. Yang, H. Wei, H. Yang, G. Li, M. Zhao, S. Liu, W. Huang and Q. Zhao, ACS Appl. Mater. Interfaces, 2018, 10, 16299–16307 CrossRef CAS PubMed.
- B. Wang, G. Feng, M. Seifrid, M. Wang, B. Liu and G. C. Bazan, Angew. Chem., Int. Ed., 2017, 56, 16063–16066 CrossRef CAS PubMed.
- W. Chi, Q. Qiao, R. Lee, W. Liu, Y. S. Teo, D. Gu, M. J. Lang, Y. Chang, Z. Xu and X. Liu, Angew. Chem., Int. Ed., 2019, 58, 7073–7077 CrossRef CAS PubMed.
- D. Xi, M. Xiao, J. Cao, L. Zhao, N. Xu, S. Long, J. Fan, K. Shao, W. Sun, X. Yan and X. Peng, Adv. Mater., 2020, 1907855 CrossRef CAS PubMed.
- H. Wang, H. Zhang, Y. Xiang, W. Pan, N. Li and B. Tang, Nanoscale, 2021, 13, 8790–8794 RSC.
- Q. Zou, M. Abbas, L. Zhao, S. Li, G. Shen and X. Yan, J. Am. Chem. Soc., 2017, 139, 1921–1927 CrossRef CAS PubMed.
- D. Wang, M. M. S. Lee, W. Xu, G. Shan, X. Zheng, R. T. K. Kwok, J. W. Y. Lam, X. Hu and B. Z. Tang, Angew. Chem., Int. Ed., 2019, 58, 5628–5632 CrossRef CAS PubMed.
- D. Chen, Q. Tang, J. Zou, X. Yang, W. Huang, Q. Zhang, J. Shao and X. Dong, Adv. Healthc. Mater., 2018, 7, e1701272 CrossRef PubMed.
- A. H. Ashoka, S. H. Kong, B. Seeliger, B. Andreiuk, R. V. Soares, M. Barberio, M. Diana and A. S. Klymchenko, Biomaterials, 2020, 261, 120306 CrossRef CAS PubMed.
- L. Liu, H. He, Z. Luo, H. Zhou, R. Liang, H. Pan, Y. Ma and L. Cai, Adv. Funct. Mater., 2020, 30, 1910176 CrossRef CAS.
- X. Huang, J. Wu, M. He, X. Hou, Y. Wang, X. Cai, H. Xin, F. Gao and Y. Chen, Mol. Pharmaceutics, 2019, 16, 2172–2183 CrossRef CAS PubMed.
- J. Zhou, Y. Jiang, S. Hou, P. K. Upputuri, D. Wu, J. Li, P. Wang, X. Zhen, M. Pramanik, K. Pu and H. Duan, ACS Nano, 2018, 12, 2643–2651 CrossRef CAS PubMed.
- Z. Zhang, W. Xu, M. Kang, H. Wen, H. Guo, P. Zhang, L. Xi, K. Li, L. Wang, D. Wang and B. Tang, Adv. Mater., 2020, 32, 2003210 CrossRef CAS PubMed.
- J. Huang, Y. Huang, Z. Xue and S. Zeng, Biomaterials, 2020, 262, 120346 CrossRef CAS PubMed.
- H. Chen, H. Cheng, Q. Dai, Y. Cheng, Y. Zhang, D. Li, Y. Sun, J. Mao, K. Ren, C. Chu and G. Liu, J. Controlled Release, 2020, 323, 635–643 CrossRef CAS PubMed.
- A. M. Gobin, E. M. Watkins, E. Quevedo, V. L. Colvin and J. L. West, Small, 2010, 6, 745–752 CrossRef CAS PubMed.
- D. Wang, Z. Guo, J. Zhou, J. Chen, G. Zhao, R. Chen, M. He, Z. Liu, H. Wang and Q. Chen, Small, 2015, 11, 5956–5967 CrossRef CAS PubMed.
- H. Bi, Y. Dai, J. Xu, R. Lv, F. He, S. Gai, D. Yang and P. Yang, J. Mater. Chem. B, 2016, 4, 5938–5946 RSC.
- S. Zhang, K. Yang and Z. Liu, Sci. China: Chem., 2010, 53, 2217–2225 CrossRef CAS.
- Y. Jiao, K. Liu, G. Wang, Y. Wang and X. Zhang, Chem. Sci., 2015, 6, 3975–3980 RSC.
- S. Ye, J. Rao, S. Qiu, J. Zhao, H. He, Z. Yan, T. Yang, Y. Deng, H. Ke, H. Yang, Y. Zhao, Z. Guo and H. Chen, Adv. Mater., 2018, 30, 1801216 CrossRef PubMed.
- J. Zhou, Y. Jiang, S. Hou, P. K. Upputuri, D. Wu, J. Li, P. Wang, X. Zhen, M. Pramanik, K. Pu and H. Duan, ACS. Nano., 2018, 12, 2643–2651 CrossRef CAS PubMed.
- Q. Zou, M. Abbas, L. Zhao, S. Li, G. Shen and X. Yan, J. Am. Chem. Soc., 2017, 139, 1921–1927 CrossRef CAS PubMed.
- B. Guo, G. Feng, P. N. Manghnani, X. Cai, J. Liu, W. Wu, S. Xu, X. Cheng, C. Teh and B. Liu, Small, 2016, 12, 6243–6254 CrossRef CAS PubMed.
- C. S. Jin, J. F. Lovell, J. Chen and G. Zheng, ACS Nano, 2013, 7, 2541–2550 CrossRef CAS PubMed.
- S. Su, Y. Ding, Y. Li, Y. Wu and G. Nie, Biomaterials., 2016, 80, 169–178 CrossRef CAS PubMed.
- P. Liang, Q. Tang, Y. Cai, G. Liu, W. Si, J. Shao, W. Huang, Q. Zhang and X. Dong, Chem. Sci., 2017, 8, 7457–7463 RSC.
- J. Y. Liu, P. Bhattarai, Z. Dai and X. Chen, Chem. Soc. Rev., 2019, 48, 2053–2108 RSC.
- L. Wang and C. Niu, J. Mater. Chem. B, 2021, 9, 4079–4097 RSC.
- L. Li, X. Han, M. Wang, C. Li, T. Jia and X. Zhao, Chem. Eng. J., 2021, 417, 128844 CrossRef CAS.
- J. Han and K. Burgess, Chem. Rev., 2010, 110, 2709–2728 CrossRef CAS PubMed.
- X. Miao, W. Hu, T. He, H. Tao, Q. Wang, R. F. Chen, L. Jin, H. Zhao, X. Lu, Q. Fan and W. Huang, Chem. Sci., 2019, 10, 3096–3102 RSC.
- Q. Yu, X. Huang, T. Zhang, W. Wang, D. Yang, J. Shao and X. Dong, Chem. Res. Chin. Univ., 2021, 37, 951–959 CrossRef CAS.
- Y. Xu, T. Feng, T. Yang, H. Wei, H. Yang, G. Li, M. Zhao, S. Liu, W. Huang and Q. Zhao, ACS Appl. Mater. Interfaces, 2018, 10, 16299–16307 CrossRef CAS PubMed.
- J. Yin, X. Jiang, G. Sui, Y. Du, E. Xing, R. Shi, C. Gu, X. Wen, Y. Feng, Z. Shan and S. Meng, J. Mater. Chem. B, 2021, 9, 7461–7471 RSC.
- W. Zhang, L. Yu, Y. Jiang and C. Guo, Biomater. Sci., 2021, 9, 5302–5318 RSC.
- D. Wu and D. F. O’Shea, Org. Lett., 2013, 15, 3392–3395 CrossRef CAS PubMed.
- X.-D. Jiang, D. Xi, J. Zhao, H. Yu, G. Sun and L. Xiao, RSC Adv., 2014, 4, 60970–60973 RSC.
- X.-D. Jiang, S. Li, B. L. Guennic, D. Jacquemin, D. Escudero and L. Xiao, Phys. Chem. Chem. Phys., 2016, 18, 32686–32690 RSC.
- T. Fang, X.-D. Jiang, C. Sun and Q. Li, Sen. Actuators, B, 2019, 290, 551–557 CrossRef CAS.
- X.-D. Jiang, Y. Toya, S. Matsukawa, S. Kojima, J. O. C. Jimenez-Halla, R. Shang, M. Nakamoto and Y. Yamamoto, Chem. Sci., 2019, 10, 3466–3472 RSC.
- C. Li, H. Ge, D. Zhang, C. Sun, S. Yue, X.-D. Jiang and J. Du, Sen. Actuators, B, 2021, 344, 130213 CrossRef CAS.
- Z. Otwinowski and W. Minor, Methods Enzymol., 1997, 276, 307–326 CAS.
- G. M. Sheldrick, SHELX-97, University of Göttingen, Göttingen, Germany, 1997 Search PubMed.
- M. J. Frisch, G. W. Trucks, H. B. Schlegel, G. E. Scuseria and M. A. Robb, et al., Gaussian 09W, revision A.1., Gaussian Inc., Wallingford, CT, 2009 Search PubMed.
- X.-D. Jiang, X. Liu, T. Fang and C. Sun, Dyes Pigm., 2017, 146, 438–444 CrossRef CAS.
- W. Chi, Q. Qiao, R. Lee, W. Liu, Y. S. Teo, D. Gu, M. J. Lang, Y. Chang, Z. Xu and X. Liu, Angew. Chem., Int. Ed., 2019, 58, 7073–7077 CrossRef CAS PubMed.
- Z. Yu, J. Zhou, X. Ji, G. Lin, S. Xu, X. Dong and W. Zhao, J. Med. Chem., 2020, 63, 9950–9964 CrossRef CAS PubMed.
- Y. Xu, S. Wang, Z. Chen, R. Hu, S. Li, Y. Zhao, L. Liu and J. Qu, J. Nanobiotechnol., 2021 DOI:10.1186/s12951-021-00782-y.
Footnotes |
| † Electronic supplementary information (ESI) available. CCDC 2117398. For ESI and crystallographic data in CIF or other electronic format see DOI: 10.1039/d1ma01052b |
| ‡ These authors contributed equally to this work. |
| This journal is © The Royal Society of Chemistry 2022 |

