 Open Access Article
Creative Commons Attribution 3.0 Unported Licence
Fused triphenylamine moiety based fluorescence emitters for deep blue OLEDs with high luminance and low turn-on voltages†
Lijie
Wu
,
Jinhao
Xu
,
Zewei
Zhang
,
Wangjuan
Xue
,
Tao
Wang
,
Chaoyi
Yan
,
Junpeng
He
,
Yaowu
He
 ,
Hao
Yan
and
Hong
Meng
 *
*
School of Advanced Materials, Peking University Shenzhen Graduate School, Shenzhen 518055, China. E-mail: menghong@pku.edu.cn
First published on 23rd December 2021
Abstract
The design of blue emitters is still desired for high performance organic light-emitting diodes (OLEDs). In this work, two blue emitters with a fused triphenylamine (FTPA) moiety, PIAN-FTPA and PI-FTPA, have been successfully synthesized and exhibited the desired deep blue emission both in solvents and thin films. Aiming at narrowing down the emission peak by the rigid structures of emitters, the devices fabricated with PIAN-FTPA and PI-FTPA achieve the same turn-on voltage of 2.8 V, and external quantum efficiencies (EQEs) of 5.74% and 4.17% with narrow full width at half maxima (FWHM) of 52 nm and 51 nm, respectively. In addition, the PIAN-FTPA device shows a maximum brightness of 24![[thin space (1/6-em)]](https://www.rsc.org/images/entities/char_2009.gif) 000 cd m−2 and deep blue emission with a CIE coordinate of (0.15, 0.09). The high luminance and low turn-on voltages of the devices prove that FTPA derivatives can serve as new candidates for deep blue OLEDs.
000 cd m−2 and deep blue emission with a CIE coordinate of (0.15, 0.09). The high luminance and low turn-on voltages of the devices prove that FTPA derivatives can serve as new candidates for deep blue OLEDs.
Introduction
OLEDs have attracted worldwide attention since their first invention by C. W. Deng in 1986.1 Due to the continuous efforts of scientists, OLEDs have been wildly applied in lighting and display. However, as an indispensable part of display, the blue OLEDs still fall behind the green and red ones because of the intrinsically wider energy gap of blue emitters. The phosphorescent materials which are commercialized in green and red OLEDs are unable to tolerate the energy from blue light, and thus there is an urgent need for high-performance fluorescent blue materials.2 As for the traditional fluorescent materials, the intrinsic limitation of internal quantum efficiency (IQE) strictly confines the maximum EQE which can reach up to 5%. In order to break the limitation, effective approaches have been put forward such as triplet–triplet annihilation (TTA),3–5 thermally activated delayed fluorescence (TADF),6–8 and hybridized local charge transfer (HLCT).9–11 The mentioned strategies aim at recycling triplets as much as possible, but they also suffer from bad color purity, severe efficiency roll-off and short lifetime. In addition, the turn-on voltage of the devices fabricated with large bandgap materials is usually high.12–15 Therefore, the development of deep blue emitters based on pure aromatic structures still remains an urgent concern.Phenanthro[9,10-d]imidazole (PI) is an important building block in the blue OLED materials because of its excellent photoluminescence quantum yield (PLQY) and good electroluminescence (EL) behavior. Various modifications have been employed in the PI group to enhance its performance.16–18 In 2019, Dongge Ma et al. designed and synthesized the material PAC based on PI group and the EQE of the device could reach over 10%.11 This group also explored the substitution position effect of the PI derivatives and NPBI-PPI-TPA achieved extremely small efficiency roll-off with EQEs of 6.88% @100 cd m−2 and 5.34% @10![[thin space (1/6-em)]](https://www.rsc.org/images/entities/char_2009.gif) 000 cd m−2.19 Recently, Wenjun Yang et al. and Vinich Promarak et al. also reported relative molecules with different functional groups and achieved quite good performance.20,21
000 cd m−2.19 Recently, Wenjun Yang et al. and Vinich Promarak et al. also reported relative molecules with different functional groups and achieved quite good performance.20,21
Anthracene is another famous chromogenic group of the blue OLED material. Since the first report of luminance from the anthracene device,22 there have been numerous literatures about anthracene derivatives. To inhibit the easy crystallization of anthracene, side groups such as benzene rings and methyl groups are grafted onto the anthracene core.23–25 Furthermore, functional side groups, for instance, triphenylamine and imidazole are introduced to improve the hole and electron transportation.26,27 Double luminance cores with twisted structures are also reported by scientists.28,29 The reported devices based on anthracene derivative emitters usually boast of high EQE > 5%, which is attributed to the up-conversion mechanism of TTA or hot exciton channel.
In this work, 2-(10-(4-(1-(4-(tert-butyl)phenyl)-1H-phenanthro[9,10-d]imidazol-2-yl)phenyl)anthracen-9-yl)indolo[3,2,1-jk]carbazole (PIAN-FTPA) and 2-(4-(1-(4-(tert-butyl)phenyl)-1H-phenanthro[9,10-d]imidazol-2-yl)phenyl)indolo[3,2,1-jk]carbazole (PI-FTPA) are successfully designed and synthesized, in which the FTPA group is coupled with the PI group at the 9 and 10 positions of the anthracene core or linked directly. The triphenylamine (TPA) group is beneficial for the transport of holes in OLED materials,26,29 but the rotation of internal molecules can broaden the emission peak of the devices, causing a higher color impurity. Fusing the structure of emitters has been an effective method to narrow down the emission peaks as the rigid structure can minimize the relaxation at the excited state. Thus, we use the FTPA group to confine the rotation of the TPA group by fusing the structure of triphenylamine. The relevant chromophore was reported by the group of Jun Yeob Lee and the corresponding blue devices exhibited a narrow FWHM of 35 nm, a maximum EQE of 5.6% and an extended lifetime.30 Impressively, due to the properties of FTPA, PI and the anthracene core mentioned above, the designed materials PIAN-FTPA and PI-FTPA show excellent performance. The fabricated devices can reach EQEs up to 5.74% and 4.17%, brightness values of 24![[thin space (1/6-em)]](https://www.rsc.org/images/entities/char_2009.gif) 000 cd m−2 and 14
000 cd m−2 and 14![[thin space (1/6-em)]](https://www.rsc.org/images/entities/char_2009.gif) 420 cd m−2, FWHM of 52 nm and 51 nm, and deep blue emission with suitable (Commission Internationale de ĺEclairage) CIE coordinates of (0.15, 0.09) and (0.15, 0.07), respectively.
420 cd m−2, FWHM of 52 nm and 51 nm, and deep blue emission with suitable (Commission Internationale de ĺEclairage) CIE coordinates of (0.15, 0.09) and (0.15, 0.07), respectively.
Results and discussion
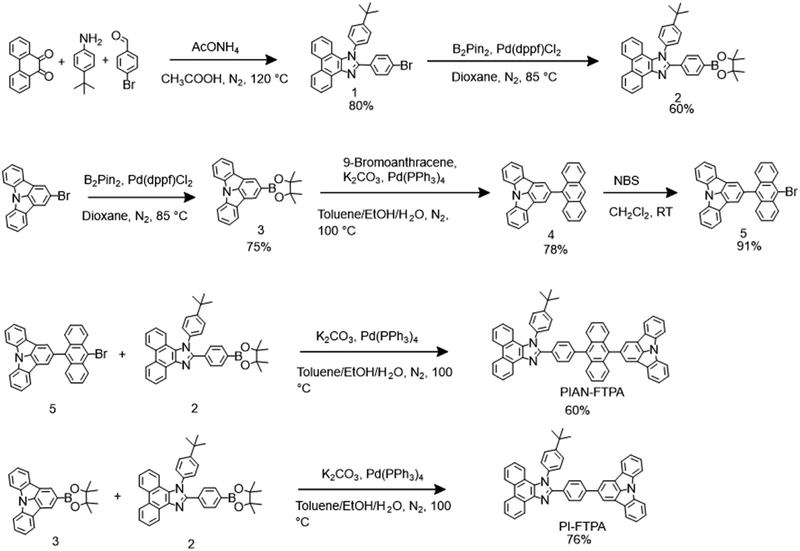
PIAN-FTPA and PI-FTPA were synthesized according to the routes shown in Scheme 1. Detailed procedures are described in the experimental section. The crude products purified by column chromatography were further purified by sublimation three times. The chemical structures of target products were characterized by 1H NMR, 13C NMR, mass spectrum, and elemental analysis. The thermal and photophysical properties of PIAN-FTPA and PI-FTPA are listed in Table 1.| Compound | T d/Tg | λ onset (nm) | λ em,t /λem,fb (nm) | FWHMa/b (nm) | HOMO/LUMO (eV) | E g (eV) | PLQYf (%) | |
|---|---|---|---|---|---|---|---|---|
| Exp.c | Cal.d | |||||||
| a Determined from PIAN-FTPA/PI-FTPA in toluene. b Determined from the film from evaporation. c Determined from electrochemical analysis EHOMO = −4.8 − Eox; ELOMO = EHOMO + bandgap. d Calculated from Gaussian. e Calculated from the onset of the absorption spectra (Eg = 1240/λonset). f Determined from PIAN-FTPA/PI-FTPA in DCM. | ||||||||
| PIAN-FTPA | 498/437 | 420 | 439/455 | 58/62 | −5.50/−2.55 | −5.08/−1.60 | 2.95 | 69 |
| PI-FTPA | 454/355 | 390 | 393&417/425 | 61/75 | −5.50/−2.32 | −5.05/−1.34 | 3.18 | 75 |
Thermal stability
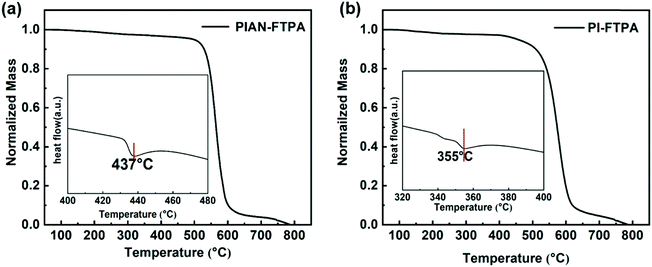
Thermal stability is an important factor of OLED materials, because high Tg guarantees the morphology stability of the emitting layer. We used thermal gravimetric analysis (TGA) and differential scanning calorimetry (DSC) for PIAN-FTPA and PI-FTPA under a N2 atmosphere and the results are demonstrated in Fig. 2. The decomposition temperatures corresponding to a 5% weight loss of PIAN-FTPA and PI-FTPA are 498 °C and 454 °C, respectively. In addition, the glass transition temperatures of PIAN-FTPA and PI-FTPA are 437 °C and 355 °C, respectively. The rigid structure of molecules is beneficial to the thermal stability of PIAN-FTPA and PI-FTPA, and thus the amorphous morphology of evaporated layers is stable during the work time of OLEDs.Molecular modeling
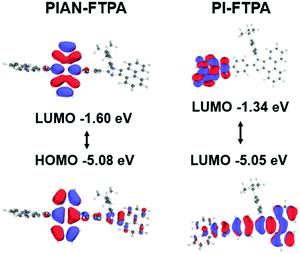
Molecular modeling can assist the analysis of the emitters at the molecular scale. The calculation was modeled using Gaussian density functional theory (DFT) with the basis of B3LYP/6-31G and the result is depicted in Fig. 1. The optimized configurations suggest that the FTPA group is a rigid planar group and shows a small twisted angle with the PI group. The tert butylbenzene group, however, is perpendicular to the PI group, which aviods the closed pack of molecules. The anthracene core in PIAN-FTPA is not parallel to the adjacent groups and confines the distribution of electronic clouds. As for PIAN-FTPA, the highest occupied molecular orbital (HOMO) and lowest unoccupied molecular orbital (LUMO) mainly locate on the anthracene core, indicating local excited characteristics. While PI-FTPA shows a relatively separate HOMO and LUMO location, where HOMO mainly locates on the PI moiety and LUMO locates on the FTPA group, suggesting charge transfer characteristics in the excited state. The calculation results suggest they almost share the same HOMO energy level but PI-FTPA presents a shallower LUMO with a larger bandgap. According to the calculated results, both the materials have large bandgaps of 3.48 eV and 3.71 eV, respectively.Photophysical properties
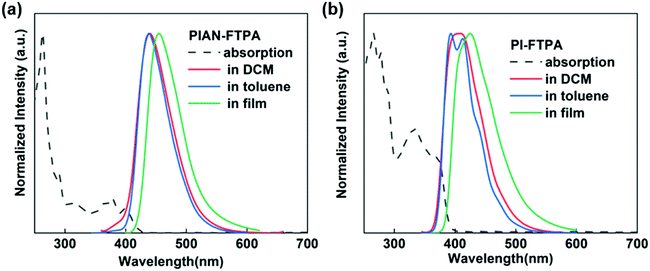
To confirm the physical characteristics of the two materials, the PL and absorption results are depicted in Fig. 3. In the solution of toluene, PIAN-FTPA presents an emission peak at 439 nm and PI-FTPA shows peaks at 393 and 417 nm, respectively. But in dichloromethane (DCM) with a higher polarity, the FWHM of the PI-FTPA emission peak broadens with the increasing interaction intensity of the materials and solvent molecules, which is in accordance with the charge transfer characteristics suggested by DFT calculations. When deposited in films, both the emission peaks show a red-shift because of aggregations. As for the absorption spectra, the absorption band at 270 nm belongs to the π–π* transition of benzene ring. The absorption band from 300 to 400 nm is mainly associated with the π–π* transition of the PI group and the π–π* and n–π* transition of the FTPA moiety. Besides, part of the absorption band between 300 and 400 nm of PIAN-FTPA may be attributed to the anthracene core. According to the absorption band edge of the UV spectrum, the calculated optical energy gaps are 2.95 eV and 3.18 eV.Electrochemical analysis
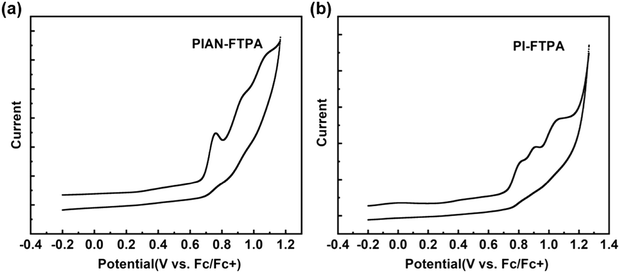
Cyclic voltammograms (CV) were conducted to test the electrochemical properties using a standard three-electrode electrochemical cell in an electrolyte solution of 0.1 M TBAPF6/DMF and ferrocene was used as the reference. Fig. 4 shows that PIAN-FTPA and PI-FTPA share the same HOMO energy level of −5.50 eV. The LUMO values are calculated from the HOMO values and Eg is estimated from the UV onset, which are −2.55 eV for PIAN-FTPA and −2.32 eV for PI-FTPA. The experimental energy levels show the same trend with the calculation values.Electroluminescent devices
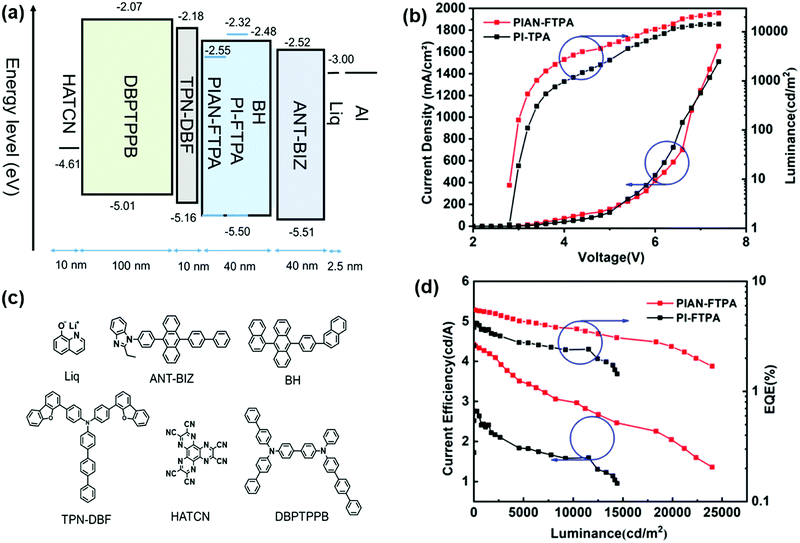
To investigate the EL properties of PIAN-FTPA and PI-FTPA, OLEDs are fabricated with the structure of ITO/HATCN (2.5 nm)/DBPTPPB (100 nm)/TPN-DBF (10 nm)/BD:BH (40 nm)/ANT-BIZ (40 nm)/Liq (2.5 nm)/Al (100 nm). The detailed structure and their HOMO and LUMO energy levels are depicted in Fig. 5. DBPTPPB is used as the hole-transporting layer (HTL); TPN-DBF serves as the electron blocking layer (EBL); and BH is chosen as the host material, which is aimed to prevent the aggregation effects of PIAN-FTPA and PI-FTPA. BD represents the blue dopant PIAN-FTPA and PI-FTPA; ANT-BIZ is used as the electron transport layer (ETL).Fig. 5 displays the performances of the fabricated devices and Table 2 lists them in detail. The optimized doping concentrations are 10% and 1% for PIAN-FTPA and PI-FTPA devices, respectively. The EL peak wavelengths are 449 nm @10% doping concentration with a FWHM of 52 nm and 438 nm @1% doping concentration with a FWHM of 51 nm for PIAN-FTPA and PI-FTPA devices, respectively. They both show a very low turn-on voltage of 2.8 V while that of the reported deep blue OLEDs (CIEy < 0.1) is usually higher than 3.5 V.31,32 DBPTPPB and ANT-BIZ are used as the hole transport material and electron transport material, respectively. They show good energy level matching when in devices and small barriers for carrier injection and transportation. So the experimental turn-on voltages are almost identical to the theoretical values corresponding to the emitted photons. In addition, compared with devices based on similar materials with the TPA group (FWHM is usually higher than 60 nm),17,33 materials with the FTPA group show narrower FWHM when fabricated in device.
| Material | Doping concentration (%) | Turn-on voltage | CE | EQE | FWHM (nm) | CIE | L max | ||
|---|---|---|---|---|---|---|---|---|---|
| Max | @1000 cd m−2 | Max | @1000cd m−2 | ||||||
| PIAN-FTPA | 1 | 3.0 | 2.69 | 2.39 | 3.76 | 3.35 | 53 | 0.15, 0.08 | 11![[thin space (1/6-em)]](https://www.rsc.org/images/entities/char_2009.gif) 670 670 |
| 5 | 2.8 | 3.72 | 3.34 | 5.34 | 4.80 | 52 | 0.15, 0.07 | 19![[thin space (1/6-em)]](https://www.rsc.org/images/entities/char_2009.gif) 810 810 |
|
| 10 | 2.8 | 4.61 | 4.35 | 5.74 | 5.42 | 52 | 0.15, 0.09 | 24![[thin space (1/6-em)]](https://www.rsc.org/images/entities/char_2009.gif) 000 000 |
|
| 15 | 2.8 | 4.60 | 4.32 | 5.14 | 4.83 | 54 | 0.15, 0.10 | 22![[thin space (1/6-em)]](https://www.rsc.org/images/entities/char_2009.gif) 650 650 |
|
| PI-FTPA | 1 | 2.8 | 2.76 | 2.43 | 4.17 | 3.67 | 51 | 0.15, 0.07 | 14![[thin space (1/6-em)]](https://www.rsc.org/images/entities/char_2009.gif) 420 420 |
| 5 | 2.8 | 2.26 | 2.06 | 3.61 | 3.30 | 53 | 0.15, 0.06 | 13![[thin space (1/6-em)]](https://www.rsc.org/images/entities/char_2009.gif) 360 360 |
|
| 10 | 2.8 | 1.54 | 1.37 | 2.52 | 2.25 | 53 | 0.15, 0.06 | 12![[thin space (1/6-em)]](https://www.rsc.org/images/entities/char_2009.gif) 270 270 |
|
| 15 | 2.8 | 1.14 | 1.02 | 1.84 | 1.64 | 53 | 0.15, 0.06 | 11![[thin space (1/6-em)]](https://www.rsc.org/images/entities/char_2009.gif) 490 490 |
|
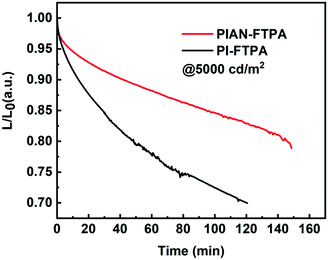
As for PIAN-FTPA devices, with the increase of doping concentration, the current efficiency (CE) increases continuously, and the wavelengths of emission peaks show a slight red-shift because of the intermolecular interaction of the dopant and the host. Due to the mutual influence of the red-shift of the emission peaks and the increase of CE, the EQE reaches its maximum value when the doping concentration reaches 10%. The PIAN-FTPA device shows an EQEmax of 5.74% and a CEmax of 4.61 cd A−1 and it still remains 5.42%@1000 cd m−2 and 4.35 cd A−1 @1000 cd m−2, respectively, which presents a very small efficiency roll-off. The device fabricated with PIAN-FTPA also shows a very high luminance, reaching a maximum brightness of 24![[thin space (1/6-em)]](https://www.rsc.org/images/entities/char_2009.gif) 000 cd m−2. As for PI-FTPA devices, with the decreasing of doping concentration, the performance of devices improves, including CE, EQE and luminance. When the doping concentration is 1%, it presents an EQEmax of 4.17% and a CEmax of 2.76 cd A−1 and retains 3.67%@1000 cd m−2 and 2.43 cd A−1 @1000 cd m−2. In addition, it reaches the highest brightness of 14
000 cd m−2. As for PI-FTPA devices, with the decreasing of doping concentration, the performance of devices improves, including CE, EQE and luminance. When the doping concentration is 1%, it presents an EQEmax of 4.17% and a CEmax of 2.76 cd A−1 and retains 3.67%@1000 cd m−2 and 2.43 cd A−1 @1000 cd m−2. In addition, it reaches the highest brightness of 14![[thin space (1/6-em)]](https://www.rsc.org/images/entities/char_2009.gif) 420 cd m−2, which is not as excellent as PIAN-FTPA devices. But the PI-FTPA device shows better color performance with a CIE coordinate of (0.15, 0.07). The color of PI-FTPA devices is more close to the required CIE coordinate (0.15, 0.06) defined by high-definition television (HDTV) ITU-RBT.709.34 We also conducted the lifetime evaluation of the devices. As is depicted in Fig. 6, the devices fabricated with PIAN-FTPA and PI-FTPA exhibit T80 values of 2.44 h and 0.82 h @5000 cd m−2, respectively. The lifetime of the PIAN-FTPA device is 3 times that of the PI-FTPA device.
420 cd m−2, which is not as excellent as PIAN-FTPA devices. But the PI-FTPA device shows better color performance with a CIE coordinate of (0.15, 0.07). The color of PI-FTPA devices is more close to the required CIE coordinate (0.15, 0.06) defined by high-definition television (HDTV) ITU-RBT.709.34 We also conducted the lifetime evaluation of the devices. As is depicted in Fig. 6, the devices fabricated with PIAN-FTPA and PI-FTPA exhibit T80 values of 2.44 h and 0.82 h @5000 cd m−2, respectively. The lifetime of the PIAN-FTPA device is 3 times that of the PI-FTPA device.
To understand the different performances of the lifetime and CE trends with the doping concentration, hole- and electron-only devices were further fabricated with the following structures: ITO/HATCN (10 nm)/BD:BH (40 nm)/HATCN (10 nm)/Al (100 nm) and ITO/Liq (10 nm)/BD:BH (40 nm)/Liq (10 nm)/Al (100 nm). The J–V curves in Fig. S13 (ESI†) demonstrate that the PIAN-FTPA devices show a more balanced charge injection with increasing doping concentration for PIAN-FTPA but the opposite for PI-FTPA devices. The balanced charge injection on the emitting layer of PIAN-FTPA devices reduces the unfavorable recombination on the adjacent layers or interfaces and enables the longer lifetime and higher CE with increasing doping concentration.
Conclusion
In conclusion, two novel blue OLED emitters PIAN-FTPA and PI-FTPA were successfully designed and synthesized. The thermal stability, photophysical properties, and EL performances were thoroughly investigated. The devices fabricated with PIAN-FTPA and PI-FTPA show a very low turn-on voltage of 2.8 V and reach the maximum luminance values of 24![[thin space (1/6-em)]](https://www.rsc.org/images/entities/char_2009.gif) 000 cd m−2 and 13
000 cd m−2 and 13![[thin space (1/6-em)]](https://www.rsc.org/images/entities/char_2009.gif) 360 cd m−2 with narrow FWHM of 52 nm and 51 nm, respectively. They show not only high EQEs of 5.74% and 4.17% but also deep blue emission with CIE coordinates of (0.15, 0.09) and (0.15, 0.07), respectively. Their turn-on voltage and high luminance are excellent compared with those of the reported non-TADF fluorescence blue OLED materials. This work demonstrates that FTPA derivatives can serve as new candidates for deep-blue OLEDs.
360 cd m−2 with narrow FWHM of 52 nm and 51 nm, respectively. They show not only high EQEs of 5.74% and 4.17% but also deep blue emission with CIE coordinates of (0.15, 0.09) and (0.15, 0.07), respectively. Their turn-on voltage and high luminance are excellent compared with those of the reported non-TADF fluorescence blue OLED materials. This work demonstrates that FTPA derivatives can serve as new candidates for deep-blue OLEDs.
Experimental section
General information
Synthetic procedure
PIAN-FTPA: The synthesis procedure was similar to the method of FTPA-An mentioned above. The final pure product obtained was a yellow powder. 1H NMR (400 MHz, Chloroform-d) δ 9.05 (d, 1H), 8.82 (d, J = 8.4 Hz, 1H), 8.76 (d, J = 8.3 Hz, 1H), 8.16–8.10 (m, 4H), 8.03 (d, J = 8.1, 0.9 Hz, 2H), 7.88 (d, J = 7.8 Hz, 2H), 7.81 (t, J = 7.4 Hz, 1H), 7.78–7.67 (m, 7H), 7.67–7.53 (m, 5H), 7.50 (d, J = 8.1 Hz, 2H), 7.43–7.27 (m, 8H), 1.48 (s, 9H). 13C NMR (101 MHz, CDCl3) 153.71, 143.62, 140.12, 139.37, 138.77, 136.33, 133.82, 131.50, 130.99, 130.10, 129.88, 129.64, 129.55, 128.77, 128.53, 128.32, 127.90, 127.78, 127.60, 127.23, 127.19, 126.85, 126.51, 125.99, 125.93, 125.24, 125.17, 124.27, 123.54, 123.27, 123.20, 123.15, 123.14, 122.70, 122.07, 121.16, 118.60, 112.51, 35.22, 31.55. MS m/z (M+). Calcd for C63H43N3:841.346. Found: 842.353 for [M]+. Anal. Calcd for C63H43N3: C, 89.86; H, 5.15; N, 4.99. Found: C, 90.00; H, 5.198; N, 4.88.
Fabrication of OLEDs and test methods
ITO substrates were ultrasonicated with acetone, water and isopropyl alcohol for 15 minutes, respectively. Later the surface was treated with plasma. Then the organic layers and Al cathode were evaporated to the ITO substrate in a vacuum chamber with a pressure of less than 4 × 10⁻⁷ torr. The emitting area of each pixel was 4.5 mm2. The J–V–L curves of the devices were obtained using a Keithley 2400 semiconductor characterization system with a BM-7A luminance colorimeter. The CIE coordinates and EL spectra were measured by an integrating sphere. The EQE was calculated based upon the EL performance and EL spectra.Conflicts of interest
There are no conflicts to declare.Acknowledgements
This work was financially supported by the Key-Area Research and Development Program of Guangdong Province (2019B010924003), Guangdong Basic and Applied Basic Research Foundation (2020B1515120030), National Natural Science Foundation of China (22005008), Shenzhen Fundamental Research Program (No. GXWD20201231165807007-20200810111340001), Shenzhen Engineering Laboratory (Shenzhen development and reform commission [2018]1410), and Shenzhen Science and Technology Research Grant (JCYJ20200109140425347).References
- C. W. Tang and S. A. VanSlyke, Appl. Phys. Lett., 1987, 51, 913–915 CrossRef CAS.
- J.-H. Lee, C.-H. Chen, P.-H. Lee, H.-Y. Lin, M.-K. Leung, T.-L. Chiu and C.-F. Lin, J. Mater. Chem. C, 2019, 7, 5874–5888 RSC.
- R. G. Kepler, J. C. Caris, P. Avakian and E. Abramson, Phys. Rev. Lett., 1963, 10, 400–402 CrossRef CAS.
- N. A. Kukhta, T. Matulaitis, D. Volyniuk, K. Ivaniuk, P. Turyk, P. Stakhira, J. V. Grazulevicius and A. P. Monkman, J. Phys. Chem. Lett., 2017, 8, 6199–6205 CrossRef CAS PubMed.
- J. S. Huh, Y. H. Ha, S. K. Kwon, Y. H. Kim and J. J. Kim, ACS Appl. Mater. Interfaces, 2020, 12, 15422–15429 CrossRef CAS PubMed.
- H. Uoyama, K. Goushi, K. Shizu, H. Nomura and C. Adachi, Nature, 2012, 492, 234–238 CrossRef CAS PubMed.
- Q. Zhang, B. Li, S. Huang, H. Nomura, H. Tanaka and C. Adachi, Nat. Photonics, 2014, 8, 326–332 CrossRef CAS.
- T. Hatakeyama, K. Shiren, K. Nakajima, S. Nomura, S. Nakatsuka, K. Kinoshita, J. Ni, Y. Ono and T. Ikuta, Adv. Mater., 2016, 28, 2777–2781 CrossRef CAS PubMed.
- Y. Pan, W. Li, S. Zhang, L. Yao, C. Gu, H. Xu, B. Yang and Y. Ma, Adv. Opt. Mater., 2014, 2, 510–515 CrossRef CAS.
- G.-X. Yang, Y. Chen, J.-J. Zhu, J.-Y. Song, S.-S. Tang, D. Ma and Q.-X. Tong, Dyes Pigm., 2021, 187, 109088 CrossRef CAS.
- Y. Xu, X. Liang, X. Zhou, P. Yuan, J. Zhou, C. Wang, B. Li, D. Hu, X. Qiao, X. Jiang, L. Liu, S. J. Su, D. Ma and Y. Ma, Adv. Mater., 2019, 31, e1807388 CrossRef PubMed.
- S.-J. Woo, Y. Kim, M.-J. Kim, J. Y. Baek, S.-K. Kwon, Y.-H. Kim and J.-J. Kim, Chem. Mater., 2018, 30, 857–863 CrossRef CAS.
- W. C. Chen, Y. Yuan, S. F. Ni, Q. X. Tong, F. L. Wong and C. S. Lee, Chem. Sci., 2017, 8, 3599–3608 RSC.
- Z.-L. Zhu, S.-F. Ni, W.-C. Chen, M. Chen, J.-J. Zhu, Y. Yuan, Q.-X. Tong, F.-L. Wong and C.-S. Lee, J. Mater. Chem. C, 2018, 6, 3584–3592 RSC.
- Y. Tan, Z. Zhao, L. Shang, Y. Liu, C. Wei, J. Li, H. Wei, Z. Liu, Z. Bian and C. Huang, J. Mater. Chem. C, 2017, 5, 11901–11909 RSC.
- W. Li, D. Liu, F. Shen, D. Ma, Z. Wang, T. Feng, Y. Xu, B. Yang and Y. Ma, Adv. Funct. Mater., 2012, 22, 2797–2803 CrossRef CAS.
- Y. Zhang, S.-L. Lai, Q.-X. Tong, M.-F. Lo, T.-W. Ng, M.-Y. Chan, Z.-C. Wen, J. He, K.-S. Jeff, X.-L. Tang, W.-M. Liu, C.-C. Ko, P.-F. Wang and C.-S. Lee, Chem. Mater., 2011, 24, 61–70 CrossRef.
- H. Liu, Q. Bai, L. Yao, H. Zhang, H. Xu, S. Zhang, W. Li, Y. Gao, J. Li, P. Lu, H. Wang, B. Yang and Y. Ma, Chem. Sci., 2015, 6, 3797–3804 RSC.
- J.-J. Zhu, Y. Chen, Y.-H. Xiao, X. Lian, G.-X. Yang, S.-S. Tang, D. Ma, Y. Wang and Q.-X. Tong, J. Mater. Chem. C, 2020, 8, 2975–2984 RSC.
- X. Lv, L. Xu, W. Cui, Y. Yu, H. Zhou, M. Cang, Q. Sun, Y. Pan, Y. Xu, D. Hu, S. Xue and W. Yang, ACS Appl. Mater. Interfaces, 2020, 13, 970–980 CrossRef PubMed.
- W. Li, P. Chasing, W. Benchaphanthawee, P. Nalaoh, T. Chawanpunyawat, C. Kaiyasuan, N. Kungwan, S. Namuangruk, T. Sudyoadsuk and V. Promarak, J. Mater. Chem. C, 2021, 9, 497–507 RSC.
- M. Pope, H. P. Kallmann and P. Magnante, J. Chem. Phys., 1963, 38, 2042–2043 CrossRef CAS.
- J. Shi and C. W. Tang, Appl. Phys. Lett., 2002, 80, 3201–3203 CrossRef CAS.
- S.-K. Kim, B. Yang, Y. Ma, J.-H. Lee and J.-W. Park, J. Mater. Chem., 2008, 18, 3376 RSC.
- D. Yokoyama, Y. Park, B. Kim, S. Kim, Y.-J. Pu, J. Kido and J. Park, Appl. Phys. Lett., 2011, 99, 123303 CrossRef.
- S.-K. Kim, B. Yang, Y.-I. Park, Y. Ma, J.-Y. Lee, H.-J. Kim and J. Park, Org. Electron., 2009, 10, 822–833 CrossRef CAS.
- J. Huang, J.-H. Su, X. Li, M.-K. Lam, K.-M. Fung, H.-H. Fan, K.-W. Cheah, C. H. Chen and H. Tian, J. Mater. Chem., 2011, 21, 2957 RSC.
- Y. Y. Lyu, J. Kwak, O. Kwon, S. H. Lee, D. Kim, C. Lee and K. Char, Adv. Mater., 2008, 20, 2720–2729 CrossRef CAS PubMed.
- S. Tao, Y. Zhou, C.-S. Lee, S.-T. Lee, D. Huang and X. Zhang, J. Phys. Chem. Lett., 2008, 112, 14603–14606 CrossRef CAS.
- V. V. Patil, K. H. Lee and J. Y. Lee, J. Mater. Chem. C, 2020, 8, 3051–3057 RSC.
- S. Wang, M. Qiao, Z. Ye, D. Dou, M. Chen, Y. Peng, Y. Shi, X. Yang, L. Cui, J. Li, C. Li, B. Wei and W. Y. Wong, iScience, 2018, 9, 532–541 CrossRef CAS PubMed.
- Y. Yu, Z. Wu, Z. Li, B. Jiao, L. Li, L. Ma, D. Wang, G. Zhou and X. Hou, J. Mater. Chem. C, 2013, 1, 8117 RSC.
- X. Lv, M. Sun, L. Xu, R. Wang, H. Zhou, Y. Pan, S. Zhang, Q. Sun, S. Xue and W. Yang, Chem. Sci., 2020, 11, 5058–5065 RSC.
- A. K. Pal, S. Krotkus, M. Fontani, C. F. R. Mackenzie, D. B. Cordes, A. M. Z. Slawin, I. D. W. Samuel and E. Zysman-Colman, Adv. Mater., 2018, 30, e1804231 CrossRef PubMed.
Footnote |
| † Electronic supplementary information (ESI) available. See DOI: 10.1039/d1ma01044a |
| This journal is © The Royal Society of Chemistry 2022 |

