DOI:
10.1039/D1MA01043C
(Paper)
Mater. Adv., 2022,
3, 3490-3499
Synthesis and characterization of template-mediated mesoporous alumina nanostructures with efficient and fast adsorption of Congo red from aqueous solutions
Received
8th November 2021
, Accepted 27th February 2022
First published on 28th February 2022
Abstract
This article summaries an approach for the removal of organic dyes like Congo red using mesoporous alumina. Industrial effluents that contain dyes need to be treated before being discharged into surface water. The adsorption method has been established as a successful technique. Mesoporous alumina can be a suitable candidate for this adsorption purpose; so, it has been synthesized by the co-precipitation of aluminium sulphate as the aluminium source and a polysorbate type non-ionic surfactant (Tween-40) as the template. The composite was characterized by XRD, TEM, TG-DTA, etc. The calcined product at 600 °C was highly porous in nature having a BET surface area of 94 m2 g−1 as compared to other calcined products. The efficiency of the calcined product towards adsorption of the dye was investigated. This porous alumina out of Tween-40 exhibits excellent adsorption performance for Congo red and the decolourisation efficiency reached 99% in just 25 min. The adsorption parameters like agitation time, adsorbent dose and dye concentration were also varied. Moreover, the adsorption procedure was studied with various adsorption isotherms like Langmuir and Freundlich isotherms. Equilibrium adsorption data followed both Langmuir and Freundlich isotherms with a maximum multilayer adsorption capacity of 615 mg g−1. Thus, the above porous alumina can act as a promising material for dye adsorption and can reduce pollution in waste water.
1. Introduction
Hierarchical nano-structured materials have attracted significant research interest in recent years owing to their features and possible applications in the fields of catalysis,1 adsorption2 and drug delivery3 due to their high surface area and thermal stability. Out of different materials, aluminium oxides are broadly used in ceramics, refractories and abrasives due to their hardness, chemical inertness, high temperature resistance, electrical resistance and resistance to oxidation and corrosion.4–6 Considering their various properties, synthesis and applications of nano-sized alumina or alumina composites are challenging research topics in the field of materials chemistry.
Different methods had been successfully employed to prepare g-AlOOH and g-Al2O3 with micro/nano-structures with various morphologies over the past few decades.7,8 Surfactants play a very significant role in the synthesis of g-AlOOH/g-Al2O3 with various morphologies.3 Porous g-Al2O3 with viable morphologies has been prepared via a facile surfactant (sodium dodecyl sulphate (SDS), cetyl trimethyl ammonium bromide (CTAB), lysine and laurylamine) assisted hydrothermal method9 which can significantly improve the function of the alumina-based nanomaterials and broaden the scope of their applications. It is still a challenge to obtain high-quality mesoporous alumina with unique morphology via a facile and efficient approach, which would lead to its new potential applications.
In current years, substantial attention has been paid to environmental effluents produced by different agro industries and textile industries. Azo dyes coming out from various textile industries have become one of the most serious pollutants in the effluents from textile plants10 which can contaminate the surface as well as ground water. The improvement in the use of nanomaterials and nanotechnology provides an effective way to solve the current serious problem of environmental pollution because of the distinctive properties of nanomaterials.3,11 Various treatments for the removal of azo dyes have been investigated, including adsorption, precipitation, photo degradation, biodegradation, etc.12 Among them, the adsorption technique is one of the green technologies to remove the contaminants of water caused by the organic/azo dyes. Many researchers have used metal oxides,13 activated carbon,14,15 polymers,16 different porous materials17,18 and composite nanomaterials8,19,20 to remove toxic heavy metal ions and organic pollutants like azo dyes from waste water.21–23 Out of all materials, alumina/g-Al2O3 is widely used as an adsorbent in sewage treatment and air purification due to its high specific surface area, porosity and good dispersion.3 It is necessary to further enhance the adsorption capacity of g-Al2O3 by designing the morphology of gamma alumina and adding a pore forming agent.
Herein, we report a facile hydrothermal process to synthesize hierarchical mesoporous g-Al2O3 with polysorbate-40 (Tween-40) as the template and a pore forming agent to improve its adsorption performance. Adsorption experiments were also compared with those reported in one of the previous studies.6 The hierarchical hollow structure can effectively promote the adsorption process under the action of capillary force caused by pores. In addition, the pore forming agent enhances the porosity of the material which is favourable for the adsorption performance. We have investigated the effects of the synthesis conditions on the surface area and particle size of the hierarchical alumina materials. In addition, we have also evaluated the potential of the sample as a highly efficient adsorbent in Congo red adsorption experiments.
2. Experimental
2.1. Materials
All the chemicals used were of analytical reagent grade and therefore were used directly without further purification. Aluminium sulfate (Al2(SO4)3·16H2O) and NaOH were purchased from Merck, India. Tween-40 was purchased from Sigma Aldrich, India.
2.2. Synthesis methods
The samples were synthesized by the co-precipitation method. Briefly, 100 mL of 1 M Al2(SO4)3 was mixed with 10 mL of 0.1 N Tween-40 solution. The resulting mixture was maintained at a constant pH of 5.0 by the dropwise addition of 1 M NaOH. The white precipitate formed was allowed to age at 100 °C for 4 h. Then it was collected and washed thoroughly with deionized water and finally dried at 45 °C under vacuum. The above prepared precursor was calcined at different temperatures of 400 °C, 500 °C, 600 °C and 900 °C for 2 h in a muffle furnace at a heating rate of 10° min−1 to obtain a mesoporous Al2O3 material.
2.3. Characterization studies
The as synthesized precursor and its calcined samples obtained were characterized using an X-ray diffractometer (XRD) RIGAKU ULTIMA IV in the 2θ range of 10 to 80° with a voltage of 30 kV and CuKα. The thermal behavior of the precursor sample was studied using a Mettler-Toledo TGA/SDTA851e thermo analyser (TG-DTA) in the temperature range of 25–1000 °C at a heating rate of 10 °C min−1 in an air flow (50 mL min−1). The morphology of the precursor and the 600 °C calcined product was studied using a scanning electron microscope (SEM) (Zeiss, EVO 18). High-resolution transmission electron microscopy (TEM) (JEOL-JEM 2100F) was used to obtain chemical and morphological information of the samples. The Brunauer–Emmett–Teller (BET) surface area of the powders was analyzed by nitrogen adsorption using a Micromeritics ASAP 2020 nitrogen adsorption apparatus (US). Before nitrogen adsorption measurement, the sample was degassed in a vacuum at 100 °C. Adsorption branches of the isotherms were used to determine the pore size distributions for the samples studied via the Barrett–Joyner–Halenda (BJH) method. The volume of nitrogen adsorbed at a relative pressure (P/P0) of 0.99 was used to determine the pore volume. Average particle sizes of both the precursor and composite materials were measured by using a MICROTRAC DLS-Particle size analyzer.
2.4. Congo red (CR) removal experiments
The adsorption of Congo red was carried out to check the efficiency of the material as an adsorbate. In this case the 600 °C calcined sample can be utilized as efficient adsorbent for CR removal. To evaluate the adsorption efficiency of the sample, typically, stock solutions of CR (with 400 mg L−1, 500 mg L−1, 750 mg L−1 and 1000 mg L−1) were prepared in deionized water. Batch experiments were conducted by mixing 50 mL of the CR solution of different initial concentrations with 50 mg of the adsorbent at ambient temperature (27 °C) under constant stirring. All the parametric variations such as time and concentration were carried out in individual experiments. The concentration of CR before and after treatment was calculated using a VARIAN Cary 50 Bio UV-Vis spectrophotometer. The characteristic absorption of Congo red at 500 nm was chosen to monitor the adsorption process. The percentage removal and uptake capacity was determined by using the following equation:| | 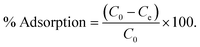 | (1) |
And the equilibrium uptake was calculated by using eqn (2):where C0 is the initial concentration of the dye solution (mg L−1), Qe is the equilibrium amount of the dye on the adsorbent (mg g−1), Ce is the equilibrium concentration of the dye solution (mg L−1), W is the weight of the adsorbent (g) used and V is the volume of the dye solution used (L). All experiments have been carried out in triplicates and the results are represented as average readings.
3. Results and discussion
3.1. Structural properties
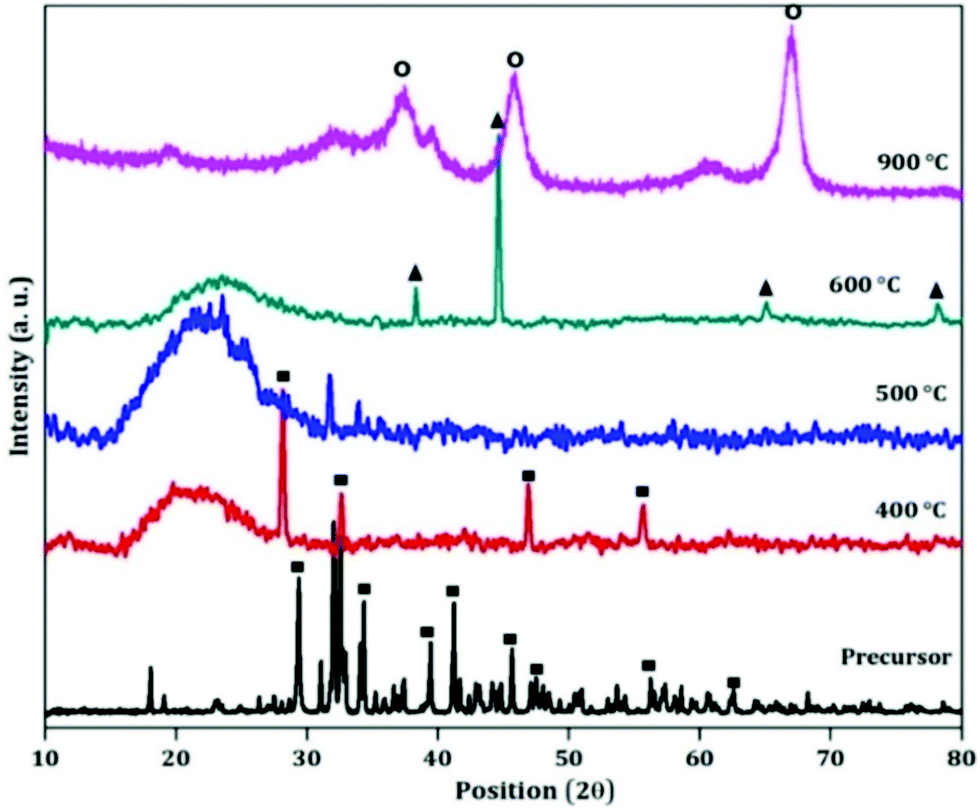
The X-ray diffraction (XRD) patterns of the as obtained precursor as well as its different calcined materials are given to indicate the crystal structure of the samples (shown in Fig. 1). The XRD pattern of the as obtained powder matches with the standard XRD pattern of sodium aluminium hydroxide (JCPDS-00-051-0529). All the diffraction peaks are similar to those in the pattern of sodium aluminium hydroxide which reveals that the crystal structure is well-maintained after the addition of the template. After calcination the material gets converted to an activated state. The XRD patterns are not fully crystalline which can be seen from Fig. 1. At 600 °C, the XRD pattern of activated alumina matches with the pattern of gamma-alumina (JCPDS-00-010-0425). With further calcination to 900 °C, the phase of alumina changes from gamma to kappa (JCPDS-00-013-0373).
 |
| | Fig. 1 XRD patterns of the precursor and its different calcined products (■: sodium aluminium hydroxide; ▲: gamma-alumina; O: kappa alumina). | |
Therefore in this case the transformation of aluminium hydroxide with temperature is aluminium hydroxide → gamma alumina → kappa alumina.
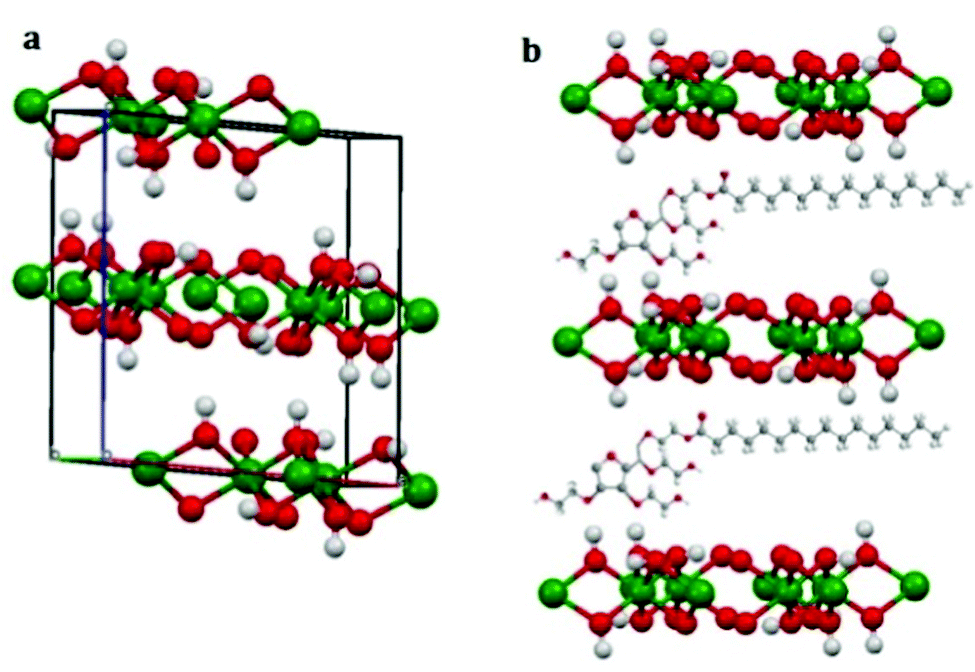
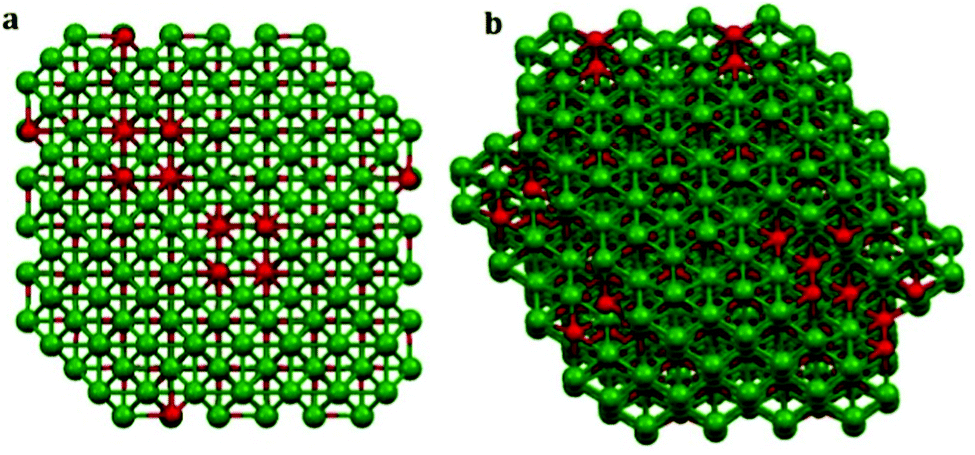
The 3D structure of the precursor is given in Fig. 2(a). The packing is in the direction along the c-axis as can be seen from the figure. Therefore Tween-40 which was added to the system as the template, got coated on the surface as well as in the interlayer space (revealed in Fig. 2(b)). After calcination at 600 °C, the surface water, the water molecules present inside the layers as well as the surfactant or template incorporated i.e. Tween-40 got decomposed leading to a cage like structure of gamma alumina along with lots of pores inside the cage as shown in Fig. 3(a and b).
 |
| | Fig. 2 3D model of (a) packing of the precursor showing co-ordinate axes and (b) incorporation of Tween-40 in aluminium hydroxide layers. | |
 |
| | Fig. 3 3D model of gamma alumina obtained by calcination of the precursor at 600 °C; (a) and (b) are views along different axes of the compound. | |
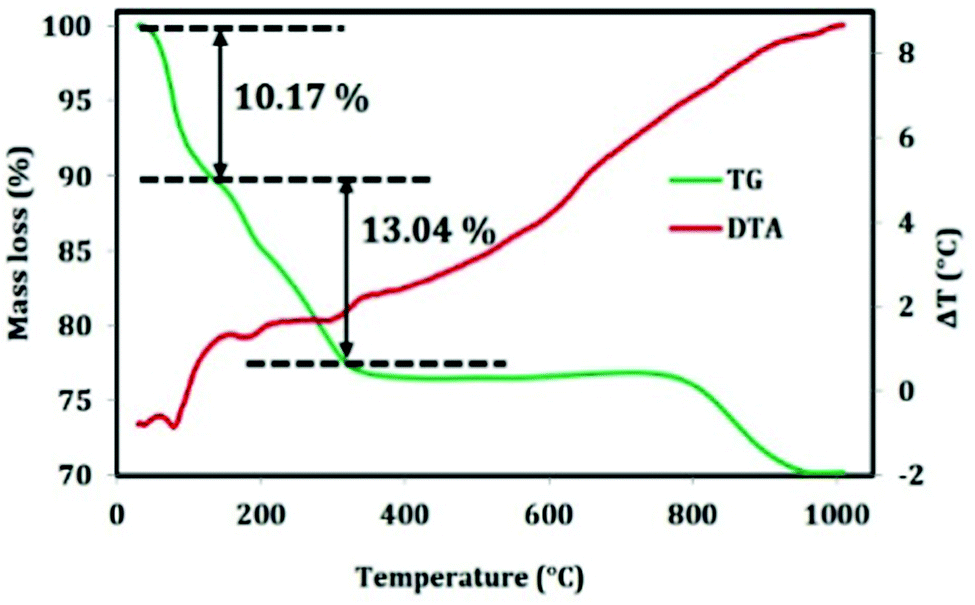
3.2. Thermal analysis
The thermal analysis of the composite material was carried out to check the mass loss with the increase in temperature and the result is picturized in Fig. 4. The mass loss of the material is as follows; up to 200 °C, the mass loss is due to physisorbed and chemisorbed water molecules. After 400 °C, the surfactant will decompose to carbon dioxide and water which shows an endothermic peak in DTA plot. Finally alumina is formed at a temperature of around 1000 °C.
 |
| | Fig. 4 Thermal analysis of Tween-40 mediated aluminium hydroxide. | |
3.3. Morphological analysis
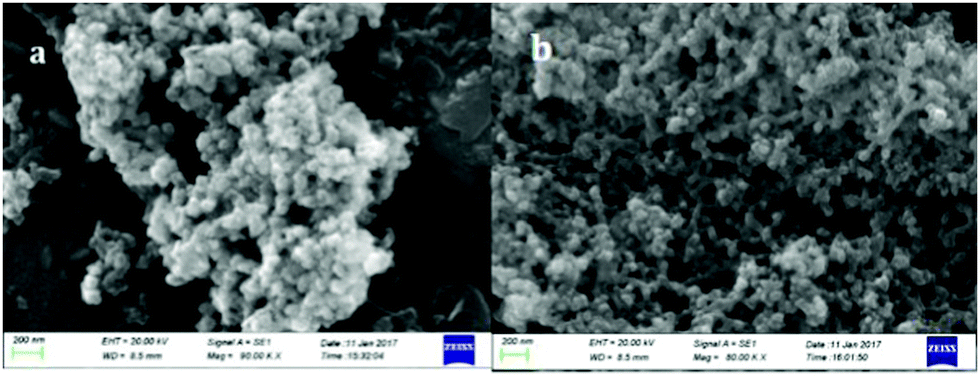
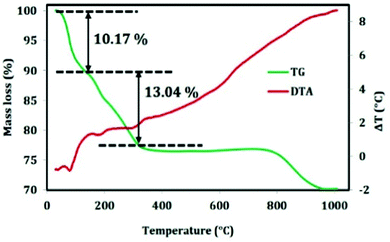
The morphology of the precursor and the 600 °C calcined product is characterized using a scanning electron microscope (SEM), presented in Fig. 5. It can be observed that precursor particles are approximately spherical shaped and in an agglomerated form (Fig. 5(a)). After calcination at 600 °C, the template got decomposed and therefore the particle size decreased, which means the particles got shrinked and a chain like bonding formed between Al–O–Al which can be evidenced from Fig. 5(b).
 |
| | Fig. 5 SEM image of (a) the precursor material incorporated with the template, and (b) SEM image of the 600 °C calcined material. | |
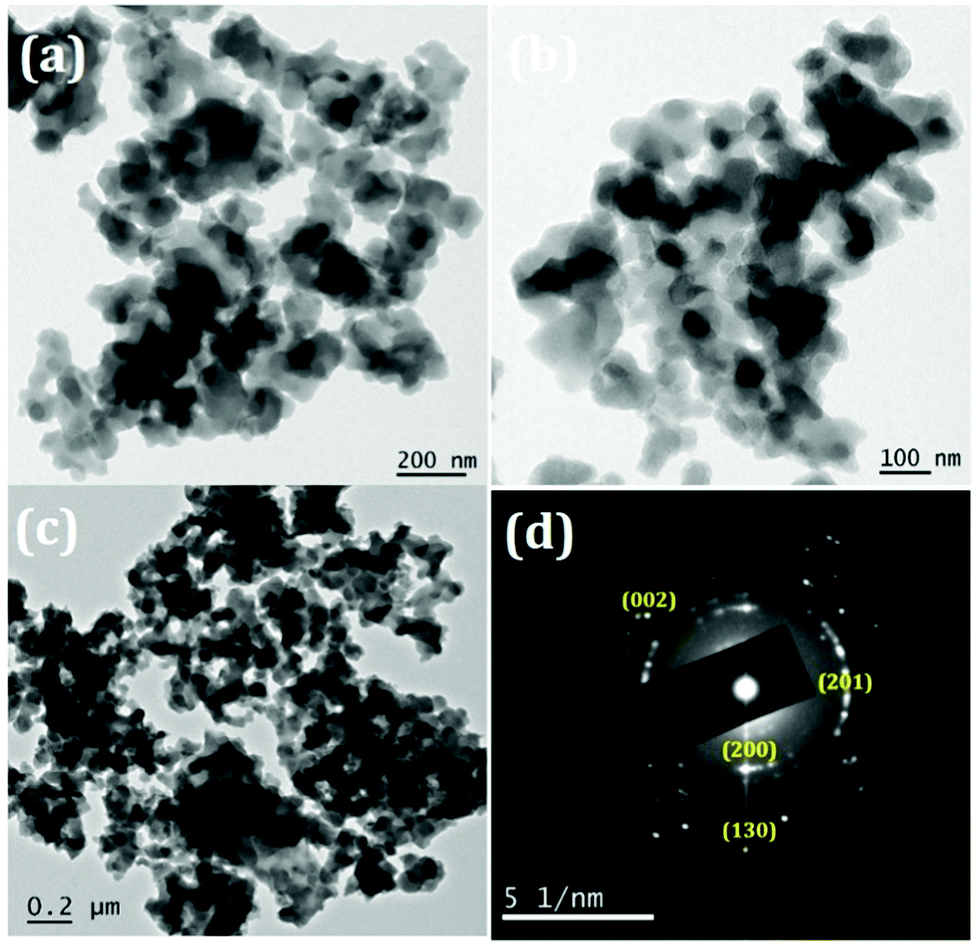
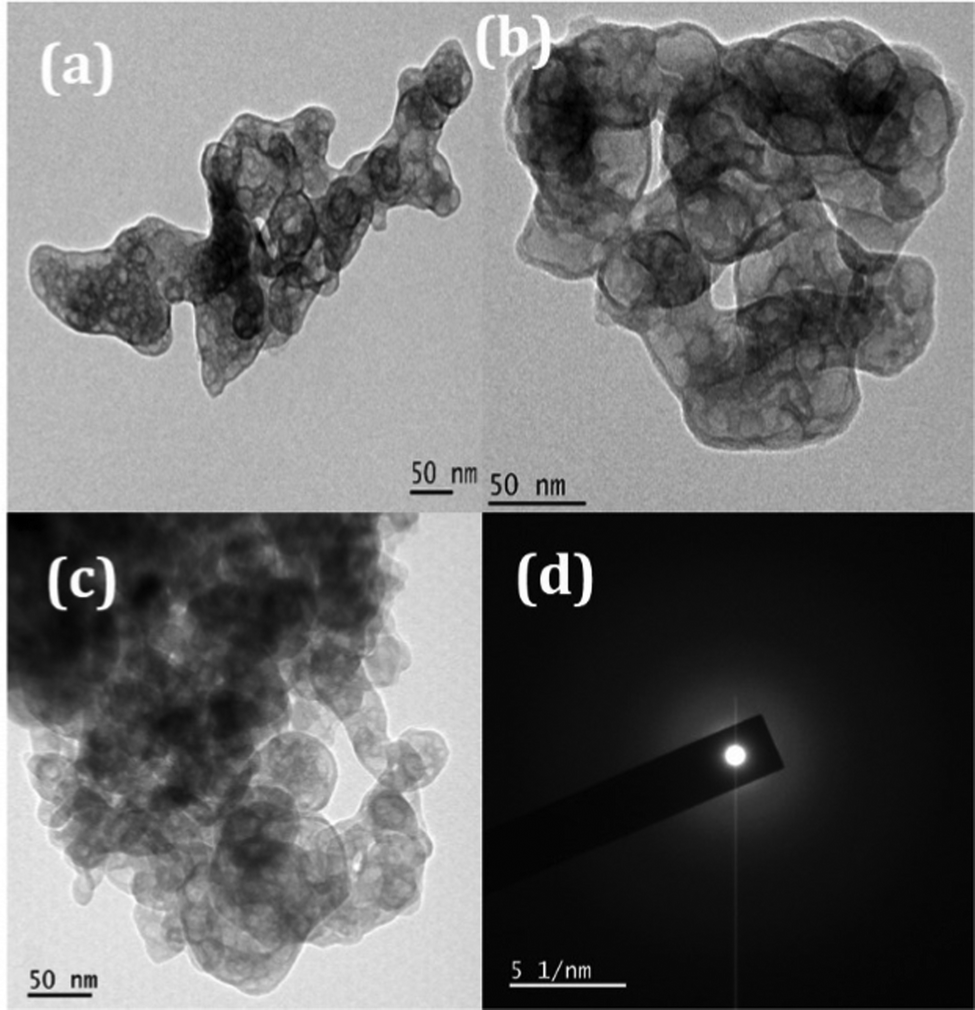
The TEM images of the samples exhibit nano sized particle-like structures as precursors as revealed in Fig. 6. The SAED patterns (Fig. 6(d)) are corroborating with the corresponding XRD patterns of the precursors (JCPDS-00-051-0529). After thermal treatment at 600 °C, particles became porous because of the decomposition of the added surfactant as well as the removal of intra molecular and interstitial water (Fig. 7). Porosity of the material can be visualized clearly in Fig. 7(a–c) and the amorphous nature can be seen from the SAED pattern (provided in Fig. 7(d)) which matches with the XRD pattern.
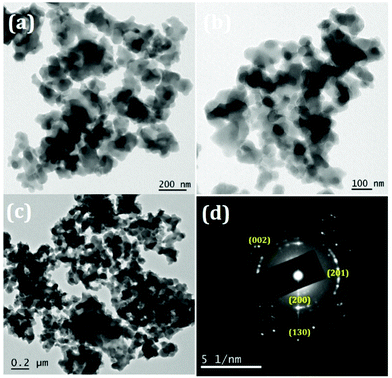 |
| | Fig. 6 TEM image (a–c) of the precursor material and the corresponding SAED pattern (d). | |
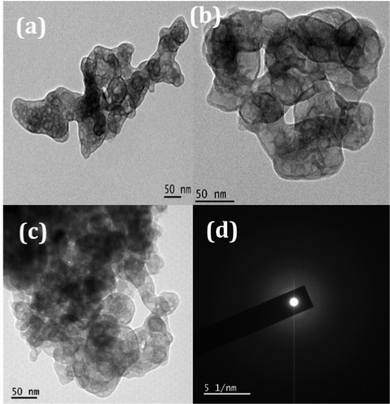 |
| | Fig. 7 TEM image (a–c) of the 600 °C calcined material and the corresponding SAED pattern (d). | |
3.4. Particle size analysis
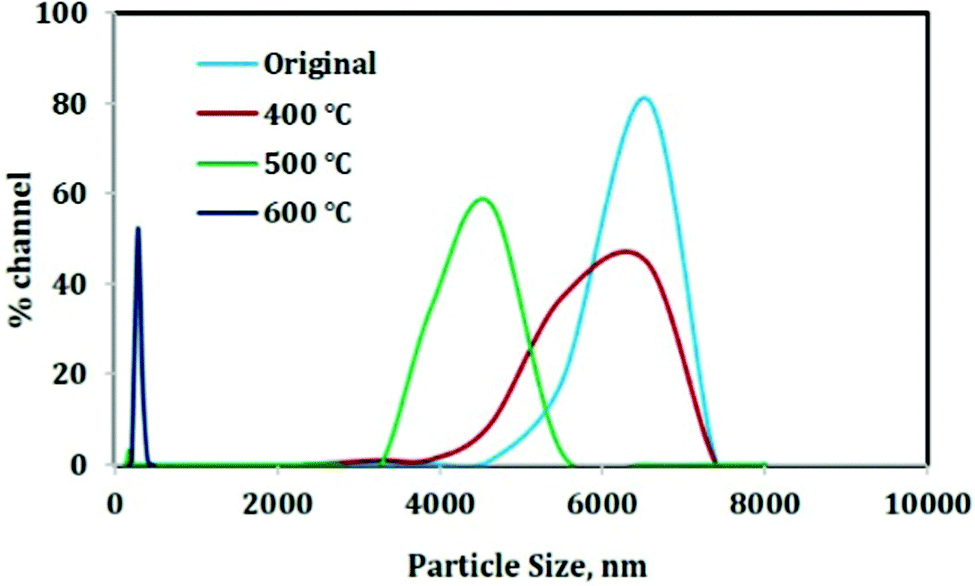
The particle size variation with increase in temperature follows the same trend for both the materials and therefore for the sake of simplicity only one picture is given. With increase in temperature, the particle size decreases to the nano range as revealed in Fig. 8. The original material has an average particle size of 6.5 micron and after calcination at 400 °C, the particle size distribution becomes slightly broader indicating the addition of smaller particles to the distribution. The average particle size is provided in Table 1.
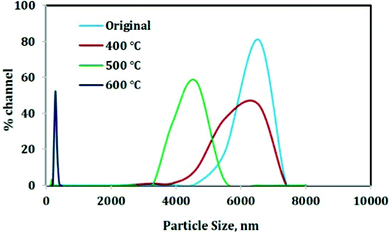 |
| | Fig. 8 Particle size distribution of the precursor and its different calcined materials. | |
Table 1 Average particle size of the sample calcined at different temperatures
| Samples |
Average particle size (nm) |
| Original |
6540 |
| 400 °C calcined |
5540 |
| 500 °C calcined |
4620 |
| 600 °C calcined |
243 |
Then on increasing the temperature to 500 °C, the average particle size decreases to 4.6 microns and a further increase in temperature to 600 °C results in the decrease in particle size to 243 nm. This decrease in particle size ultimately results in a high surface area (high surface/volume ratio) which will help in the case of adsorption. Therefore the 600 °C calcined material can be an efficient material for adsorption purpose.
3.5. Surface area analysis
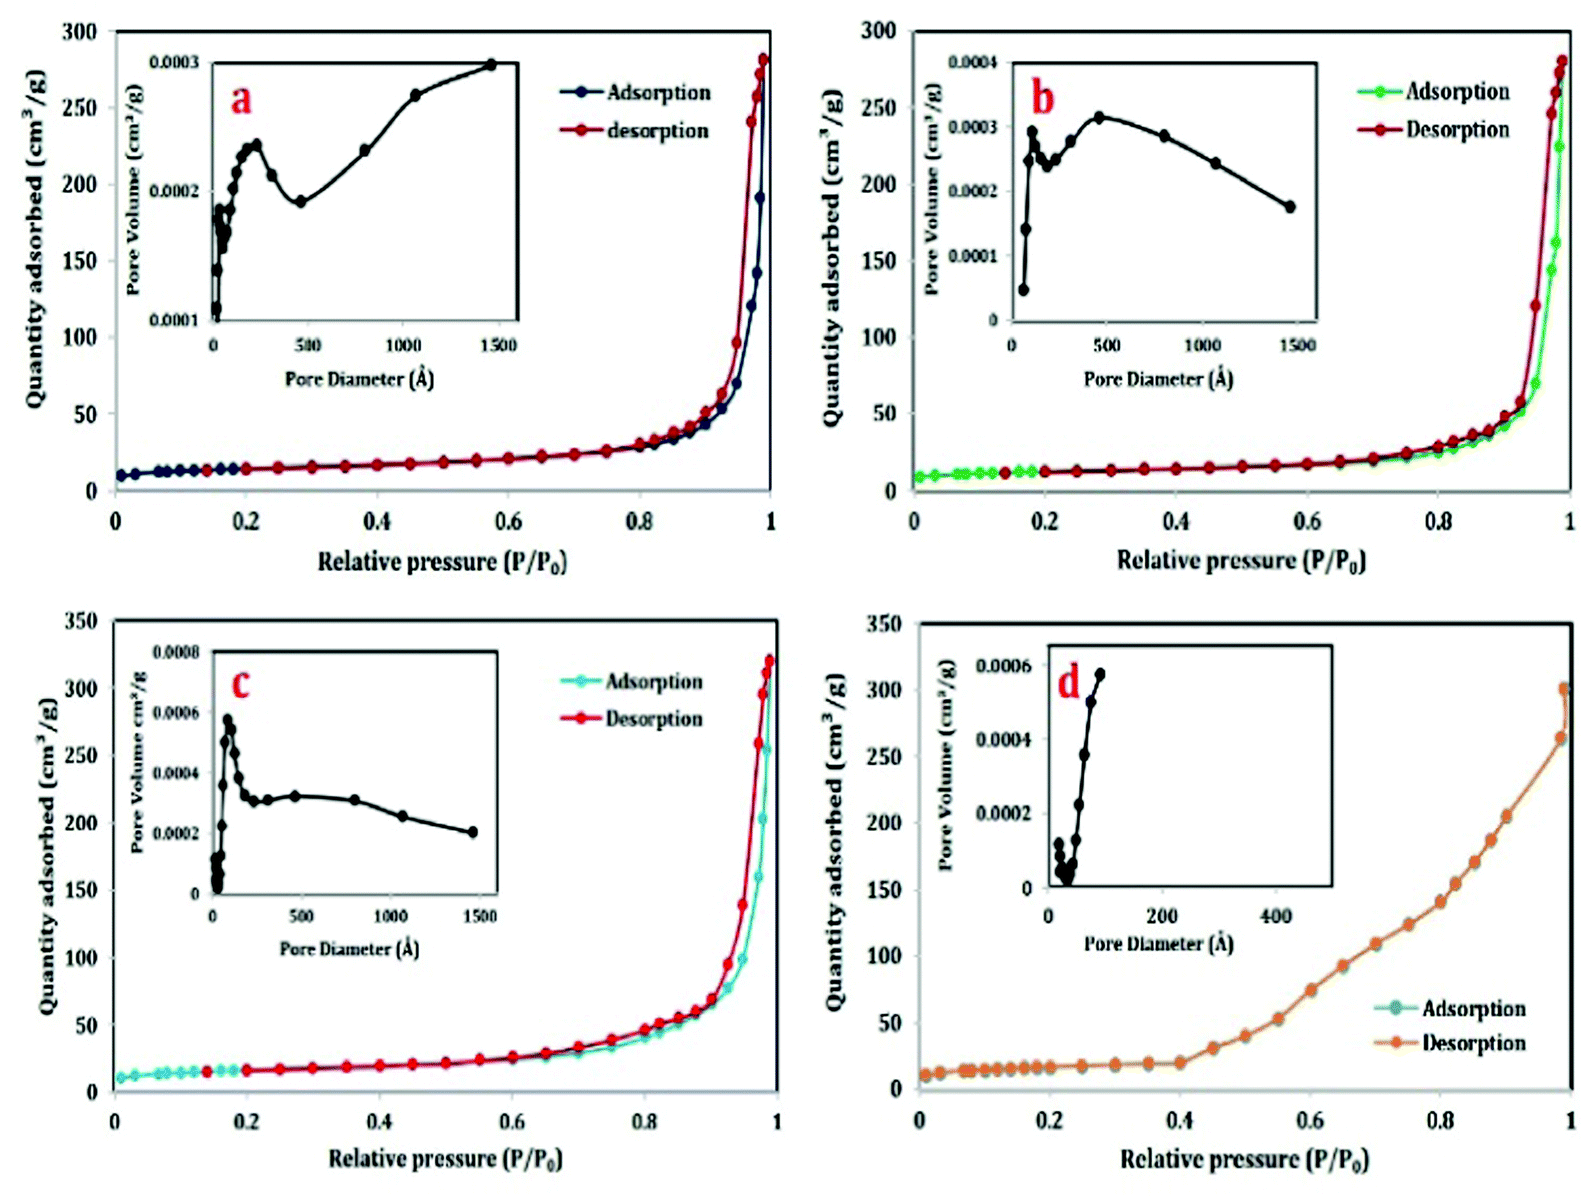
The BET surface area obtained through nitrogen adsorption–desorption isotherms and BJH pore size distribution of different calcined samples (i.e. 400 °C, 500 °C, 600 °C and 900 °C) are given in Fig. 9. As shown in the figure, all the isotherms exhibit type-IV isotherm which is the characteristic of mesoporous materials24 along with a H1-type hysteresis loop which is associated with well-defined cylindrical-like pore channels or uniform spheres24 except that shown in Fig. 9(d).
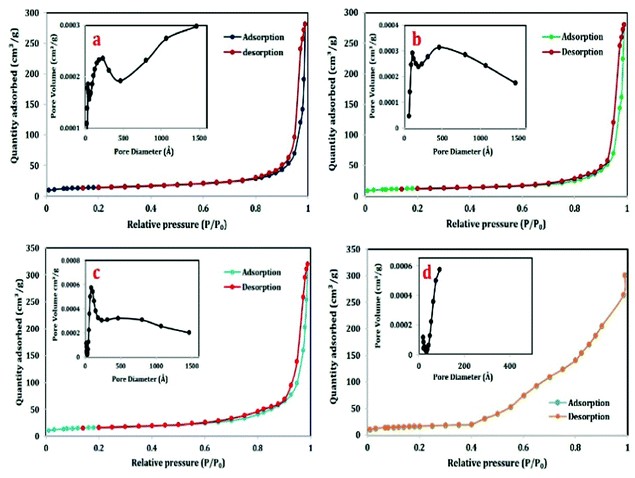 |
| | Fig. 9 N2 adsorption–desorption isotherm of different calcined samples; (a) 400 °C calcined sample, (b) 500 °C calcined sample, (c) 600 °C calcined sample, and (d) 900 °C calcined sample. The inset indicates the pore size distribution of the sample calculated from the adsorption branch by the BJH model. | |
Comparing the isotherm of 400 °C, 500 °C and 600 °C, the height of the isotherm is almost the same for 400 °C and 500 °C (Fig. 9(a and b)) but it is highest in the case of 600 °C (Fig. 9(c)), confirming the maximum quantity of adsorbed nitrogen in the 600 °C sample. The corresponding pore size distributions of each of the samples are given in inset of each figures. The data listed in Table 2 demonstrate that the BET surface area of the 600 °C calcined sample (94.302 m2 g−1) is more than that of the 400 °C and 500 °C calcined samples (49.54 m2 g−1 and 58.1707 m2 g−1 respectively). The total pore volume of the 600 °C calcined sample is also slightly more than that of the 400 °C and 500 °C calcined samples (shown in Table 2). From our previous work, it can be compared that porous alumina out of aluminium hydroxide along with sodium lauryl sulphates (SLS) has a lesser surface area (42 m2 g−1) than that obtained this time (94.302 m2 g−1).6
Table 2 BET surface area, BJH pore volume and average pore diameter of different calcined samples
| Samples |
BET surface area (m2 g−1) |
Pore volume (cm3 g−1) |
Average pore diameter (nm) |
| 400 °C calcined |
49.54 |
0.435 |
37.4923 |
| 500 °C calcined |
58.1707 |
0.496 |
45.2465 |
| 600 °C calcined |
94.302 |
0.586 |
47.11 |
| 900 °C calcined |
2.491 |
0.109 |
0.1219 |
During calcination, the material first loses physisorbed and chemisorbed water molecules which results in a mass loss of the material (given in Fig. 4) and after this the surfactant will decompose leaving pores in the material which also can be seen in the cage like structure with sheet-like surface and pores in Fig. 3. At 600 °C perhaps all the surfactants got decomposed and therefore the pore volume is more in this case (given in Table 2).
By calcining the material to 900 °C, the material gets converted to the oxide phase completely and all the anions and added surfactant are decomposed prior to 900 °C. Therefore the porosity shrinks showing no distribution (given in the inset of Fig. 9(d)) and simultaneously the sample shows a type-III adsorption–desorption plot (given in Fig. 9(d)) which is the characteristic of a nonporous material.24 This type of comparison has not been reported in any of the manuscripts.
It is a well-known fact that the lesser the particle size, the more is the surface area and hence more will be the surface adsorption capacity of the material. Though all the three materials i.e. 400 °C, 500 °C and 600 °C show almost a similar adsorption–desorption isotherm, the height of the 600 °C calcined sample is higher (Fig. 9(c)) confirming the more adsorption capacity.
It has also a lesser particle size (given in Fig. 8), high BET surface area and high pore volume as compared to the 400 °C and 500 °C calcined samples. All these characteristics make the sample a promising adsorbent material.
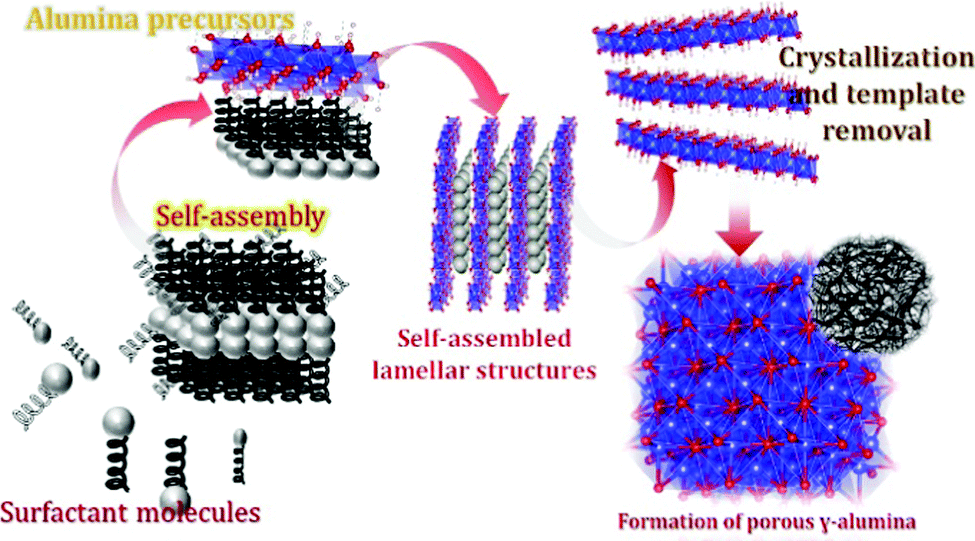
3.6. Mechanism of the formation of hierarchical hollow structures and kappa alumina
Based on the above results, a plausible growth process of the hollow structure is anticipated (Fig. 10).
 |
| | Fig. 10 Schematic illustration of the formation mechanism of hierarchical hollow aluminium (oxy)hydroxides. | |
Al2(SO4)3 will be in the form of [Al(OH2)6]3+ when present in solution and with an increase in pH, gradual hydrolysis occurs as given below:25
| | | [Al(OH2)6]3+ + 2H2O → [Al(OH)h(OH2)6−h](3−h)+ + hH3O+ | (3) |
| | | [Al(OH)h(OH2)6−h](3−h)+ → AlOOH → Al2O3 | (4) |
where
h is the molar ratio of OH to Al (OH
![[thin space (1/6-em)]](https://www.rsc.org/images/entities/char_2009.gif)
:
Al).
Amorphous polynuclear hydroxides or oxy-hydroxides will be formed by the polymerization of hydrolysis products via olation and oxolation.26 The structure or morphology of the metastable hydrolyzed products is dependent on the various experimental parameters (pH, time, temperature, etc.). Initially, because of the slower addition of NaOH solution, OH− ions got released and enhanced Al3+ hydrolysis resulting in the synthesis of metastable alumina compounds.25,27 During the growth of the metastable products, electrostatic interactions happened between the surface hydroxyl group and the Tween-40 chains. On calcining the sample at moderate temperatures, the amorphous aluminium (oxy)hydroxides got aged and removal of the template i.e. tween-40 occurred leaving behind the hierarchical hollow g-AlOOH (given in Fig. 7(a–c)). Further calcination at high temperature leads to the complete removal of the organic matters from the sample followed by the shrinkage of the crystal forming a new phase i.e. kappa-Al2O3 (represented in XRD patterns in Fig. 1).
3.7. Adsorption performance towards Congo red
Activated alumina is now-a-days used mainly for catalysis and adsorption purpose because of its large surface area and higher porosity. In this experiment, the adsorption properties were studied by taking different calcined products and taking congo red as the dye. 50 mg of alumina powder of different calcined temperatures i.e. at 400 °C, 500 °C and 600 °C was tested against Congo red solutions (50 mL) with different concentrations at 27 °C.
After 30 min, UV-Vis absorption spectroscopy measurement was performed to determine the remaining dye concentration after adsorption and accordingly C/C0 was determined (C0 and C represent the initial concentration of Congo red and the remaining concentration after treatment, respectively). The details of UV-Vis measurement are given in Fig. 11(a). From the results it can be evidenced that out of the 400 °C, 500 °C and 600 °C calcined products of Tween-40-activated alumina, the 600 °C calcined material is an efficient material for adsorption kind of experiments as it leaves less concentration of the dye after adsorption experiments as compared to other two materials and ultimately C/C0 is also less.
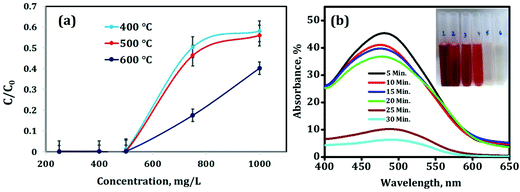 |
| | Fig. 11 (a) Rate of adsorption by varying the temperature of Tween-40-activated alumina against different concentrations of Congo red; (b) absorption spectra of Congo red in the presence of mesoporous activated alumina (600 °C) after time intervals of 5, 10, 15, 20, 25 and 30 min; (inset) photographs of the remaining concentration of Congo red at different time intervals. | |
The reason behind this is the increase in the calcination temperature at which all the adsorbed water molecules as well as the template i.e. Tween-40 are decomposed completely leaving pores. In the case of 400 °C and 500 °C calcined materials, complete decomposition of the template is perhaps not possible and therefore the adsorption efficiency is somewhat less as compared to that of the 600 °C calcined material. Another reason is the high surface area and pore volume of the sample (as evidenced from Table 2), as well as the lower particle size of the material (as evidence from Table 1). Therefore the 600 °C calcined material of Tween-40-activated alumina was considered for further adsorption experiments.
By fixing the concentration of Congo red at 500 mg L−1, the kinetics study of adsorption was carried out i.e. the adsorption rate of 500 mg L−1 Congo red solution on porous alumina was investigated. 50 mg of 600 °C calcined activated alumina powder was added to 50 mL of 500 mg L−1 Congo red solution at 27 °C. The absorbance maxima of Congo red is at 500 nm (as shown in Fig. 11(b)). After a 5 min interval, the % of absorbance decreases to around 50% i.e. after 5 min the concentration of the remaining dye is 60 mg L−1 from the initial concentration of 500 mg L−1. After 25 min, the % of absorbance decreases to 10% (the corresponding concentration is 2.2 mg L−1) and after 30 min, the further decrease in absorbance confirms the removal of Congo red dye after 30 min giving a clear transparent solution (inset of Fig. 11(b)).
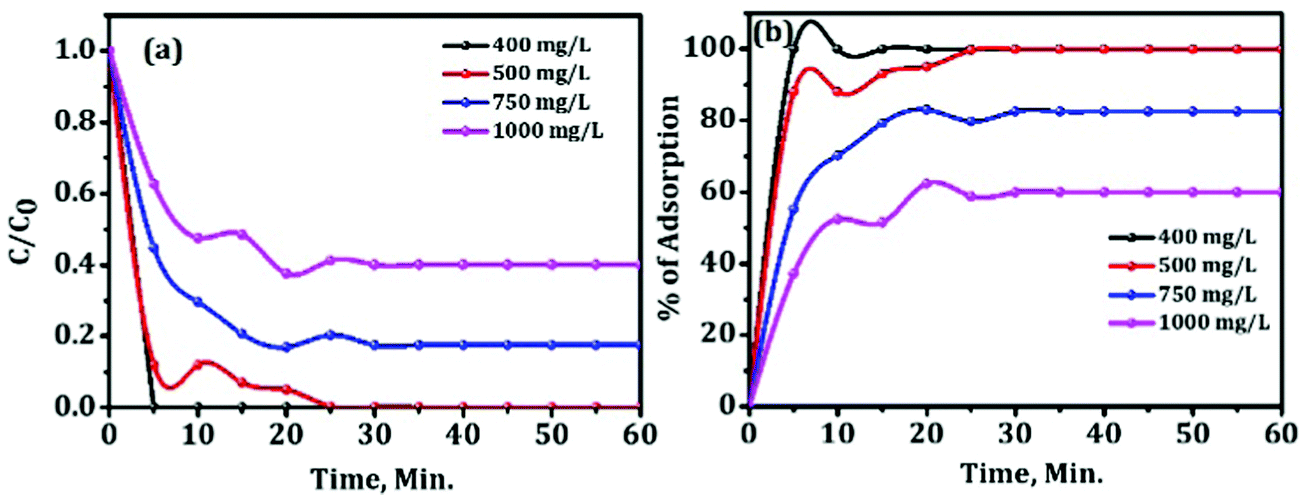
The effect of the initial concentration of Congo red on adsorption capacity of mesoporous activated alumina with time was further investigated to show how good the sample is for removing the pollutant (given in Fig. 12).
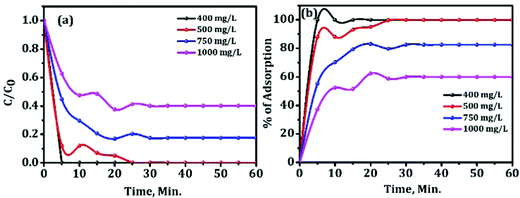 |
| | Fig. 12 Rate of adsorption of the 600 °C activated alumina against different concentrations of Congo red. | |
The results illustrate that the sample can remove most of the Congo red with high concentration (1000 mg L−1) in a short time. Trials were made to adsorb 750 mg L−1 and 1000 mg L−1 of Congo red solution using 50 mg of the sample. The ultimate observation is given in Fig. 12(a and b). After 30 min, 131 mg L−1 and 401.5 mg L−1 of Congo red remains in the solution out of 750 mg L−1 and 1000 mg L−1, respectively. The percentage of adsorption for 400 and 500 mg L−1 is 100% after 25 min, whereas for higher concentrations of CR, i.e., for 750 and 1000 mg L−1, maximum get adsorbed within 30 minutes. For the rest period slight improvement in adsorption was observed as shown in Fig. 12(b). This ideal adsorption capacity of the material is very high as compared to the data available in the literature for other alumina.10,11
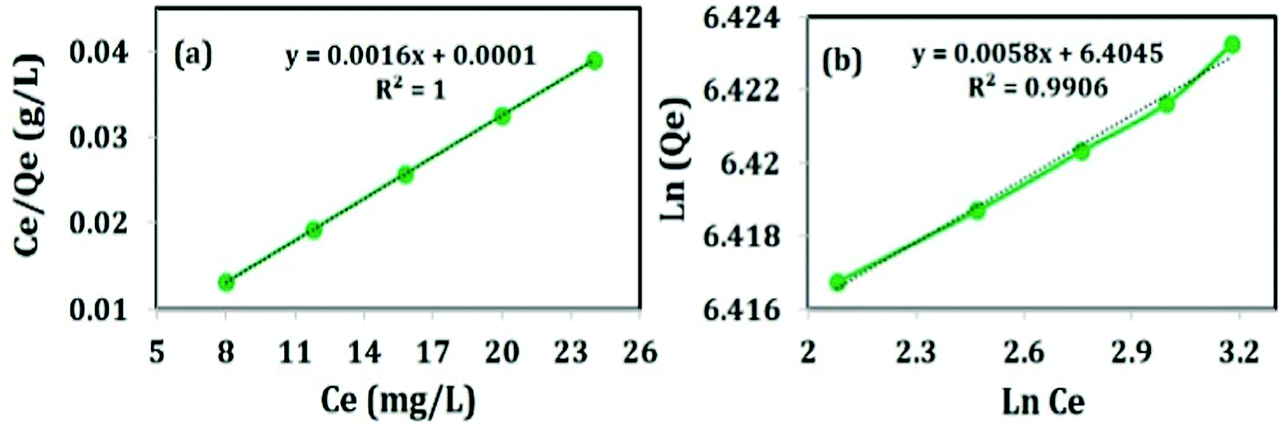
3.8. Adsorption isotherms
The adsorption isotherm describes the relationship between the adsorbate at a constant temperature and its equilibrium concentration. The information of distribution of dye molecules over the adsorbent during the adsorption process under equilibrium conditions can be obtained from the adsorption isotherms. Different adsorption isotherms were studied like Langmuir and Freundlich to describe the adsorption equilibrium of the adsorbent at different initial concentrations of Congo red (620, 625, 630, 635 and 640 mg L−1) for 60 min. The adsorption capacity of the adsorbent is based on the porosity and surface area of the adsorbent as well as the interaction of the functional groups of the adsorbate.28
Langmuir isotherm adopts the adsorption of the adsorbate on the active sites of the homogeneous surface of the adsorbent in monolayer distribution.28,29 The linear form of Langmuir isotherm is expressed in eqn (5):
| | | Ce/Qe = 1/KL + Ce·aL/KL | (5) |
where
Ce (mg L
−1) is the equilibrium concentration,
Qe (mg g
−1) is the amount of CR adsorbed on unit mass of the adsorbent at equilibrium, and the parameters
aL (L mg
−1) and
KL (L g
−1) are the Langmuir constants;
KL/
aL (mg g
−1) is the capacity factor of maximum adsorption (
Qmax) that relates to
Qe for a complete monolayer and energy of adsorption, respectively. These constants were calculated from the linear plot of
Ce/
Qeversus Ce as given in
Fig. 13(a). The
R2 value (
i.e. square of correlation coefficient) of Langmuir adsorption isotherm is found to be 1 (revealed from
Fig. 13(a)) and shows linearity indicating the adsorption is monolayer in nature.
 |
| | Fig. 13 Adsorption isotherms; (a) Langmuir adsorption isotherm and (b) Freundlich adsorption isotherm. | |
Freundlich isotherm gives the relationship between equilibrium liquid and solid phase capacity based on multilayer adsorption (a heterogeneous surface). This isotherm is derived from the assumption that the adsorption sites are distributed exponentially with respect to the heat of adsorption and is given by eqn (6):
where
af (mg g
−1) indicates the multilayer adsorption capacity and
bf is an empirical parameter related to the intensity of adsorption. The plot of ln
Qevs. ln
Ce is illustrated in
Fig. 13(b). The slope and intercept represent
bf and ln
af, respectively.
The R2 value of Freundlich adsorption isotherm is found to be 0.9906 (revealed from Fig. 13(b)) and shows almost linearity indicating the adsorption is multilayer in nature. The maximum adsorption capacity is 615 mg g−1 which is much higher than those reported in the previous literature, presented in Table 3. The high Qmax is attributed to the huge specific surface area and long chain structure of Tween-40 which left the material mesoporous after calcination and could promote surface complexation and ion-exchange. High temperature calcination (i.e. at 600 °C) improves the adsorption capacity of the sample by the removal of Tween-40. Most importantly, the calcined sample has the capacity of removing 60% of CR from 1000 mg L−1 solution (as revealed in Fig. 13(b)).
Table 3 Comparison of the maximum adsorption capacities of the sample with different forms of aluminium (oxy)hydroxides for CR removal
| Samples |
Adsorption results |
|
q
max (mg g−1) |
m
(adsorbent) (mg) |
V
(solvent) (mL) |
C
(CR) (mg L−1) |
Ref. |
| Boehmite hollow microsphere |
114.7 |
100 |
100 |
100 |
30
|
| Hierarchical spindle like g-Al2O3 |
176.7 |
80 |
100 |
45–720 |
31
|
| AlOOH microspheres |
319.15 |
20 |
50 |
50–150 |
32
|
| Nanorod-like mesoporous g-Al2O3 |
200.1 |
100 |
100 |
100 |
33
|
| Hierarchical hollow g-Al2O3 |
416.5 |
50 |
50 |
50–500 |
3
|
| Mesoporous g-Al2O3 |
615 |
50 |
50 |
250–1000 |
This study |
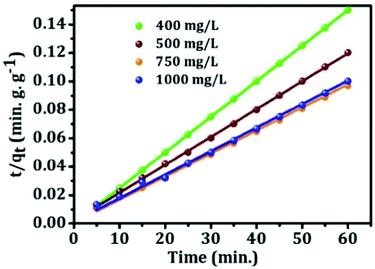
3.9. Adsorption kinetics
The kinetic behavior of mesoporous alumina has been investigated using both pseudo first-order and pseudo-second-order kinetics models. Pseudo first-order kinetics model is expressed as follows:| | | log(qe − qt) = log(qe) − (k2t)/2.303 | (7) |
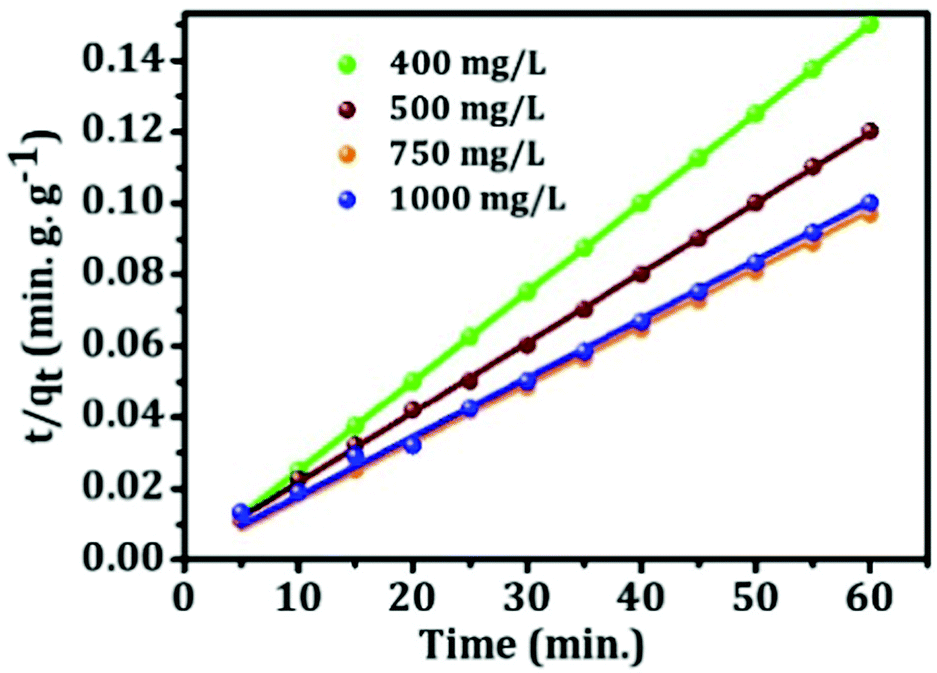
where k2 is the pseudo-first-order rate constant, and qe and qt are the capacity of adsorption of Congo red molecules onto mesoporous alumina at equilibrium and time t, respectively. The values of k2 and qe were calculated from the slope and intercept of the plot of log(qe − qt) vs. t and are listed in Table 4. It can be seen from Table 4 that the estimated qe was found to be much higher than the experimental value. Pseudo second-order kinetics model was verified with the assumption that the chemisorption follows this kinetics path, which was proposed by Ho and McKay.34 The linear form of pseudo-second-order kinetics equation is presented as eqn (8).where K2 is the adsorption rate constant of the pseudo-second-order model, qe and qt are the adsorption capacity of mesoporous alumina at equilibrium and time t, respectively. The qe and K2 values were obtained from the slope and intercept of the plots of t/qtvs. t (presented in Fig. 14) after fitting the data and shown in Table 4. It is observed that the calculated and observed qe values do not vary much, and the correlation coefficient (R2) value of the pseudo-second-order model for all concentration is ≥0.99. From the fitted data we conclude that the experimental observations are consistent with the pseudo-second-order kinetics model instead of the pseudo first-order model.
Table 4 Pseudo first- and second-order kinetics model parameters for adsorption of Congo red
| Model |
Concentration (mg L−1) |
Q
e,cal (mg g−1) |
Q
e,exp. (mg g−1) |
K
2 (mg g−1 min−1) |
R
2
|
| Pseudo first-order |
400 |
399.6 |
399.648 |
0.5 |
1 |
| 500 |
499 |
280 |
0.1456 |
0.73146 |
| 750 |
618.75 |
350 |
0.13673 |
0.81928 |
| 1000 |
599 |
500 |
0.19769 |
0.81056 |
| Pseudo second-order |
400 |
399.6 |
399.65 |
0.5 |
1 |
| 500 |
499 |
510.54 |
0.00177 |
0.99961 |
| 750 |
618.75 |
617 |
0.0044 |
0.99748 |
| 1000 |
599 |
605 |
0.00187 |
0.9984 |
 |
| | Fig. 14 Plot of pseudo-second-order kinetics equations. | |
3.10. Adsorption mechanism
The mechanism of the adsorption of sorbate onto the adsorbent can be described using different ways such as film diffusion, pore diffusion and intra-particle diffusion. Among these processes, the intra-particle diffusion and the pore diffusion are most often the rate limiting steps in a batch reactor.35 Therefore, the intra-particle diffusion model has been applied to study the overall adsorption process and the model (Weber and Morris). The equation which satisfies the above adsorption mechanism is shown below:36where qt is the amount of Congo red adsorbed at time t (mg g−1), kid is the initial rate of intra-particle diffusion (mg g−1 min−0.5), and C is the intercept. The nature of the plot gives us an idea about the rate of adsorption steps, such as the plot passing through the origin is an indication that intra-particle diffusion is the rate-controlling step, and if not, the intra-particle diffusion is not only the rate-limiting step but other kinetics models may also control the rate of adsorption. The intra-particle diffusion plot and fitting parameters are given in Fig. 15 and Table. 5, respectively. Fig. 15 shows that the intra-particle adsorption plots are not linear over the whole-time range (except 400 mg L−1) and no plots of intra-particle diffusion passed through the origin, which indicates that the intra-particle diffusion was not only involved in the rate-controlling step but was present in the process.
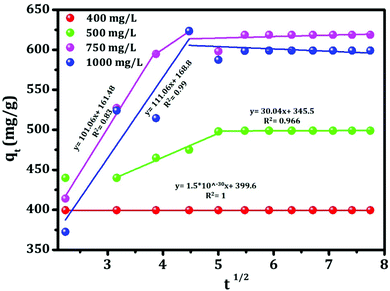 |
| | Fig. 15 Intra-particle diffusion for adsorption of Congo red by template-mediated mesoporous alumina. | |
Table 5 Intra-particle diffusion kinetics constants for adsorption of Congo red
| Model |
At different concentrations |
| 400 mg L−1 |
500 mg L−1 |
750 mg L−1 |
1000 mg L−1 |
|
K
id, mg g−1 min1/2 |
1.5 × 10⁻³⁰ |
30.04 |
111.06 |
101.06 |
|
C, mg g−1 |
399.6 |
345.5 |
168.8 |
161.48 |
|
R
2
|
1 |
0.966 |
0.99 |
0.83 |
4. Conclusions
Hierarchical mesoporous g-Al2O3 has been successfully synthesized via a hydrothermal process with polysorbate i.e. Tween-40 as the surfactant and a pore forming agent. Polysorbates not only enabled a good dispersion of the sample but also increased the pore volume and surface area after calcination (94 m2 g−1), which was favourable to improve the adsorption performance of the sample. The product also displayed excellent adsorption capacity for Congo red removal with Qmax = 615 mg g−1 and satisfies the multilayer adsorption isotherm showing 99% efficiency with a starting concentration of 500 mg L−1 and 60% efficiency with a starting concentration of 1000 mg L−1. These remarkable properties suggest that the hierarchical mesoporous g-Al2O3 can be used as a novel, highly efficient and fast separation sorbent for the removal of organic pollutants from waste water.
Conflicts of interest
There are no conflicts to declare.
Acknowledgements
The authors are thankful to Director, CSIR-IMMT, Bhubaneswar, for providing all the facility to carry out the research work.
References
- F. Lu, W. Cai and Y. Zhang, Adv. Funct. Mater., 2008, 18, 1047–1056 CrossRef CAS.
- F. Adeno, E. Mulugeta, F. Zewge and Y. Chebude, Bull. Chem. Soc. Ethiop., 2014, 28(2), 215–227 CrossRef.
- Z. Li, Y. Du, S. Zhang, Z. Chen, K. Yang, X. Lv and C. Zhu, RSC Adv., 2016, 6, 89699–89707 RSC.
- M. R. Karim, M. A. Rahman, M. A. J. Miah, H. Ahmad, M. Yanagisawa and M. Ito, Open Colloid Sci. J., 2011, 4, 32–36 CrossRef CAS.
- B. S. B. Reddy, K. Das and S. Das, J. Mater. Sci., 2007, 42(22), 9366–9378 CrossRef CAS.
- G. Mishra, B. Dash, A. Dash and I. N. Bhattacharya, Cryst. Res. Technol., 2016, 51(7), 433–440 CrossRef CAS.
- M. Abdollahifar, R. M. Zamani, E. Beiygie and H. Nekouei, J. Serb. Chem. Soc., 2014, 79, 1007–1017 CrossRef CAS.
- R. Kumar, M. Ehsan and M. A. Barakat, J. Ind. Eng. Chem., 2014, 20, 4202–4206 CrossRef CAS.
- W. Wang, J. Zhou, Z. Zhang, J. Yu and W. Cai, Chem. Eng. J., 2013, 233, 168–175 CrossRef CAS.
- A. Telke, D. Kalyani, J. Jadhav and S. Govindwar, Acta Chim. Slovaca, 2008, 55, 320–329 CAS.
- G. Wang, S. Chen, H. Yu and X. Quan, J. Hazard. Mater., 2015, 299, 27–34 CrossRef CAS PubMed.
- X. Zhang, Y. Wan, C. M. Feng, Y. Shen and D. Y. Zhao, Chem. Mater., 2009, 21, 706–716 CrossRef.
- V. Uwamariya, B. Petrusevski, Y. Slokar, C. Aubry, P. Lens and G. Amy, Water, Air, Soil Pollut., 2015, 226, 1 CrossRef CAS.
- M. Purkait, A. Maiti, S. Das Gupta and S. De, J. Hazard. Mater., 2007, 145, 287–295 CrossRef CAS PubMed.
- B. Hameed, A. Ahmad and K. Latiff, Dyes Pigm., 2007, 75, 143–149 CrossRef CAS.
- M. Bhaumik, R. McCrindle and A. Maity, Chem. Eng. J., 2013, 228, 506–515 CrossRef CAS.
- Z. Shu, T. Li, J. Zhou, Y. Chen, D. Yu and Y. Wang, Appl. Clay Sci., 2014, 102, 33–40 CrossRef CAS.
- Z. Shu, Y. Chen, J. Zhou, T. Li, Z. Sheng, C. Tao, D. Yu and Y. Wang, Appl. Clay Sci., 2016, 132–133, 114–121 CrossRef CAS.
- H. Lu, X. Qiao, W. Wang, F. Tan, Z. Xiao and J. Chen, Desalin. Water Treat., 2015, 56, 256–265 CrossRef CAS.
- C. Puri and G. Sumana, Appl. Clay Sci., 2018, 166, 102–112 CrossRef CAS.
- C. Chen, P. Gunawan and R. Xu, J. Mater. Chem., 2011, 21, 1218–1225 RSC.
- S. K. Li, F. Z. Huang, Y. Wang, Y. H. Shen, L. G. Qiu, A. J. Xie and S. J. J. Xu, Mater. Chem., 2011, 21, 7459–7466 RSC.
- S. Ghosh, K. P. Dey and M. K. Naskar, J. Am. Ceram. Soc., 2013, 96, 28 CrossRef CAS.
- Z. A. ALOthman, Materials, 2012, 5, 2874–2902 CrossRef CAS.
-
C. J. Brinker and G. W. Scherer, Sol–Gel Science: The Physics and Chemistry of Sol-Gel Processing, Academic Press, 2013 Search PubMed.
- C. Lu, J. Lv, L. Xu, X. Guo, W. Hou, Y. Hu and H. Huang, Nanotechnology, 2009, 20, 215604 CrossRef CAS PubMed.
- S. Bi, C. Wang, Q. Cao and C. Zhang, Coord. Chem. Rev., 2004, 248, 441–455 CrossRef CAS.
- P. Veerakumar, T. Jeyapragasam, Surabhi, K. Salamalai, T. Maiyalagan and K.-C. Lin, J. Chem. Eng. Data, 2019, 64(4), 1305–1321 CrossRef CAS.
- I. Langmuir, J. Am. Chem. Soc., 1916, 38, 2221–2295 CrossRef CAS.
- W. Cai, S. Chen, J. Yu, Y. Hu, C. Dang and S. Ma, Mater. Chem. Phys., 2013, 138, 167–173 CrossRef CAS.
- W. Cai, J. Yu and M. Jaroniec, J. Mater. Chem., 2010, 20, 4587–4594 RSC.
- X. Song, P. Yang, C. Jia, L. Chen and K. Matras-Postolek, RSC Adv., 2015, 5, 33155–33162 RSC.
- W. Cai, Y. Hu, J. Chen, G. Zhang and T. Xia, CrystEngComm, 2012, 14, 972–977 RSC.
- Y. S. Ho and G. McKey, Process Biochem., 1999, 34, 451–465 CrossRef CAS.
- M. Nadeem, A. Mahmood, S. A. Shahid, A. M. Khalid and G. Mckay, J. Hazard. Mater., 2006, 138(3), 604–613 CrossRef CAS PubMed.
- W. J. Weber Jr. and J. C. Morris, Kinetics of adsorption on carbon from solution, J. Sanit. Eng. Div., Am. Soc. Civ. Eng., 1963, 89, 31–60 CrossRef.
Footnote |
| † Authors contributed equally |
|
| This journal is © The Royal Society of Chemistry 2022 |
Click here to see how this site uses Cookies. View our privacy policy here. 
 Open Access Article
 This Open Access Article is licensed under a Creative Commons Attribution-Non Commercial 3.0 Unported Licence
 *ab,
Sanjit
Das†
*ab,
Sanjit
Das†