
 Open Access Article
 This Open Access Article is licensed under a
 Creative Commons Attribution 3.0 Unported Licence
The characterisation of commercial 2D carbons: graphene, graphene oxide and reduced graphene oxide†
Peter W.
Albers
a,
Valeri
Leich
b,
Anibal J.
Ramirez-Cuesta
 c,
Yongqiang
Cheng
c,
Jonas
Hönig
d and
Stewart F.
Parker
*ef
c,
Yongqiang
Cheng
c,
Jonas
Hönig
d and
Stewart F.
Parker
*ef
aEvonik Technology & Infrastructure GmbH, 915 D115, Rodenbacher Chaussee 4, 63457 Hanau-Wolfgang, Germany
bEvonik Operations GmbH–Creavis, Paul-Baumann-Straße 1, 45772 Marl, Germany
cNeutron Scattering Division, Oak Ridge National Laboratory, Oak Ridge Tennessee 37831, USA
dEvonik Operations GmbH, Kirschenallee, 64293 Darmstadt, Germany
eISIS Pulsed Neutron and Muon Source, STFC Rutherford Appleton Laboratory, Chilton, OX11 0QX, UK. E-mail: stewart.parker@stfc.ac.uk
fSchool of Chemistry, Joseph Black Building, University of Glasgow, Glasgow, G12 8QQ, UK. Tel: +44 (0)1235 446182
First published on 11th February 2022
Abstract
In this work we have comprehensively characterised 13 products from commercial suppliers that are claimed to be 2D materials: graphene, graphene oxide and reduced graphene oxide. The techniques used have investigated the materials from the macroscale to the atomic scale. The results are consistent across all length scales: none of the products meet the ISO definition of “a single layer of carbon atoms”. Rather, they are largely nanographite with a small percentage of single layer material present. One of the techniques used was inelastic neutron scattering (INS) spectroscopy. INS enables the materials to be examined in the C–H/O–H stretch region without the complications of electrical anharmonicity that bedevil infrared spectroscopy. The spectra clearly show that most of the hydrogen is present as sp2 C–H; sp3 C–H is either absent or present as a minority species. This provides strong support for the Lerf and Klinowski model of graphene oxide. The spectra also show that the number of hydroxyls present is small, indicating that most of the oxygen is present as epoxides or carbonyls.
Introduction
Two-dimensional (2D) forms of carbon such as graphene (graphene nano platelet, GNP), graphene oxide (GO) and reduced graphene oxide (rGO) are the subject of intense interest worldwide because their unique properties offer the prospect of novel applications or improved performance in existing systems.1–4 However, to date the use of 2D carbons has been restricted to a few niche applications such as improved heat management for electronic devices5 or reinforcement in composite materials for sporting goods,6 although there are many more at the prototyping stage.7Widespread usage of 2D carbons requires their manufacture on the tonne to kilotonne scale. The production methods for the three materials are quite different. Graphene (defined by the International Organization for Standardization (ISO) as “a single layer of carbon atoms”8) can be produced by a variety of methods. For special applications such as electronics, chemical vapour deposition can provide large area (several cm2) defect-free graphene9,10 but this method is expensive and liquid phase exfoliation of graphite is generally used for large-scale manufacture.11,12 Direct synthesis via gas phase13 or solid state methods14 have been demonstrated and have the potential to overcome the limitations of liquid phase methods. Graphene oxide is usually made by oxidation of graphite powder2–4 and reduced graphene oxide by chemical reduction of graphene oxide.15 In principle, reduced graphene oxide and graphene should be the same material. In practice, the residual oxygen functionalities present in reduced graphene oxide make it a distinct material.
While 2D carbons produced in a laboratory can be unambiguously shown to be genuinely isolated sheets, for materials produced on a commercial scale this is both less certain and more difficult. Two major investigations16,17 of commercial graphenes concluded that much of the material was nano-graphite rather than graphene. Both papers used an array of techniques, but most of them only sample areas of a few microns or less. In a previous paper18 we showed that neutron vibrational spectroscopy (inelastic neutron scattering, INS19) could provide atomic scale information from commercial graphenes using sample sizes in the 3–30 g range, which is more representative of the bulk of the material.
In this paper we use a combination of physical measurements, electron microscopy, X-ray photoelectron spectroscopy (XPS) and vibrational spectroscopies (Raman and INS) to characterise a range of 2D carbons from manufacturers who state that they can supply material on the tonne+ scale per year. We show that many of the materials are not what they claim to be. In addition, we are able to better characterise the state of hydrogen (sp2 C–H, sp3 C–H, O–H) in these materials.
Experimental section
Materials
The materials were sourced from a variety of suppliers. All of the materials were obtained as powders and analyzed as received and are listed in Table 1. Graphene samples 3_GNP, 6_GNP, 11_GNP, 12_GNP and 13_GNP are those previously reported.18 The powders were dried in a vacuum oven for 12 h at 105 °C to remove any water residues or other volatile matter.| Production method | Surface area | Bulk density/g cm−3 | Elemental analysis | XRD | |||||
|---|---|---|---|---|---|---|---|---|---|
| Mean BET (error)/m2 g−1 | C/wt% | H/wt% | N/wt% | O/wt% | Crystallite size/nm | Number of layers | |||
| 3_GNP | Liquid exfoliation | 26(1) | 0.128 | 98.4 | <0.1 | <0.1 | 0.6 | 12 | 37 |
| 6_GNP | Electrochemical liquid exfoliation | 9(1) | 0.151 | 92.5 | 0.3 | <0.1 | 3.7 | 18 | 55 |
| 11_GNP | Liquid exfoliation | 39(6) | 0.148 | 96.4 | 0.2 | 0.1 | 1.4 | 16 | 48 |
| 12_GNP | Liquid exfoliation | 83(2) | 0.201 | 88.5 | 0.9 | 0.6 | 6.0 | 17 | 51 |
| 13_GNP | Liquid exfoliation | 39(1) | 0.057 | 97.9 | 0.1 | 0.1 | 0.3 | 14 | 42 |
| 5_GNP | Liquid exfoliation | 51(1) | 0.231 | 94.5 | 0.2 | <0.5 | <0.5 | 25 | 75 |
| 9_GNP | Dry exfoliation | 329(6) | 0.119 | 95.3 | 0.2 | 0.7 | 2.7 | 4.7 | 15 |
| 1_GO | Liquid exfoliation (oxidation & reduction) | 429(10) | 0.017 | 77.2 | 1.0 | <0.5 | 19.7 | 1.7 | 6 |
| 7_GO | Dry & mild exfoliation (oxidation) | 257(6) | 0.177 | 92.0 | 0.3 | 0.6 | 4.5 | 9.7 | 30 |
| 10_GO | Dry exfoliation | 713(20) | 0.185 | 91.8 | 0.3 | 0.6 | 4.7 | 5.3 | 16 |
| 2_rGO | Liquid exfoliation (oxidation & reduction) | 452(10) | 0.012 | 95.4 | 0.6 | <0.5 | 1.3 | 1.9 | 6 |
| 4_rGO | Liquid exfoliation (oxidation & reduction) | 192(3) | 0.011 | 95.6 | 0.3 | <0.5 | <0.5 | 6.6 | 21 |
| 8_rGO | Dry & mild exfoliation (thermal reduction) | 269(6) | 0.178 | 94.9 | 0.2 | 0.6 | 2.5 | 9.4 | 29 |
The carbon, nitrogen and hydrogen content were determined with the elemental analyzer Vario micro cube from Abacus and the oxygen content with the rapid OXY cube from Elementar. For each sample, two measurements were performed, and the average was calculated.
The specific surface area of the 2D materials was determined according to DIN ISO 9277 using the Brunauer–Emmett–Teller (BET) method. Measurements were performed in duplicate with a Micromeritics ASAP 2420.
Powder X-ray diffraction (XRD) data was obtained using a CubiX from Malvern Panalytical. The crystallite size (D) and average number of layers (N) were determined from the linewidth using the Scherrer equation20 and the equation N = (D/d) + 1, respectively (d = interlayer distance).21
Transmission electron microscopy (TEM)
For the TEM investigations the graphene samples were treated by liquid phase dispersion in isopropanol/water (ultrapure) using ultra-sonication with both a focused sonotrode and an ultrasonic bath. In spite of the comparably enforced input of ultrasonic dispersion energy even after dispersion the materials appeared as partly still compact and partly opaque to the incoming electrons. Very coarse or large particles were also observed, depending on the individual sample. These large particles could not be checked in detail in the TEM and are not included in the images. Note that holey carbon foil was used as support on the TEM-grids to allow for high resolution and analysis of graphene structures at the nanoscale. This allows the study of sample components which are adherent to the support and also those in areas which are located in the holes of the support, so can be analyzed without overlap.TEM of ultrathin cuts (ultrasonic diamond knife) of embedded stacks of GNP graphene particles in epoxy resin (thickness of the electron-transparent cut section ca. 100 nm) was also carried out. Tilting the sample allows an approximate determination of the thickness of the stacked graphitic layers with respect to the degree of exfoliation and the residual local graphitic ordering.
Two instruments were used to study the samples: H-7500 Hitachi TEM operated at 100 keV with a LaB6 cathode, which is a high contrast instrument and a Jeol 2010F 200 keV analytical TEM equipped with a field emission gun and an energy-dispersive X-ray spectroscopy (EDX) detector system.
X-ray photoelectron spectroscopy (XPS)
XPS analyses were performed using a 1 mm spot of surface area and monochromatic AlKα X-rays using an ESCALAB 250 Xi instrument. A Shirley-type background subtraction22 was applied to the data. Quantification (Table 2) was by peak integration from Gaussian/Lorentzian line shape analyses, after correction by a relative sensitivity factor of the transmission function of the XPS spectrometer.| TEM average agglomerate size (powder) | XPS analysis | ||||||||
|---|---|---|---|---|---|---|---|---|---|
| Mean/μm | Min./μm | Max./μm | Standard deviation of max. size/μm | Number of particles examined | C/at% | Plasmon-loss feature (%) of C1s | O/at% | O1s C–OH/C![[double bond, length as m-dash]](https://www.rsc.org/images/entities/char_e001.gif) Oa Oa |
|
| a Surface polarity: as approximated by the O1s signal contributions at ca. 533 eV and 531 eV. | |||||||||
| 3_GNP | 2.80 | 0.29 | 10.23 | 2.91 | 29 | 98.0 | 7.8 | 2.0 | 1.23 |
| 6_GNP | 3.24 | 0.34 | 19.20 | 5.40 | 30 | 94.9 | 8.4 | 4.8 | 0.75 |
| 11_GNP | 3.22 | 0.20 | 25.04 | 6.06 | 25 | 96.7 | 8.9 | 2.8 | 0.68 |
| 12_GNP | 3.70 | 0.22 | 18.49 | 4.49 | 25 | 91.4 | 6.6 | 6.0 | 0.82 |
| 13_GNP | 6.99 | 0.23 | 32.58 | 7.80 | 25 | 97.0 | 9.4 | 2.1 | 0.42 |
| 5_GNP | 3.28 | 0.06 | 13.87 | 4.34 | 27 | 95.0 | 9.2 | 3.7 | 0.27 |
| 9_GNP | 1.11 | 0.12 | 4.89 | 1.23 | 30 | 96.3 | 9.2 | 3.2 | 1.25 |
| 1_GO | 5.35 | 0.23 | 18.55 | 4.97 | 24 | 84.4 | 4.6 | 14.5 | 1.27 |
| 7_GO | 0.63 | 0.06 | 2.48 | 0.67 | 25 | 93.6 | 9.0 | 5.6 | 1.27 |
| 10_GO | 3.96 | 0.80 | 7.94 | 1.73 | 30 | 94.6 | 8.5 | 5.1 | 1.12 |
| 2_rGO | 5.96 | 0.57 | 12.75 | 3.75 | 31 | 97.8 | 9.8 | 1.9 | 0.80 |
| 4_rGO | 6.63 | 0.16 | 21.43 | 5.87 | 28 | 97.4 | 9.5 | 2.0 | 1.42 |
| 8_rGO | 1.82 | 0.20 | 4.86 | 1.31 | 28 | 94.6 | 9.1 | 4.4 | 1.23 |
Raman spectroscopy
For each sample, Raman spectra were recorded using a Horiba LabRam Evolution. For each sample, spectra from five different points were recorded with a using a 50× long working distance objective, laser excitation at 532 nm, a power of about 1.6 mW at the sample and a measurement duration of 30 seconds. The spectra were denoised by the spectrometer software and a baseline correction was performed. The relevant parameters were calculated by band decomposition of the spectra.Inelastic neutron scattering spectroscopy (INS)
For the INS measurements, cylindrical thin walled aluminium cells (0.5 mm wall thickness, internal diameter 4.5 cm and 6.0 cm height) were produced to enable bulk quantities of graphene powders to be used. 2D carbon samples of 3–20 g weight, depending on the pouring density, were loaded into the cells and slightly compressed with a piston. The cells were O-ring sealed by a stainless steel top flange and pipe, connected to a welded bellows valve (Swagelok®). After 12 h evacuation using a turbomolecular pump, the sample was heated to 120 °C under vacuum.INS spectra were recorded using the TOSCA23,24 and MAPS25,26 spectrometers at ISIS.27 On TOSCA the resolution is ∼1.25% of the energy transfer across the entire energy range, while on MAPS, under the conditions used here, it is ∼1.5% of the incident energy at the largest energy transfer and degrades with decreasing energy transfer. TOSCA provides excellent energy resolution at energy transfers <1200 cm−1, at larger energy transfer MAPS provides better resolution by virtue of the access to low momentum transfer, in particular it provides access to the C–H and O–H stretch regions (2800–4000 cm−1).25 Thus the instruments are highly complementary and enable the complete “infrared” range, 0–4000 cm−1, to be covered with good resolution. All of the samples were measured on TOSCA, selected ones were also measured on MAPS. On both instruments the samples were cooled to <20 K and the measurement times were 8–12 hours. For the TOSCA spectra, an empty can was subtracted and the data then normalised to 1 g of sample. For the MAPS data, as aluminium has no features in the region of interest above 2000 cm−1, only the sample normalisation was carried out.
Computational studies
Density functional theory (DFT) calculations of graphene were performed using the Vienna Ab initio Simulation Package (VASP).28 The calculations used the Projector Augmented Wave (PAW) method29,30 to describe the effects of core electrons, and Perdew–Burke–Ernzerhof (PBE)31 implementation of the Generalized Gradient Approximation (GGA) for the exchange–correlation functional. The energy cutoff was 800 eV for the plane-wave basis of the valence electrons. The lattice parameter was 2.456 Å. A vacuum gap of 4 nm was created between the graphene layers (along z direction). The total energy tolerance for the electronic energy minimization was 10−8 eV. A supercell (4 × 4 × 1 of the unit cell) was used for the phonon calculation. The interatomic force constants were calculated by the finite displacement method and the vibrational eigenfrequencies and modes were then calculated using Phonopy.32 The OCLIMAX software33 was used to generate the simulated INS spectra from the DFT-calculated phonon results.Results
Physical properties
Table 1 lists the materials studied, their method of production and some of their physical properties. Several trends are apparent. The theoretical surface area of graphene34 is 2630 m2 g−1 and this is likely to be also the case for graphene oxide and reduced graphene oxide. It can be seen from Table 1 that none of the materials comes close to this value. Most of the graphenes are only a few percent of this value, the graphene oxide and reduced graphene oxide have significantly larger areas in the range ∼10–30%. This indicates that none of the products consist exclusively of single layer material.XRD (see Fig. S1–S13, ESI†) shows that the crystallite size ranges from 1.7 to 25 nm but with no correlation to the type of material, Table 1. The XRD also shows that there are a significant number of layers present in all the materials.
The elemental composition follows the expected trends. Thus the graphenes are predominantly carbon, the graphene oxides have a significant oxygen content and the reduced graphene oxides are predominantly carbon but with an oxygen content intermediate between that of the graphenes and the graphene oxides. We note that two of the graphenes (6_GNP and 12_GNP) have oxygen contents that are more typical of the graphene oxide samples.
The hydrogen content varies between ∼0–1 wt% and all three classes of material show the full variation. The nitrogen content is generally low for the graphenes but there is some present in both the graphene oxide and reduced graphene oxide samples. This is understandable based on their method of preparation:3 two common methods for the oxidation of graphite to graphene oxide use nitric acid and hydrazine is a common reductant for graphene oxide to reduced graphene oxide. However, it is to be emphasised that these are all trends, there are outliers in all cases. We will return to discussion of the composition in the sections on XPS and INS studies.
Transmission electron microscopy (TEM)
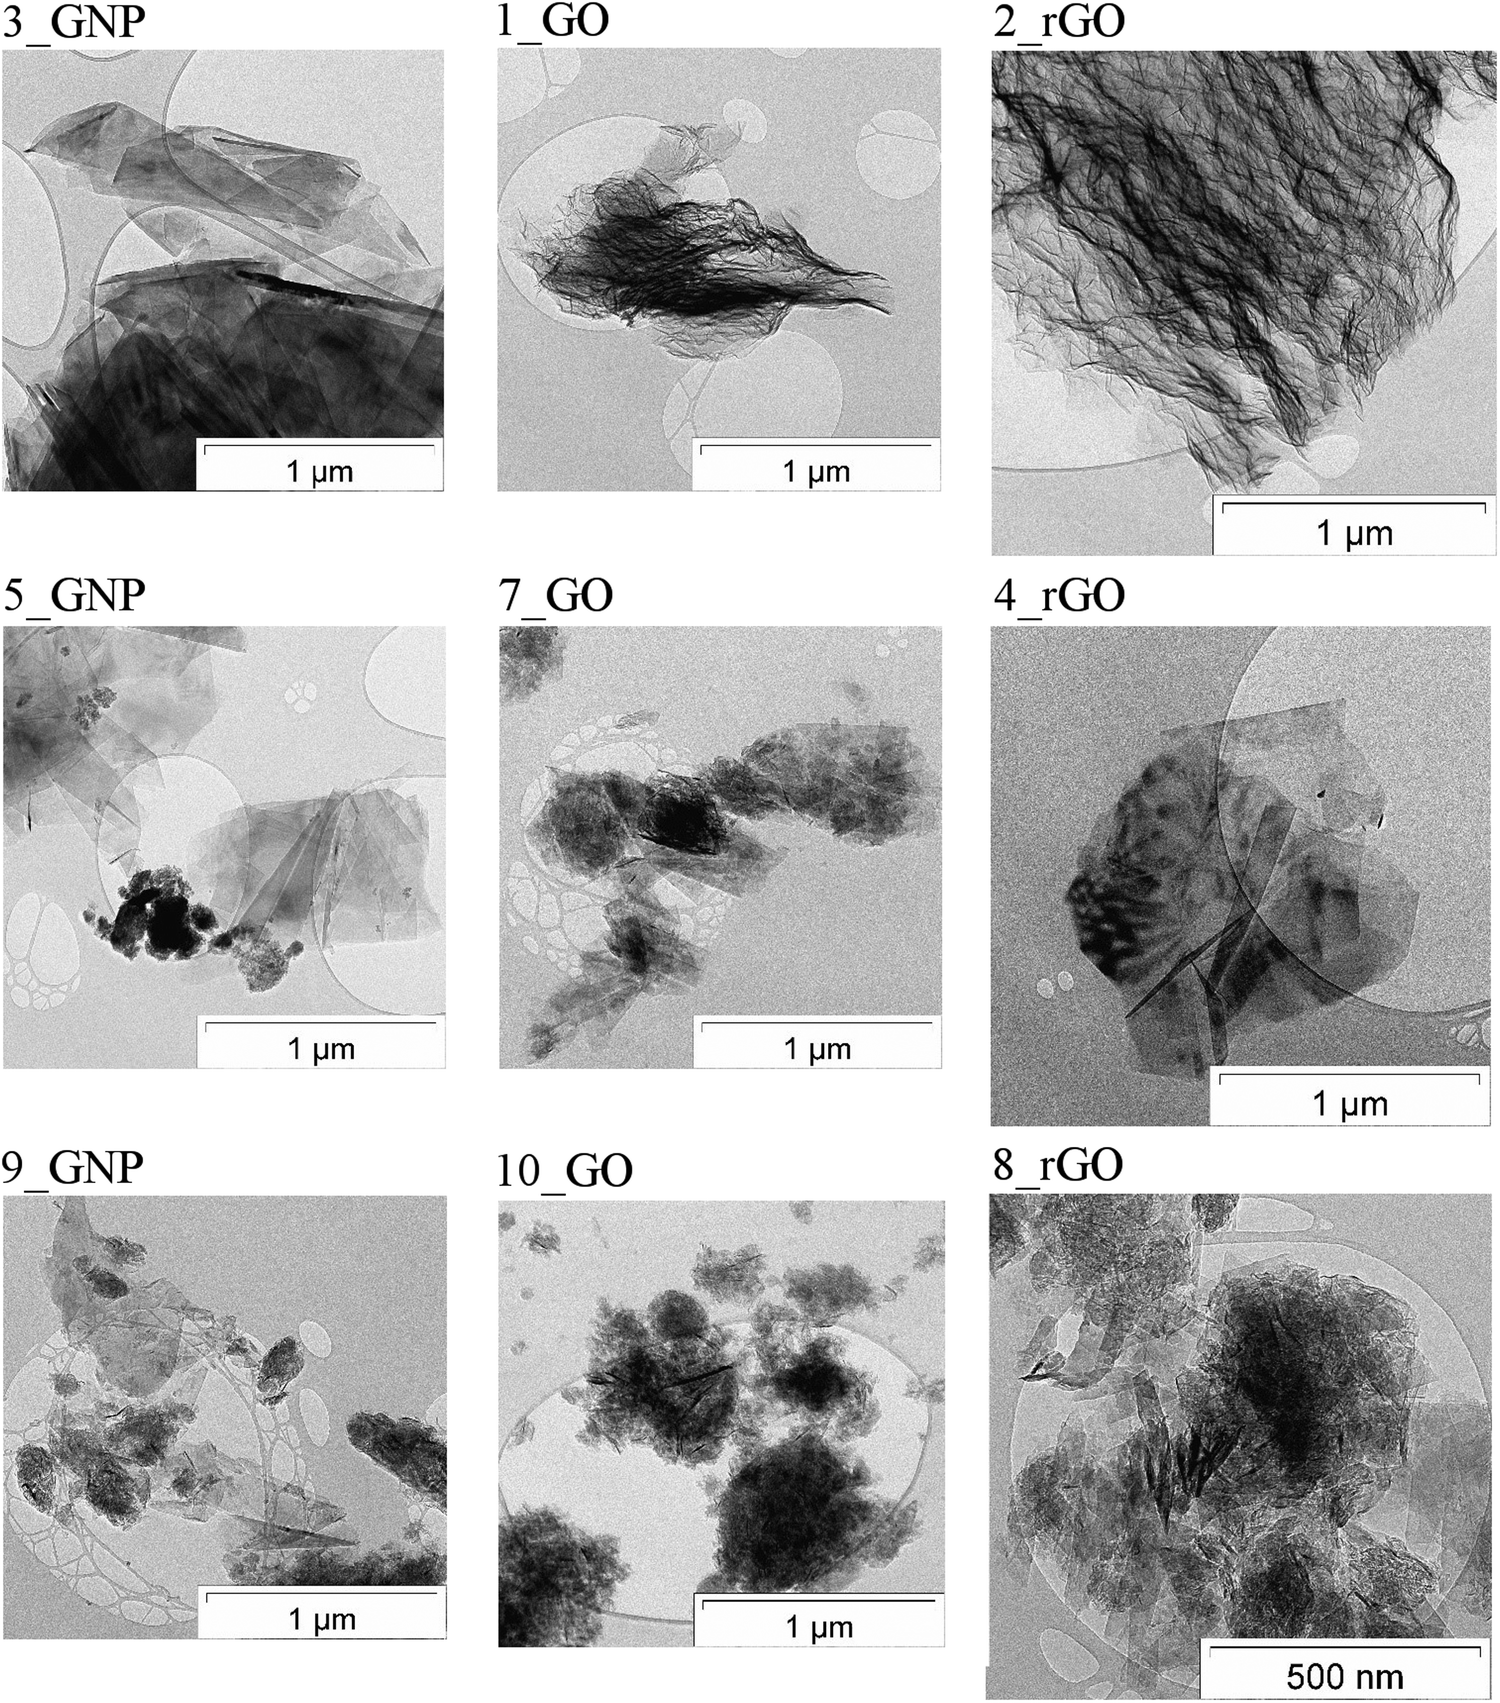
Using a 100 keV TEM instrument (high contrast mode, ideal to visualize the fine structure of layered systems of low atomic number) allowed the comparison of the shape, size and specific micromorphology of the different 2D carbons at the microscale and below. This information was combined with the results from a 200 keV analytical field emission TEM (high resolution and ideal for energy dispersive analysis (EDX) nanospot-analyses) to check the morphology and local composition down to the nanoscale. Together, the two instruments enabled the determination of the dimension of graphene sheets as basic structural units and to identify other carbonaceous constituents and trace contaminants. Due to the heterogeneity of the particles of the various 2D carbon samples, higher resolution analytical TEM work was necessary to visualize properties and differences down to the nanoscale dimension of the graphene sheets more clearly. A series of TEM-images at different magnification are essential in order to document the varying properties of these complex particle ensembles.In agreement with the conclusions from the physical measurements, and contrary to the expectation that largely isolated, exfoliated single sheets were mostly present, the carbonaceous particles resembled aggregates and agglomerates. These may be classified according to DIN 5320635 and as seen by 3D-TEM for carbon black.36
Survey images at low resolution, Fig. 1 and at higher resolution Fig. 2 and S14 (ESI†), show that even more compact particles are present, indicating incomplete ball mill grinding and exfoliation. This is the reason that the imaging conditions are complicated by the sample-specific differences in agglomeration/aggregation and polydispersity (which can be recognized and compared at low TEM magnification). Defects (as defined in ISO/TR 19733:201937) are present and there are mismatches and tilting of single sheets and stacked sheets. There are also local variations in thickness and size plus the presence of other carbonaceous components, contaminants (partly inorganic/metallic) and local density variations are present. In spite of the input of significant dispersion force by liquid phase dilution and dispersion by ultrasonication, the dispersion efficiency was limited.
 | ||
| Fig. 1 100 keV TEM survey images: left: 13_GNP, middle: 7_GO, right: 2_rGO. See also sample tilt movies at higher resolution in the ESI.† | ||
 | ||
| Fig. 2 200 keV TEM images of the 2D carbons. Left column: graphenes, middle column: graphene oxides, right column: reduced graphene oxides. | ||
The 100 keV TEM-images, Fig. 1 and S14 (ESI†), demonstrate that while the micromorphology of the various 2D carbon samples show some similarities, there are also pronounced morphological differences, these are present both within a sample and between samples. These indicate differences in the graphite educts, efficiency of the exfoliation procedure and oxidation treatments and the mechanical dispersion (or ball mill grinding and other pretreatments at the materials’ suppliers). Specifically, there are:
– Structural inhomogeneities (compare 3_GNP, 1_GO and 2_rGO in Fig. 2, sheets are largely present in 3_GNP, while 1_GO and 2_rGO show crumpled morphologies).
– Edged as well as spherical shape of polydisperse particles (compare 5_GNP and 10_GO in Fig. 2).
– Structural defects and stacking disorder (indicated by two/three-dimensional) lattice fringes and Moiré contrasts of the graphitic basal plane arrangements of different sizes, including small and large angle tilts of graphene sheets and graphitic entities, tentative ‘tubes and ribbons’, at varying angle of orientation and tilting, (see 7_GO and 8_rGO in Fig. 2) due to different efficiency of the exfoliation processes and different educt properties (these effects are clearly seen in the “tilt” movies in the ESI†).
– Traces of adherent particles or included particles (e.g. silica, debris) (abrasion or corrosion from reactor steel – Fe, Cr, etc.), sulfur and others as potential residues from ball milling treatment and other de-structuring treatment of compact graphitic matter (see Fig. S15 and Table S1, ESI†).
– Local variation of density and graphitic ordering/disorder in the carbonaceous material.
– Presence of single layer, few-layer and multilayer 2D carbon and other carbonaceous matter with different proportions and degrees of residual aggregation/agglomeration. (Sample 9_GNP in Fig. 2 shows these effects.)
Since the overview demonstrates pronounced differences in size and shape, we attempted to estimate the varying dimension of graphene-like fine structures/substructures by statistical evaluation of the TEM-images, see Table 2. The pronounced heterogeneity and polydispersity of the more or less rectangular or spherical compact and fine particles raises serious problems in deriving reliable numerical results of the particle ensembles. Contributions of different amounts of large particles could not be evaluated and are missing. This has to be kept in mind in potential attempts of working out and comparing weight and number size distributions. Within this limitation, it can be seen that for most of the 2D carbon samples the average particle size is a few microns, although the individual samples range from 1< to >30 microns in size. Comparison with the crystallite size determined by XRD (Table 1, column 9) shows that the maximum particle size largely follows the same pattern as that of the crystallite size for the GNP and rGO samples, although there is a factor of 103 in the relative sizes (μm vs. nm). This is not seen for the GO samples, where the pattern is inverted.
In some of the graphene samples, TEM-imaging suggests some more graphiticity and enhanced long-range sp2 order in the outer zones of the particles than in deeper zones, Fig. 3. This may partly be the result of differences in thickness in the surface and “bulk” regions of linear – 2D – graphene sheets/stacks and orientation effects. However, it is well-known, and common, for carbon blacks that subsequent graphitization is usually higher at the outer perimeter of those spherical – 3D – powders.38 The observed sheets often show some curvature, with overlap of sheets and the presence of three-dimensional carbon. Defects and density variations are also present. Together, all of these factors prevent the “ideal hexagonal graphene patterns” from being observed. The term “para-crystalline carbon” is used to describe the disorder of the basic structural units in carbon black, a 3D material. Here, we use the same term to describe these nominally 2D materials because they show the same types of imperfections and disorder.
 | ||
| Fig. 3 200 keV TEM images of graphenes showing linear sp2 type order (i.e. graphite planes – d-spacing 0.34 nm) at the edges (left) and partly turbostratic disorder in the interior (right). | ||
The average degree of separation and isolation of stacked graphene layers may be enhanced by additional treatments, as shown in Fig. 4. The rGO's, Fig. 4c and d, show a more crumpled appearance and some more disorder and three-dimensional morphology. EDX nano-spot analyses in Fig. 4a reveal the presence of traces of particular debris including inorganic components (the dark spots) and in Fig. 4b traces of sp3-carbon (circled).
 | ||
| Fig. 4 TEM of GNP ((a) and (b), exfoliated) and rGO (c) and (d), (oxidation and reduction and exfoliation). The dark spots in (a) are inorganic material, the circled area in (b) is partly sp3-carbon. | ||
The structural and morphological differences between GNP, GO and rGO (tilt movies in the ESI†) in the survey images Fig. 1 and in the 200 keV TEM images presented in Fig. 2 and Fig. S14 (ESI†) are also reflected in the XRD results (Table 1, calculated layer range 75–6) by evaluation of an average number of layers, decreasing from more compact graphitic ordering to spherical mismatch for GO's down to more crumpled partly isolated disordered graphene sheets (TEM Fig. 2, comparison of TEM images in Fig. 2–5).
Fig. 5 shows the different shapes and the local degree of exfoliation and stacking of graphene sheets. No purely isolated single sheets are seen. The materials are electron-transparent more or less tilted graphene sheets. Stacks of flat sheets are seen as shown by the Moiré contrast (Fig. 5a, top right). Variations of local thickness, bending/corannulene type sphericity and different carbon morphologies are also present. The contrast variations in Fig. 5a and b show the presence of turbostratic and lubricostratic disorder. Fig. 5c shows contrast variations within individual layers. These are due to inorganic contaminants (see Fig. S15 and Table S1, ESI†) and also the presence of sp3 carbon.
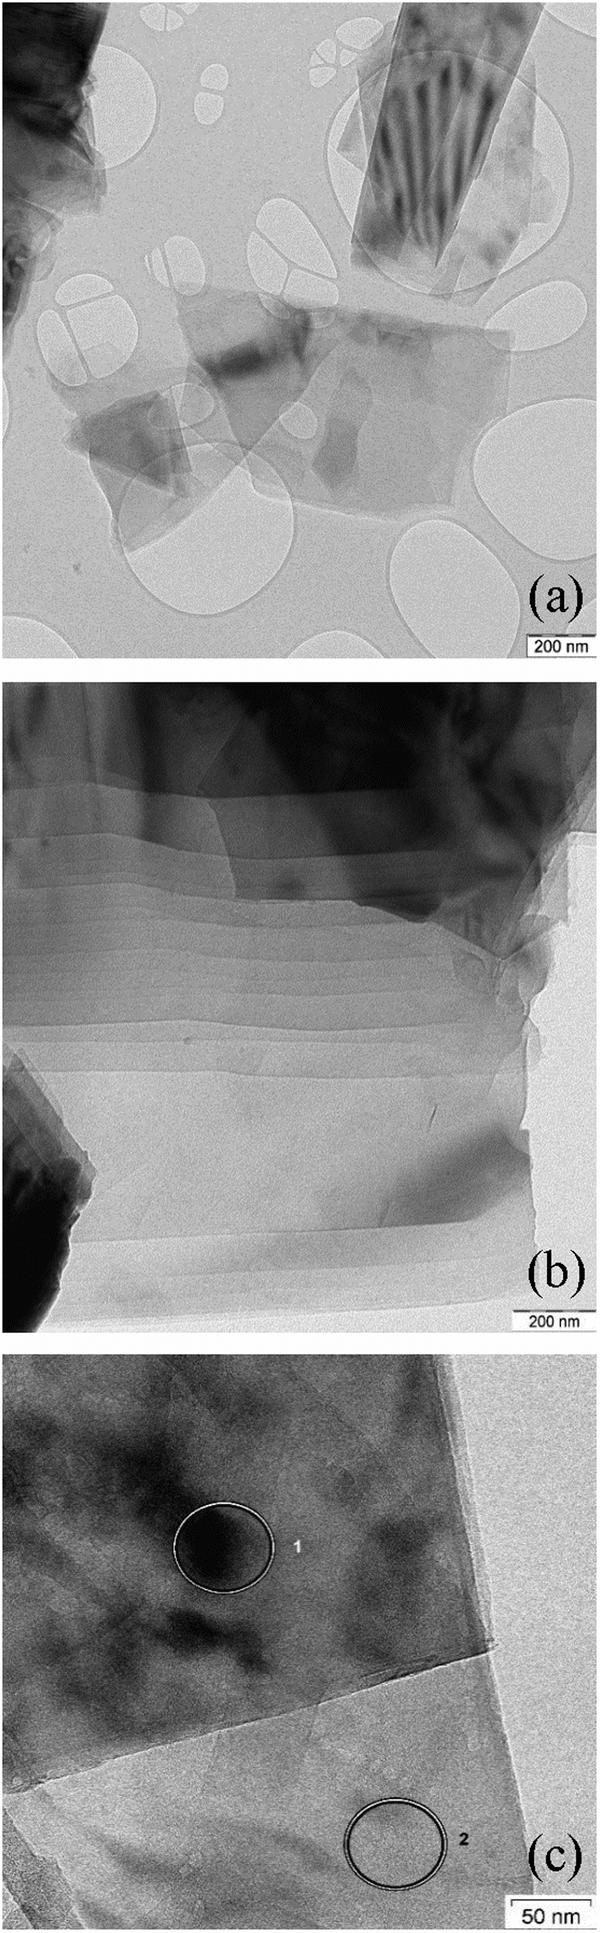 | ||
| Fig. 5 HR-TEM of GNP recorded after liquid phase dispersion/ultrasonication/dilution and supported on holey carbon foil: (a) shows the turbostratic disorder and adhesion of stacked sheets, (b) and (c) show the presence of lubricostratic disorder, stacks of flat sheets; variations in local thickness and bending/corannulene type sphericity. The areas 1 and 2 in (c) mark the spot-diameter of the nano-EDX analyses confirming the presence of carbon and no local contamination with elements of different density. | ||
In order to better visualize the structure of the samples, tilting experiments of 13_GNP, 7_GO, 2_rGO were carried out in the TEM. These comprise a series of images with the sample at a different angle to the electron beam in each case. The images are then assembled into a ‘movie’.36 The movies are included as part of the ESI.† Inspection of these shows:
13_GNP: changing the tilt angle between 0 → 90 → 180° of the TEM sample holder shows an expected anisotropy of the staples of flat sheets of partly rectangular and triangular shape. Moiré contrasts in tilting more or less electron transparent sheets illustrate mismatch in ‘staple’ order and orientation.
7_GO: the material appears partly as opaque/spherical with few Moiré effects. This is in-line with expansion and enhanced separation between large/thicker sheets. Compared to 13_GNP only weak changes of aspect ratio with tilt angle appear.
2_rGO: appears as even much more electron transparent/translucent than the 13_GNP. Extended, bent, partly isolated sheets of few graphene layers with partly spherical/crumpled morphology appear. See also Fig. 4c and d.
In summary, it appears that the different commercial graphene materials are more complicated than to be expected by the ideal, extreme, expectation “one single layer of graphene only present”, and a corresponding systematic increase of H-termination39 with decreasing sheet size and increasing oxidative attack on the basal planes and the corresponding increase of defects (e.g. by epoxidation). Together, Fig. 1–5 show that the materials are heterogeneous at all length scales from the micron to the nanometer. The combination of varying degree of exfoliation, the average residual stacking height of the remaining graphitic educt structures, the presence of defects and functionalization may complicate the different properties. Aberration corrected TEM offers further potential in this area.40 This highlights the need for a combination of several analytical methods.18
X-ray photoelectron spectroscopy (XPS)
For carbon-based materials, the sp2 C1s contribution to the XPS signal is strongly asymmetric and the asymmetry parameter and C1s-peak width show variations,41–44 but this has often not been taken into account in (semi-)quantitative evaluations. Previous XPS studies of the C1s XPS of graphene oxide and the same material after reduction43 suggests that, overall, there is still a moderate degree of oxidation present in the reduced materials. In addition, at low and even at high oxygen contents, conventional Gaussian/Lorentzian line shape analyses of the C1s signal can be unreliable in deriving the relative proportions of (e.g.) CO groups at about 286 eV and also surface carboxyls around 289 eV.41,44 Therefore, both the C1s and O1s signals were measured. The O1s was used for the semi-quantitative numerical comparison of the degree of surface oxidation. The evaluation of the C1s was confined to qualitative probing for the presence of carbonyl (ca. 286/287 eV) and carboxyl groups (ca. 289 eV). In particular, the plasmon-loss feature contribution (ca. 291 eV) was used as a signature for sp2 carbon. From Table 2 it can be seen that there is a rough inverse correlation between the plasmon peak and the oxygen content. The two samples with the lowest contribution from the plasmon peak, 12_GNP and 1_GO are the only samples that show the presence of sp3 C–H. Representative C1s spectra are shown in Fig. S16A (ESI†). Overall, the C1s XPS spectra are all very similar so are not particularly informative. We note that the INS data (see later) provide information on the relative amounts of sp2 and sp3 carbon via the attached hydrogen atoms.
Fig. 6 shows a superposition of the high resolution O1s XPS detail spectra of samples 1–13. These show considerable chemical differences as expressed in the fine structure of the oxygen signals of GNP, GO and rGO. Semi-quantitative evaluations (Table 2) show that significant amounts of oxygen are present in all the samples (including the ‘pure’ graphene materials) at varying levels. These correlate reasonably well with the oxygen content as determined by elemental analysis (Table 1), suggesting that the oxygen is homogeneously distributed throughout the stacked material and not just localized at the surface. The strongly varying oxygen contents illustrate distinct differences in the preparation and post-treatment processes in the manufacture of the graphene products. For these nominally pure 2D materials, the values are similar to those previously found for 3D carbon materials with similar BET surface areas. Thus, values around 3–10% are observed in the case of post-oxidized carbon black45 or activated carbons,46,47 see Table S2 (ESI†).
 | ||
| Fig. 6 O1s XPS spectra of the 2D carbon samples. | ||
The focus of deriving the relative proportions of different functional groups uses the O1s peak. The peak superposition (Fig. 6) show significant differences in both the relative and absolute amounts of the species present, due to variations of the C–OH/CO contributions (more polar/H-acidic/“less-polar” groups). As a rough assignment: ca. 533 eV is C–OH in e.g. phenolic, lactolic, carboxylic groups and ca. 531 eV region CO in carboxylic, pyronic, lactonic, quinoid groups or others. The peak separation between the C–OH and CO regions show differences, probably due to the presence of varying levels of C–O–C groups (ca. 532/533 eV) and differences in local substitutional structure. The relative changes are more apparent in the normalised and overlaid spectra, Fig. S16B–D (ESI†).
The C–OH/CO ratio (Table 2) provides an indication of the surface polarity. This does not follow the expected trends: GNP and rGO non-polar, GO polar. The GNP samples generally have the smallest ratio and the GO samples larger ratios, but there is overlap between the two groups and the rGO samples are more typical of GO than GNP. This is yet further evidence that the materials are not what they claim to be. There is also no correlation of the ratio with the XPS determined oxygen content.
Inspection of the O1s fine structure in Fig. 6 – for example 1_GO and 2_rGO or 7_GO and 8_rGO – shows the presence of epoxy groups (ca. 533 eV), and traces of strongly adsorbed water (ca. 534 eV). The differences in surface polarity are well-expressed in the comparison of the 10_GNP to 13_GNP samples and by comparison of the peak shapes and widths of all of the samples in the overview plots.
N1s XPS, Fig. 7, shows that in the reduced graphene sample, 4_rGO, the small amount of residual nitrogen was present as a mixture of three species, with peaks at: 398.5, 400 and 401.8 eV. In the literature48,49 GO that has been reacted with NH3 at high temperature shows the same three peaks and these are assigned as: pyridinic N (A), pyrollic N (B) and quaternary N (X) (see inset in Fig. 4 for the labels). Our sample has not been exposed to NH3 and we consider that the assignment to quaternary nitrogen is unrealistic here. Instead, we assign it to residual ammonium surfactant, that was used as a reductant. Our experience is that such samples can contain up to 1 wt% residual surfactant, as a result of incomplete washing.
 | ||
| Fig. 7 N1s XPS spectrum of sample 4_rGO. | ||
Raman spectroscopy
Raman spectroscopy is a non-destructive and quick technique to characterize carbons, such as graphite and graphene-based materials.50 In pure, crystalline graphite,51 a single peak is seen at 1575 cm−1. This is now called the “G peak” and arises from the only Raman-allowed mode, the C–C stretch vibrations in the sp2-hybridized lattice. In defective graphite, a second peak51 is seen at 1355 cm−1. This is known as the “D peak” and originates from defects in the structure of the sp2-hybridized system that break the symmetry of the lattice.In graphene, the same peaks are also seen. The D peak can be at least found at the edges of the material. Moreover, another peak occurs at around ∼2700 cm−1 known as the 2D peak. The 2D peak is the first overtone of the D peak, hence is at twice the wavenumber. It has become apparent that the G and 2D peaks change their position, shape and relative intensity depending on the number of layers.52,53 This makes it possible to distinguish graphene from graphite. The 2D peak of graphene is sharp, while the 2D peak of graphite consists of two components with different shapes and relative intensities. Since the intensity of the G peak is similar in graphene and graphite and the intensity of the 2D peak differs, the intensity ratio I(G)/I(2D) of the peaks can be used to determine the number of layers. However, this is only possible up to five layers. In single-layer graphene, the G peak occurs at approximately 1587 cm−1 and the 2D peak at 2700 cm−1. The ratio of the height of the G peak to that of the 2D peak provides the most recognizable feature of single-layer graphene: this ratio is roughly 0.5 for pristine graphene. As the number of layers increases, the ratio also increases, being approximately 1 for bilayer graphene, about 1.2 for few-layer graphene and roughly 2.0–2.5 for 4 or 5-layered graphene all the way up to many-layered graphite.54
Since the presence of the G peak is evoked by lattice vibrations of the sp2-hybridizied carbon atoms and the presence of the D peak reveals the occurrence of structural defects, the intensity ratios of both peaks I(D)/I(G) can be used to determine the density of defects. The intensity of the G peak is nearly constant with increasing defects in the sp2-hybridizied network in comparison to the intensity of the D peak which is increasing. Thus, the larger the intensity ratio I(D)/I(G), the higher the defect density.55,56
Results of the Raman analysis are displayed in Table 3 and the spectra are shown in Fig. S17–S29 (ESI†). Surprisingly, only two graphenes, namely 9_GNP and 8_rGO, have a I(G)/I(2D)-ratio below 2.5, which indicates having a material with 4–5 layers. Peak positions of the G- and 2D-peak are in accordance with those expected for few-layered materials (2700 and 2702 cm−1, and 1584 and 1586 cm−1 for 9_GNP and 8_rGO). Two other materials (5_GNP and 7_GO) have values for the I(G)/I(2D) ratio of ∼2.7, suggesting a few-layered system. Interestingly it was found that those four materials have quite high I(D)/I(G)-ratios ranging from 0.36–0.73, indicating a high degree of defects in the lattice or scattering from the edges of the platelets. Comparing TEM images and the particles sizes (Table 2), 9_GNP, 8_rGO and 7_GO have rather small platelet sizes, whereas 5_GNP has rather large platelets (∼3 μm). This is in accordance with the XRD data, where 5_GNP shows a crystallite size of 25 nm, whereas the other materials have crystallite sizes below 10 nm.
| Raman analysis | ||||||||
|---|---|---|---|---|---|---|---|---|
| 2D-Peak/cm−1 | Intensity/counts | G-Peak/cm−1 | Intensity/counts | D-Peak/cm−1 | Intensity/counts | I(G)/I(2D) | I(D)/I(G) | |
| 3_GNP | 2712 | 123 | 1581 | 376 | 1350 | 59 | 3.06 | 0.16 |
| 6_GNP | 2714 | 494 | 1581 | 1909 | 1351 | 197 | 3.86 | 0.10 |
| 11_GNP | 2713 | 415 | 1582 | 1521 | 1352 | 116 | 3.67 | 0.08 |
| 12_GNP | 2714 | 373 | 1581 | 1409 | 1353 | 74 | 3.78 | 0.05 |
| 13_GNP | 2714 | 292 | 1582 | 1240 | 1353 | 24 | 4.25 | 0.02 |
| 5_GNP | 2702 | 226 | 1582 | 607 | 1349 | 217 | 2.69 | 0.36 |
| 9_GNP | 2700 | 300 | 1584 | 694 | 1348 | 361 | 2.31 | 0.52 |
| 1_GO | 2708 | 232 | 1585 | 1636 | 1353 | 1697 | 7.05 | 1.04 |
| 7_GO | 2706 | 430 | 1585 | 1178 | 1349 | 767 | 2.74 | 0.65 |
| 10_GO | 2685 | 478 | 1579 | 1581 | 1340 | 1449 | 3.31 | 0.92 |
| 2_rGO | 2679 | 173 | 1590 | 989 | 1342 | 1565 | 5.72 | 1.58 |
| 4_rGO | 2688 | 68 | 1593 | 593 | 1349 | 927 | 8.72 | 1.56 |
| 8_rGO | 2702 | 378 | 1586 | 934 | 1350 | 685 | 2.47 | 0.73 |
It is worth noting that the GNP samples show smaller I(D)/I(G) ratios than the GO and rGO samples, indicating a low degree of defects and less scattering from the edges. This correlates with the production process of the graphenes, which is usually just an exfoliation with surfactants under mild conditions. Hence a low number of defects and large platelets are expected. In contrast, GOs and rGOs are produced under harsh conditions, thus more defects are expected, which is in line with the Raman data and I(D)/I(G) ratios >1 are observed.
Inelastic neutron scattering spectroscopy (INS)
Fig. 8 shows the INS spectra grouped by sample type and includes a reference spectrum of graphite measured previously.57 Full range (0–4000 cm−1) TOSCA and MAPS spectra of all the graphenes (including those shown previously)18 are shown in Fig. S30 and S31 (ESI†), respectively. | ||
| Fig. 8 INS spectra of the 2D carbon samples. Left column: spectra recorded on TOSCA and right column: recorded on MAPS. Top panels, graphenes: (a and a′) 11_GNP, (b and b′) 9_GNP, (c and c′) 13_GNP and (d and d′) 5_GNP. Middle panels, graphene oxides: (e and e′) 1_GO, (f and f′) 10_GO and (g and g′) 7_GO. Bottom panels, reduced graphene oxides: (h and h′) 2_rGO, (i and i′) 4_rGO, (j and j′) 8_rGO and (k) graphite. Note that the ordinate scales in the two columns are not the same. (a′) Is ordinate expanded ×0.5 relative to b′–d′, g′ is ordinate expanded ×3 relative to e′ and f′, j′ is ordinate expanded ×2 relative to h′ and i′. | ||
Regarding Fig. 8, some general observations are that within each class of materials there are distinct differences. The spectra range from being almost identical to that of graphite (all of the GNP samples, 7_GO and 8_rGO) to more closely resembling activated carbon46,47 or glassy carbon57 (particularly 1_GO, 2_rGO and 4_rGO), with the remainder intermediate between these extremes. It is also apparent that supposedly different materials (GNP, GO, rGO) can exhibit similar spectra e.g. those resembling graphite.
In the C–H and O–H stretch regions, (Fig. 8, right column), all of the samples measured show the presence of C–H bonds, the relative intensities of which are broadly consistent with the hydrogen content, Table 1. The major peak of all the samples, see Table 4, is at, or slightly above, 3000 cm−1 indicating hydrogen bound to sp2 carbon atoms. However, within this grouping, there is a distinction between the samples: 3_GNP at 3005 cm−1, 1_GO, 10_GO and 8_rGO at 3140–3150 cm−1 and 2_rGO at 3120 cm−1. Sample 1_GO is unusual in that it has a shoulder to high energy at 3180 cm−1 and also shows a peak at 2970 cm−1, showing the presence of some hydrogen bound to sp3 carbon atoms (see Fig. S32, ESI†). The C–H stretch of 3_GNP occurs in the range typical of aromatic hydrocarbons58 and that found for activated carbon and glassy carbon57 (3075 cm−1) and as seen previously for a defective graphene59 (3060 cm−1), thus behaves as expected for hydrogen bound to sp2 carbon. The main C–H stretch band in the oxidised samples occurs ∼100 cm−1 higher than for the ‘pure’ graphenes. Alkenes58 and epoxides60 exhibit C–H stretch modes around 3050 cm−1, so these can be discounted. While furan and pyrrole (five membered heterocyclic aromatic systems) do show bands61 at ∼3150 cm−1, it seems very unlikely that they could be the majority species present. The most likely assignment is that the bands at ∼3150 cm−1 are sp2 C–H modes that are perturbed by the presence of oxygenated functionalities.
| sp3 C–H | sp2 C–H | O–H | O/wt% | C–H to O–H ratio | |
|---|---|---|---|---|---|
| 3_GNP | 3005 | 0.6 | — | ||
| 6_GNP | 3090 | 3210, 3350, 3470 | 3.7 | 0.2 | |
| 11_GNP | 2940 | 3080 | 3280, 3440 | 1.4 | 2.4 |
| 12_GNP | 3015/3130 | 3450 | 6.0 | 3.0 | |
| 13_GNP | 3000 | 3390 | 0.3 | 2.3 | |
| 5_GNP | 3020 | 3550 | <0.5 | 4.9 | |
| 9_GNP | 2910 | 3065 | 3480 | 2.7 | 1.9 |
| 1_GO | 2970 | 3140 | 3400 | 19.7 | 18.0 |
| 7_GO | 2920 | 3070 | 3470 | 4.5 | 2.2 |
| 10_GO | 3150 | 3580 | 4.7 | 7.8 | |
| 2_rGO | 2980 | 3120 | 1.3 | — | |
| 4_rGO | 3050 | <0.5 | — | ||
| 8_rGO | 3150 | 3490 | 2.5 | 4.3 |
The spectra in Fig. 8 show the presence of hydroxyls in most of the samples, Table 4. Their presence does not correlate with the type of material. While they would be expected to be present in the GO samples, they are visible in all of the GNP samples except 3_GNP. 8_rGO shows a distinct O–H stretch at 3490 cm−1, a similar size band is hidden in the tail of the C–H stretch mode of 1_GO (see Fig. S6, ESI†). INS spectral intensity is directly related to the number of oscillators and to a reasonable approximation (∼10% or so) the intensity per C–H oscillator is the same as that per O–H oscillator.62 Curve fitting the spectrum of 8_rGO (see Fig. S32, ESI†) shows that the ratio of CH to OH is 4.3![[thin space (1/6-em)]](https://www.rsc.org/images/entities/char_2009.gif) :1. For the GNP samples, the ratio spans the range ∼0 to ∼5, again confirming that the materials are not pure graphene. The quantity of hydroxyls does not correlate with the oxygen content, showing that the oxygen is present in other forms, e.g. carbonyl, ethers or epoxides. This is consistent with the XPS analysis.
:1. For the GNP samples, the ratio spans the range ∼0 to ∼5, again confirming that the materials are not pure graphene. The quantity of hydroxyls does not correlate with the oxygen content, showing that the oxygen is present in other forms, e.g. carbonyl, ethers or epoxides. This is consistent with the XPS analysis.
As noted previously for the GNP samples,18 all of the spectra exhibit features that are characteristic of graphite and that the spectrum of 3_GNP is essentially identical to that of graphite. As before,18 to highlight the spectral features that are not due to graphite, the spectrum of sample 3_GNP was subtracted from each of the other spectra. The results are shown in Fig. S33 (ESI†) for the three classes of material.
By inspection of Fig. S33 (ESI†), it can be seen that the subtracted spectra fall into three categories: for graphene samples, 5-GNP and 9_GNP, graphene oxide sample 7_GO and reduced graphene oxide sample 8_rGO there are only very weak residual features around 850 and 1200 cm−1. Reduced graphene oxide samples 2_rGO and 4_rGO have strong features and the spectra are virtually identical. Samples 1_GO and 10_GO form the third category. 1_GO is somewhat similar to 12_GNP that was studied previously.18Fig. 9 shows the same data as Fig. S33 (ESI†) but here it is grouped by spectral similarity, rather than type of material.
 | ||
| Fig. 9 TOSCA spectra of the 2D carbon samples after subtraction of the graphite contribution (3_GNP) grouped by spectral similarity. Top panel: (a) 8_rGO, (b) 7_GO, (c) 5_GNP and (d) 9_GNP. Middle panel: (e) 2_rGO, (f) 4_rGO and (g) glassy carbon57 (this is not on the same ordinate scale as (e) and (f)). The inset shows H1 and H2 termination. Bottom panel: (h) 12_GNP, (i) 1_GO and (j) 10_GO. Note the different ordinate scales in the panels. | ||
The weak, broad bands of samples 5-GNP, 9_GNP, 7_GO and 8_rGO (top part of Fig. 9) are consistent with the low hydrogen content of these samples. The pattern of bands at ∼850 and 1200 cm−1 with a gap at 1000 cm−1 is typical of a wide variety of carbons including coal,63 activated carbons46 and glassy carbon.57 The lower energy band is assigned to out-of-plane bending modes of sp2 C–H modes and the higher energy mode to the in-plane bending modes. However, the lack of structure in the band centred at ∼850 cm−1 is unusual. Similar spectra have only been seen previously in carbon blacks that had undergone oxidation45 with gaseous NO2. The spectra are also somewhat similar to that of a defective graphene produced by high temperature reduction with H2 of thermally exfoliated graphite oxide.59 Both reactants (NO2 and H2) are likely to attack the edges and any defect sites in the graphene plane, in essence, punching holes or pits in the material, resulting in multiple types of environment. We suggest that the spectra of this group of materials are characteristic of materials with a large number of defects that give rise to correspondingly broad spectra.
The spectra of the reduced graphene oxide samples, 2_rGO and 4_rGO, are strikingly similar to each other. Both materials are made by the same method, Table 1, but are from different suppliers. There is also a marked resemblance to the spectrum of glassy carbon.57Fig. 9g, suggesting a similar structure. The sharp bands show that the edge termination is well-defined and largely consists of isolated C–H groups (H1 termination, peak at 863 cm−1) that are obtained by cleavage along [100] of graphite. The peak at 950 cm−1 and the shoulder at 800 cm−1 are assigned to hydrogen on adjacent carbons (H2 termination) that results from cleavage of graphite along [110] (see the inset in the middle panel that shows H1 and H2 termination). Using the same method as was used previously for glassy carbon.57 we estimate that the ratio of H1:H2 in 2_rGO is ∼3:1 and in 4_rGO is ∼4:1. These are somewhat larger than seen for glassy carbon itself, where the ratio is 2:1. As with glassy carbon, the H1 and H2 terminations occur as distinct domains.
The third group of spectra, Fig. 9 bottom panel, are more difficult to assign. There is some resemblance to the second group, but also some significant differences, particularly in the relative intensities of the in-plane and out-of-plane sp2 C–H modes and the much greater width of the in-plane mode. The spectrum of sample 1_GO is similar to that 12_GNP, which was previously assigned to carboxylic acid groups. The MAPS data in Fig. 9 supports the assignment that the material is distinctly different to 2_rGO and 4_rGO. 2_rGO shows a single peak at 3125 cm−1 consistent with aromatic/olefinic sp2 C–H stretch modes, as noted earlier, 1_GO shows additional modes, including a clear signature for aliphatic sp3 C–H stretch modes at 2970 cm−1. The presence of methyl and/or methylene groups would account for the additional intensity in the 1300–1600 cm−1 region. Curve-fitting the spectrum shows a ratio of sp2 C–H:sp3 C–H of ∼6:1. The absence of a clear O–H stretch mode militates against the presence of a significant number of carboxylic acid groups being present. Assuming the tail at 3400 cm−1 is the O–H stretch, this indicates a maximum ratio of sp2 C–H:O–H of ∼15:1. The two samples with the lowest contribution from the plasmon peak, 12_GNP and 1_GO, are the only samples that show the presence of sp3 C–H.
Sample 10_GO has some similarities to 1_GO and 12_GNP but also some differences: the out-of-plane C–H bending modes are poorly defined, the peak at 565 cm−1 is absent. Computational studies46,57 assign this feature to C–C torsional modes of the carbon atoms at the edges of a graphene plane. The C–H stretch region is unremarkable; there is a single peak at 3145 cm−1. 10_GO is notable in that it has the highest surface area of any of the materials (Table 1). It is relatively highly oxidised, with predominantly C–O functionalities. Together with the absence of the edge modes, we suggest that the oxygen is largely located at the periphery of the GO planes.
Fig. 10 shows the low energy region of all the samples together with that of graphite. The peak at ∼90 cm−1 is assigned to interlayer motion.64 This is present in all the samples, albeit it is very broad in sample 1, and suggests that all the samples are multilayer i.e. not single sheets. It can be seen from Table S3 (ESI†) and Fig. 11 that there is a general correlation between the width of the ∼90 cm−1 INS peak and the (002) X-ray reflection at 26.5°. This is reasonable because both are a measure of the disorder between layers. It is a further indication that the materials are far from the ‘single layer ‘ materials that are needed for widespread application. We note that some of the samples have an additional peak at ∼50 cm−1, this will be discussed in the next section.
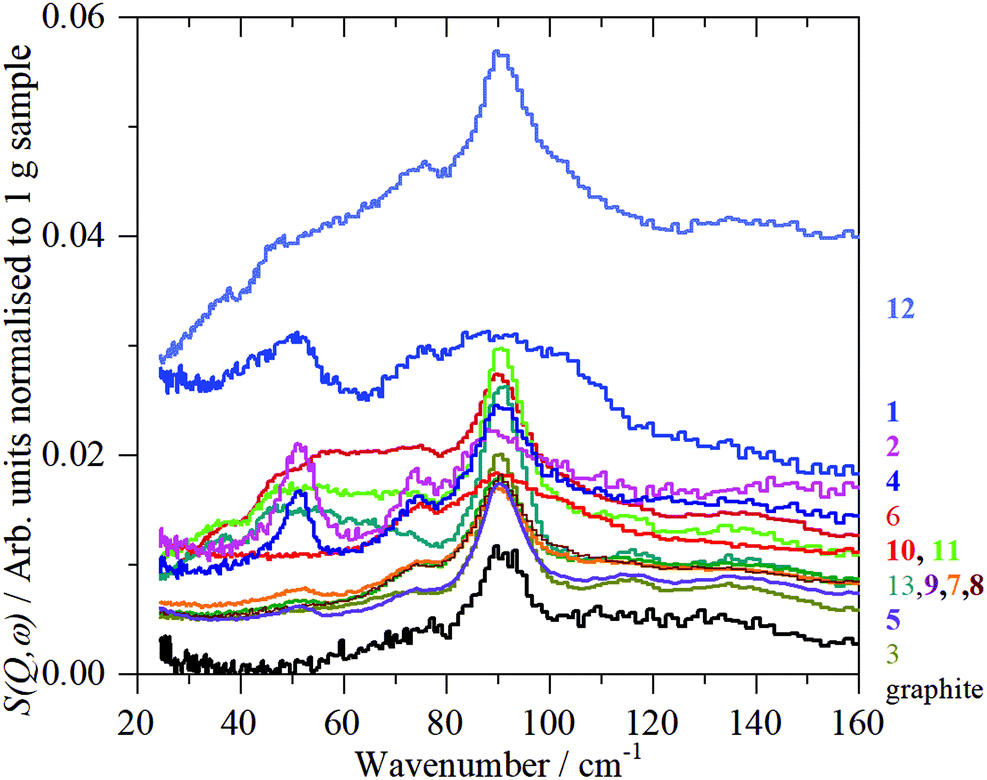 | ||
| Fig. 10 TOSCA INS spectra of all the 2D carbon samples in the low energy region. | ||
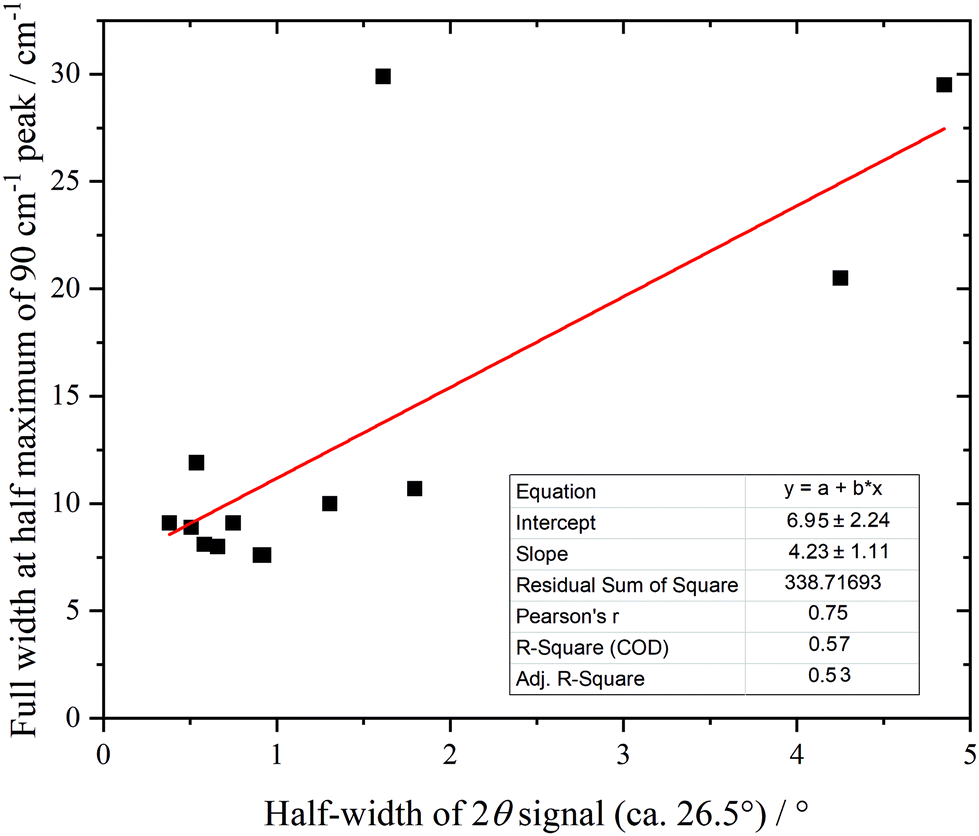 | ||
| Fig. 11 Correlation of 90 cm−1 feature in the INS spectra with the half-width of the XRD peak at 26.5° (002). | ||
Discussion
It is clear from both the work reported here and previously,18 that none of the commercial materials examined are 100% single layer 2D carbon. This is apparent from the TEM studies and the Raman and INS spectroscopy. In all cases, a significant fraction is present as (nano) graphite.However, this does raise the question: “what does the INS spectrum of graphene look like”? While several authors have measured the INS spectra of GNP, GO and rGO, we are unaware of any spectra of pristine material. Sheka and co-workers have extensively studied GO and rGO (reviewed in ref. 65), however, their materials have a significant hydrogen content and the spectral range is limited to 0–1000 cm−1 or so. The dynamics of the dry materials are dominated by the hydrogen and the spectra closely match those shown in Fig. 9e and f. This was also the case for a defective graphene, (actually an rGO).59
In the absence of experimental data, we have calculated the INS spectrum of single-layer graphene and the result is shown in Fig. 12a. Unsurprisingly, above ∼200 cm−1 the spectrum strongly resembles that of graphite (cf.Fig. 8k). This is because the modes of the graphene sheet (250–500 cm−1 C–C–C torsion, 500–900 cm−1 C–C–C in-plane bending, 1300–1700 cm−1 C–C stretch) are the same as the intraplanar modes of graphite. The shape of the features arises from the strong vibrational dispersion (variation of transition energy with wavevector) present that is clearly seen in the dispersion curves, Fig. 12b. The interplanar modes (i.e. motion of the layers along the c direction) of graphite, that give rise to the feature at 90 cm−1, are, of course, absent (the intense feature at ∼12 cm−1 is explained in the ESI†) as is any indication of a mode at 50 cm−1. Accordingly, we provisionally assign the 50 cm−1 feature to the interplanar modes of few-layer graphenes. We acknowledge that this is speculative at present and will be the subject of future work. By comparison of Fig. 12a with the spectra in Fig. 9, it is apparent that none of the samples contain significant quantities of graphene, in complete agreement with the results from the Raman, XRD and TEM data.
 | ||
| Fig. 12 (a) Calculated INS spectrum of single-layer graphene generated from a periodic-DFT calculation and (b) dispersion curves of graphene. | ||
The structure of graphite oxide, and hence graphene oxide, is still controversial.3Fig. 13 shows the two current contenders: that of Lerf and Klinowski66,67 (left) and Dékány and co-workers68 (right). In the Lerf and Klinowski model, the sheets are largely flat with a mixture of sp2 and sp3 carbon atoms and hydrogen is seen to be bonded to both. In the Dékány model, the sheets are rippled because most of the carbon is present as sp3, but with transverse ribbons of quinoid structures. Crucially, (apart from possible defects), hydrogen is only bonded to sp3 carbon. Our results, see Fig. 8e′–g′, clearly show that the majority of the hydrogen bound to carbon is present as sp2 C–H, supporting the Lerf and Klinowski model.
 | ||
| Fig. 13 Structure of graphene oxide as proposed by Lerf and Klinowski66,67 (left) and Dékány and co-workers68 (right). In the Lerf–Klinowski model the presence (top) or absence (bottom) of carboxylic acids on the periphery of the basal plane of the graphitic platelets of GO is ambiguous. Reproduced from ref. 3 with permission of the Royal Society of Chemistry. | ||
Both models show a substantial population of hydroxyls (based on the intense bands seen in the infrared spectra68), however, there is little evidence for any significant quantity of these in our samples. In the INS spectra, the ratio of C–H to O–H is quantitative: the electrical anharmonicity that so strongly accentuates the hydroxyl's intensity in the infrared spectra is irrelevant. From Table 4, it can be seen that, in most cases, there are several times more C–H's present than O–H. While it would be expected that this is the case for the GNP and rGO samples, it can be seen that it is true irrespective of the purported nature of the material. The only sample that shows a significant (relatively) population of hydroxyls is 6_GNP (see Fig. S31, ESI†). It is also apparent that the hydroxyl's that are present are only weakly hydrogen-bonded, as shown by the O–H transition energies being >3200 cm−1, consistent with them being sparse. As we noted earlier, this strongly suggests that most of the oxygen is present as epoxides or carbonyls. This is highlighted by sample 1_GO that shows almost no hydroxyls, despite having a large oxygen content.
The trend induced by chemical changes (GO, rGO) to generate three-dimensional disorder, expansion and separation from two-dimensional ordered graphite and staples/packages of graphene sheets is also evident in the low energy region of the INS spectra recorded on TOSCA (Fig. 10). At the macroscopic scale the width and fine structure of the translational mode of the sheets in graphite (measured on TOSCA in a 100 g piece of commercial graphite) and the various graphenes in the c-direction is broadened and partly split to lower energy from a rather sharp band for pure bulky reference graphite, various GNP's with graphitic stacks of varying packing thickness, sizes and tilt/mismatch down to disordered bent sheets for GO and rGO with decreasing average number of layers (XRD). This interpretation is supported by TEM demonstrating differences down to the nanoscale in the electron micrographs Fig. 2–5.
Conclusions
In this work we have comprehensively characterised 13 products from commercial suppliers that are claimed to be 2D materials. The techniques used have investigated the materials from the macroscale to the atomic scale. The results are consistent across all length scales: none of the products meet the ISO definition of “a single layer of carbon atoms”.8 Rather, they are largely nanographite with a small percentage of single layer material present. This is in agreement with two previous studies of commercial materials16,17 and suggests that the products have not improved over the last few years.The use of INS spectroscopy to examine the materials in the C–H/O–H stretch region without the complications of electrical anharmonicity that bedevil infrared spectroscopy has provided some new insights into the structure of graphite oxide and graphene oxide. The spectra clearly show that most of the hydrogen is present as sp2 C–H; sp3 C–H is either absent or present as a minority species. This provides strong support for the Lerf and Klinowski66,67 model. The spectra also show that the number of hydroxyls present is small, indicating that most of the oxygen is present as epoxides or carbonyls.
Conflicts of interest
There are no conflicts to declare.Acknowledgements
The STFC Rutherford Appleton Laboratory is thanked for access to neutron beam facilities (RB1920447).69 AJRC and YC are supported by the Scientific User Facilities Division, Office of Basic Energy Sciences, US DOE, under Contract No. DE-AC0500OR22725 with UT Battelle, LLC. Computing resources for DFT simulations were made available through the VirtuES and the ICE-MAN projects, funded by Laboratory Directed Research and Development program and Compute and Data Environment for Science (CADES) at ORNL.References
- K. S. Novoselov, V. Falko, L. Colombo, P. R. Gellert, M. G. Schwab and K. Kim, A roadmap for graphene, Nature, 2012, 490, 192–200, DOI:10.1038/nature11458.
- Y. Ma, Y. Zheng and Y. Zhu, Towards industrialization of graphene oxide, Sci. China: Mater., 2020, 63, 1861–1869, DOI:10.1007/s40843-019-9462-9.
- D. R. Dreyer, S. Park, C. W. Bielawski and R. S. Ruoff, The chemistry of graphene oxide, Chem. Soc. Rev., 2010, 39, 228–240, 10.1039/B917103G.
- R. Kumar Singh, R. Kumar and D. P. Singh, Graphene oxide: strategies for synthesis, reduction and frontier applications, RSC Adv., 2016, 6, 64993, 10.1039/C6RA07626B.
- Graphene-Info, https://www.graphene-info.com/huaweis-new-mate-20-x-uses-graphene-film-cooling-technology, accessed November 2021.
- HEAD, https://www.head.com/en/sports/tennis/technology/graphene360plus, accessed November 2021.
- T. Reiss, K. Hjelt and A. C. Ferrari, Graphene is on track to deliver on its promises, Nat. Nanotechnol., 2019, 14, 904–910, DOI:10.1038/s41565-019-0557-0.
- Nanotechnologies – Vocabulary – Part 13: Graphene and Related Two-Dimensional (2D) Materials, PD CEN ISO/TS 80004-13:2020, International Organization for Standardization (ISO), BSI Standards Publication, London, UK, 2017.
- J. Yang, P. Hu and G. Yu, Perspective of graphene-based electronic devices: Graphene synthesis and diverse applications, APL Mater., 2019, 7, 020901, DOI:10.1063/1.5054823.
- D. Neumaier, S. Pindl and M. C. Lemme, Integrating graphene into semiconductor fabrication lines, Nat. Mater., 2019, 18, 520–529, DOI:10.1038/s41563-019-0359-7.
- J. N. Coleman, Liquid exfoliation of defect-free graphene, Acc. Chem. Res., 2013, 46, 14–22, DOI:10.1021/ar300009f.
- L. Lin, H. Peng and Z. Liu, Synthesis challenges for graphene industry, Nat. Mater., 2019, 18, 520–529, DOI:10.1038/s41563-019-0341-4.
- Y. Sun and J. Zhang, Strategies for scalable gas-phase preparation of free-standing graphene, CCS Chem., 2020, 2, 1058–1077, DOI:10.31635/ccschem.020.202000289.
- D. X. Luong, K. V. Bets, W. A. Algozeeb, M. G. Stanford, C. Kittrell, W. Chen, R. V. Salvatierra, M. Ren, E. A. McHugh, P. A. Advincula, Z. Wang, M. Bhatt, H. Guo, V. Mancevski, R. Shahsavari, B. I. Yakobson and J. M. Tour, Gram-scale bottom-up flash graphene synthesis, Nature, 2020, 577, 647–651, DOI:10.1038/s41586-020-1938-0.
- S. Pei and H.-M. Cheng, The reduction of graphene oxide, Carbon, 2012, 50, 3210–3228, DOI:10.1016/j.carbon.2011.11.010.
- A. P. Kauling, A. T. Seefeldt, D. P. Pisoni, R. C. Pradeep, R. Bentini, R. V. B. Oliveira, K. S. Novoselov and A. H. Castro Neto, The worldwide graphene flake production, Adv. Mater., 2018, 30, 1803784, DOI:10.1002/adma.201803784.
- A. Kovtun, E. Treossi, N. Mirotta, A. Scidà, A. Liscio, M. Christian, F. Valorosi, A. Boschi, R. J. Young, C. Galiotis, I. A. Kinloch, V. Morandi and V. Palermo, Benchmarking of graphene-based materials: real commercial products versus ideal graphene, 2D Mater., 2019, 6, 025006, DOI:10.1088/2053-1583/aafc6e.
- S. F. Parker, V. Leich, J. Hönig and P. W. Albers, Investigation of commercial graphenes, ChemistryOpen, 2020, 9, 1060–1064, DOI:10.1002/open.202000234.
- P. C. H. Mitchell, S. F. Parker, A. J. Ramirez-Cuesta and J. Tomkinson, Vibrational spectroscopy with neutrons, with applications in chemistry, biology, materials science and catalysis, World Scientific, Singapore, 2005 Search PubMed.
- U. Holzwarth and N. Gibson, The Scherrer equation versus the “Debye-Scherrer equation”, Nat. Nanotechnol., 2011, 6, 534, DOI:10.1038/nnano.2011.145.
- R. Sharma, N. Chadha and P. Saini, Determination of defect density, crystallite size and number of graphene layers in graphene analogues using X-ray diffraction and Raman spectroscopy, Indian J. Pure Appl. Phys., 2017, 55, 625–629 Search PubMed.
- D. A. Shirley, High-resolution X-ray photoemission spectrum of the valence bands of gold, Phys. Rev. B: Condens. Matter Mater. Phys., 1972, 5, 4709–4714, DOI:10.1103/PhysRevB.5.4709.
- S. F. Parker, F. Fernandez-Alonso, A. J. Ramirez-Cuesta, J. Tomkinson, S. Rudić, R. S. Pinna, G. Gorini and J. Fernández Castañon, Recent and future developments on TOSCA at ISIS, J. Phys.: Conf. Ser., 2014, 554, 012003, DOI:10.1088/1742-6596/554/1/012003.
- R. S. Pinna, M. Zanetti, S. Rudić, S. F. Parker, J. Armstrong, S. P. Waller, D. Zacek, C. A. Smith, S. Harrison, G. Gorini and F. Fernandez-Alonso, The TOSCA spectrometer at ISIS: the guide upgrade and beyond, J. Phys.: Conf. Ser., 2018, 1021, 012029, DOI:10.1088/1742-6596/1021/1/012029.
- S. F. Parker, D. Lennon and P. W. Albers, Vibrational spectroscopy with neutrons – a review of new directions, Appl. Spectrosc., 2011, 65, 1325–1341, DOI:10.1366/11-06456.
- R. A. Ewings, J. R. Stewart, T. G. Perring, R. I. Bewley, M. D. Le, D. Raspino, D. E. Pooley, G. Škoro, S. P. Waller, D. Zacek, C. A. Smith and R. C. Riehl-Shaw, Upgrade to the MAPS neutron time-of-flight chopper spectrometer, Rev. Sci. Instrum., 2019, 90, 035110, DOI:10.1063/1.5086255.
- ISIS Neutron and Muon Source, http://www.isis.stfc.ac.uk/ accessed November 2021.
- G. Kresse and J. Furthmüller, Efficient iterative schemes for ab initio total-energy calculations using a plane-wave basis set, Phys. Rev. B: Condens. Matter Mater. Phys., 1996, 54, 11169–11186, DOI:10.1103/PhysRevB.54.11169.
- P. E. Blöchl, Projector augmented-wave method, Phys. Rev. B: Condens. Matter Mater. Phys., 1994, 50, 17953–17979, DOI:10.1103/PhysRevB.50.17953.
- G. Kresse and D. Joubert, From ultrasoft pseudopotentials to the projector augmented-wave method, Phys. Rev. B: Condens. Matter Mater. Phys., 1999, 59, 1758–1775, DOI:10.1103/PhysRevB.59.1758.
- J. P. Perdew, K. Burke and M. Ernzerhof, Generalized gradient approximation made simple, Phys. Rev. Lett., 1996, 77, 3865–3868, DOI:10.1103/PhysRevLett.77.3865.
- A. Togo and I. Tanaka, First principles phonon calculations in materials science, Scr. Mater., 2015, 108, 1–5, DOI:10.1016/j.scriptamat.2015.07.021.
- Y. Q. Cheng, L. L. Daemen, A. I. Kolesnikov and A. J. Ramirez-Cuesta, Simulation of inelastic neutron scattering spectra using OCLIMAX, J. Chem. Theory Comput., 2019, 15, 1974–1982, DOI:10.1021/acs.jctc.8b01250.
- A. Peigney, Ch Laurent, E. Flahaut, R. R. Bacsa and A. Rousset, Specific surface area of carbon nanotubes and bundles of carbon nanotubes, Carbon, 2001, 39, 507–514, DOI:10.1016/S0008-6223(00)00155-X.
- DIN 53206-1 Testing of pigments; particle size analysis, basic terms, Deutsches Institut für Normung, 1972.
- P. Albers, M. Maier, M. Reisinger, B. Hannebauer and R. Weinand, Physical boundaries within aggregates – Differences between amorphous, para-crystalline, and crystalline structures, Cryst. Res. Technol., 2015, 50, 846–865, DOI:10.1002/crat.201500040.
- International Organization for Standardization, Nanotechnologies – Matrix of properties and measurement techniques for graphene and related two-dimensional (2D) materials, ISO Standard No. ISO/TR 19733:2019, 2019, https://www.iso.org/standard/66188.html accessed November 2021.
- W. M. Hess and C. R. Herd, Microstructure, morphology and general physical properties, in Carbon Black – Science and Technology, ed. J.-B. Donnet, Routledge, London, 2018, ch. 3 Search PubMed.
- E. Koberstein, E. Lakatos and M. Voll, Zur Charakterisierung der Oberflächen von Rußen und hochdispersen Kieselsäuren, Ber. Bunsenges. Phys. Chem, 1971, 75, 1104–1114, DOI:10.1002/bbpc.19710751027.
- P. D. Nellist and G. T. Martinez, Fast pixelated detectors: a new era for STEM, JEOL News, 2018, 53, 2–7 Search PubMed.
- A. Kovtun, D. Jones, S. Dell’Elce, E. Treossi, A. Liscio and V. Palermo, Accurate chemical analysis of oxygenated graphene-based materials using X-ray photoelectron spectroscopy, Carbon, 2019, 143, 268–275, DOI:10.1016/j.carbon.2018.11.012.
- P. Albers, K. Seibold, G. Prescher and H. Müller, XPS/SIMS-Investigations on carbon species observed on catalysts used in the synthesis of hydrogen cyanide and selective hydrogenation of acetylene, Appl. Catal., A, 1999, 176, 135–146, DOI:10.1016/S0926-860X(98)00325-1.
- S. Stankovich, R. D. Piner, X. Chen, N. Wu, S. T. Nguyen and R. S. Ruoff, Stable aqueous dispersions of graphitic nanoplatelets via the reduction of exfoliated graphite oxide in the presence of poly(sodium 4-styrenesulfonate), J. Mater. Chem., 2006, 16, 155–158, 10.1039/B512799H.
- S. V. Tkachev, E. Yu Buslaeva, A. V. Naumkin, S. L. Kotova, I. V. Laure and S. P. Gubin, Reduced graphene oxide, Inorg. Mater., 2012, 48, 796–802, DOI:10.1134/S0020168512080158.
- P. Albers, A. Karl, J. Mathias, D. K. Ross and S. F. Parker, INS-, XPS- and SIMS-Investigations on the controlled post-oxidation of pigment blacks – Identification of different species of strongly adsorbed water, Carbon, 2001, 39, 1663–1676, DOI:10.1016/S0008-6223(00)00294-3.
- P. W. Albers, J. Pietsch, J. Krauter and S. F. Parker, Investigations of activated carbon catalyst supports from different natural resources, Phys. Chem. Chem. Phys., 2003, 5, 1941–1949, 10.1039/B212210N.
- P. W. Albers, J. G. E. Krauter, D. K. Ross, R. G. Heidenreich, K. Köhler and S. F. Parker, Identification of surface states on finely divided supported palladium catalysts by means of inelastic incoherent neutron scattering, Langmuir, 2004, 20, 8254–8260, DOI:10.1021/la040054c.
- X. Li, H. Wang, J. T. Robinson, H. Sanchez, G. Diankov and H. Dai, Simultaneous nitrogen doping and reduction of graphene oxide, J. Am. Chem. Soc., 2009, 131, 15939–15944, DOI:10.1021/ja907098f.
- D. Genga, S. Yang, Y. Zhang, J. Yang, J. Liu, R. Li, T.-K. Sham, X. Sun, S. Ye and S. Knights, Nitrogen doping effects on the structure of graphene, Appl. Surf. Sci., 2011, 257, 9193–9198, DOI:10.1016/j.apsusc.2011.05.131.
- M. S. Dresselhaus, A. Jorio and R. Saito, Characterizing graphene, graphite, and carbon nanotubes by Raman spectroscopy, Annu. Rev. Condens. Matter Phys., 2010, 1, 89–108, DOI:10.1146/annurev-conmatphys-070909-103919.
- F. Tuinstra and J. L. Koenig, Raman spectrum of graphite, J. Chem. Phys., 1970, 53, 1126–1130, DOI:10.1063/1.1674108.
- A. C. Ferrari, J. C. Meyer, V. Scardaci, C. Casiraghi, M. Lazzeri, F. Mauri and A. K. Geim, Raman spectrum of graphene and graphene layers, Phys. Rev. Lett., 2006, 97, 1–4, DOI:10.1103/PhysRevLett.97.187401.
- Y. Hao, Y. Wang, L. Wang, Z. Ni, Z. Wang, R. Wang, C. K. Koo, Z. Shen and J. T. L. Thong, Small, 2010, 6, 195–200, DOI:10.1002/smll.200901173.
- A. Das, B. Chakraborty and A. K. Sood, Raman spectroscopy of graphene on different substrates and influence of defects, Bull. Mater. Sci., 2008, 31, 579–584, DOI:10.1007/s12034-008-0090-5.
- A. C. Ferrari, Raman spectroscopy of graphene and graphite: Disorder, electron–phonon coupling, doping and nonadiabatic effects, Solid State Commun., 2007, 143, 47–57, DOI:10.1016/j.ssc.2007.03.052.
- A. C. Ferrari and M. Basko, Raman spectroscopy as a versatile tool for studying the properties of graphene, Nat. Nanotechnol., 2013, 8, 235–246, DOI:10.1038/nnano.2013.46.
- P. W. Albers, W. Weber, K. Möbus, S. D. Wieland and S. F. Parker, Neutron scattering study of the terminating protons in the basic structural units of non-graphitising and graphitising carbons, Carbon, 2016, 109, 239–245, DOI:10.1016/j.carbon.2016.08.007.
- D. Lin-Vien, N. B. Colthup, W. G. Fateley and J. Grasselli, The handbook of infrared and Raman characteristic frequencies of organic molecules, Academic Press, Boston, USA, 1991 Search PubMed.
- C. Cavallari, D. Pontiroli, M. Jiménez-Ruiz, M. R. Johnson, M. Aramini, M. Gaboardi, S. F. Parker, M. Riccó and S. Rols, Hydrogen motions in defective graphene: the role of surface defects, Phys. Chem. Chem. Phys., 2016, 18, 24820–24824, 10.1039/C6CP04727K.
- H. B. Henbest, G. D. Meakins, B. Nicholls and K. J. Taylor, Detection of the epoxide group by infrared spectroscopy, J. Chem. Soc., 1957, 1459–1462, 10.1039/JR9570001459.
- R. Cataliotti and G. Aliani, Infrared study of the C-H stretching region of five-membered heterocyclic compounds, Can. J. Chem., 1976, 54, 2451–2457, DOI:10.1139/v76-348.
- I. P. Silverwood, N. G. Hamilton, C. J. Laycock, J. Z. Staniforth, R. M. Ormerod, C. D. Frost, S. F. Parker and D. Lennon, Quantification of surface species present on a nickel/alumina methane reforming catalyst, Phys. Chem. Chem. Phys., 2010, 12, 3102–3107, 10.1039/b919977b.
- F. Fillaux, R. Papoular, A. Lautié and J. Tomkinson, Inelastic neutron-scattering study of the proton dynamics in coals, Fuel, 1995, 74, 865–873, DOI:10.1016/0016-2361(95)00017-Y.
- D. K. Ross, Inelastic neutron scattering from polycrystalline graphite at temperatures up to 1920 °C, J. Phys. C: Solid State Phys., 1973, 6, 3525–3535, DOI:10.1088/0022-3719/6/24/013.
- E. F. Sheka and I. Natkaniec, Neutron scattering of parent and reduced graphene oxides, Rev. Adv. Mater. Sci., 2017, 49, 1–27 CAS.
- A. Lerf, H. He, M. Forster and J. Klinowski, Structure of graphite oxide revisited, J. Phys. Chem. B, 1998, 102, 4477–4482, DOI:10.1021/jp9731821.
- H. He, J. Klinowski, M. Forster and A. Lerf, A new structural model for graphite oxide, Chem. Phys. Lett., 1998, 287, 53–56, DOI:10.1016/S0009-2614(98)00144-4.
- T. Szabo, O. Berkesi, P. Forgo, K. Josepovits, Y. Sanakis, D. Petridis and I. Dekany, Evolution of surface functional groups in a series of progressively oxidized graphite oxides, Chem. Mater., 2006, 18, 2740–2749, DOI:10.1021/cm060258+.
- P. W. Albers and S. F. Parker, Proton dynamics of graphenes of different hydrogen content, STFC ISIS Neutron and Muon Source, 2019 DOI:10.5286/ISIS.E.RB1920447, (accessed November 2021).
Footnote |
| † Electronic supplementary information (ESI) available. See DOI: 10.1039/d1ma01023a |
| This journal is © The Royal Society of Chemistry 2022 |