 Open Access Article
Edge-on lamellar crystallization of oligo(3-methoxythiophene) in polyester matrix films and a gold tone development thereof†
Rihito
Tamura
,
Katsuma
Miyamoto
,
Satoru
Tsukada
 and
Katsuyoshi
Hoshino
 *
*
Department of Materials Science, Graduate School of Engineering, Chiba University, 1-33 Yayoi-cho, Inage-ku, Chiba 263-8522, Japan. E-mail: k_hoshino@faculty.chiba-u.jp
First published on 19th February 2022
Abstract
A recently developed anion-doped 3-methoxythiophene oligomer was demonstrated to form edge-on lamellar crystallites in its drop-cast films. These films exhibit a stable gold-like lustrous color owing to the specific optical properties of the lamellar crystallites. Based on this previous result, we wished to investigate whether edge-on lamellar crystallites are formed in the blend films of the oligomer and conventional transparent resins, and whether or not a gold tone gloss develops. Thus, we herein investigated blend films of the oligomer and polyester. The specular reflectance, chromaticity, X-ray diffraction patterns, and optical constants revealed that the thiophene oligomer formed edge-on lamellar crystallites even in the blend films, and a gold tone color was produced due to the large optical constants of the crystallites. More in-depth analyses showed that the thiophene oligomer was localized in the direction of the film thickness, particularly at the film surface and at the interface with the substrate. This unique distribution was responsible for the hue and electrical conductivity of the film. These results showed that edge-on lamellar crystallites, which are the structures responsible for the gold tone color, were formed even in the presence of foreign polymers. Moreover, paints and inks suitable for practical use were obtained, which provided films with a high scratch strength.
1. Introduction
Metallic luster colors or metallic colors are deeply rooted in society, culture, and religion, and often symbolize luxury and nobility. Metallic luster paints contain metal effect pigments, and are used widely in decoration, including automobiles and buildings, as well as in cosmetic products. The growing awareness of global environmental issues and increasing importance of security have promoted the use of the metals for their unique reflective properties in energy conservation and forgery prevention applications. Specifically, the coating of automobiles and buildings with metallic luster paints can reflect sunlight to reduce cooling costs. Thus, metallic luster paints may be considered as ecological coating paints.1,2 Further, glossy images are difficult to copy, and metallic luster paints are often used as anti-counterfeit coating materials for bank notes and cash vouchers.Metallic gold is extremely expensive, thus conventional gold-like luster paints comprise metal effect pigments, namely fine powders of flaky aluminum or zinc dispersed in a binder resin solution containing yellow colorant. Metal effect pigments tend to settle due to their high specific gravity, thus constant stirring of the paint is required during its storage. However, stirring may deform the flakes and change the chromaticity of the corresponding coating films. Additionally, the coating films are generally heavy because of the metal content. Further, the metal-effect pigments may be susceptible to corrosion and subsequent changes in the chromaticity and luster.1
Nonmetallic materials have been investigated to impart a metallic luster while overcoming the above issues of the metal effect pigments.3–15 Ogura et al. reported that pyrrole derivative crystals exhibited gold-, copper-, red-, and green-like lusters,3–8 while further organic compounds with a gold-like9,10 or green-like luster11,12 have been synthesized. Further, electropolymerized bithiophene films formed in a liquid crystal matrix have been reported to exhibit gold, silver and bronze colors when exposed to white light from a diagonal direction while changing the potential applied to the polymerized film.13
The current authors developed a gold-like luster film based on the high-molecular-weight oligomer oligo(3-methoxythiophene) (O3MeOT) obtained via chemical polymerization of 3-methoxythiophene.14 O3MeOT is soluble in several polar solvents and can be used to produce a gold-like luster coating with good film-forming properties and excellent aging stability on various substrates, including glass plate, polyethylene terephthalate film, and metal plate. O3MeOT is an oligomer consisting of an average of ten 3-methoxythiophene units bonded at the 2,5 positions, and elemental analysis has revealed 30% anion doping. Structural analyses of the coating solution and the coating film were subsequently conducted, which suggested that the gold-like luster of the coating film was attributed to the large optical constant of the edge-on lamellar crystallites formed via self-organization of O3MeOT.16,17 Further, electropolymerization of 3-methoxythiophene was found to produce an electropolymerized film with a gold-like luster, as well as luster color electrochromism.15
O3MeOT may be the first reported nonmetallic lustrous material that can be used as an alternative to metallic materials, and shows promise in ink-jet printer ink, as well as paints. O3MeOT is dissolved in molecular form in the coating solution, thereby avoiding the ink ejecting nozzle clogging issues associated with traditional metal effect pigments. The use of the oligomer inks in ink-jet printers would allow for the production of gold-colored images, as well as organic electronic materials. However, the oligomer has a lower degree of polymerization compared to polymers, leading to a film with a lower scratch hardness, which is an issue for practical implementation. This study aimed to investigate whether O3MeOT can be blended with a commercial polyester resin to produce a mechanically strong film with a gold-like luster. The results reveal that the polymer blend exhibits the formation of lamellar oligomer crystallites in the films, resulting in a gold-like luster. Further, the scratch hardness is improved sufficiently for practical use.
2. Experimental
2.1. Materials
3-Methoxythiophene (>98%) was purchased from FUJIFILM Wako Pure Chemical. Polyester (PES; trade name: Vylon220®; average molecular weight = 3.0 × 10³)18 was kindly provided by TOYOBO Co., Ltd. Fe(ClO4)3·nH2O (anhydride content = 70.7%; FUJIFILM Wako Pure Chemical) was used as the oxidizing agent for the polymerization of 3-methoxythiophene. Acetonitrile (>99.7%; Kanto Chemical Co., Inc.) and γ-butyrolactone (GBL; >99.0%; Sigma-Aldrich Co.) were used as supplied.2.2. Preparation of oligo(3-methoxythiophene)
Oligo(3-methoxythiophene) doped with ClO4− (O3MeOT) was prepared according to a previously reported procedure.14 Briefly, acetonitrile solution of Fe(ClO4)3 (0.2 M; 20 mL) was added to a stirred acetonitrile solution of 3-methoxythiophene (0.1 M; 20 mL) under a nitrogen atmosphere at 22 °C. The transparent solution rapidly changed to dark blue, and was stirred for 2 h. The dark blue precipitate was isolated via suction filtration, washed five times with methanol, and dried under vacuum for 90 min at 50 °C. The resulting O3MeOT powder exhibited a partial gold luster. The weight based yield was 96 wt%, and the average molecular weight of 1.14 × 10³ indicated ten degrees of polymerization.19 Electron dispersive X-ray (EDX; JEOL, JSM-6510A) analysis revealed a doping level of 25%, which was defined as the number of ClO4− per 3-methoxythiophene unit.2.3. Preparation of polymer blend coating solutions and films
PES (0.010, 0.040, 0.080, or 0.24 g) was added to GBL (1.0 g) and completely dissolved via stirring or sonication, after which O3MeOT (0.010 g) was added while stirring to produce coating solutions with PES/O3MeOT weight ratios of 1![[thin space (1/6-em)]](https://www.rsc.org/images/entities/char_2009.gif) :
:![[thin space (1/6-em)]](https://www.rsc.org/images/entities/char_2009.gif) 1, 4
1, 4![[thin space (1/6-em)]](https://www.rsc.org/images/entities/char_2009.gif) :
:![[thin space (1/6-em)]](https://www.rsc.org/images/entities/char_2009.gif) 1, 8
1, 8![[thin space (1/6-em)]](https://www.rsc.org/images/entities/char_2009.gif) :
:![[thin space (1/6-em)]](https://www.rsc.org/images/entities/char_2009.gif) 1, and 24
1, and 24![[thin space (1/6-em)]](https://www.rsc.org/images/entities/char_2009.gif) :
:![[thin space (1/6-em)]](https://www.rsc.org/images/entities/char_2009.gif) 1. The reason why we used GBL is because it is a good solvent for both PES and O3MeOT. A glass plate (15 × 26 mm; Matsunami Glass Ind., S1225) was cleaned via sonication in acetone for 10 min. Films were prepared by drop-casting the coating solutions (100 μL) on the glass plate using a micropipette (Nichipet EXII, Nichiryo) and drying them in a hot air dryer (DN64, Yamato Scientific Co., Ltd) for 6 h at 80 °C. The coating films were compared to a metallic gold film (thickness = 100 nm) on a glass plate, which was applied via vacuum evaporation (VPC-260F, ULVAC). A film with no added PES (Film 0) and film of pure PES were also produced using GBL for comparison.
1. The reason why we used GBL is because it is a good solvent for both PES and O3MeOT. A glass plate (15 × 26 mm; Matsunami Glass Ind., S1225) was cleaned via sonication in acetone for 10 min. Films were prepared by drop-casting the coating solutions (100 μL) on the glass plate using a micropipette (Nichipet EXII, Nichiryo) and drying them in a hot air dryer (DN64, Yamato Scientific Co., Ltd) for 6 h at 80 °C. The coating films were compared to a metallic gold film (thickness = 100 nm) on a glass plate, which was applied via vacuum evaporation (VPC-260F, ULVAC). A film with no added PES (Film 0) and film of pure PES were also produced using GBL for comparison.
2.4. Characterization of polymer blend films
Ultraviolet-visible (UV-vis) specular reflection and diffuse reflection spectra were obtained using a Konica Minolta CM-600d spectrometer with incident and reflection angles of 8° from the vertical position. The spectra were recorded at room temperature with a white calibration plate (CM-A177, Konica Minolta) as the reference material. The color of the film was evaluated based on CIELab values acquired using the same spectrophotometer with D65 illuminant at an observation angle of 10° (CIE 1964 Standard Observer), where parameters included L* for lightness (black-white), a* for redness-greenness, and b* for yellowness-blueness. The film surface was evaluated using an optical microscope (VHX-5000, KEYENCE), while the film thickness (t) and root mean square surface roughness (Rq) were measured using a laser microscope (VK-9700, KEYENCE). The sheet resistance (Rs) of films was determined using a resistivity meter (Hiresta-UX MCP-HT800, Mitsubishi Chemical Analytech), which included a URSS probe comprising ring and disk electrodes with a concentric ring geometry (Fig. S1 in the ESI†).The resistance was determined at a 10 V bias voltage applied between the two electrodes, which was converted to electric conductivity (σ) based on the relationship σ = Rs−1t−1. Linear regression analysis of the electric conductivity data was conducted using OriginPro 2020 software (OriginLab Corp, Northampton, MA, USA). Out-of-plane X-ray diffraction (XRD) measurements were performed using a diffractometer (X’Pert MRD, PANalytical) equipped with a CuKα source in the 2θ scan mode at a fixed incident angle of 1.0°. The optical constants of the films were measured using a variable-angle spectroscopic elipsometer (alpha-SE, J. A. Woollam Co.) in the range 380 to 900 nm, where the incidence angle was changed from 65° to 75° within an accuracy of 0.01°. The ellipsometric data were fitted using J. A. Woolam Complete EASE software. The cross-sectional morphology was evaluated using a scanning electron microscope (SEM; ULTRA 55, Carl Zeiss), where cross-sectional samples were prepared via ion-polishing and coating of the sample surface with a vacuum-evaporated aluminum layer. The depth-directional distribution of elements was determined using energy dispersive X-ray spectroscopy (EDX; X-MaxN, Oxford Instruments) paired with SEM (JSM-7800F, JEOL). X-ray photoelectron spectroscopy (XPS) was performed using a photoelectron spectrometer (JPS-9030, JEOL), where the absolute binding energy scale was determined by setting the C 1s signal to 284.6 eV.
The hardness of films was measured according to the JIS-K5600-5-4 standard20 using a pencil hardness tester (BEVS 1301/750, Allgood Co. Ltd), where pencil lead of various hardness grades (Hi-uni 9B–9H, Mitsubishi Pencil Co., Ltd) was used as the scratch stylus. A 750 ± 10 g load was applied to the film, and the hardest pencil grade that did not damage the film was taken as the pencil hardness of the film.
3. Results and discussion
3.1. External appearance of polymer blend films
Digital microscope images of the blend films produced on the glass plates are shown in Fig. 1, where the PES/O3MeOT mass ratios were 1![[thin space (1/6-em)]](https://www.rsc.org/images/entities/char_2009.gif) :
:![[thin space (1/6-em)]](https://www.rsc.org/images/entities/char_2009.gif) 1 (Film 1), 4
1 (Film 1), 4![[thin space (1/6-em)]](https://www.rsc.org/images/entities/char_2009.gif) :
:![[thin space (1/6-em)]](https://www.rsc.org/images/entities/char_2009.gif) 1 (Film 4), 8
1 (Film 4), 8![[thin space (1/6-em)]](https://www.rsc.org/images/entities/char_2009.gif) :
:![[thin space (1/6-em)]](https://www.rsc.org/images/entities/char_2009.gif) 1 (Film 8), and 24
1 (Film 8), and 24![[thin space (1/6-em)]](https://www.rsc.org/images/entities/char_2009.gif) :
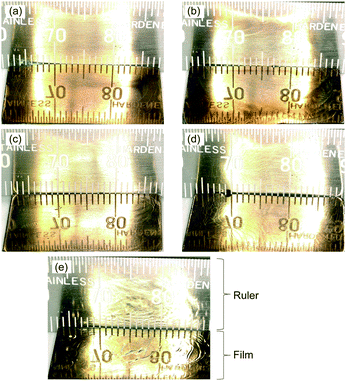
:![[thin space (1/6-em)]](https://www.rsc.org/images/entities/char_2009.gif) 1 (Film 24). These films were compared to a pure O3MeOT film with no PES (Film 0). For the formation of pure O3MeOT films so far, nitromethane and acetonitrile were used as coating solvents.14,16,17 The film produced with nitromethane (boiling point, Tb = 374 K) exhibited a gold-like luster and mirroring surface when dried in air for ∼10 min after drop-casting, while the film produced using acetonitrile (Tb = 355 K) had a dull brown luster after several minutes of drying. However, rubbing of the acetonitrile film surface transformed the appearance to a gold-like luster. In the case of the preparation of a pure O3MeOT film in this study, the coating solvent utilized, GBL, required a long drying time due to its high boiling point (Tb = 475 K), but a gold-like luster with a mirroring surface was finally produced after extended air drying for 120 h. Film 0, prepared by drying for 6 h in a hot air dryer after drop-casting (see Section 2.3), also exhibited a gold-like luster (Fig. 1e). The expression of the gold-like luster of these films can be attributed to the formation of edge-on lamellar crystallites in the films, thus indicating that edge-on lamellar crystallites are formed even when GBL is used as a solvent. Lamellar crystallites have been previously reported in poly(3-alkylthiophene) coating films,21–23 and it has been further suggested that crystallinity increases with longer solvent evaporation time during post-coating drying.24–26 Thus, the very slow GBL evaporation facilitated lamellar crystallite growth to a sufficient level of maturity (see Section 3.6).
1 (Film 24). These films were compared to a pure O3MeOT film with no PES (Film 0). For the formation of pure O3MeOT films so far, nitromethane and acetonitrile were used as coating solvents.14,16,17 The film produced with nitromethane (boiling point, Tb = 374 K) exhibited a gold-like luster and mirroring surface when dried in air for ∼10 min after drop-casting, while the film produced using acetonitrile (Tb = 355 K) had a dull brown luster after several minutes of drying. However, rubbing of the acetonitrile film surface transformed the appearance to a gold-like luster. In the case of the preparation of a pure O3MeOT film in this study, the coating solvent utilized, GBL, required a long drying time due to its high boiling point (Tb = 475 K), but a gold-like luster with a mirroring surface was finally produced after extended air drying for 120 h. Film 0, prepared by drying for 6 h in a hot air dryer after drop-casting (see Section 2.3), also exhibited a gold-like luster (Fig. 1e). The expression of the gold-like luster of these films can be attributed to the formation of edge-on lamellar crystallites in the films, thus indicating that edge-on lamellar crystallites are formed even when GBL is used as a solvent. Lamellar crystallites have been previously reported in poly(3-alkylthiophene) coating films,21–23 and it has been further suggested that crystallinity increases with longer solvent evaporation time during post-coating drying.24–26 Thus, the very slow GBL evaporation facilitated lamellar crystallite growth to a sufficient level of maturity (see Section 3.6).
The polymer blend films exhibited a similar gold-like luster despite the presence of PES in the film (Fig. 1a–d). The scale of a ruler placed next to the film was visibly reflected, thereby demonstrating the high luster of the films. Although it was difficult to discern in the microscopic images, the reflectivity gradually decreased with increasing PES content, with the exception of Film 24. This was attributed to the formation of small cracks on the film during GBL evaporation in the hot air dryer due to differences in the elasticity of O3MeOT and PES, thereby reducing the smoothness of the film. Indeed, the Rq values of Films 0, 1, 4, and 8 were 0.027, 0.046, 0.070, and 0.078 μm, respectively, while the value of an uncoated glass plate was 0.025 μm. Thus, roughness tended to increase with increasing PES content. No small cracks were formed when the same films were dried naturally in air after coating. Further, the high PES content of Film 24 led to formation of a polymer gel that did not form any small cracks.
3.2. Reflection spectra
The reflection spectra of the films were used to quantitatively evaluate the luster properties (Fig. 2), where Films 1, 4, 8, 24 and 0 were compared to a metallic gold film. The diffuse reflection spectrum of each film was subtracted from its total reflection spectrum to calculate specular reflection. The intensity of the specular reflection spectra (Fig. 2A) was significantly higher than the diffuse reflection spectra (Fig. 2B), indicating that a mirroring surface similar to the vacuum-evaporated gold film surface was produced in Films 1, 4, 8, 24 and 0. The intensity of the specular reflection spectrum of Film 0 increased with increasing wavelength from ∼480 nm, which was almost identical to the spectral behavior of the vacuum-evaporated gold film. Specifically, the reflection of Film 0 was mostly attributed to the yellow (570–590 nm), orange (590–620 nm) and red (620–750 nm) regions, with a slight green reflection (495–570 nm). Reflection in these wavelength regions was similar to the reflection characteristics of the vacuum-evaporated gold film. Consequently, the appearance of Film 0 was characterized by a gold hue. The specular reflection of the polymer blend films was lower in the yellow, orange, and red color regions (>570 nm) compared to Film 0, which was accompanied by increased reflectance in the green, blue, and purple color regions (<570 nm). Thus, instead of the red gold chromaticity of Film 0, the polymer blend films exhibited a slight white/blue gold color.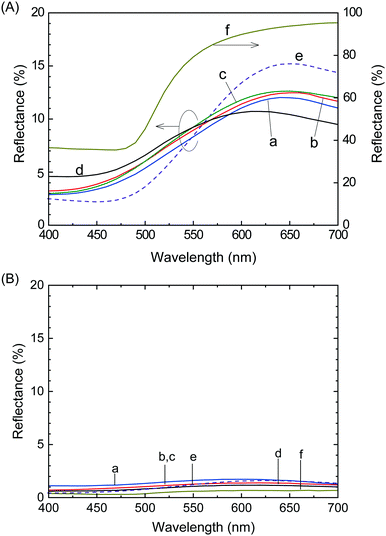 | ||
| Fig. 2 (A) Specular and (B) diffuse reflection spectra of (a) Film 1, (b) Film 4, (c) Film 8, (d) Film 24, (e) Film 0, and (f) the vacuum-evaporated gold film. | ||
3.3. Optical constants measurements by ellipsometry
The optical constants (refractive index and extinction coefficient) were measured in the visible light range to investigate the difference in reflection behavior between Film 0 and the polymer blend films. The refractive index (n) and extinction (κ) spectra of polymer blend films, Film 0, and the PES film are given in Fig. 3. The polymer blend films exhibited higher n-values than Film 0 at wavelengths below 600 nm, as well as lower κ-values above ∼600 nm. The specular reflectance (R) of perpendicular incident light on the film surface is described using n and κ as follows:12 | (1) |
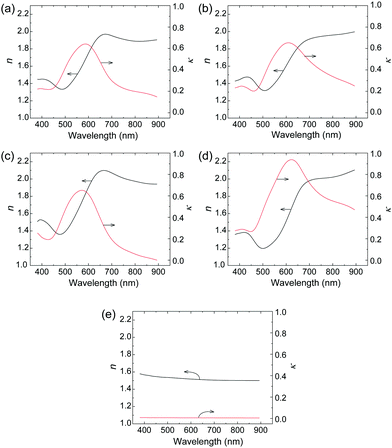 | ||
| Fig. 3 Wavelength dependences of optical constants n (black) and κ (red) of (a) Film 1, (b) Film 4, (c) Film 8, (d) Film 0, and (e) the PES film (t = 60 μm). | ||
This equation shows that the magnitude and wavelength dependence of n and κ determine the reflectance and chromaticity of the film, where R increases with increasing n and κ. Thus, the higher n values of the polymer blend films led to higher R values than Film 0 below 570 nm (Fig. 2A). Further, the polymer blend films exhibited lower R values above 570 nm due to the lower κ values. In the present ellipsometry analysis, the reflection from the interface between the film and the glass substrate was ignored. This is based on the assumption that no light reaches the glass-substrate/film interface due to the extremely large values of κ in the blend films and in Film 0. This assumption was validated by the similarity in the measured R values and R values calculated by substituting the n and κ values of the polymer blend films and Film 0 into eqn (1) (Fig. 4). Thus, the R values were almost entirely determined by the n and κ values, implying that diffuse reflection makes almost no contribution. This, in turn, indicates that the Rq value for each film is low enough to prevent diffuse reflection, as evidenced by the very low diffuse reflectance of each film (Fig. 2B).
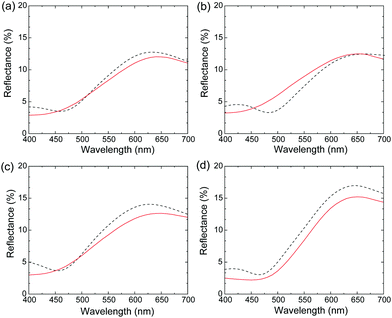 | ||
| Fig. 4 Calculated (red) and measured (black) specular reflection spectra for (a) Film 1, (b) Film 4, (c) Film 8, and (d) Film 0. | ||
3.4. Color measurements
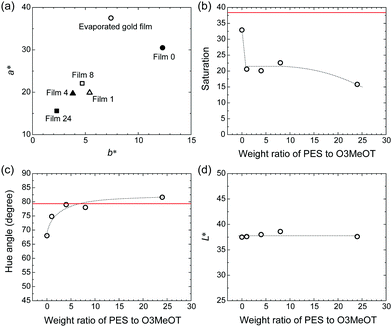
Spectral colorimetry was used to quantitatively evaluate the reflected color of the polymer blend films, where the vacuum-evaporated gold film was used as a reference. The a*, b* chromaticity diagrams (Fig. 5a), as well as the weight ratio (PES:O3MeOT) dependence of saturation, hue angle, and L* were determined (Fig. 5b–d). The chromaticity of Film 0 (a* = 12.3, b* = 30.5) was most similar to the vacuum-evaporated gold film (a* = 7.42, b* = 37.5), while the chromaticity values of the blend films were plotted closer to the origin (Fig. 5a). For this reason, the saturation of the blend films was less than those of the metallic gold film (red line) and Film 0 (Fig. 5b). The hue angle, defined by tan−1(b*/a*), of Film 0 was smaller than that of the metallic gold film (Fig. 5c), thus it exhibited a slightly reddish gold color. However, the hue angles of the blend films were almost identical to the metallic gold film, and so they exhibited a gold hue. The polymer blend films and Film 0 exhibited very similar lightness (L* ≃ 40) (Fig. 5d), which was lower than that of the metallic gold film (L* ≃ 80). These colorimetric results show that the O3MeOT film (Film 0) changes its hue to almost the same level as the metallic gold film by blending with PES, though the change is accompanied by a reduction in saturation. This is due to the fact that blending with PES caused an increase in the value of n in the green visible light region and a decrease in the value of κ in the red visible light region of the O3MeOT film, as described in Section 3.3. These changes in the optical constants caused an increase in the green component and a decrease in the red component of the specular reflection, thereby adjusted the hue of the polymer blend films closer to that of metallic gold films.3.5. Structural properties of films
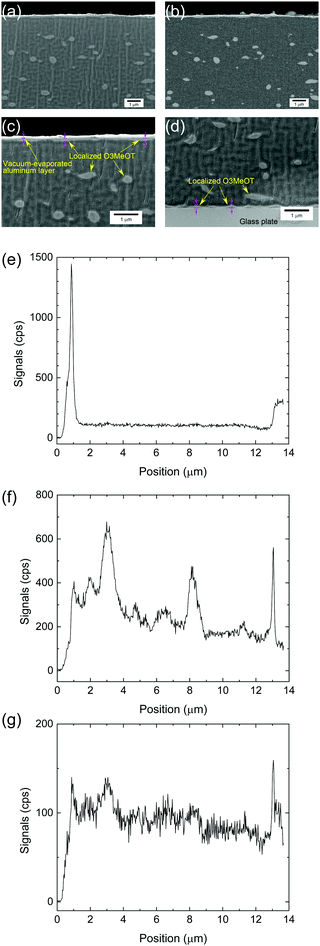
The secondary and backscattered electron images obtained via SEM analysis of Film 4 are given in Fig. 6a and b, respectively. The images exhibited a relatively uniform distribution of discrete light areas within the dark areas. The light areas were elliptical in shape with an average length along the long axis of 380 nm. The composition of these areas was determined using EDX, where the elemental composition and positional relationship of Al, S and Cl were determined via line analysis along the film thickness of Film 4 (Fig. 6e–g). The Al profile (Fig. 6e) indicated that the film surface was positioned at 1.2 μm, while the film/glass plate interface was detected at 13 μm. Further, elemental S (Fig. 6f) attributed the thiophene ring and Cl (Fig. 6g) attributed the dopant were observed within positions spatially corresponding to the light areas in the secondary electron image (Fig. 6a). As the various profiles were related to the same phase, it was confirmed that the light areas comprised O3MeOT. Although it is not possible to determine whether S and Cl are distributed in the dark area due to background noise, the electrical conductivity measurements in Section 3.8 show that O3MeOT is also present in the dark area, thereby indicating that the dark area comprises a mixture of PES and O3MeOT. The S and Cl content was higher on the film surface and at the film/glass plate interface, indicating that O3MeOT was localized both on the film surface and at the interface (Fig. 6f and g). Therefore, magnified images of the film surface (Fig. 6c) and interface (Fig. 6d) were acquired, revealing an intermittent layer structure characterized by bright contrast, which was attributed to O3MeOT. EDX mapping for S also supported this localization (see Fig. S2 in the ESI†).To obtain further information regarding this layered structure, XPS analysis, which enables us to analyze elements on the surface of the structure, was performed. The XPS spectra of the S 2p region of the polymer blend film surface exhibited a peak at ∼164 eV, which was attributed to the neutral thiophene units (Fig. 7a).27–29 A high binding component appeared as a shoulder signal shifted by ∼1 eV from this peak, and was attributed to oxidized sulfur species in the doped thiophene units. Signals above 168 eV were related to shake-up satellite structures.27 Comparing the signal intensities around 164 eV, the intensity ratios for Films 1, 4, 8, and 24 were 0.50, 0.38, 0.37, and 0.37, respectively, when the intensity of Film 0 was set to 1. The signal intensity ratio for Film 1 was equal to its blend weight ratio of 0.50, while the signal intensity ratios of the other polymer blend films were higher than their blend weight ratios, namely 0.20, 0.11, and 0.04 for Films 4, 8, and 24, respectively. A similar trend was observed in the XPS spectra of the Cl 2p region (Fig. 7b), where the relative signal intensity of the 207.5 eV peak in Film 0 was 1, and dropped to 0.63, 0.39, 0.34 and 0.36 in Films 1, 4, 8 and 24, respectively. Thus, the signal intensity ratios for all of the blend films were higher than their respective blend weight ratios. These results confirmed that O3MeOT was localized on the surface of the blend films, where the degree of localization (signal intensity ratio/blend weight ratio) at the surface increased as the blend weight ratio of O3MeOT was reduced. The same localization was assumed to have occurred at the film/glass plate interface from the above EDX analysis, although XPS analysis of this interface was not possible due to the strong adhesion between the film surface and glass plate that prevented removal. Instead, a blend film of O3MeOT and PES (TOYOBO Co., Ltd, trade name: Vylon200®)18 was produced, which allowed the cast film to be peeled from the glass plate for SEM-EDX and XPS analyses. In this free-standing film, O3MeOT was found to be concentrated on the film surface and at the interface with the glass plate (see Fig. S3 and S4 in the ESI†).
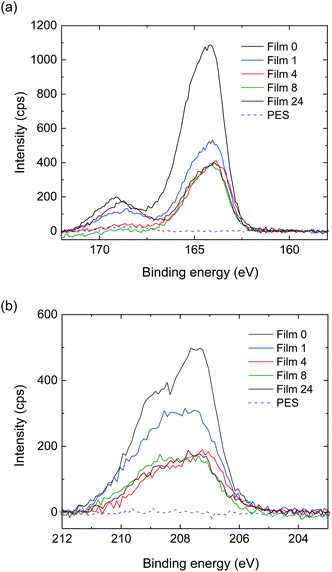 | ||
| Fig. 7 XPS spectra in the (a) S 2p and (b) Cl 2p regions for Films 1, 4, 8, 24 and 0. The spectra of the PES film are also shown as a reference. | ||
The mixed system of O3MeOT and PES is likely a blend of two components with very different surface free energies, and the low surface free energy component, i.e., O3MeOT, is enriched on the surface or at the interface to produce a blend film with the specific structure described above.30 This hypothesis should be validated based on further surface free energy measurements of O3MeOT and PES.
3.6. Alignment structures in blend films
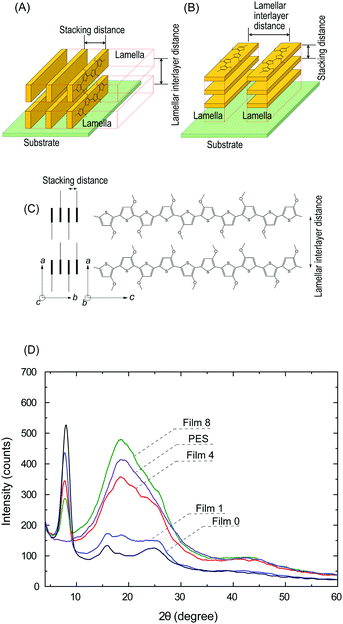
A previous study reported an O3MeOT film (Film N) formed by applying coating solution to a glass plate with nitromethane as a solvent, where XRD analysis was conducted.14,16,17,31 This film exhibited edge-on lamella (Fig. 8A) with the thiophene rings oriented perpendicular to the substrate, as well as face-on lamella (Fig. 8B) with the thiophene rings oriented parallel to the substrate. Overall, a higher content of the edge-on lamella was reported, and the intense luster of the film was presumed to be due to the large refractive index and extinction coefficient of the edge-on lamella. The refractive index spectrum and extinction spectrum of Film 0 (Fig. 3d) were characterized by a similar intensity and shape as Film N,15 indicating that edge-on lamellar crystallites are also the dominant structure in Film 0.The polymer blend films also exhibited a gold-like luster, indicating that O3MeOT formed edge-on lamellar crystallites within the PES matrix. Therefore, the orientation of O3MeOT was verified based on XRD measurements of the polymer blend films. Polyalkylthiophene is generally considered a quasi-crystal comprising a crystalline area surrounded by an amorphous area,32 where the crystalline area consists of orthorhombic unit cells with lattice parameters a, b and c (Fig. 8C). The XRD patterns of Film N in the previous study were characterized by peaks at 2θ = 7.84, 15.84 and 25.11°. The peaks at 2θ = 7.84 and 15.84° were attributed to reflections from the crystallographic (100) and (200) planes, respectively, thereby confirming the layer lamellar structure of the films (Fig. 8A). The primary reflection at 2θ = 7.84° was used to calculate a lamellar interlayer distance of 1.13 nm. Further, the peak at 2θ = 25.11° corresponded to the (020) plane, which was associated with π–π stacking of the O3MeOT chains at a stacking distance of 0.35 nm. XRD measurements were acquired in the out-of-plane mode, and were thus sensitive to lattice parameters in the film thickness direction. Thus, the signals at 2θ = 7.84 and 15.84° indicated the presence of edge-on lamellar crystallites (Fig. 8A), while the signal at 2θ = 25.11° was attributed to face-on lamellar crystallites (Fig. 8B).
The XRD patterns of the polymer blend films, Film 0, and PES film are given in Fig. 8D. Film 0 exhibited peaks at 2θ = 7.87, 15.85 and 24.83°, which was almost identical to the XRD pattern of Film N. Specifically, the peak at 2θ = 7.87° was dominant. These results demonstrated that the use of GBL as the coating solvent led to the formation of a film with the same crystal structure as Film N. The same three peaks appeared as either peaks or shoulders in the XRD patterns of the polymer blend films. Further, a peak at 2θ = 18.55° was observed in the XRD pattern of the PES film, which was attributed to reflection by the crystalline regions of PES.33 Overall, the XRD results confirmed that lamellar structures were formed within the film, even in the presence of PES. Careful examination of the XRD patterns show that the reflections from the (100) plane of the blend film (2θ = 7.64°) and from the (020) plane (2θ = ∼26°) are different from the corresponding values of Film 0 (i.e., 2θ = 7.87° and 24.83°). This indicates that the interlayer distance of the edge-on lamellar crystallite is slightly extended and the stacking distance of the face-on lamellar crystallite is slightly reduced due to the interaction with PES.
The signal intensity ratio of the polymer blend films at 2θ = 7.64° decreased relative to the PES signal at 2θ = 18.55° as the PES blend weight ratio increased. The penetration distance of X-rays into the film was estimated using a previously reported method34 (Supplementary note “Calculation of penetration depth of X-ray” in the ESI†). For simplicity, the penetration depth of CuKα rays into Film 0 was calculated as 3.5 μm and taken as the penetration depth for the polymer blend films. This distance is shorter than the thickness of all of the films. Further, the O3MeOT content of all of the films was almost equal because the amount of coating material used to produce the film was kept constant. Thus, the XRD measurements conducted in this study under these conditions were related to the quantity of O3MeOT crystallites up to 3.5 μm from the film surface. If O3MeOT were evenly distributed throughout the film, the signal intensity ratio at 2θ = 7.64° was expected to be 1, 0.74, 0.30 and 0.11 for Films 0, 1, 4, and 8, respectively. For example, Film 4 had a film thickness of 11.7 μm, thus the relative signal intensity ratio should be 1 × 3.5 μm/11.7 μm = 0.30. However, the signal intensity ratios estimated from the XRD results were 1, 0.75, 0.47 and 0.29, respectively (Fig. 8D). Thus, the O3MeOT content up to a depth of 3.5 μm from the film surface was higher than the blend weight ratio, as observed in the XPS analysis (Section 3.5).
The density of the O3MeOT crystallite was calculated from the lattice parameters obtained from the XRD measurements, where a = 1.12 nm, b = 0.72 nm and c = 3.8 nm gave a calculated density value of 1.54 g cm−3. The c value was calculated based on a previously reported distance between thiophene units,35,36 as well as a degree of O3MeOT polymerization of ten (Section 2.2 and ref. 19). This density was significantly larger than that of rand-poly(3-methylthiophene) (measured = 1.33 g cm−3),37 poly(3-butylthiophene) (calculated = 1.24 g cm−3; measured = 1.18),38 poly(3-hexylthiophene) (calculated = 1.12; measured = 1.10 g cm−3),22 and poly(3-octylthiophene) (calculated = 1.06; measured = 1.02 g cm−3).22 The large packing density of the O3MeOT crystallites led to the large n and κ values (Section 3.3), thereby facilitating the film's good luster.
3.7. Pencil hardness test
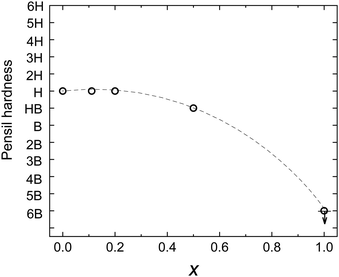
The pencil hardness test was conducted to evaluate the mechanical strength of the polymer blend films. The relationship between the weight ratio (x) of O3MeOT in the films and the pencil hardness is illustrated in Fig. 9, where x = 0 and 1.0 corresponded to the pure PES film and Film 0, respectively. Film 24 had gel-like surface properties and could not be measured. Film 0 could not withstand a pencil of any hardness. However, the addition of PES increased the hardness of the polymer blend films. The hardness gradually increased with increasing PES content until a pencil hardness of H was achieved, which was the pencil hardness for the pure PES film. These results indicate that the pencil hardness of the blended film is almost equal to the hardness of the resin when the percentage of resin by weight is ≥80%, and as a result, a practical strength can be achieved.3.8. Electric conductivity
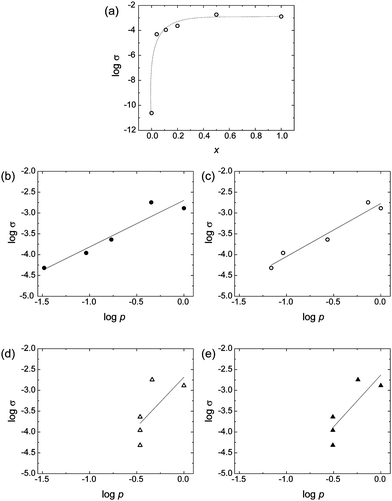
Considering that O3MeOT is classified as a conducting polymer, and taking into account the unique distribution of O3MeOT within the polymer blend films, the electric conductive properties of the blend films are particularly interesting. Thus, the electric conductivities of the blend films were measured. Fig. 10a shows the relationship between the logarithm of electrical conductivity (σ) and x. The electrical conductivity increased rapidly when x increased from 0 to 0.1, after which the increase was more gradual. This behavior was similar to that of conductive filler particles dispersed in an insulating matrix. In these cases, the electrical conductivity is often expressed according to eqn (2), using the volume fraction (p) of conductive filler particles:39,40| σ = σ0(p − pc)t (p ≥ pc) | (2) |
![[thin space (1/6-em)]](https://www.rsc.org/images/entities/char_2009.gif) σ and log p of O3MeOT in the O3MeOT/PES blend films is illustrated in Fig. 10b, where p was deduced from x using eqn (3):41
σ and log p of O3MeOT in the O3MeOT/PES blend films is illustrated in Fig. 10b, where p was deduced from x using eqn (3):41 | (3) |
Therefore, we subsequently performed an analysis based on the blend ratios up to a depth of 3.5 μm from the film surface, as determined by the XRD measurements described in Section 3.6. These blend ratios were substituted into eqn (3) to calculate the values of p (Fig. 10c). The R2 value of the regression equation increased to 0.948, confirming the importance of considering the variation in O3MeOT distribution throughout the film due to O3MeOT localization to the film surface.
Furthermore, we performed an analysis based on the film surface blend ratios, as determined from the XPS measurements. More specifically, the blend ratios at the film surface determined from the XPS signal intensity ratios for S 2p and Cl 2p in Section 3.5 were substituted into eqn (3) to calculate the p values (Fig. 10d and e). The R2 values of the regression equations were 0.501 and 0.700, respectively, which was significantly lower than the R2 values deduced from the previous two models. This indicated that the electrical conductivity of the films cannot be accurately evaluated based solely on O3MeOT localization in the immediate vicinity of the film surface.
Cross-sectional SEM-EDX analysis of Film 4 revealed that O3MeOT existed as a relatively large aggregate (Fig. 6). In addition, the above electrical conductivity measurements suggested that O3MeOT is also present between the aggregates, because the relatively high σ-value of Film 4 would not have been possible if only PES occupied the spaces between the large aggregates. Therefore, it can be inferred that O3MeOT molecules also exist between the aggregates in a form that cannot be detected by SEM observations, acting as carrier hopping sites and forming conductive pathways.
4. Conclusions
Thiophene oligomer/polyester blends were developed to produce paints and coating films with a gold-like color without the addition of metal-effect pigments. The thiophene oligomer has been recently developed,14,16,17 but films thereof are associated with scratch hardness issues that must be addressed for industrial implementation. The proposed polymer blends show promise for overcoming these issues, where their coating films exhibited pencil hardness comparable to polyester.More importantly, the thiophene oligomer exhibited interesting crystallization behavior in the polyester matrix, where very dense lamellar crystallites were formed. This high density led to high optical constants, thereby facilitating high reflectance. The thiophene oligomer crystallites were distributed discretely throughout the film in the thickness direction. In the bulk of the film, the crystallites were scattered with an elliptical morphology, while on the film surface and at the film/base interface, they were present as a continuous layer, which had an impact on the electrical conductivity of the film. Various prediction models were calculated using the percolation model for evaluating the electrical conductivity of the films. The best estimation of electrical conductivity was based on the average blend ratio up to a depth of ∼3.5 μm from the film surface. This method produced more precise results compared to approximation of the thiophene oligomer homogeneous distribution based on the blend ratio, as well as based on the blend ratio in the immediate vicinity of the film surface.
The specific hue, optical properties, morphological properties, electrical properties, and wavelength dependency of the refractive index and extinction spectra of the thiophene oligomer/polyester blend films demonstrated the promise for application in paints and ink, as well as in organic electronic and optoelectronic systems. The properties of these films are expected to vary depending on the polymer to be blended with the thiophene oligomer. Coating solutions and coating films using other polymers are currently under development, confirming that the optical, morphological and electrical properties of these films vary significantly with the type of polymer. These findings will be reported in detail in the near future.
Author contributions
Rihito Tamura: investigation and writing; Katsuma Miyamoto: investigation and data curation; Satoru Tsukada: validation and writing—review and editing; Katsuyoshi Hoshino: supervision, conceptualization, writing, reviewing, editing, funding acquisition and project administration.Conflicts of interest
There are no conflicts to declare.Acknowledgements
This work was financially supported by the JSPS KAKENHI (Grant 20K05614 to K. H.). The authors thank the Center for Analytical Instrumentation of Chiba University for the XRD and ellipsometric measurements.Notes and references
- F. J. Maile, G. Pfaff and P. Reynders, Prog. Org. Coat., 2005, 54, 150–163 CrossRef CAS.
- H. Liu, H. Ye and Y. Zhang, Colloids Surf., A, 2008, 315, 1–6 CrossRef CAS.
- K. Ogura, R. Zhao, H. Yanai, K. Maeda, R. Tozawa, S. Matsumoto and M. Akazome, Bull. Chem. Soc. Jpn., 2002, 75, 2359–2370 CrossRef CAS.
- R. Zhao, M. Akazome, S. Matsumoto and K. Ogura, Tetrahedron, 2002, 2, 10225–10231 CrossRef.
- R. Zhao, S. Matsumoto, M. Akazome and K. Ogura, Tetrahedron, 2002, 58, 10233–10241 CrossRef CAS.
- K. Ogura, R. Zhao, M. Jiang, M. Akazome, S. Matsumoto and K. Yamaguchi, Tetrahedron Lett., 2003, 44, 3595–3598 CrossRef CAS.
- K. Ogura, R. Zhao, T. Mizuoka, M. Akazome and S. Matsumoto, Org. Biomol. Chem., 2003, 1, 3845–3850 RSC.
- K. Ogura, K. Ooshima, M. Akazome and S. Matsumoto, Tetrahedron, 2006, 62, 2484–2491 CrossRef CAS.
- A. Matsumoto, M. Kawaharazuka, Y. Takahashi, N. Yoshino, T. Kawai and Y. Kondo, J. Oleo Sci., 2010, 59, 151–156 CrossRef CAS PubMed.
- K. Kondo, A. Matsumoto, K. Fukuyasu, K. Nakajima and Y. Takahashi, Langmuir, 2014, 30, 4422–4426 CrossRef PubMed.
- M. Kukino, J. Kuwabara, K. Matsuishi, T. Fukuda and T. Kanbara, Chem. Lett., 2010, 39, 1248–1250 CrossRef CAS.
- H. Yamada, M. Kukino, Z.-A. Wang, R. Miyabara, N. Fujimoto, J. Kuwabara, K. Matsuishi and T. Kanbara, J. Appl. Polym. Sci., 2015, 132, 41275 CrossRef.
- H. Goto, J. Polym. Sci. Pol. Chem., 2013, 51, 3097–3102 CrossRef CAS.
- R. Tagawa, H. Masu, T. Itoh and K. Hoshino, RSC Adv., 2014, 4, 24053–24058 RSC.
- T. Tokuda and K. Hoshino, Polym. J., 2016, 48, 1141–1149 CrossRef CAS.
- Y. Takashina, T. Mitogawa, K. Saito and K. Hoshino, Langmuir, 2018, 34, 3049–3057 CrossRef CAS PubMed.
- Y. Takashina and K. Hoshino, Polym. J., 2019, 51, 591–599 CrossRef CAS.
- https://www.toyobo-global.com/seihin/xi/vylon_es/fra_vylon_cg/fra_vylon_cg.htm (accessed October 7, 2021).
- M. Tachiki, R. Tagawa and K. Hoshino, ACS Omega, 2020, 5, 24379–24388 CrossRef CAS PubMed.
- K. Arai, T. Mizutani, M. Miyamoto, Y. Kimura and T. Aoki, Prog. Org. Coat., 2019, 128, 11–20 CrossRef CAS.
- M. J. Winokur, P. Wamsley, J. Moulton, P. Smith and A. J. Heeger, Macromolecules, 1991, 24, 3812–3815 CrossRef CAS.
- T. J. Prosa, M. J. Winokur, J. Moulton, P. Smith and A. J. Heeger, Macromolecules, 1992, 25, 4364–4372 CrossRef CAS.
- R. D. McCullough, S. Tristram-Nagle, S. P. Williams, R. D. Lowe and M. Jayaraman, J. Am. Chem. Soc., 1993, 115, 4910–4911 CrossRef CAS.
- J.-F. Chang, B. Sun, D. W. Breiby, M. N. Nielsen, T. I. Sölling, M. Giles, I. McCulloch and H. Sirringhaus, Chem. Mater., 2004, 16, 4772–4776 CrossRef CAS.
- D. H. Kim, Y. D. Park, Y. Jang, S. Kim and K. Cho, Macromol. Rapid Commun., 2005, 26, 834–839 CrossRef CAS.
- H. Yang, S. W. LeFevre and C. Y. Ryu, Appl. Phys. Lett., 2007, 90, 172116 CrossRef.
- E. T. Kang, K. G. Neoh and K. L. Tan, Phys.Phys. Rev. B-Condens Matter, 1991, 44, 10461–10469 CrossRef CAS PubMed.
- M. Mumtaz, E. Cloutet, C. Labrugere, G. Hadziioannou and H. Cramail, Polym. Chem., 2013, 4, 615–622 RSC.
- A. El Guerraf, S. Ben Jadi, M. Bouabdallaoui, Z. Aouzal, M. Bazzaoui, J. Aubard, G. Lévi and E. A. Bazzaoui, Mater. Today: Proc., 2020, 22, 73–77 CAS.
- R. A. L. Jones, E. J. Kramer, M. H. Rafailovich, J. Sokolov and S. A. Schwarz, Phys. Rev. Lett., 1989, 62, 280–283 CrossRef CAS PubMed.
- D. Takamura and K. Hoshino, Chem. Lett., 2018, 47, 540–543 CrossRef CAS.
- J. Abad, N. Espinosa, P. Ferrer, R. García-Valverde, C. Miguel, J. Padilla, A. Alcolea, G. R. Castro, J. Colchero and A. Urbina, Sol. Energy Mater. Sol. Cells, 2012, 97, 109–118 CrossRef CAS.
- A. A. Farag, A. S. Ismail and M. A. Migahed, J. Mol. Liq., 2015, 211, 915–923 CrossRef CAS.
- D. C. Creagh and J. H. Hubbell, in International Tables for Crystallography, ed. E. Prince, Wiiley, Chichester, 2011, vol. C, ch. 4.2.4, pp. 220–229 Search PubMed.
- B. Grévin, P. Rannou, R. Payerne, A. Pron and J. P. Travers, J. Chem. Phys., 2003, 118, 7097–7102 CrossRef.
- H. Kasai, H. Tanaka, S. Okada and H. Oikawa, Chem. Lett., 2002, 31, 696–697 CrossRef.
- T. Yamamoto, D. Komarudin, M. Arai, B.-L. Lee, H. Suganuma, N. Asakawa, Y. Inoue, K. Kubota, S. Sasaki, T. Fukuda and H. Matsuda, J. Am. Chem. Soc., 1998, 120, 2047–2058 CrossRef CAS.
- P. Arosio, M. Moreno, A. Famulari, G. Raos, M. Catellani and S. V. Meille, Chem. Mater., 2009, 21, 78–87 CrossRef CAS.
- A. Lonjon, L. Laffont, P. Demont, E. Dantras and C. Lacabanne, J. Phys. Chem. C, 2009, 113, 12002–12006 CrossRef CAS.
- T. Nagai, N. Aoki, Y. Ochiai and K. Hoshino, ACS Appl. Mater. Interfaces, 2011, 3, 2341–2348 CrossRef CAS PubMed.
- A. K. Kota, B. H. Cipriano, M. K. Duesterberg, A. L. Gershon, D. Powell, S. R. Raghavan and H. A. Bruck, Macromolecules, 2007, 40, 7400–7406 CrossRef CAS.
- M. H. Al-Saleh and U. Sundararaj, Composites, Part A, 2008, 39, 284–293 CrossRef.
- C.-H. Cui, H. Pang, D.-X. Yan, L.-C. Jia, X. Jiang, J. Lei and Z.-M. Li, RSC Adv., 2015, 5, 61318–61323 RSC.
- M. A. Hossain, H. H. Ngo and W. Guo, J. Water Sustainability, 2013, 3, 223–237 CAS.
Footnote |
| † Electronic supplementary information (ESI) available: Calculation of penetration depth of X-ray; electric conductivity measurement system; elemental mapping analysis based on SEM; EDX and XPS analyses of an O3MeOT/polyester(Vylon200) blend film. See DOI: 10.1039/d1ma00994j |
| This journal is © The Royal Society of Chemistry 2022 |

