 Open Access Article
Green synthesis of a CuO/rGO nanocomposite using a Terminalia arjuna bark extract and its catalytic activity for the purification of water†
Vanita
Kumari
,
Sandeep
Kaushal
 * and
Prit Pal
Singh
 *
*
Department of Chemistry, Sri Guru Granth Sahib World University, Fatehgarh Sahib, Punjab, India. E-mail: kaushalsandeep33@gmail.com; dhillonps2003@gmail.com; Fax: +91-1763-234236; Tel: +91-7009795652 Tel: +91-8427000415
First published on 11th January 2022
Abstract
In the present study, biogenic synthesis of a CuO/rGO nanocomposite was carried out successfully using Terminalia arjuna bark extract. Various analytical methods such as UV-vis, PL, FTIR, XRD, FESEM, EDS, HRTEM and XPS were used for the characterization of the synthesized CuO/rGO nanocomposites. Furthermore, the as-prepared nanocomposite samples were efficaciously utilized for selective removal of Bi3+ and Cd2+ ions from aqueous solution. Prior to adsorption investigations, the contact time, initial metal ion concentration, pH, and amount of adsorbent were all tuned. The removal effectiveness of one of the nanocomposites, CG-V for Bi3+ and Cd2+ ions from the aqueous system was determined to be 98% and 91%, respectively. The maximum adsorption capacity of the nanocomposite for Bi3+ and Cd2+ was found to be 138.8 and 112.4 mg g−1, respectively. The photocatalytic studies revealed that 98% of eriochrome black T (EBT) and 90% of methyl orange (MO) dye were degraded in 80 and 100 min, respectively. Adsorption isotherm analysis and kinetic investigations were also carried out to determine the mechanism and adsorption kinetics which followed pseudo second order. This research is expected to provide insights into the biogenic synthesis of nanocomposites and their applications in environmental remediation.
Introduction
In recent decades, human well-being and the environment have been enormously compromised by toxins like heavy metal ions and organic pollutants.1 Several industries such as leather, paint, textile, etc. are responsible for the presence of these non-biodegradable pollutants in the environment which adversely affect human health and wildlife.2 Heavy metal ions are one of the major contaminants in industrial effluents which pollute freshwater and marine life. Among these heavy metal ions, Bi3+ and Cd2+ ions are widely used in various fields including pharmaceutical industries as antacids, antiseptics, anti-ulcers, pesticides and fertilizers.3,4 The long-term consumption of food and water contaminated with these metal ions may lead to serious health issues as they may damage different organs and interrupt other activities by complexing with ligands of amino acids. Thus, the advancement of new methodologies for the selective removal of Bi3+ and Cd2+ ions at the sub-micro levels is a vital issue. For this purpose, adsorption on suitable adsorbents is a modest and economical technique and is one of the superior methods as compared to other conventional methods.The widespread use of different toxic components by various factories pollutes water and has an impact on the ecosystem. Organic dyes are perhaps the most common source of water pollution, and they originate from a variety of industries such as textiles, paper, and plastics.5 Due to their xenobiotic characteristics, toxicity, complex chemical structure and carcinogenic nature, removal of these dyes from sewage water before their release into the ecosystem is extremely desired. Eriochrome black T (EBT) and methyl orange (MO) have found extensive use in several activities, e.g. dying of silk, cotton, wool etc. These dyes have adverse effects on human well-being6,7 and thus, precise elimination of these dyes by using simple and fast methods is of prime significance. For this purpose, photocatalytic degradation is one of the amazing approaches that acquired significant consideration, due to its great efficacy and low energy requirement.8–10
With exceptional physical and chemical properties, GO has been extensively used in catalysis,11 adsorption,12 photocatalysis,13 energy storage,14 solar cells15etc. GO disperses easily in water due to hydrophilic reactive oxygen functional groups on its surface. The presence of these groups on the GO or rGO surface offers numerous avenues such as high solubility and formation of a complex with metal ions such as hydrated copper oxide, iron oxide, aluminium oxide etc. In the recent past, GO surface has been modified with a huge range of metals, oxides of metals, semiconducting materials and other nanoparticles that include Pd,16 Pt,17 Au,18 TiO2,19 Fe3O420 and many more. This mixing significantly improves the ability of these new hybrid materials to perform special tasks in numerous applications such as catalysis, super-capacitors, electrocatalysts etc.21,22 These hybrid nanocomposites often display improved properties and enhanced functionalities, owing to synergistic effects between GO nanosheets and nanoparticles.23
Copper oxide (CuO) is economical and eco-friendly in comparison to other costlier metals or their oxide nanoparticles. It is a versatile semiconductor with a narrow band gap, having an appropriate energy level position and thus, is more frequently used in various applications.24–26 Recently, Wang et al. fabricated an rGO–Cu composite with a multi-layered structure and explored its enhanced features such as tensile strength, hardness, and electrical conductivity.27 The application of graphene–copper and graphene–copper oxide nanocomposites in gas sensors,28 lithium-ion batteries,29 biosensors,30 supercapacitors31 and medical field has already been reported in the literature.
Keeping this in view, CuO/rGO nanocomposites have been synthesized with different concentrations of CuO using the Terminalia arjuna bark extract as a reductant cum stabilizer. Terminalia arjuna commonly known as Arjuna is a member of the Combretaceae family and is medicinally important because of its antibacterial, antioxidant, antidiarrheal and cytotoxic properties.32 The presence of flavonoids, glycosides, triterpenoids, arjunic acid, arjunetin etc. was confirmed by preliminary phytochemical analysis of the crude extract. Biomolecules such as proteins, phenols, and flavonoids were found to have an essential function not only in reducing ions to nano-size but also in capping NPs.33 Owing to these fascinating properties, Terminalia arjuna has been treated as a suitable plant for the green synthesis of monomers and their composites.34 In the present study, the synthesized nanocomposite was employed for the removal of Bi3+ and Cd2+ ions by selective adsorption among other hazardous heavy metal ions, and for degrading organic dyes, eriochrome black T (EBT) and methyl orange (MO) photocatalytically from wastewaters. The proposed research, as far as we know, comprises novel photocatalysts for organic dye degradation and adsorption of heavy metal ions, simultaneously.
Experimental
Materials and methods
Graphite powder (Qualikems lab, India), hydrogen peroxide (H2O2, 30%) (Loba Chemie, India), potassium permanganate (KMnO4) (Loba Chemie, India), copper nitrate (Cu(NO3)2) (Loba Chemie, India) and other reagents were of analytical grade. Deionized (DI) water was employed for preparing different solutions. Arjuna bark was procured from market (Fatehgarh Sahib, Punjab, India).Preparation of the bark extract
The powdered Arjuna bark (10 g) was washed properly with deionized water to remove dirt, if any. It was then added to DI water (100 mL) taken in a round bottom flask and refluxed for about 5 h with constant stirring at 100 °C. The obtained extract was filtered to remove fibrous impurities and stored at around 4 °C for further use.35Synthesis of reduced graphene oxide (rGO)
Graphene oxide (GO) was prepared from graphite powder using modified Hummer's method.36 The as-prepared GO was used for the synthesis of rGO. Initially, DI water (100 mL) was mixed with 50 mg of this prepared GO, followed by sonication for 40 min. Subsequently, 30 mL of bark extract was added dropwise to this suspension with continuous sonication. Thereafter, the mixture was refluxed for about 24 h at 95 °C. The resulting product was then centrifuged at 3000 rpm, followed by washing with DI water and ethanol, and dried in air.37Synthesis of CuO nanoparticles (CuO NPs)
Cu(NO3)2 solution (100 mL of 0.1 M) was prepared in DI water and sonicated for 10 min. This flask was then mounted in an oil bath at ∼85 °C with magnetic stirring for 3 h, and the bark extract was added dropwise into this solution. The bark extract contains a variety of plant secondary metabolites such as triterpenoids, saponins, tannins, flavonoids and other compounds. Among different phyto-constituents, flavonoids displayed strong reducing action. On addition of the extract, color of the mixture changed from blue to pale green and then to brick red. At this point, addition of the bark extract was discontinued. This solution was heated further for 1 h for complete reduction. The resulting mixture was centrifuged for 15 min and the supernatant liquid was then disposed of. The obtained powdered CuO NPs were dried overnight in an electric oven at about 80 °C.Synthesis of the CuO/rGO nanocomposite
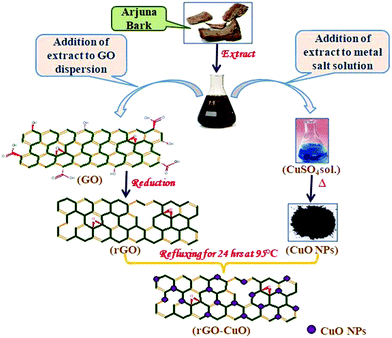
CuO/rGO(CG) was prepared by a sol–gel technique. 100 mL of rGO suspension was prepared in DI water by sonication for about 30 min. CuO nanoparticles were then added to this suspension in varying ratios viz. CG-I (0.00![[thin space (1/6-em)]](https://www.rsc.org/images/entities/char_2009.gif) :
:![[thin space (1/6-em)]](https://www.rsc.org/images/entities/char_2009.gif) 1.00), CG-II (1.00
1.00), CG-II (1.00![[thin space (1/6-em)]](https://www.rsc.org/images/entities/char_2009.gif) :
:![[thin space (1/6-em)]](https://www.rsc.org/images/entities/char_2009.gif) 0.00), CG-III (0.25
0.00), CG-III (0.25![[thin space (1/6-em)]](https://www.rsc.org/images/entities/char_2009.gif) :
:![[thin space (1/6-em)]](https://www.rsc.org/images/entities/char_2009.gif) 1.00), CG-IV (0.50
1.00), CG-IV (0.50![[thin space (1/6-em)]](https://www.rsc.org/images/entities/char_2009.gif) :
:![[thin space (1/6-em)]](https://www.rsc.org/images/entities/char_2009.gif) 1.00), CG-V (0.75
1.00), CG-V (0.75![[thin space (1/6-em)]](https://www.rsc.org/images/entities/char_2009.gif) :
:![[thin space (1/6-em)]](https://www.rsc.org/images/entities/char_2009.gif) 1.00), and CG-VI (1.00
1.00), and CG-VI (1.00![[thin space (1/6-em)]](https://www.rsc.org/images/entities/char_2009.gif) :
:![[thin space (1/6-em)]](https://www.rsc.org/images/entities/char_2009.gif) 1.00), respectively, and sonicated for 1 h. The mixture was then mounted on a reflux condenser and stirred magnetically overnight at ∼95 °C. The resulting product was finally centrifuged, followed by washing with distilled water and ethanol, and dried. The plausible mechanism for the synthesis of CuO/rGO nanocomposite is given below (Scheme 1):
1.00), respectively, and sonicated for 1 h. The mixture was then mounted on a reflux condenser and stirred magnetically overnight at ∼95 °C. The resulting product was finally centrifuged, followed by washing with distilled water and ethanol, and dried. The plausible mechanism for the synthesis of CuO/rGO nanocomposite is given below (Scheme 1):
Characterization
Fourier transform infrared (FTIR) spectra were recorded on a Perkin Elmer RX1 FTIR spectrometer. A field emission scanning electron microscope (FESEM, Carl Zeiss Supra 55) and a high-resolution transmission electron microscope (HRTEM, Jeol Jem 2100 plus) were utilized to visualize the morphology of CuO/rGO nanocomposite. A UV-visible spectrophotometer (Model. UV-2600, SHIMADZU copp 01197) was utilized for recording UV-vis absorption spectra of the nanocomposite. The X-ray diffraction pattern was obtained using an X-ray diffractometer (PAN analytical, system no. DY 3190) having a Cu-target (λ = 1.54 Å) at 2θ = 10–70° to explore the structure of the nanocomposite. The elemental composition of the nanocomposite was determined using X-ray photoelectron spectroscopy (Thermo Fischer Scientific Escalab Xi+). Energy dispersive X-ray spectroscopy was employed for elemental and chemical analysis of the samples (EDX, Oxford). A spectrofluorometer (HORIBA Fluoromax plus CP-011) was used to obtain the photoluminescence (PL) spectra at ambient temperature. An atomic absorption spectrometer (ShimadzuAA300C, Japan) was used to estimate heavy metal ions in wastewater.Sorption experiment (Kd)
A batch process was used to study the distribution coefficients of various metal ions (Ni2+, Hg2+, Cd2+, Bi3+, Cr3+, As3+, Pd2+, Ba2+, Zn2+, Fe3+, La3+, Sn2+, and Mn2+) on the CuO/rGO nanocomposite. In this process, 40 mL of 0.01 M solutions of different metal ions were prepared by stirring for ∼1 h. Out of these stock solutions, 20 mL of each metal ion solution was taken separately, and stirred for ∼1–2 h after adding 0.05 g of the nanocomposite in each one of them. These mixtures were kept overnight at room temperature to establish equilibrium. Each solution was titrated against 0.01 M EDTA solution to estimate the concentration of metal ions; before and after equilibrium. The distribution coefficient was calculated using the following formula:38where I is the initial concentration, F is the final concentration of metal ion solution, V is the volume of aqueous solution (mL) and M represents the mass (g) of the nanocomposite.
Adsorption experiments
A batch adsorption process was used for exploring the consequences of various criteria such as dosage of adsorbent, time of contact and pH effect on adsorption. Bi3+ ion solution (50 mL) was taken in a beaker (at room temperature), followed by addition of 30 mg CuO/rGO nanocomposite. This procedure was carried out on a magnetic shaker. The influence of pH on adsorption was investigated by adjusting the pH of solution from 2 to 10 with 0.1 M HCl or NaOH. Aliquots of solution were withdrawn at regular intervals and the concentration of Bi3+ ions was estimated using an atomic absorption spectrophotometer (AAS). The adsorption capacity, qe (mg g−1) was calculated using the following equation:where C0 and Ce denote the initial and equilibrium metal ion concentrations (mmol), V is the solution volume (L) and w is the mass of adsorbent (g).
Assessment of photocatalytic performance
The degradation behavior of the prepared nanocomposite was investigated for photodegradation (at pH = 7) of dye pollutants i.e. EBT and MO from wastewater. The photocatalytic behavior was examined using a UV-vis spectrophotometer. In this regard, 20 mg nanocomposite was introduced to 50 mL solutions (1 × 10⁻⁴ M) of each of the pollutants taken separately in a beaker. These mixtures were then magnetically agitated in dark for 30 min at ambient temperature to attain adsorption–desorption equilibrium among the molecules of the pollutant and CuO/rGO catalyst. Thereafter, these solutions were exposed to UV radiations and aliquots of samples were collected after regular intervals, centrifuged for about 10 min and filtered. The absorbance measurements using a spectrophotometer were used for calculating the pollutant concentration. The degradation efficiency of the nanocomposite for the pollutants was calculated as follows:where Ce and Ct denote the pollutant concentrations at equilibrium and at time t, respectively.
Results and discussion
Characterization of the synthesized CuO/rGO nanocomposite
A variety of sophisticated techniques like FTIR, XRD, UV-Vis, FESEM, HRTEM and XPS were used to characterize the as-prepared CuO NPs, rGO and CuO/rGO nanocomposite samples.Fig. S1(a) (ESI†) provides the UV-vis spectral data of the synthesized CuO NPs, rGO and CG-V (0.75![[thin space (1/6-em)]](https://www.rsc.org/images/entities/char_2009.gif) :
:![[thin space (1/6-em)]](https://www.rsc.org/images/entities/char_2009.gif) 1.00) nanocomposite. A broad absorption spectrum of CuO is located at 275 nm which is due to the inter-band transition.39 The absorption peak was discovered for rGO at 270 nm that might be attributed to the graphitic C–C ring's π–π* transition and also confirms the reduction of GO.40 Another spectrum shows a blue shift from 270 nm to 205 nm of the rGO peak indicating the formation of the nanocomposite. This shift might be attributed to the sticking of CuO nanoparticles on the surface of rGO sheets. The band gap energy (Eg) for CuO, rGO and the nanocomposite was calculated using Tauc's formula:
1.00) nanocomposite. A broad absorption spectrum of CuO is located at 275 nm which is due to the inter-band transition.39 The absorption peak was discovered for rGO at 270 nm that might be attributed to the graphitic C–C ring's π–π* transition and also confirms the reduction of GO.40 Another spectrum shows a blue shift from 270 nm to 205 nm of the rGO peak indicating the formation of the nanocomposite. This shift might be attributed to the sticking of CuO nanoparticles on the surface of rGO sheets. The band gap energy (Eg) for CuO, rGO and the nanocomposite was calculated using Tauc's formula:
| αhν = A(hν − Eg)1/2 |
PL spectra of the as-synthesized CuO nanoparticles were obtained at an excitation value of 250 nm [Fig. S2a, ESI†]. Two major peaks appear in the blue region; one at 451 nm corresponding to band-edge emission and the other at 468 nm corresponding to an artefact. The transition void of oxygen and interstitial oxygen generate two small peaks at 482 and 492 nm, respectively.43,44 At the same excitation, a PL spectrum of rGO was obtained and is shown in Fig. S2b (ESI†). It shows a peak at 307 nm which confirms the oxygenated functional groups in rGO. Furthermore, π–π* transitions of GO produce a prominent signal at 467 nm. Another peak at 562 nm is due to electron–hole pair recombination in the local state of a sp2 carbon cluster contained in the sp3 matrix.45 Fig. S2c (ESI†) shows the PL spectrum of the rGO–CuO nanocomposite and it revealed the presence of an rGO related peak at 470 nm while the other peak corresponding to 307 nm disappears. Similarly, the CuO related emission peak at 451 nm is also present. In addition to these peaks, some additional peaks also appear in the violet and yellow region indicating the formation of the nanocomposite.
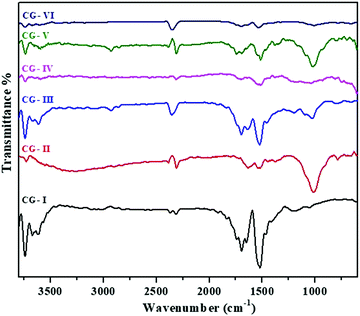
FTIR analysis was used for investigating the effectual inclusion of the extract on nanoparticles and the existence of various functional groups in the nanocomposite material. Fig. 1 shows the FTIR spectra of all the prepared materials and proved the existence of CuO nanoparticles along with rGO. The IR spectrum of rGO shows a peak at ∼1200 cm−1 which is associated with the C–O stretching frequency of phenol and epoxy groups of GO, and is highly reduced in rGO. Another peak at 1525 cm−1 corresponds to the C![[double bond, length as m-dash]](https://www.rsc.org/images/entities/char_e001.gif) C stretching vibration. A broad peak at ∼3400 cm−1 is highly diminished, indicating the absence of –OH stretching frequency. In the spectrum of CuO, a peak corresponding to 2310 cm−1 is ascribed to the C–O stretching frequency of the aldehyde group which results from bio-capping by the plant residue. The peak that refers to the hydroxyl (–OH) group of various polyphenols (flavonoids) present in the plant extract is observed at ∼3400 cm−1.32 Also, peaks at 1017 and 1630 cm−1 indicate the existence of C–O and C
C stretching vibration. A broad peak at ∼3400 cm−1 is highly diminished, indicating the absence of –OH stretching frequency. In the spectrum of CuO, a peak corresponding to 2310 cm−1 is ascribed to the C–O stretching frequency of the aldehyde group which results from bio-capping by the plant residue. The peak that refers to the hydroxyl (–OH) group of various polyphenols (flavonoids) present in the plant extract is observed at ∼3400 cm−1.32 Also, peaks at 1017 and 1630 cm−1 indicate the existence of C–O and C![[double bond, length as m-dash]](https://www.rsc.org/images/entities/char_e001.gif) O stretching frequencies of terpenoids and flavanones engaged in the process of stabilization, followed by reduction. It was also noted that the intensity of peak located at ∼1593 cm−1 in all the CuO/rGO nanocomposites, accredited to H–O–H bending vibrations, is slightly decreased as compared to that of pure rGO. The catalytic function of Cu for de-oxygenation in the reduction of GO might be responsible for this decrement. The peak at ∼1380 cm−1 due to
O stretching frequencies of terpenoids and flavanones engaged in the process of stabilization, followed by reduction. It was also noted that the intensity of peak located at ∼1593 cm−1 in all the CuO/rGO nanocomposites, accredited to H–O–H bending vibrations, is slightly decreased as compared to that of pure rGO. The catalytic function of Cu for de-oxygenation in the reduction of GO might be responsible for this decrement. The peak at ∼1380 cm−1 due to ![[double bond, length as m-dash]](https://www.rsc.org/images/entities/char_e001.gif) C–H vibration was slightly diminished upon the addition of CuO into rGO.46 The intensity of peaks becomes weak or decreases in CuO/rGO due to chemical reduction. Moreover, with the addition of different amounts of CuO into the rGO matrix, the intensity of peak of CuO at ∼1000 cm−1 has become weaker or decreased in CuO/rGO, due to chemical reduction.47
C–H vibration was slightly diminished upon the addition of CuO into rGO.46 The intensity of peaks becomes weak or decreases in CuO/rGO due to chemical reduction. Moreover, with the addition of different amounts of CuO into the rGO matrix, the intensity of peak of CuO at ∼1000 cm−1 has become weaker or decreased in CuO/rGO, due to chemical reduction.47
3.2 X-ray diffraction (XRD) analysis
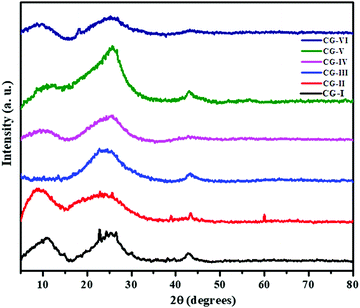
XRD of the as-prepared rGO, CuO and CuO/rGO nanocomposites was performed (Fig. 2). In case of as-prepared rGO, a broad band was noticed at 2θ = 25.6° corresponding to the (002) peak of graphene having a d-spacing of 0.35 nm. This indicated that the oxygenated groups of GO have been efficiently removed by the Terminalia arjuna bark extract, and sheets of graphene undergo restacking during the reduction process. In addition to this, a relatively low and broad characteristic (001) peak at 2θ = 10.9° with 0.81 nm d-spacing was also observed, demonstrating the presence of residual oxygenated functional groups.48 A small diffraction peak at 2θ = 43.03° is correlated to the (102) plane of the rGO structure.49,50 The XRD pattern of biogenic CuO NPs shows various small distinct diffraction peaks at 2θ = 8.2, 23.6, 25.7, 39.1 and 43.7° with d-spacings of 1.14, 0.37, 0.34, 0.23 and 0.20 nm, respectively. This represents the (![[1 with combining macron]](https://www.rsc.org/images/entities/char_0031_0304.gif) 01), (
01), (![[2 with combining macron]](https://www.rsc.org/images/entities/char_0032_0304.gif) 13), (
13), (![[1 with combining macron]](https://www.rsc.org/images/entities/char_0031_0304.gif) 21), (204), (
21), (204), (![[6 with combining macron]](https://www.rsc.org/images/entities/char_0036_0304.gif) 12) monoclinic structure of CuO NPs, well matched with JCPDS card no. 96-702-9163. Furthermore, one more diffraction peak is observed at 2θ = 60.2 with a d-spacing of 1.54 nm which also supports the formation of monoclinic CuO NPs.51 The XRD pattern of the nanocomposites (CG-III to CG-VI) displays diffraction peaks corresponding to both rGO and CuO (Fig. 2), and no other additional peak due to impurities is seen, suggesting that nanoparticles and nanocomposites have been successfully synthesized.
12) monoclinic structure of CuO NPs, well matched with JCPDS card no. 96-702-9163. Furthermore, one more diffraction peak is observed at 2θ = 60.2 with a d-spacing of 1.54 nm which also supports the formation of monoclinic CuO NPs.51 The XRD pattern of the nanocomposites (CG-III to CG-VI) displays diffraction peaks corresponding to both rGO and CuO (Fig. 2), and no other additional peak due to impurities is seen, suggesting that nanoparticles and nanocomposites have been successfully synthesized.
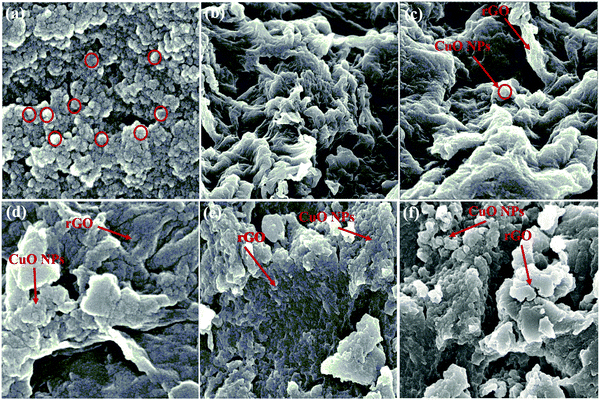
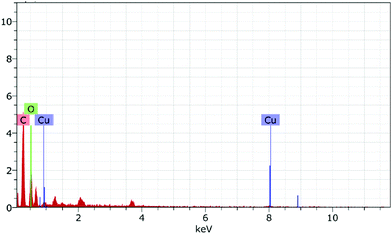
FESEM images were used to analyze the morphologies of the as-synthesized samples (Fig. 3). CuO NPs revealed the spherical morphology as rough agglomerates (Fig. 3a). The observations clearly demonstrated that the phytochemicals present in the plant extract function both as stabilizers and capping agents, thus, modulating the size of fabricated CuO NPs during their growth.52 The morphology of rGO demonstrated less agglomeration and individual sheets that clearly demonstrated the reduction of GO (Fig. 3b).53 On addition of CuO NPs to rGO, the morphology changed gradually, suggesting the binding of CuO NPs with rGO (Fig. 3c–f). The energy dispersive X-ray analysis (EDX) of the as-synthesized sample indicated that the CuO/rGO nanocomposite contained copper, carbon, and oxygen elements (Fig. 4).
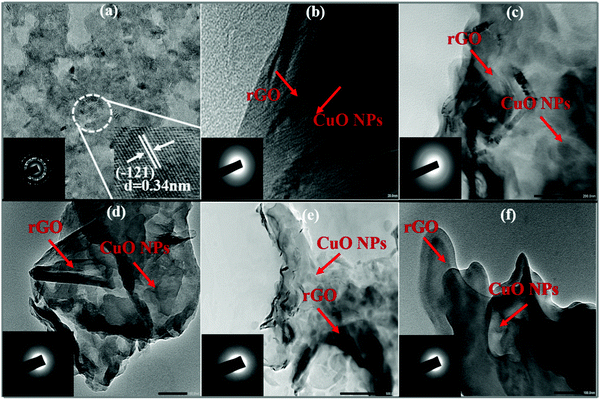
HRTEM was utilized to recognize the morphology and structure of the as-synthesized products. HRTEM images of CuO (Fig. 5a) revealed the existence of small sized spherical CuO NPs generated in a specific manner to produce bigger spheres. The inset shows an inter-planar spacing of 0.34 nm which is related to the (121) plane of orientation of the lattice. At some spots, creation of a sheet-like morphology with wrinkles and entangled structures may be detected in the HRTEM image of rGO (Fig. 5b). On the other hand, HRTEM images of the CuO/rGO nanocomposite (Fig. 5c and f) presented a consistent distribution of CuO NPs on rGO sheets. This homogeneous dispersal of CuO NPs on rGO sheets was also confirmed from EDS spectra. The selected area electron diffraction (SAED) pattern of the as-synthesized samples is displayed in the inset of their respective TEM images.
XPS analysis
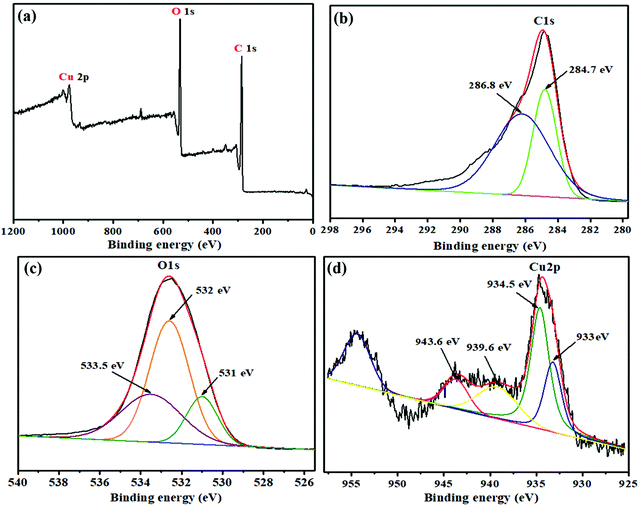
To explore the compositional atomic concentration of the CG-V nanocomposite, XPS was performed. Fig. 6 shows the XPS spectrum of C 1s, O 1s and Cu 2p elements, respectively. The XPS survey spectrum of the as-synthesized CuO/rGO nanocomposite is given in Fig. 6a. The deconvoluted C 1s spectrum of the composite (Fig. 6b) indicates the presence of 3 peaks. A significant peak at 284.8 eV reveals the existence of C![[double bond, length as m-dash]](https://www.rsc.org/images/entities/char_e001.gif) C/C–C. Other peaks at 286.2 eV and 288.2 eV authenticate the existence of C–OH/O–C–O and C
C/C–C. Other peaks at 286.2 eV and 288.2 eV authenticate the existence of C–OH/O–C–O and C![[double bond, length as m-dash]](https://www.rsc.org/images/entities/char_e001.gif) O bonds, respectively.46 The spectrum for O 1s (Fig. 6c) exhibited a dominant peak at 532.6 eV which is attributed to C–O. Another peak near 531 eV reveals the presence of C
O bonds, respectively.46 The spectrum for O 1s (Fig. 6c) exhibited a dominant peak at 532.6 eV which is attributed to C–O. Another peak near 531 eV reveals the presence of C![[double bond, length as m-dash]](https://www.rsc.org/images/entities/char_e001.gif) O in carbonyl and a peak at 533.5 eV is related to C–OH.38 The XPS spectrum of Cu 2p (Fig. 6d) revealed two major peaks at 934.6 eV and 954.4 eV which have contributions from Cu2+ and (Cu0 + Cu+), respectively. It also showed two satellite peaks at 941.3 eV and 943.8 eV respectively, related to the Cu2+ state (CuO).54,55
O in carbonyl and a peak at 533.5 eV is related to C–OH.38 The XPS spectrum of Cu 2p (Fig. 6d) revealed two major peaks at 934.6 eV and 954.4 eV which have contributions from Cu2+ and (Cu0 + Cu+), respectively. It also showed two satellite peaks at 941.3 eV and 943.8 eV respectively, related to the Cu2+ state (CuO).54,55
Removal of heavy metal ions
Distribution coefficients (Kd) of several metal ions were determined on CuO, rGO and CuO/rGO nanocomposites by the batch method, employing AAS. The selectivity order of various metal ions towards the adsorbent was observed as: Bi3+ (2436.36), Cd2+ (2210.23), Cr3+ (879), Zn2+ (846.1), Ni2+ (792), Pd2+ (688), Fe2+ (500), Hg2+ (401.3), La3+ (258.7), As3+ (200), Ba2+ (175), Sn2+ (112.3), Mn2+ (96). Bi3+ and Cd2+ ions have very high Kd values indicating that they are preferentially adsorbed on CuO, rGO and CuO/rGO nanocomposites in comparison to other metal ions. Thus, the synthesized nanocomposites can be deployed to separate Bi3+ and Cd2+ ions from waste effluents.The removal efficiency of the CuO/rGO nanocomposite for Bi3+ and Cd2+ ions was 98% and 90%, respectively (Fig. 7a and b). Pure CuO and rGO were also utilized for removing metal ions under similar reaction conditions. It was observed that the CuO/rGO nanocomposite showed remarkably improved removal efficiency as compared to those of pure CuO and rGO. Accordingly, the adsorption of Bi3+ and Cd2+ ions was predominantly attributed to the loading of CuO NPs in the CuO/rGO nanocomposite.
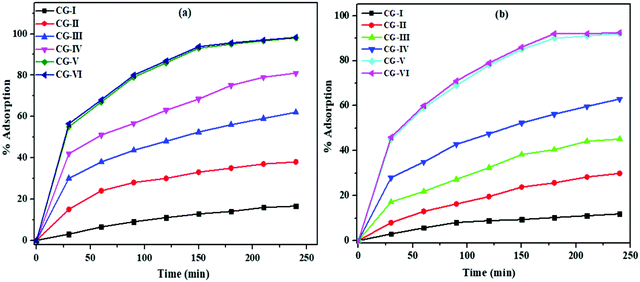 | ||
| Fig. 7 Effect of time on the adsorption of (a) Bi3+ and (b) Cd2+ ions on various adsorbent samples of rGO, CuO and CuO/rGO nanocomposites. | ||
Furthermore, the effect of adsorbent dose as well as the influence of pH was investigated distinctly on one of the samples (CG-V) that exhibited maximum adsorption. The adsorbent dose is an important factor for determining the adsorption capability of an adsorbent.56 On enhancing the dose of adsorbent from 10 to 30 mg L−1, the efficacy of CG-V for removing Bi3+ and Cd2+ ions increased, reaching 98% and 90% for Bi3+ and Cd2+, respectively (Fig. S3, ESI†). This could be attributed to more active sites available for metal ion adsorption. On further increasing the dosage amount to 40 mg L−1, there was no further increase in percent adsorption which could be due to particle aggregation at higher adsorbent concentrations.
The surface-active sites of functional materials as well as heavy metal speciation were significantly impacted by the pH of solution. In terms of high selectivity, acidity of the adsorption medium is a crucial component as it affects the properties of the adsorbent surface.57 In modified and functionalized rGO, the important surface functional groups present are hydroxyl (–OH), carboxyl (–COOH) and carbonyl (–C![[double bond, length as m-dash]](https://www.rsc.org/images/entities/char_e001.gif) O). These functional groups provide active sites for the functionalization of rGO to form composites with metals, organic moieties and other heteroatoms.58 Similarly, oxygen from Cu–O bonding served as an attractive site for the complexation of metal ions. Within a pH range of 2–10, the influence of pH on the adsorption of Bi3+ and Cd2+ ions by the nano-composite was fully explored (Fig. S4, ESI†). It is noteworthy that metal ions precipitated at high pH whereas the adsorbent may dissolve at low pH and lose its adsorption ability.59,60 As the pH of solution is varied from 2.0 to 7.0, considerable increase in the removal efficiency for both Bi3+ and Cd2+ ions was observed which decreased subsequently on enhancing the pH further. This may be due to the fact that with the increase in pH up to 7, protonation reaction weakens and interactions between metal ions and functional groups on the adsorbent surface become stronger, thereby increasing the adsorption of both the metal ions. Both the metal ions were adsorbed in a limited amount in strongly acidic media because of the presence of a high concentration of hydronium ions that compete with metal ions for diffusion, leading to the adsorption of hydronium ions on the surface of the nanocomposite material rather than the particular metal ions.61 As a result, a neutral solution (pH = 7.0) is best suited for metal ion adsorption.
O). These functional groups provide active sites for the functionalization of rGO to form composites with metals, organic moieties and other heteroatoms.58 Similarly, oxygen from Cu–O bonding served as an attractive site for the complexation of metal ions. Within a pH range of 2–10, the influence of pH on the adsorption of Bi3+ and Cd2+ ions by the nano-composite was fully explored (Fig. S4, ESI†). It is noteworthy that metal ions precipitated at high pH whereas the adsorbent may dissolve at low pH and lose its adsorption ability.59,60 As the pH of solution is varied from 2.0 to 7.0, considerable increase in the removal efficiency for both Bi3+ and Cd2+ ions was observed which decreased subsequently on enhancing the pH further. This may be due to the fact that with the increase in pH up to 7, protonation reaction weakens and interactions between metal ions and functional groups on the adsorbent surface become stronger, thereby increasing the adsorption of both the metal ions. Both the metal ions were adsorbed in a limited amount in strongly acidic media because of the presence of a high concentration of hydronium ions that compete with metal ions for diffusion, leading to the adsorption of hydronium ions on the surface of the nanocomposite material rather than the particular metal ions.61 As a result, a neutral solution (pH = 7.0) is best suited for metal ion adsorption.
For the adsorption of Bi3+ and Cd2+ ions from the samples of wastewater, contact time between Bi3+ and Cd2+ ions in solution and nanocomposite material is critical. The ideal time for maximum Bi3+ and Cd2+ ion adsorption was determined by a series of batch tests, with the filtrate solution being examined by AAS. The influence of time on Bi3+ and Cd2+ ion adsorption is shown in Fig. 7(a) and (b). Adsorption of metal ions on the surface of the nanocomposite material was single layer, smooth, and continuous as a function of time, indicating monolayer adsorption.62 The adsorption efficiency for Bi3+ and Cd2+ ions increases with the contact time, and maximum Bi3+ and Cd2+ ions were adsorbed from solution in 180 min using the CG-V nanocomposite. The maximum percentage adsorption on CG-V and CG-VI for Bi3+ and Cd2+ ions was observed to be 97.5%, 98%, 90.5% and 91%, respectively. Under the same reaction conditions, pure CuO and rGO were also used to remove metal ions. The CuO/rGO nanocomposite was observed to have substantially greater removal efficiency than pristine CuO and rGO. As a result, adsorption of Bi3+ and Cd2+ metal ions on the CuO/rGO nanocomposite was primarily due to CuO NP doping.
It was observed that the CG-V nanocomposite has an adsorption capacity of 98% and 91% for Bi3+ and Cd2+ ions, respectively. The enhanced adsorption efficacy of CG-V was credited to the doping of a higher amount of CuO NPs in rGO.
Adsorption isotherms
Adsorption isotherms are often used to comprehend the adsorption mechanism. The Langmuir adsorption model was chosen for predicting the mechanism of adsorption of Bi3+ and Cd2+ ions on the CuO/rGO nanocomposite. As a single layer of adsorbed species occupied the active adsorption sites on the surface of nanocomposite, this model is commonly utilized for the dynamic adsorption state. Furthermore, once the single layer is built and adsorbent is immersed, no lateral interactions are observed between metal ion species.63 Thus, the Langmuir adsorption isotherm equation was used to estimate the highest adsorption capacity:64where qe = quantity (mg) of metal ions adsorbed per unit mass of the nanocomposite (g), Ce = metal ion concentration in solution (mg L−1) at equilibrium and KL is the Langmuir constant (Lm g−1). The Langmuir model adequately explained the adsorption performance of the nanocomposite for Bi3+ and Cd2+ (R2 > 0.96) (Fig. 8a and b). The maximum adsorption capacities of the nanocomposite, estimated from isotherms for Bi3+ using the above equation are 58.8 mg g−1 (CG-I), 70.9 mg g−1 (CG-II), 52.6 mg g−1 (CG-III), 90.9 mg g−1 (CG-IV), 138.8 mg g−1 (CG-V) and 126.9 mg g−1 (CG−1-VI), and for Cd2+ are 66.6 mg g−1 (CG-I), 55.5 mg g−1 (CG-II), 83.3 mg g−1 (CG-III), 91.5 mg g−1 (CG-IV), 112.4 mg g−1 (CG-V) and 93.4 mg g−1 (CG-VI) on the nanocomposites. A significant component in industrial-scale utilization is the high amount of adsorption.
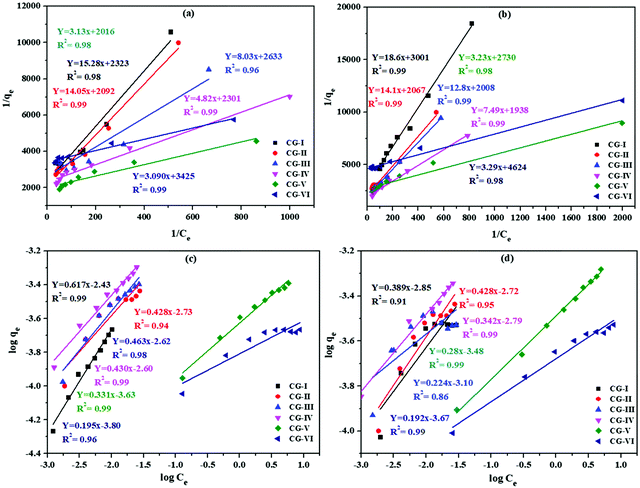 | ||
| Fig. 8 (a and b) Langmuir adsorption isotherms and (c and d) Freundlich adsorption isotherms for Bi3+ and Cd2+ ion adsorption on different adsorbent samples of rGO, CuO and CuO/rGO nanocomposites. | ||
The Langmuir parameter b, derived from a non-dimensional constant termed as the separation factor RL, can be used to interpret the Langmuir isotherm and the interface between metal ions and the CuO/rGO nanocomposite adsorbent:
In this study, the computed value of RL for Bi3+ and Cd2+ ion adsorption on the CuO/rGO nanocomposite adsorbent was somewhere between 0 and 1 (Tables S1 and S2, ESI†), indicating appreciable adsorption. Tables S1 and S2 (ESI†) show the derived Freundlich and Langmuir isotherm parameters for Bi3+ and Cd2+ ions, respectively.
Freundlich adsorption isotherm
where Qe = adsorbed amount (mol g−1) and Ce = adsorbate concentration at equilibrium (mol L−1).
1/n is the adsorption intensity, and provides knowledge about the degree of heterogeneity. Kf is a constant in the Freundlich isotherm and is related to the adsorption energy.65
Fig. 8(c) and (d) show the log![[thin space (1/6-em)]](https://www.rsc.org/images/entities/char_2009.gif) qevs. log
qevs. log![[thin space (1/6-em)]](https://www.rsc.org/images/entities/char_2009.gif) Ce graph where the value of R2 is >0.91 for each sample. The straight lines obtained successfully confirmed the adsorption isotherms for Bi3+ and Cd2+ metal ions on the CuO/rGO nanocomposite. The estimated values of n and Kf for Bi3+ and Cd2+ are reported in Table S2 (ESI†) using linear fitting. The value of 1/n(≤1) denotes the viability of the adsorption process.
Ce graph where the value of R2 is >0.91 for each sample. The straight lines obtained successfully confirmed the adsorption isotherms for Bi3+ and Cd2+ metal ions on the CuO/rGO nanocomposite. The estimated values of n and Kf for Bi3+ and Cd2+ are reported in Table S2 (ESI†) using linear fitting. The value of 1/n(≤1) denotes the viability of the adsorption process.
Temkin isotherms
The reduction in heat of adsorption as per the Freundlich isotherm is logarithmic but the Temkin adsorption isotherm claimed it to be linear. The Temkin isotherm has a feature that calculates adsorbate–adsorbent interactions. With the introduction of the adsorbent surface, heat of sorption of adsorbed ions gradually decreased.Temkin's isotherm has the following linear form:
qe = Bln![[thin space (1/6-em)]](https://www.rsc.org/images/entities/i_char_2009.gif) KT + Bln KT + Bln![[thin space (1/6-em)]](https://www.rsc.org/images/entities/i_char_2009.gif) Ce Ce |
![[thin space (1/6-em)]](https://www.rsc.org/images/entities/i_char_2009.gif) Ce graph (Fig. 9) and are given in Tables S1 and S2 (ESI†).
Ce graph (Fig. 9) and are given in Tables S1 and S2 (ESI†).
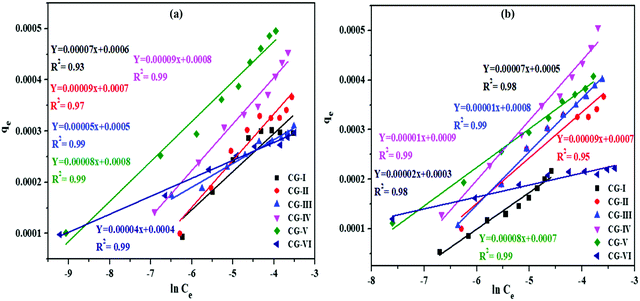 | ||
| Fig. 9 Temkin adsorption model for Bi3+ and Cd2+ ion adsorption on different adsorbent samples of rGO, CuO and CuO/rGO nanocomposites. | ||
Photocatalytic degradation
The photodegradation efficiency of the as-synthesized CuO/rGO nanocomposite for organic contaminants, EBT and MO dyes under UV-vis light was investigated. The usual absorption maximum of EBT at 556 nm and that of MO at 464 nm was recorded with a UV–vis spectrophotometer. It was observed from the initial adsorption studies of both EBT and MO dyes on CG-V for 30 minutes in the absence of UV radiation that very negligible amounts of dyes were removed by the nanocomposite. Fig. 10 shows the total degradation of EBT and MO dyes with time using sole CuO, rGO and CuO/rGO nanocomposite photocatalysts. During light exposure for 80 min with CG-I, CG-II, CG-III, CG-IV, CG-V and CG-VI of the nanocomposite catalyst, 48%, 46%, 59%, 69%, 80% and 96% of the EBT dye was degraded as shown in Fig. 10a. At λmax = 556 nm, the photocatalytic deterioration of the EBT dye with respect to time (Ct/Co) was examined. Without using the adsorbent, the genuineness of self-sensitization development was also examined, and no substantial dye degradation was observed. When a catalyst was added, a significant proportion of dye was degraded, indicating that the dye degradation was primarily due to photocatalytic activity of the nanocomposite.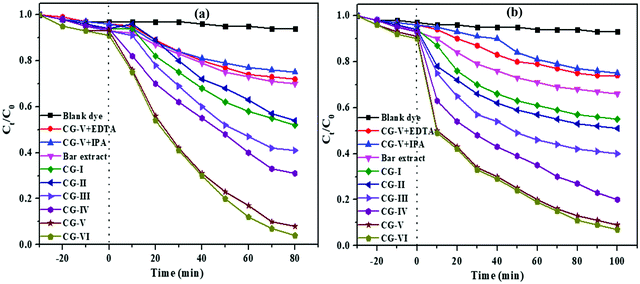 | ||
| Fig. 10 Graphs of ratios of concentration of (a) EBT and (b) MO dyes in water over a fixed time period using various samples of the photocatalyst. | ||
In the case of MO, a considerable proportion of the dye underwent degradation in 100 min with various quantities of the catalyst. Fig. 10b shows that CG-I, CG-II, CG-III, CG-IV, CG-V and CG-VI nanocomposite samples decomposed 45%, 49%, 59%, 78%, 89% and 90% of this anionic dye, respectively.
Mechanism of photodegradation
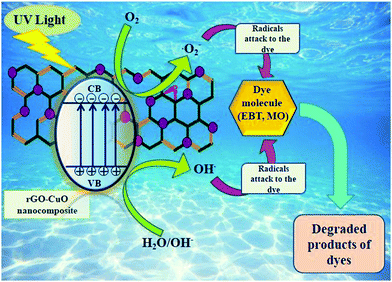
The plausible photocatalytic degradation mechanism of organic compounds is depicted in Fig. 11.When the catalyst (CuO/rGO) is exposed to photons with energy either equal to or greater than the bandgap energy of the nanocomposite, electrons (e−) are stimulated from the valence band (VB).
| CuO/rGO + hν →e−(CB) + h+ (VB) | (i) |
| Adsorbed O2 molecules on the nanocomposite surface or dissolved O2 easily captured the irradiated electrons to produce O2−i.e., superoxide radicals |
| e− + O2 → O2− | (ii) |
As a result, O2− can combine with H2O to form HO2• and OH•, both of which are powerful oxidants that degrade organic compounds:
| O2− + H2O →HO˙2+ OH˙ | (iii) |
At the same time, photogenerated holes may be retained by the hydroxyl groups (OH−) on the surface of photocatalyst, resulting in hydroxyl radicals (OH˙):
| h++ OH−→ ˙OHad | (iv) |
| h++ H2O→˙OH + H+ | (v) |
Finally, the oxidation of organic compounds takes place to produce CO2 and H2O as shown below:
| OH + organic dyes + O2 → products (CO2 and H2O) | (vi) |
Provisionally, positive holes and electrons may recombine momentarily, reducing the photocatalytic activity of the produced nanocatalyst.66
When the CuO/rGO nanocomposite is exposed to UV light, conduction band electrons travel to the surface of the catalyst and create O2− anion radicals, followed by the conversion of OH−into ˙OH through holes. Both these ˙OH and O2− radicals are prominent oxidants. The donor–acceptor nature of EBT and MO dye contaminants accounts for the difference in the degradation behaviour and time. EBT as an electron donor responds to holes from the VB while, in contrast, MO as an electron acceptor responds to electrons from the CB. They show different photocatalytic degradation by the CuO/rGO nano-composite which can be attributed to the different nature of EBT and MO dyes. The oxidative reactions described in equations (v) and (vi) may be responsible for the degradation of both dyes. The successive attack through ˙OH radicals guides the oxidation procedure of both the pollutants. The quenchers, ethylenediaminetetraacetic acid (EDTA) and isopropyl alcohol (IPA) confirmed the involvement of ˙OH and O2− radicals. The presence of quenchers slows down the degradation of dye (Fig. 10), and degradation is hindered more by EDTA than IPA.
LC-MS studies of degraded MO and EBT dyes
Liquid chromatography–mass spectrometry (LC-MS) was used to analyze the extent of degradation of both MO and EBT dyes. On the basis of the HPLC-MS fragmentation pattern (Fig. S5, ESI†), structures of various products have been proposed and represented in Fig. S6 (ESI†). Before irradiation, the methyl orange (MO) peak was detected at 328.07 m/z, which confirms the presence of only the parent dye. Upon irradiation, the MO molecule is disintegrated to several fragments with m/z values of 344.07, 306.08, 292.07, 274.27, 223.06, 172.52 and 148.08.67,68 Similarly, eriochrome black T (EBT) showed a main peak at 460.02 m/z corresponding to pure dye (Fig. S7, ESI†). Fig. S8 (ESI†) shows the fragmentation of EBT dye into various smaller molecules at m/z values of 323.22, 290.26, 274.27, 246.24, 234.20, 162.14 and 144.13.69The comparison of photocatalytic degradation by CuO/rGO and that by other GO-based catalysts previously reported is given in Table 1.
| Sr. No. | Photocatalyst | Dye | % Degradation (UV-light) | Time (min) | Dye concentration | Dosage amount | Ref. |
|---|---|---|---|---|---|---|---|
| 1. | TiO2–GO | MB | 100 | 25 | 1.16 M | 20 mg | 69 |
| MO | 84 | 240 | |||||
| 2. | Fe3O4@S/rGO | CV | 76 | 180 | 10 mg L−1 | 2 mg L−1 | 70 |
| MB | 87 | 180 | 10 mg L−1 | 2 mg L−1 | |||
| 3. | rGO–ZnO | RhB | 97 | 90 | 4.79 g L−1 | 30 mg | 71 |
| 4. | SnO2–graphene | RhB | 97 | 60 | 500 mg L−1 | 20 mg L−1 | 72 |
| MO | 95 | 40 | 500 mg L−1 | 20 mg L−1 | |||
| 5. | SnO2 aerogel/rGO | MO | 84 | 60 | 1 × 10⁻⁵ M | 100 mg L−1 | 7 |
| 6. | B–GO | MB | 99 | 50 | 10 ppm | 25 mg/0.1 L | 9 |
| MO | 98 | 100 | 10 ppm | 25 mg/0.1 L | |||
| 7. | Pc–GO | MO | 87.5 | 90 | 2 mg L−1 | 3.2 mg L−1 | 38 |
| MB | 98 | 25 | 2 mg L−1 | 3.2 mg L−1 | |||
| 8. | ZnO/rGO/PANI | MO | 100 | 60 | 10 mg L−1 | 25 mg | 73 |
| 9. | TiO2/graphene | MO | 85 | 60 | 0.025 g L−1 | 20 mg L−1 | 74 |
| 10. | CuO/rGO | EBT | 98 | 80 | 1 × 10⁻⁴ M | 20 mg | Present study |
| MO | 90 | 100 | 1 × 10⁻⁴ M | 20 mg | |||
Photocatalytic degradation kinetics
The photocatalytic performance of the as synthesized CG-V nanocomposite may be evaluated using kinetics of the photocatalytic degradation of dye solution.5,70 Decomposition of both the dyes was studied using pseudo first as well as second order kinetic models, and data were analyzed as previously mentioned. The pseudo first-order kinetic model's time was plotted against log (qe − qt) and is presented in Fig. 12a. Based on the kinetic data for degradation of EBT, the values corresponding to R2 as well as equilibrium sorption capacity for all the six samples are not appropriate, according to the results of the first order model.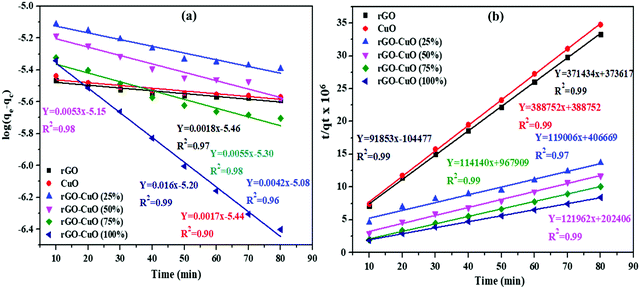 | ||
| Fig. 12 (a and b) Pseudo first and second-order kinetics plots for EBT on rGO, CuO and CuO/rGO nanocomposites. | ||
As a result, pseudo second-order kinetic equation was utilized for the investigation of decolorization kinetics. The graph of (t/qt) vs. t is shown in Fig. 12b, and the R2 value for each sample is close to 1 (0.97) which is consistent with the experimental results (Table S3, ESI†).
For full understanding of kinetics, an anionic dye (MO) was used in a similar way. The model's viability is further tested via values of R2 and equilibrium sorption capabilities for each of the four samples. As can be observed in Fig. 13a, first order kinetics was not very reliable. As a result, the graph of t/qtvs. t was utilized to confirm that the second-order kinetic model for MO dye holds good (Fig. 13b). The values of R2 (0.99) for CG-I, CG-II, CG-III, CG-IV, CG-V and CG-VI nanocomposites lie near unity and suit the observed data (Table S4, ESI†). Thus, both the dyes (EBT and MO) degrade in a pseudo second-order manner, and the reaction rate was manifested by a chemical procedure.
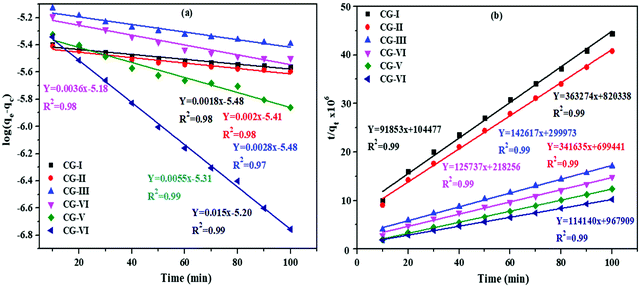 | ||
| Fig. 13 (a and b) Pseudo first and second-order kinetics plots for MO on rGO, CuO and CuO/rGO nanocomposites. | ||
The derived parameters for EBT and MO dyes are listed in Tables S3 and S4 (ESI†). The values of qe and K2 are calculated using the slope and intercept of plot. Values of R2 vary from 0.90 to 0.99 for the EBT dye for the first order kinetics, and 0.97 to 0.99 for the second order kinetics.
For first and second order kinetics, R2 value for the MO dye ranged from 0.97 to 0.99 and 0.99, respectively. From the R2 values, it was concluded that the photocatalytic degradation of both EBT and MO dyes follows second order kinetics rather than first order kinetics.
To assess the recyclability of the catalyst, the used solid catalyst was isolated from the reaction mixture and cleaned by frequent washing with a solution of ethyl acetate and water to remove any unwanted material, centrifuged, and finally dried at 60 °C. The recovered catalyst was then utilized in the new photocatalytic reaction under the same reaction conditions as considered before and replicated for 5 runs.
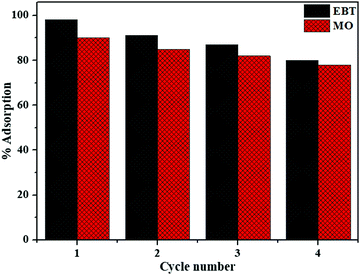
After four successive cycles, activity of the photocatalyst decreases by 16% and 12% for EBT and MO dyes, respectively, as shown in Fig. 14. The negligible surface leaching during photocatalytic reactions could be the cause of a minor decline in photocatalytic activity.
Conclusions
Herein, the successful synthesis of a CuO/rGO nanocomposite via a green route using Arjuna bark extract has been demonstrated. The characterization results of the formulated material revealed that the reduction of GO to rGO was successfully performed and CuO NPs were also effectively stacked on the surface of rGO. This hybrid material delivered outstanding adsorption properties for the removal of heavy metal ions, namely Bi3+ (98%) and Cd2+ (91%) ions, respectively. Good photocatalytic behavior for the degradation of anionic dyes viz. EBT and MO in water bodies is another advantage of this brilliant nanocomposite. It showed 98% EBT degradation in 80 min and 90% MO degradation in 100 min. The degradation kinetics followed pseudo second order kinetics. The recyclability results revealed that this photocatalyst can be easily reused for four degradation cycles without any appreciable change in its activity against organic pollutants. The obtained results may provide new ideas for the development of other such potential biogenic materials for water remediation.Conflicts of interest
There are no conflicts to declare.References
- V. Jabbari, J. M. Veleta, M. Z. Chaleshtori, J. G. Torresdey and D. Villagrán, Green synthesis of magnetic MOF@GO and MOF@CNT hybrid nanocomposites with high adsorption capacity towards organic pollutants, Chem. Eng. J., 2016, 304, 774–783 CrossRef CAS.
- M. Hosseini, A. R. Keshtkar and M. A. Moosavian, Electrospun chitosan/baker's yeast nanofibre adsorbent: preparation, characterization and application in heavy metal adsorption, Bull. Mater. Sci., 2016, 39, 1091–1100 CrossRef CAS.
- Y.-H. Li, S. Wang, Z. Luan, J. Ding, C. Xu and D. Wu, Adsorption of cadmium (II) from aqueous solution by surface oxidized carbon nanotubes, Carbon, 2003, 41, 1057–1062 CrossRef CAS.
- Ihsanullah, F. A. A. Khaldi, B. Abusharkh, M. Khaled, M. A. Atieh, M. S. Nasser, T. laoui, T. A. Saleh, S. Agarwal, I. Tyagi and V. K. Gupta, Adsorptive removal of cadmium (II) ions from liquid phase using acid modified carbon-based adsorbents, J. Mol. Liq., 2015, 204, 255–263 CrossRef CAS.
- S. Kaushal, P. Kurichh and P. P. Singh, Novel 3D flower like ZnO/MnV2O6 heterojunction as an efficient adsorbent for the removal of imidacloprid and photocatalyst for degradation of organic dyes in waste water, Polyhedron, 2021, 201, 115161 CrossRef CAS.
- N. M. El-Shafai, M. E. El-Khouly, M. El-Kemary, M. S. Ramadan and M. S. Masoud, Graphene oxide–metal oxide nanocomposites: fabrication, characterization and removal of cationic rhodamine B dye, RSC Adv., 2018, 8, 13323–13332 RSC.
- T. Kim, V. G. Parale, H. Jung, Y. Kim, Z. Driss, D. Driss, A. Bouabidi, S. Euchy and H. Park, Facile Synthesis of SnO2 Aerogel/Reduced Graphene Oxide Nanocomposites via in Situ Annealing for the Photocatalytic Degradation of Methyl Orange, Nanomaterials, 2019, 9, 358 CrossRef CAS PubMed.
- J. I. Paredes, S. V. Rodil, A. M. Alonso and J. M. D. Tascon, Graphene oxide dispersions in organic solvents, Langmuir, 2008, 24, 10560–10564 CrossRef CAS PubMed.
- M. Singh, S. Kaushal, P. Singh and J. Sharma, Boron doped graphene oxide with enhanced photocatalytic activity for organic pollutants, J. Photochem. Photobiol., A, 2018, 364, 130–139 CrossRef CAS.
- C. Yu, F. Chen, D. Zeng, Y. Xie, W. Zhou, Z. Liu, L. Wei, K. Yang and D. Li, A facile phase transformation strategy for fabrication of novel Z-scheme ternary heterojunctions with efficient photocatalytic properties, Nanoscale, 2019, 11, 7720–7733 RSC.
- X.-K. Kong, C.-L. Chen and Q.-W. Chen, Doped graphene for metal-free catalysis, Chem. Soc. Rev., 2014, 43, 2841–2857 RSC.
- T. S. Sreeprasad, S. S. Gupta, S. M. Maliyekkal and T. Pradeep, Immobilized graphene-based composite from asphalt: Facile synthesis and application in water purification, J. Hazard. Mater., 2013, 246-247, 213–220 CrossRef CAS PubMed.
- N. Zhang, Y. Zhang and Y.-J. Xu, Recent progress on graphene-based photocatalysis: current status and future perspectives, Nanoscale, 2012, 4, 5792–5813 RSC.
- A. K. Mishra and S. Ramaprabhu, Functionalized Graphene-based nanocomposites for supercapacitor application, J. Phys. Chem. C, 2011, 115, 14006–14013 CrossRef CAS.
- J. D. R. Mayhew and I. A. Aksay, Chem. Rev., 2014, 114, 6323–6348 CrossRef PubMed.
- N. Li, Z. Wang, K. Zhao, Z. Shi, S. Xu and Z. Gu, Graphene-Pd composite as highly active catalyst for Suzuki-Miyaura coupling reaction, J. Nanosci. Nanotechnol., 2010, 10, 6748–6751 CrossRef CAS PubMed.
- S. Guo, D. Wen, Y. Zhai, S. Dong and E. Wang, One-pot, rapid synthesis and used as new electrode material for electrochemical sensing, ACS Nano, 2010, 4, 3959–3968 CrossRef CAS PubMed.
- R. Muszynski, B. Seger and P. V. Kamat, Decorating graphene sheets with gold nanoparticles, J. Phys. Chem. C, 2008, 112, 5263–5266 CrossRef CAS.
- K. K. Manga, S. Wang, M. Jaiswal, Q. Bao and K. P. Loh, High-gain graphene-titanium oxide photoconductor made from inkjet printable ionic solution, Adv. Mater., 2010, 22, 5265–5270 CrossRef CAS PubMed.
- B. Li, H. Cao, J. Shao, M. Qu and J. H. Warner, Superparamagnetic Fe3O4 nanocrystals@graphene composites for energy storage devices, J. Mater. Chem., 2011, 21, 5069–5075 RSC.
- A. K. Mittal, Y. Chisti and U. C. Banerjee, Synthesis of metallic nanoparticles using plant extracts, Biotechnol. Adv., 2013, 31, 346–356 CrossRef CAS PubMed.
- S. Iravani, Green synthesis of metal nanoparticles using plants, Green Chem., 2011, 13, 2638–2650 RSC.
- B. Li, H. Cao and G. Yin, Mg(OH)2@reduced graphene oxide composite for removal of dyes from water, J. Mater. Chem., 2011, 21, 13765–13768 RSC.
- R. N. Briskman, A study of electrodeposited cuprous oxide photovoltaic cells, Sol. Energy Mater. Sol. Cells, 1992, 27, 361–368 CrossRef CAS.
- P. Poizot, S. Laruelle, S. Grugeon, L. Dupont and J. M. Tarascon, Nano-sized transition-metal oxides as negative- electrode materials for lithium-ion batteries, Nature, 2000, 407, 496–499 CrossRef CAS PubMed.
- J. Zhang, J. Liu, Q. Peng, X. Wang and Y. Li, Nearly monodisperse Cu2O and CuO nanospheres: Preparation and applications for sensitive gas sensors, Chem. Mater., 2006, 18, 867–871 CrossRef CAS.
- L. Wang, Z. Yang, Y. Cui, B. Wei, S. Xu, J. Sheng, M. Wang, Y. Zhu and W. Fei, Graphene-copper composite with micro-layered grains and ultrahigh strength, Sci. Rep., 2017, 7, 41896 CrossRef CAS PubMed.
- D. Zhang, C. Jiang, J. Liu and Y. Cao, Carbon monoxide gas sensing at room temperature using copper oxide-decorated graphene hybrid nanocomposite prepared by layer-by-layer self-assembly, Sens. Actuators, B, 2017, 247, 875–882 CrossRef CAS.
- B. Wang, X.-L. Wu, C.-Y. Shu, Y.-G. Guo and C.-R. Wang, Synthesis of CuO/graphene nanocomposite as a high-performance anode material for lithium-ion batteries, J. Mater. Chem., 2010, 20, 10661–10664 RSC.
- E. Cuara, U. Sierra, A. Mercado, E. D. B. Castro, A. Cortés, C. G. Vega, M. V. Orta and S. Fernández, Synthesis of copper oxides-graphene composites for glucose sensing, Carbon Trends, 2021, 4, 100050 CrossRef.
- B. Zhao, P. Liu, H. Zhuang, Z. Jiao, T. Fang, W. Xu, B. Lu and Y. Jiang, Hierarchical self-assembly of microscale leaf-like CuO on graphene sheets for high-performance electrochemical capacitors, J. Mater. Chem. A, 2013, 1, 367–373 RSC.
- S. Yallappa, J. Manjanna, M. A. Sindhe, N. D. Satyanarayan, S. N. Pramod and K. Nagaraja, Microwave assisted rapid synthesis and biological evaluation of stable copper nanoparticles using T. arjuna bark extract, Spectrochim. Acta, Part A, 2013, 110, 108–115 CrossRef CAS PubMed.
- M. Nasrollahzadeh, S. M. Sajadi and A. R. Vartooni, Green synthesis of CuO nanoparticles by aqueous extract of Anthemis nobilis flowers and their catalytic activity for the A3 coupling reaction, J. Colloid Interface Sci., 2015, 459, 183–188 CrossRef CAS PubMed.
- R. Saha, S. Karthik, K. S. Balu, R. Suriyaprabha, P. Siva and V. Rajendran, Influence of the various synthesis methods on the ZnO nanoparticles property made using the bark extract of Terminalia arjuna, Mater. Chem. Phys., 2018, 209, 208–216 CrossRef CAS.
- K. Gurushantha, K. S. Anantharaju, L. Renuka, S. C. Sharma, H. P. Nagaswarupa, S. C. Prashantha, Y. S. Vidya and H. Nagabhushana, New green synthesized reduced graphene oxide–ZrO2 composite as high performance photocatalyst under sunlight, RSC Adv., 2017, 7, 12690–12703 RSC.
- D. C. Marcano, D. V. Kosynkin, J. M. Berlin, A. Sinitskii, Z. Sun, A. Slesarev, L. B. Alemany, W. Lu and J. M. Tour, Improved synthesis of graphene oxide, ACS Nano, 2010, 4, 4806–4814 CrossRef CAS PubMed.
- G. Bhattacharya, S. Sas, S. Wadhwa, A. Mathur, J. McLaughlin and S. S. Roy, Aloe vera assisted facile green synthesis of reduced graphene oxide for electrochemical and dye removal applications, RSC Adv., 2017, 7, 26680–26688 RSC.
- S. Kaushal, N. Kaur, M. Kaur and P. P. Singh, Dual-responsive Pectin/Graphene Oxide (Pc/GO) nanocomposite as an efficient adsorbent for Cr (III) ions and photocatalyst for degradation of organic dyes in waste water, J. Photochem. Photobiol., A, 2020, 403, 112841 CrossRef CAS.
- M. K. Rabchinskii, V. V. Shnitov, A. T. Dideikin, A. E. Aleksenskii, S. P. Vul, M. V. Baidakova, I. I. Pronin, D. A. Kirilenko, P. N. Brunkov, J. Weise and S. L. Molodtsov, Nanoscale perforation of graphene oxide during photoreduction process in the argon atmosphere, J. Phys. Chem. C, 2016, 120, 28261–28269 CrossRef CAS.
- J. Singh, V. Kumar, K. H. Kim and M. Rawat, Biogenic synthesis of copper oxide nanoparticles using plant extract and its prodigious potential for photocatalytic degradation of dyes, Environ. Res., 2019, 177, 108569 CrossRef CAS PubMed.
- A. Abid, P. Sehrawat, S. S. Islam, P. Mishra and S. Ahmad, Reduced graphene oxide (rGO) based wideband optical sensor and the role of Temperature, Defect States and Quantum Efficiency, Sci. Rep., 2018, 8, 3537 CrossRef PubMed.
- Z. Nazila and R. Rasuli, Anchored Cu2O nanoparticles on graphene sheets as an inorganic hole transport layer for improvement in solar cell performance, Appl. Phys. A: Mater. Sci. Process., 2018, 124, 814 CrossRef.
- C. Tamuly, I. Saikia, M. Hazarika and M. R. Das, Reduction of aromatic nitro compounds catalyzed by biogenic CuO nanoparticles, RSC Adv., 2014, 4, 53229–53236 RSC.
- Y. Wang, T. Jiang, D. Meng, J. Kong, H. Jia and M. Yu, Controllable fabrication of nanostructured copper compound on a Cu substrate by a one-step route, RSC Adv., 2015, 5, 16277–16283 RSC.
- L. Shahriary and A. A. Athawale, Synthesis of graphene using gamma radiations, Bull. Mater. Sci., 2015, 38, 739–745 CrossRef CAS.
- Q. Zhou, J. Huang, J. Wang, Z. Yang, S. Liu, Z. Wang and S. Yang, Preparation of a reduced graphene oxide/zirconia nanocomposite and its application as a novel lubricant oil additive, RSC Adv., 2015, 5, 91802–91812 RSC.
- Y. Zhao, X. Song, Q. Song and Z. Yin, A facile route to the synthesis copper oxide/reduced graphene oxide nanocomposites and electrochemical detection of catechol organic pollutant, CrystEngComm, 2012, 14, 6710–6719 RSC.
- H.-J. Chu, C.-Y. Lee and N.-H. Tai, Green reduction of graphene oxide by Hibiscus sabdariffa L. to fabricate flexible graphene electrode, Carbon, 2014, 80, 725–733 CrossRef CAS.
- B. Gupta, N. Kumar, K. Panda, V. Kanan, S. Joshi and I. V. Fisher, Role of oxygen functional groups in reduced graphene oxide for lubrication, Sci. Rep., 2017, 7, 45030 CrossRef CAS PubMed.
- Y. Zhan, F. Meng, Y. Lei, R. Zhao, J. Zhong and X. Liu, One-pot solvothermal synthesis of sandwich-like graphene nanosheets/Fe3O4 hybrid material and its microwave electromagnetic properties, Mater. Lett., 2011, 65, 1737–1740 CrossRef CAS.
- D. Das, B. C. Nath, P. Phukon and S. K. Dolui, Synthesis and evaluation of antioxidant and antibacterial behavior of CuO nanoparticles, Colloids Surf., B, 2013, 101, 430–433 CrossRef CAS PubMed.
- R. Chowdhury, A. Khan and M. H. Rashid, Green synthesis of CuO nanoparticles using Lantana camara flower extract and their potential catalytic activity towards the aza-Michael reaction, RSC Adv., 2020, 10, 14374–14385 RSC.
- S. Ahmad, A. Ahmad, S. Khan, S. Ahmad, I. Khan, S. Zada and P. Fu, Algal Extracts Based Biogenic Synthesis of Reduced Graphene Oxides (rGO) with Enhanced Heavy Metals Adsorption Capability, J. Ind. Eng. Chem., 2019, 72, 117–124 CrossRef CAS.
- R. Shi, M. Ren, H. Li, J. Zhao, S. Liu, Z. Li and J. Ren, Graphene supported Cu nanoparticles as catalysts for the synthesis of dimethyl carbonate: Effect of carbon black intercalation, Mol. Catal., 2018, 445, 257–268 CrossRef CAS.
- P. Singh, P. Nath, R. K. Arun, S. Mandal and N. Chanda, Novel synthesis of mixed Cu/CuO-reduced graphene oxide nanocomposite with enhanced peroxidase-like catalytic activity for easy detection of glutathione in solution and using paper strip, RSC Adv., 2016, 6, 92729–92738 RSC.
- M. V. Dinu and E. S. Dragan, Evaluation of Cu2+, Co2+ and Ni2+ ions removal from aqueous solution using a novel chitosan/clinoptilolite composite: Kinetics and isotherms, Chem. Eng. J., 2010, 160, 157–163 CrossRef CAS.
- A. Sharma, M. Singh, K. Arora, P. P. Singh, R. Badru, T. S. Kang and S. Kaushal, Preparation of cellulose acetate-Sn(IV) iodophosphate nanocomposite for efficient and selective removal of Hg2+ and Mn2+ ions from aqueous solution, Environ. Nanotechnol. Monit. Manage., 2021, 16, 100478 Search PubMed.
- S. Morimoto, F. B. W. Rebello de Sampaio, M. M. Braga, N. Sesma and M. Özcan, Survival rate of resin and ceramic inlays, onlays, and overlays: a systematic review and meta-analysis, J. Dent. Res., 2016, 95, 985–994 CrossRef CAS PubMed.
- C.-X. Gui, Q.-Q. Wang, S.-M. Hao, J. Qu, P.-P. Huang, C.-Y. Cao, W.-G. Song and Z.-Z. Yu, Sandwich like magnesium Silicate/reduced graphene oxide nanocomposite for enhanced Pb2+ and methylene blue adsorption, ACS Appl. Mater. Interfaces, 2014, 6, 14653–14659 CrossRef CAS PubMed.
- S. Singh, S. Kaushal, J. Kaur, G. Kaur, S. K. Mittal and P. P. Singh, CaFu MOF as an efficient adsorbent for simultaneous removal of imidacloprid pesticide and cadmium ions from wastewater, Chemosphere, 2021, 272, 129648 CrossRef CAS PubMed.
- M. Xu, P. Hadi, G. Chen and G. McKay, Removal of cadmium ions from wastewater using innovative electronic waste-derived material, J. Hazard. Mater., 2014, 273, 118–123 CrossRef CAS PubMed.
- M. R. Awual, Solid phase sensitive palladium (II) ions detection and recovery using ligand based efficient conjugate nanomaterials, Chem. Eng. J., 2016, 300, 264–272 CrossRef CAS.
- M. R. Awual, M. A. Shenashen, T. Yaita, H. Shiwaku and A. Jyo, Efficient arsenic (V) removal from water by ligand exchange fibrous adsorbent, Water Res., 2012, 46, 5541–5550 CrossRef CAS PubMed.
- I. Langmuir, The constitution and fundamental properties of solids and liquids. ii. liquids, J. Am. Chem. Soc., 1917, 39, 1848–1906 CrossRef CAS.
- M. R. Awual, M. Khraisheh, N. H. Alharthi, M. Luqman, A. Islam, M. R. Karim, M. M. Rahman and M. A. Khaleque, Efficient detection and adsorption of cadmium(II) ions using innovative nano-composite materials, Chem. Eng. J., 2018, 343, 118–127 CrossRef CAS.
- M. Ikram, A. Raza, M. Imran, A. U. Hamid, A. Shahbaz and S. Ali, Hydrothermal Synthesis of Silver Decorated Reduced Graphene Oxide (rGO) Nanoflakes with Effective Photocatalytic Activity for Wastewater Treatment, Nanoscale Res. Lett., 2020, 15, 95 CrossRef PubMed.
- Y. He, F. Grieser and M. A. Kumar, The mechanism of sonophotocatalytic degradation of methyl orange and its products in aqueous solutions, Ultrason. Sonochem., 2011, 18, 974–980 CrossRef CAS PubMed.
- K. Dai, H. Chen, T. Peng, D. Ke and H. Yi, Photocatalytic degradation of methyl orange in aqueous suspension of mesoporous titania nanoparticles, Chemosphere, 2007, 69, 1361–1367 CrossRef CAS PubMed.
- A. Borhade, D. Tope and S. Kushare, Mercenaria Shell Powder as a Cost-Effective and Eco-friendly Photocatalyst for the Degradation of Eriochrome Black T Dye, Iran. J. Sci. Technol., Trans. A: Sci., 2019, 44, 1–9 Search PubMed.
- Y. S. Ho and G. McKay, Pseudo-second order model for sorption processes, Process Biochem., 1999, 34, 451–465 CrossRef CAS.
- K. Huang, Y. H. Li, S. Lin, C. Liang, H. Wang, C. X. Ye, Y. J. Wang, R. Zhang, D. Y. Fan, H. J. Yang, Y. G. Wang and M. Lei, A facile route to reduced graphene oxide–zinc oxide nanorod composites with enhanced photocatalytic activity, Powder Technol., 2014, 257, 113–119 CrossRef CAS.
- C. R. da Cunha, G. H. Toffolo, C. E. I. dos Santos and R. P. Pezzi, Structural, optical and chemical characterizations of sol-gel grown tin oxide aerogels, J. Non-Cryst. Solids, 2013, 380, 48–52 CrossRef CAS.
- H. Wu, S. Lin, C. Chen, W. Liang, X. Liu and H. Yang, A new ZnO/rGO/polyaniline/ternary nanocomposite as photocatalyst with improved photocatalytic activity, Mater. Res. Bull., 2016, 83, 434–441 CrossRef CAS.
- H. Zhang, P. Xu, G. Du, Z. Chen, K. Oh, D. Pan and Z. Jiao, A facile one-step synthesis of TiO2/graphene composites for photodegradation of methyl orange, Nano Res., 2011, 4, 274–283 CrossRef CAS.
Footnote |
| † Electronic supplementary information (ESI) available. See DOI: 10.1039/d1ma00993a |
| This journal is © The Royal Society of Chemistry 2022 |

