
 Open Access Article
 This Open Access Article is licensed under a Creative Commons Attribution-Non Commercial 3.0 Unported Licence
Aqueous zinc ion batteries based on sodium vanadate electrode materials with long lifespan and high energy density
Chengkang
Luo
a,
Li
Xiao
*a and
Xiang
Wu
 *ab
*ab
aSchool of Materials Science and Engineering, Shenyang University of Technology, Shenyang 110870, P. R. China. E-mail: xiao.li@sut.edu.cn; wuxiang05@sut.edu.cn
bKey Laboratory of Superlight Materials and Surface Technology, Ministry of Education, Harbin Engineering University, Harbin 150001, P. R. China
First published on 11th November 2021
Abstract
With the excessive consumption of non-renewable energy sources and subsequent environmental pollution, research focuses have shifted to the development of emerging energy storage devices with desired performance. Aqueous zinc-ion batteries (AZIBs) are expected to become potential alternatives due to their high safety, low cost and environmental friendliness. In this work, we have prepared Na7V7.6O20·4H2O (NVO) nanobelts by a facile hydrothermal route. NVO/Zn batteries have been assembled with the as-obtained product as cathodes, which deliver a capacity of 309.4 mA h g−1 at 0.3 A g−1. They maintain excellent cycling stability after 10![[thin space (1/6-em)]](https://www.rsc.org/images/entities/char_2009.gif) 000 cycles at 10 A g−1.
000 cycles at 10 A g−1.
1. Introduction
It is well known that traditional fossil energy is non-renewable and its overuse will inevitably lead to the quick depletion of energy resources.1–4 Therefore, developing emerging energy storage devices is imperative to effectively alleviate the energy crisis. For instance, commercial lithium-ion batteries (LIBs) have been widely used in portable electronic devices such as mobile phones, computers and wearable watches.5,6 However, the application of LIBs is largely restricted due to the scarcity of lithium reserves, its high price and poor safety.7,8 Therefore, metal ion batteries with high energy densities have attracted widespread attention.9 Among the various multivalent ion systems (Al3+,10 Mg2+,11,12 Ca2+13,14 and Zn2+15), AZIBs show high theoretical capacity (820 mA h g−1), low redox potential (−0.76 V vs. SHE) and excellent cycle stability.16 Recently, some progress has been achieved in developing cathode materials for ZIBs, such as manganese oxide,17,18 vanadium compounds,19,20 Prussian blue analogs,21 and polyanionic compounds.22Therefore, it is important to further study vanadium-based cathodes because of their high capacity and rich oxidation states.23–25 They mainly include V2O5,26 VO2,27 and vanadates.28–31 However, their poor energy density and sluggish ion transfer speed have not been well resolved. For these reasons, some efforts have been made. In the literature, Wang et al. prepared a composite of V2O5 and carbon nanotube film (CNF@V2O5). The as-assembled device delivers a specific capacity of 356.6 mA h g−1 at 0.4 A g−1 and maintains 80.1% of the initial capacity after 500 cycles at 2 A g−1.32 Jia and coworkers fixed VO2·0.2H2O on graphene sheets using a microwave-assisted strategy. The assembled battery shows a capacity of 423 mA h g−1 at 0.25 A g−1 and a discharge capacity retention rate of 87% after 1000 cycles at 8 A g−1.33 In addition, Na1.1V3O7.9 nanorods were obtained by Zhou's group. Using the obtained product as the cathode, the cells possess a capacity of 134 mA h g−1 after 1000 cycles at 5 A g−1.34
Herein, we prepared NVO nanobelts using C6H8O7·H2O as the binding agent. The obtained NVO as an electrode material not only maintains a stable structure during charging and discharging but also shows an energy density of 433.02 W h kg−1 at a power density of 420 W kg−1 at 0.3 A g−1. Furthermore, the assembled NVO/Zn batteries deliver a high capacity of 309.4 mA h g−1 at 0.3 A g−1 and a capacity retention rate of 98.56% after 10000 cycles at 10 A g−1, suggesting their excellent rate performance.
2. Experimental section
2.1 Material preparation
All chemicals were used as purchased without further purification. Firstly, 10 mmol NaVO3 was added into 60 mL deionized water and stirred at room temperature for 40 min. Subsequently, 8 mmol C6H8O7·H2O and 20 mmol Na2S2O8 were poured into the above solution and stirred for 1 h. Finally, the clear solution was transferred into a 100 mL Teflon-lined autoclave and heated at 180 °C for 6 h. After cooling to room temperature, the obtained precipitate was washed many times with deionized water. Then it was dried in an oven.2.2 Structural characterization
The morphology and element analysis of the products were studied by field emission scanning electron microscopy (FESEM, Gemini 300) and transmission electron microscopy (TEM, JEM-F200) equipped with energy dispersive spectroscopy (EDS). The crystal structure of the sample was analyzed using X-ray diffraction (XRD, Bruker D2) and X-ray photoelectron spectroscopy (XPS, Thermo Fisher ESCALAB XI+).2.3 Electrochemical measurement
The cathode, zinc anode and separator were assembled in 2032-type coin cells in air. The cathode was prepared by mixing the NVO, Ketjen black (KB) and polyvinylidene fluoride (PVDF) with a weight ratio of 7:2:1 in N-methyl-l-2-pyrrolidone (NMP) solvent. The obtained slurry was subjected to magnetic stirring for 8 h to mix it uniformly. The slurry was coated evenly on a carbon paper as the cathode, and then placed it in a 60 °C vacuum drying oven for a night. A zinc sheet with a thickness of 100 μm was used as the anode, and glass fiber was used as the intermediate separator. The devices were assembled using 4 M Zn(CF3SO3)2 aqueous electrolyte. The cyclic voltammetry (CV) performance curves were tested in a CHI760E electrochemical workstation. The galvanostatic charge–discharge (GCD) curves, long-cycle stability and galvanostatic intermittent titration technique (GITT) were characterized by a LAND-CT3001 automatic battery tester with the voltage range of 0.2–1.6 V. The average loading of the cathode active material is about 1.3 mg.
3. Results and discussion
The crystal structure of the sample was first studied by XRD. The diffraction peaks (Fig. 1a) locate at 2θ = 8.25° (001), 24.7° (003), 25.64° (110), 33.13° (004), 33.21° (−204), 34.38° (401), 14.77° (005), 46.87° (−602), 50.02° (020), 61.1° (−712) and 64.32° (−407). These peaks are consistent with NVO (PDF#85-1407). Except these, there are no other impurity peaks, demonstrating the high purity of the prepared sample. Then, XPS was used to further investigate the oxidation states of the Na, V, and O elements. The high resolution XPS of Na 1s (Fig. 1b) only shows a sharp peak (1071.35 eV), indicating that Na+ is the only existing form of the Na element. For V 2p, as shown in Fig. 1c, the diffraction peaks of V 2p3/2 and V 2p1/2 are all fitted into V+5 and V+4. There are three diffraction peaks that appear in the XPS spectra of O 1s (529.6 eV, 530 eV, and 530.5 eV), as shown in Fig. 1d. They can be ascribed to V–O, OH− and low-coordination oxygen ions, respectively.35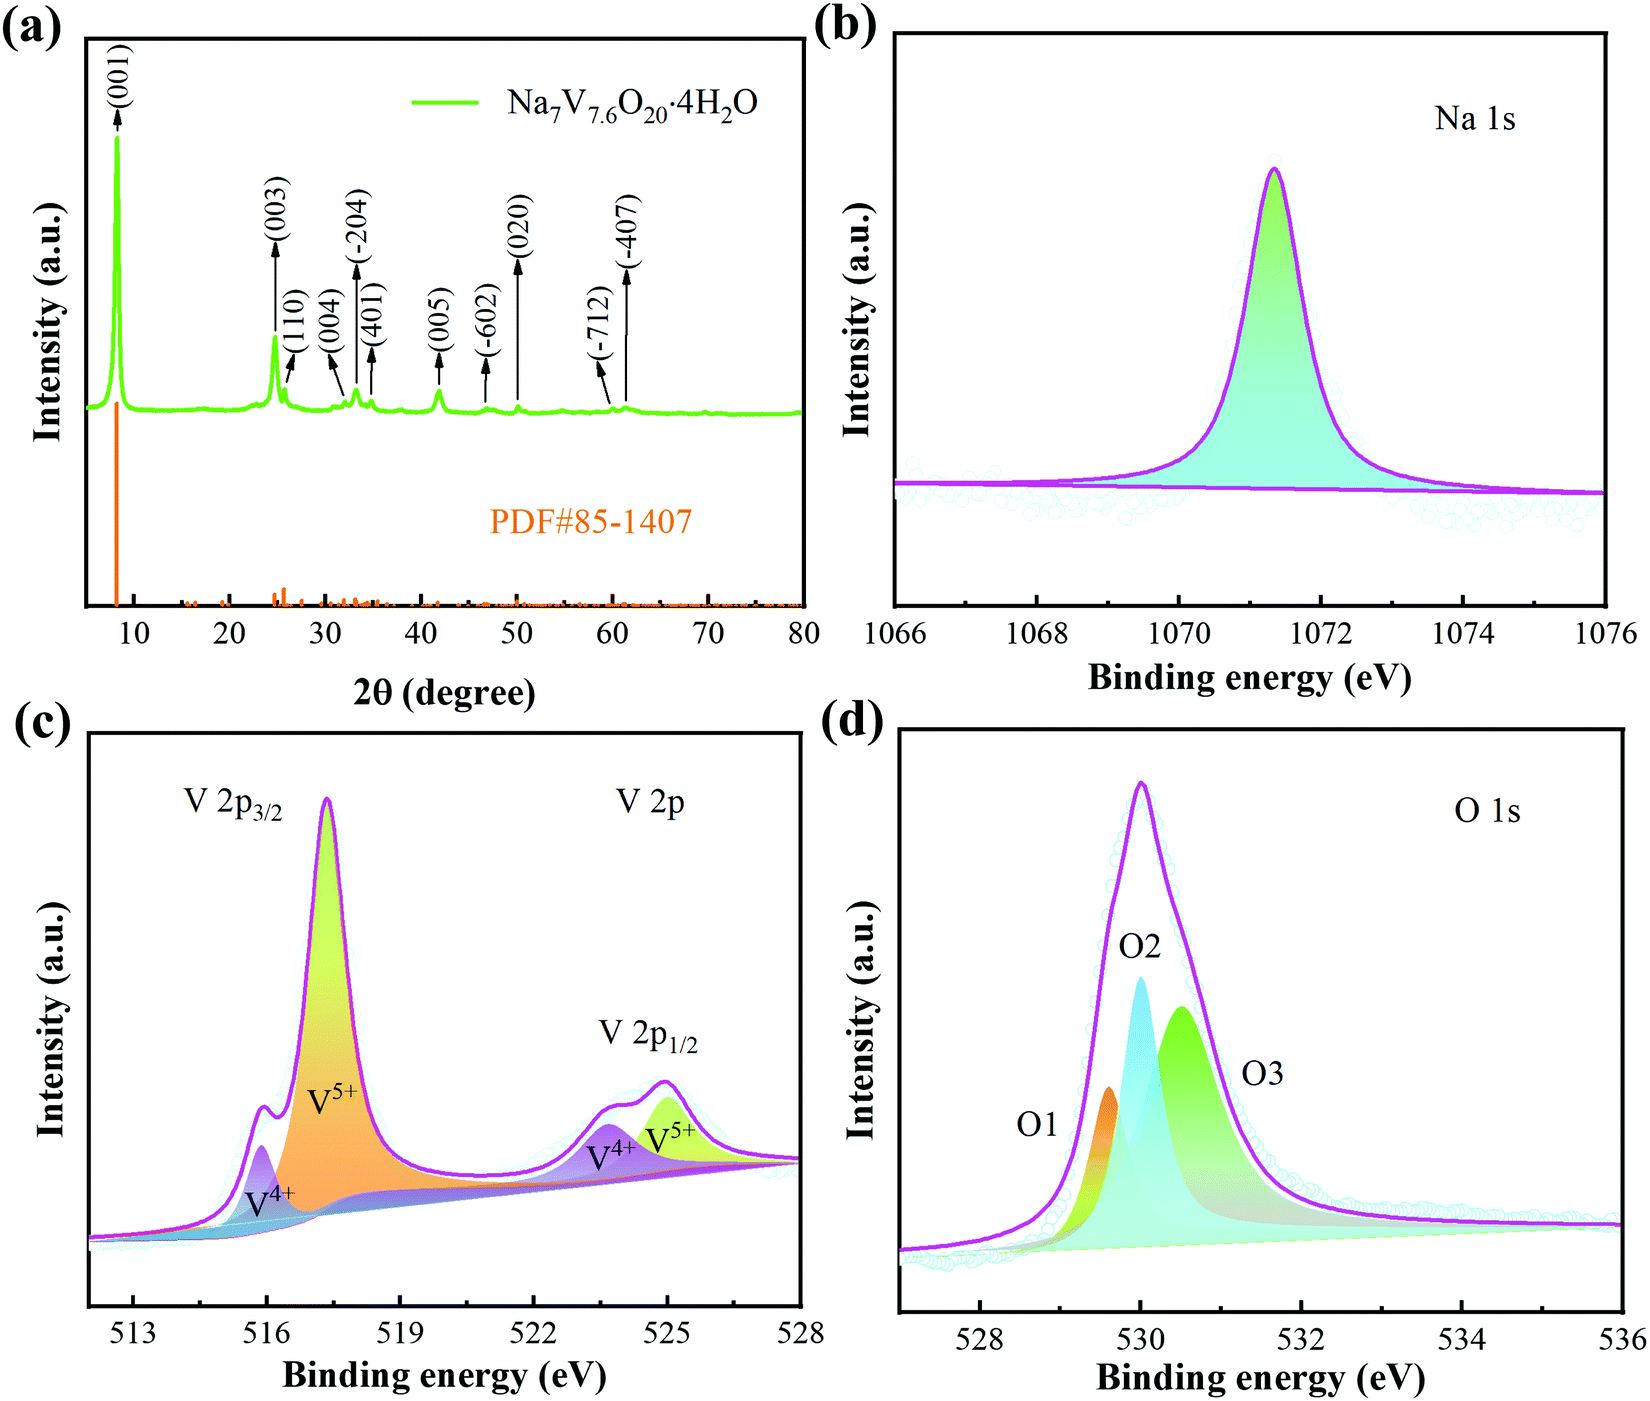 | ||
| Fig. 1 Structural characterization of the samples. (a) XRD patterns. (b–d) XPS spectra of Na 1s, V 2p and O 1s. | ||
Subsequently, we used SEM to observe the morphology of the product. It was found that the prepared NVO product shows a belt-like shape (Fig. 2a and b). TEM was used to further study the microstructures of the sample. Fig. 2c is a low magnification TEM image, revealing that the products possess a rectangular feature. The HRTEM image (Fig. 2d) show that the interplanar spacing is 0.193 nm, which can be indexed to the (−602) plane (PDF#85-1407). The SAED image (the inset in Fig. 2d) suggests the single crystalline structure of the sample. The element mapping in Fig. 2e proves the uniform distribution of the Na, V, and O elements in the product.
 | ||
| Fig. 2 Morphology and structure characterization of the samples. (a and b) SEM images. (c) TEM image. (d) HRTEM image. (e) The corresponding elemental mappings of Na, V and O. | ||
In order to test the electrochemical performance characteristics of the sample, the batteries were assembled using obtained NVO as the cathode in a 4 M Zn(CF3SO3)2 electrolyte. Fig. 3a shows the first five cycles of the CV curves with a potential of 0.2–1.6 V at 0.5 mV s−1. The corresponding oxidation peaks locate at 0.548 V, 0.735 V, 0.988 V, 1.061 V, 1.362 V and 1.432 V. The reduction peaks appear at 1.328 V, 0.961 V, 0.82 V, 0.59 V and 0.397 V. It is found that the shapes of the curves in the first cycle and the last four cycles are different, revealing that the oxidation-reduction reaction in the first circle is irreversible. The rate performance of the device is shown in Fig. 3b. As the current density varies from 0.3 to 10 A g−1, the discharge specific capacity of the device gradually decreases from 309.4 to 240.4 mA h g−1. The small capacity change during whole reaction process indicates that the device shows a little capacity loss at different current densities. The GCD curves of the battery at different current densities (Fig. 3c) are consistent with the rate curves. Fig. 3d gives the cycling time dependent on the GCD curves at 1 A g−1. The results show that the capacity of the device increases with the increase in cycling time, which can be attributed to the activation behavior of NVO in the electrolyte. Moreover, the shapes of the GCD curves remain unchanged, suggesting the highly reversible redox reaction during the entire charge–discharge cycling.
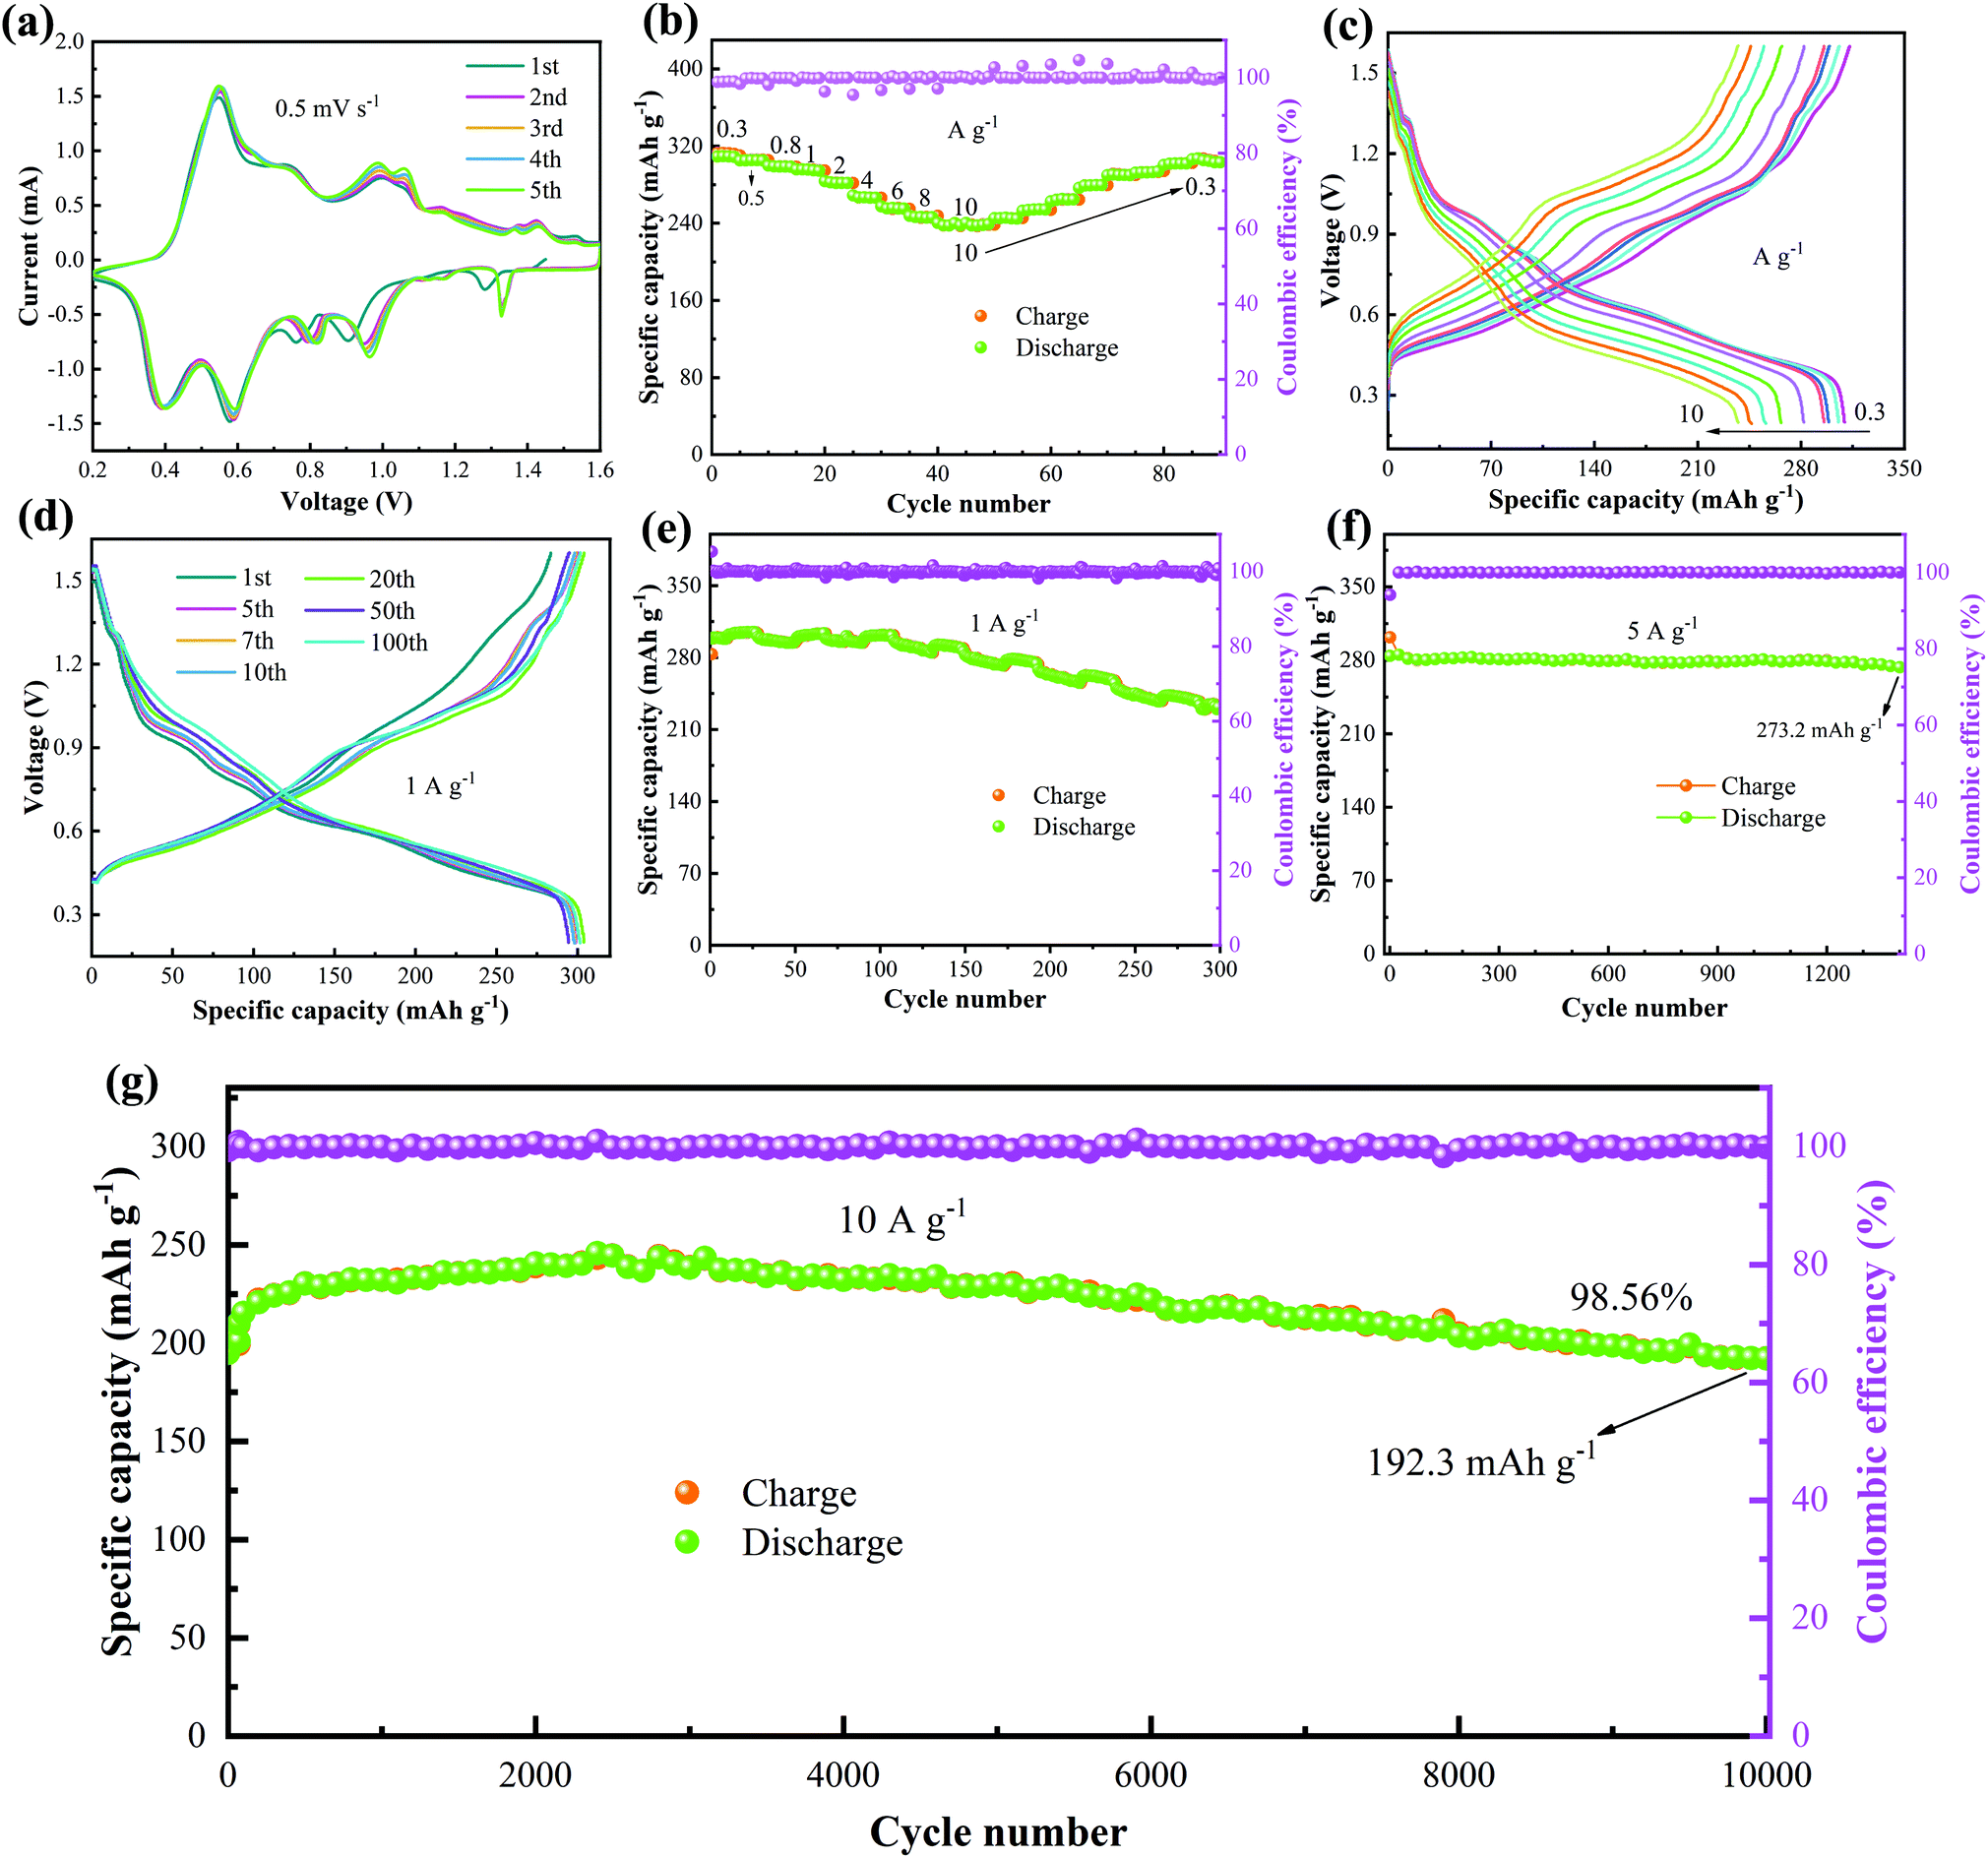 | ||
| Fig. 3 Electrochemical performance of the electrodes. (a) CV curves of the first 5 cycles at 0.5 mV s−1, (b and c) rate capability and GCD curves at different current densities, (d) GCD curves of various cycles at 1 A g−1, (e) cycling performance at 1 A g−1, (f) cycling performance at 5 A g−1, and (g) long-term cycles at 10 A g−1. | ||
The cycling stability of the NVO/Zn batteries was also tested at different current densities. The cycling tests at 1 A g−1 (Fig. 3e) show that the initial specific capacity is 298.5 mA h g−1, and the largest specific capacity of 301.5 mA h g−1 is obtained after 100 cycles. The devices can still show a specific capacity of 231.8 mA h g−1 after 300 cycles, and the capacity retention rate is 77.6%. Fig. 3f shows the cycle performance of the battery at 5 A g−1. After 1400 cycles, the specific discharge capacity of the cell does not decrease significantly. We then studied the long-cycle performance of the NVO/Zn battery at 10 A g−1. The initial discharge capacity is 195.1 mA h g−1. The capacity of the device reaches a maximum capacity of 243.5 mA h g−1 at 3000 cycles and then decreases gradually to 192.3 mA h g−1 at 10000 cycles, as shown in Fig. 3g. The capacity retention rate is 98.56% during this process. The Coulombic efficiency always remains above 99%. The rate performance and cycling stability is better than several reported vanadium-based materials (Table 1).36–42
| Cathode material | Rate performance (mA h g−1) | Retention, %/cycle | Ref. |
|---|---|---|---|
| Na7V7.6O20·4H2O | 240.4 (10 A g−1) | 98.56/10000 (10 A g−1) |
This work |
| Zn3V3O8 | 141 (5 A g−1) | 72.6/2000 (5 A g−1) | 36 |
| Al0.2V2O5 | 143.7 (10 A g−1) | 61.4/5000 (6 A g−1) | 37 |
| Cu0.26V2O5@C | 163.8 (2 A g−1) | 93.5/500 (2 A g−1) | 38 |
| Na1.25V3O8 | 162 (10 A g−1) | 88.2/2000 (10 A g−1) | 39 |
| rGO/δ-NaxV2O5·nH2O | 244.1 (5 A g−1) | 70.5/1000 (5 A g−1) | 40 |
| V2O5·4VO2·2.72H2O | 215 (10 A g−1) | 94.0/1000 (10 A g−1) | 41 |
| K2V8O20 | 92 (4 A g−1) | 83/300 (6 A g−1) | 42 |
To evaluate the electrochemical reaction kinetics of the NVO/Zn battery, the CV curves were tested at different scan rates (from 0.6 to 1 mV s−1) (Fig. 4a). The integral areas of the CV curves increase as the scanning speed rises, demonstrating the multi-step process of the deintercalation/intercalation of Zn2+. In addition, the oxidation and reduction peaks shift to the high voltage and low voltage regions, respectively. Fig. 4b is obtained by fitting the currents at different redox peaks, where peaks 1, 2, 3, and 4 correspond to their respective ones in Fig. 4a. The correlation between the peak current (i) and scan rate (v) abide by the following formula:
| i = avb | (1) |
 | ||
| Fig. 4 The electrochemical reaction kinetics of the batteries. (a) CV curves at various scan rates, (b) the fitting plots of log (i) and log (v), (c) the capacitive contribution ratio at various scan rates, (d) GITT curves, (e) Zn2+ diffusion coefficient, and (f) Ragone plot. | ||
When the b value is 0.5, the charge storage can be expressed as diffusion control behavior. When b = 1, it is thought to be a capacitive process. The calculated b values of peaks 1, 2, 3, and 4 are 0.6574, 0.9529, 0.5976, and 0.8396, respectively. The value of b is between 0.5 and 1, indicating that pseudo-capacitance is dominant during the charge storage process. The ratio of surface and diffusion control contribution can be obtained according to the formula:
| i = k1v + k2v1/2 | (2) |
The diffusion coefficient of Zn2+ (DZn2+) of the NVO electrode was then calculated from the obtained GITT curves. Firstly, the NVO/Zn batteries are charged or discharged at 0.3 A g−1 for 3 min, and then rested for 7 min to make the voltage reach steady. This process is repeated to obtain the GITT curves during battery operation (Fig. 4d). The calculated DZn2+ is shown in Fig. 4e according to the formula:
 | (3) |
000 W kg−1 at 10 A g−1, it still maintains an energy density of 336.56 W h kg−1. The Ragone plot (Fig. 4f) lists the energy densities of several vanadium-based materials (NH4V4O10,48 V2O5@ppy,49 Zn2V2O7,50 V5O12·6H2O,51 Ca0.25V2O5,52 AlV3O953 and V3O7/V2O554). It is obvious that the energy density and power density of the obtained NVO are better than those cathodes as well as some other materials.55–57
Finally, we investigated the dynamic migration process of Zn2+. The ex situ XRD patterns (Fig. 5a) indicate the structural evolution of the NVO electrode during charging and discharging. It can be seen that the diffraction peaks of the (001) crystal plane show an angle red shift after the first discharge to 0.2 V. It reveals the strong electrostatic force between the intercalation of Zn2+ and the cathode during the first discharge. The (001) plane returns to its original state gradually with the process of charging to 1.6 V. The angles of the (001) plane only slightly shift when the second discharge is performed, indicating that the intercalation of Zn2+ does not significantly change the crystal plane spacing. It further proves the excellent structural stability of the electrode materials during the charge–discharge process. Besides this, there are several new diffraction peaks during the first discharge process, revealing the formation of interphase Znx(CF3SO3)y(OH)2−y.58 During the subsequent charging to 1.6 V, the diffraction peaks of the interphase gradually disappear, indicating the high reversibility of the interphase during the entire cycle.
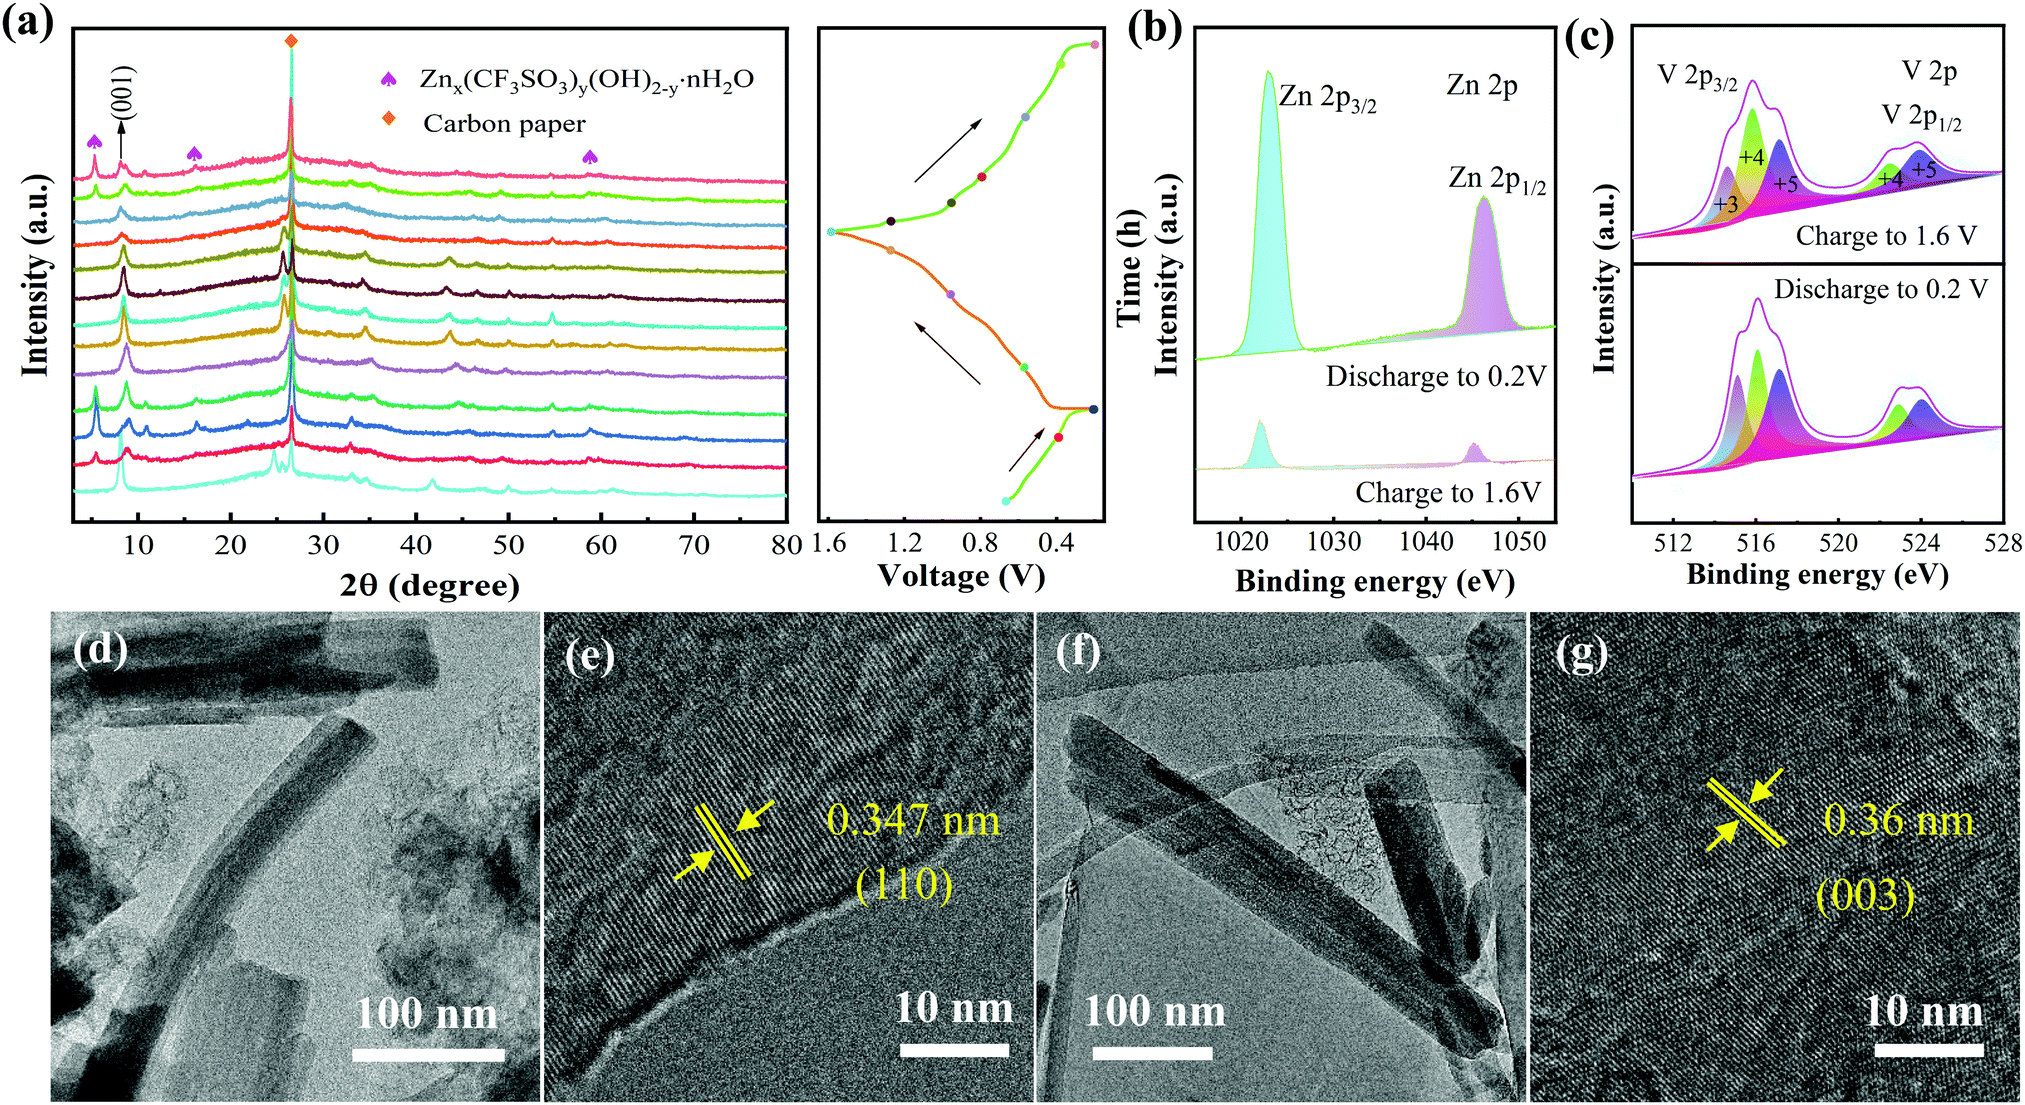 | ||
| Fig. 5 The reaction mechanism of the batteries. (a) Ex situ XRD patterns at various charge/discharge states. (b and c) XPS of Zn 2p and V 2p at the charge–discharge states. (d–g) TEM images of the sample discharging at 0.2 V and charging at 1.6 V. | ||
To study the valence state and surface composition of the NVO electrode, ex situ XPS tests were performed on the cathode in different charging/discharging states. As shown in Fig. 5b, the strong signals of Zn 2p3/2 (1022.9 eV) and Zn 2p1/2 (1045.9 eV) appear during the discharge to 0.2 V. The peak intensity decreased significantly during charging to 1.6 V, demonstrating that Zn ions are successfully inserted into the cathode. Fig. 5c shows the high-resolution XPS spectra of V 2p at the charging and discharging states. The peaks at V 2p3/2 can be fitted by V+3 (515.5 eV), V+4 (516 eV) and V+5 (516.8 eV), while the peaks at V 2p1/2 are only fitted by V+4 (522.15 eV) and V+5 (523.75 eV). In the fully charged and discharged states, the peak areas change at different valence states. In discharging to 0.2 V, the V+4 signals weaken and the signals of V+3 and V+5 strengthen. The signals of V+3 and V+5 gradually increase and the signal of V+4 decreases when charging to 1.6 V. It shows that the oxidation-reduction reactions of the V element are highly reversible during the cycle.59 The structural characteristics of the electrode were tested again using TEM. Fig. 5d and e and Fig. 5f and g show the TEM images of the electrode discharged to 0.2 V and charged to 1.6 V, respectively. During the discharge to 0.2 V, the structure of the NVO is maintained well and the interplanar spacing of the (110) plane is 0.347 nm, suggesting that the intercalation of Zn2+ does not obviously change the interplanar spacing. The interplanar spacing of the (003) plane is 0.36 nm after the release of Zn2+, proving the excellent structural stability of the NVO products.
4. Conclusion
In summary, we have prepared NVO nanobelts using a simple one-step hydrothermal strategy. The obtained NVO product can maintain superior structural stability after the intercalation of zinc ions. It also enhances the transfer rate of Zn2+ inside the cathode. The assembled batteries show high rate performance, fast electrochemical reaction kinetics and a long-term cycle lifespan. The subsequent TEM observation of the electrode materials proves that the NVO electrode maintains unchanged structural characteristics during the charge–discharge process. It suggests that the battery assembled by the as-prepared product can be utilized in future portable micro/nanodevices.Author contributions
Chengkang Luo: conceptualization, methodology, software, data processing, writing – original draft preparation. Chengkang Luo and Li Xiao: visualization, investigation. Xiang Wu: validation, supervision, writing – review & editing.Conflicts of interest
The authors declare that they have no known competing financial interests.Acknowledgements
The work is supported by the National Natural Science Foundation of China (No. 52172218), the Open Project Program of Key Laboratory of Superlight Materials and Surface Technology, Ministry of Education, Harbin Engineering University (HEU10202118).References
- J. Ming, J. Guo, C. Xia, W. X. Wang and H. N. Alshareef, Mater. Sci. Eng., R, 2019, 135, 58–84 CrossRef.
- L. L. Fan, Z. H. Li and W. M. Kang, ACS Sustainable Chem. Eng., 2021, 9, 5095–5104 CrossRef CAS.
- X. Y. Liang, L. J. Yan, W. P. Li, Y. C. Bai, C. Zhu, Y. J. Qiang, B. X. Xiong, B. Xiang and X. F. Zou, Nano Energy, 2021, 87, 106164 CrossRef CAS.
- X. Wang, Z. C. Y. Zhang, B. J. Xi, W. H. Chen, Y. X. Jia, J. K. Feng and S. L. Xiong, ACS Nano, 2021, 15, 9244–9272 CrossRef PubMed.
- J. Zhou, A. Q. Dong, L. Du, C. C. Yang, L. Ye, X. Wang, L. J. Zhao and Q. Jiang, Chem. Eng. J., 2021, 421, 127770 CrossRef CAS.
- C. Liu, X. Wu and B. Wang, Chem. Eng. J., 2020, 392, 123651 CrossRef CAS.
- Y. Ru, S. S. Zheng, H. G. Xue and H. Pang, Mater. Today Chem., 2021, 21, 100513 CrossRef CAS.
- Y. Liu and X. Wu, J. Energy Chem., 2021, 56, 223–237 CrossRef.
- L. S. Zhang, J. S. Hu, B. Zhang, J. Liu, H. Z. Wan, L. Miao and J. J. Jiang, J. Mater. Chem. A, 2021, 9, 7631–7639 RSC.
- T. T. Wei, P. P. Peng, S. Y. Qi, Y. R. Zhu and T. F. Yi, J. Energy Chem., 2021, 57, 169–188 CrossRef.
- Z. Q. Guo, S. Q. Zhao, T. X. Li, D. W. Su, S. G. Guo and G. X. Wang, Adv. Energy Mater., 2020, 10, 1903591 CrossRef CAS.
- Y. C. Tang, X. J. Li, H. M. Lv, W. L. Wang, Q. Yang, C. Y. Zhi and H. F. Li, Angew. Chem., Int. Ed., 2021, 60, 5443–5452 CrossRef CAS.
- B. F. Ji, H. Y. He, W. J. Yao and Y. B. Tang, Adv. Mater., 2020, 33, 2005501 CrossRef.
- C. P. Han, H. F. Li, Y. Li, J. X. Zhu and C. Y. Zhi, Nat. Commun., 2021, 12, 2400 CrossRef CAS PubMed.
- D. Chen, M. J. Lu, D. Cai, H. Yang and W. Han, J. Energy Chem., 2021, 54, 712–726 CrossRef.
- X. R. Wang, G. Q. Tan, Y. Bai, F. Wu and C. Wu, Electrochem. Energy Rev., 2020, 4, 35–66 CrossRef.
- Y. Liu and X. Wu, Chin. Chem. Lett., 2021 DOI:10.1016/j.cclet.2021.08.081.
- W. B. Liu, X. Y. Zhang, Y. F. Huang, B. Z. Jiang, Z. W. Chang, C. G. Xu and F. Y. Kang, J. Energy Chem., 2021, 56, 365–373 CrossRef.
- Y. Liu and X. Wu, Nano Energy, 2021, 86, 106124 CrossRef CAS.
- N. Liu, B. Li, Z. X. He, L. Dai, H. Y. Wang and L. Wang, J. Energy Chem., 2021, 59, 134–159 CrossRef.
- G. Y. Du and H. Pang, Energy Storage Mater., 2021, 36, 387–408 CrossRef.
- T. Sun, Z. J. Li, Y. F. Zhi, Y. J. Huang, H. J. Fan and Q. C. Zhang, Adv. Funct. Mater., 2021, 31, 2010049 CrossRef CAS.
- W. C. Bi, G. H. Gao, G. M. Wu, M. Atif, M. S. AlSalhi and G. Z. Cao, Energy Storage Mater., 2021, 40, 209–218 CrossRef.
- Y. Y. Liu, T. T. Lv, H. Wang, X. T. Guo, C. S. Liu and H. Pang, Chem. Eng. J., 2021, 417, 128408 CrossRef CAS.
- Y. Li, D. H. Zhang, S. Z. Huang and H. Y. Yang, Nano Energy, 2021, 85, 105969 CrossRef CAS.
- Y. Liu, Y. Liu, Y. Yamauchi, Z. A. Alothman, Y. V. Kaneti and X. Wu, Batteries Supercaps, 2021 DOI:10.1002/batt.202100172.
- Y. Liu, P. Hu, H. Liu, X. Wu and C. Zhi, Mater. Today Energy, 2020, 17, 100431 CrossRef.
- X. Q. Shan, S. W. Kim, A. M. M. Abeykoon, G. Kwon, D. Olds and X. W. Teng, ACS Appl. Mater. Interfaces, 2020, 12, 54627–54636 CrossRef CAS.
- F. Wan, S. Huang, H. M. Cao and Z. Q. Niu, ACS Nano, 2020, 14, 6752–6760 CrossRef CAS PubMed.
- Y. Zhang, F. Wan, S. Huang, S. Wang, Z. Q. Niu and J. Chen, Nat. Commun., 2020, 11, 2199 CrossRef CAS.
- Q. F. Li, X. H. Rui, D. Chen, Y. Z. Feng, N. Xiao, L. Y. Gan, Q. Zhang, Y. Yu and S. M. Huang, Nano-Micro Lett., 2020, 12, 67 CrossRef CAS PubMed.
- X. W. Wang, L. Q. Wang and B. Zhang, J. Energy Chem., 2021, 59, 126–133 CrossRef.
- D. D. Jia, K. Zheng and M. Song, Nano Res., 2020, 13, 215–224 CrossRef CAS.
- B. H. She, L. T. Shan, H. J. Chen, J. Zhou, X. Gun, G. Z. Fang, X. X. Cao and S. Q. Liang, J. Energy Chem., 2019, 37, 172–175 CrossRef.
- H. Luo, B. Wang, C. L. Wang, F. D. Wu, F. Jin, B. W. Cong, Y. Ning, Y. Zhou, D. L. Wang, H. K. Liu and S. X. Dou, Energy Storage Mater., 2020, 33, 390–398 CrossRef.
- J. Wu, Q. Kuang, K. Zhang, J. J. Feng, C. M. Huang, J. J. Li, Q. H. Fan, Y. Z. Dong and Y. M. Zhao, Energy Storage Mater., 2021, 41, 297–309 CrossRef.
- Q. Pang, W. He, X. Y. Yu, S. Y. Yang, H. N. Zhao, Y. Fu, M. M. Xing, Y. Tian, X. X. Luo and Y. J. Wei, Appl. Surf. Sci., 2021, 538, 148043 CrossRef CAS.
- X. W. Wang, B. Zhang, J. M. Feng, L. Q. Wang, B. Wu, J. F. Zhang, X. Ou, F. Hou and J. Liang, Sustainable Mater. Technol., 2020, 26, e00236 CrossRef CAS.
- D. Xie, F. Hu, X. Yu, F. H. Cui, G. H. Song and K. Zhu, Chin. Chem. Lett., 2020, 31, 2268–2274 CrossRef CAS.
- W. J. Zhou, J. Z. Chen, C. L. He, M. F. Chen, X. W. Xu, Q. H. Tian, J. L. Xu and C. P. Wong, Electrochim. Acta, 2019, 321, 134689 CrossRef CAS.
- T. T. Lv, Y. Y. Liu, H. Wang, S. Y. Yang, C. S. Liu and H. Pang, Chem. Eng. J., 2021, 411, 128533 CrossRef CAS.
- B. Y. Tang, G. Z. Fang, J. Zhou, L. B. Wang, Y. P. Lei, C. Wang, T. Q. Lin, Y. Tang and S. Q. Liang, Nano Energy, 2018, 51, 579–587 CrossRef CAS.
- Y. Liu and X. Wu, Nano Energy, 2021, 86, 106124 CrossRef CAS.
- H. Z. Chen, H. G. Qin, L. L. Chen, J. Wu and Z. H. Yang, J. Alloys Compd., 2020, 842, 155912 CrossRef CAS.
- J. W. Lai, H. H. Zhu, X. P. Zhu, H. Koritala and Y. Wang, ACS Appl. Energy Mater., 2019, 2, 1988–1996 CrossRef CAS.
- D. C. He, Y. Q. Peng, Y. C. Ding, X. X. Xu, Y. Huang, Z. Q. Li, X. X. Zhang and L. H. Hu, J. Power Sources, 2021, 484, 229284 CrossRef CAS.
- Y. K. Li, Z. M. Huang, P. K. Kalambate, Y. Zhong, Z. M. Huang, M. L. Xie, Y. Shen and Y. H. Huang, Nano Energy, 2019, 60, 752–759 CrossRef CAS.
- Q. F. Li, X. H. Rui, D. Chen, Y. Z. Feng, N. Xiao, L. Y. Gan, Q. Zhang, Y. Yu and S. M. Huang, Nano-Micro Lett., 2020, 12, 67 CrossRef CAS.
- X. H. Qin, X. Y. Wang, J. C. Sun, Q. Q. Lu, A. Omar and D. Mikhailova, Front. Energy Res., 2020, 8, 199 CrossRef.
- B. Sambandam, V. Soundharrajan, S. Kim, M. H. Alfaruqi, J. Jo, S. Kim, V. Mathew, Y. K. Sun and J. Kim, J. Mater. Chem. A, 2018, 6, 3850–3856 RSC.
- N. Zhang, M. Jia, Y. Dong, Y. Y. Wang, J. Z. Xu, Y. C. Liu, L. F. Jiao and F. Y. Cheng, Adv. Funct. Mater., 2019, 29, 1807331 CrossRef.
- C. Xia, J. Guo, P. Li, X. X. Zhang and H. N. Alshareef, Angew. Chem., Int. Ed., 2018, 57, 3943–3948 CrossRef CAS PubMed.
- G. Y. Liu, Y. Xiao, W. W. Zhang, W. Tang, C. L. Zuo, P. P. Zhang, S. J. Dong and P. Luo, Nanotechnology, 2021, 32, 315405 CrossRef CAS PubMed.
- H. Z. Chen, L. L. Chen, J. L. Meng, Z. H. Yang, J. Wu, Y. Rong, L. Deng and Y. D. Shi, J. Power Sources, 2020, 474, 228569 CrossRef CAS.
- D. L. Chao, C. Zhu, M. Song, P. Liang, X. Zhang, N. H. Tiep, H. F. Zhao, J. Wang, R. M. Wang, H. Zhang and H. J. Fan, Adv. Mater., 2018, 30, 1803181 CrossRef.
- M. Song, H. Tan, D. L. Chao and H. J. Fan, Adv. Funct. Mater., 2018, 28, 1802564 CrossRef.
- D. L. Chao, W. H. Zhou, F. X. Xie, C. Ye, H. Li, M. Jaroniec and S. Z. Qiao, Sci. Adv., 2020, 6, eaba4098 CrossRef CAS PubMed.
- N. Qiu, Z. M. Yang, Y. Wang, Y. M. Zhu and W. Liu, Chem. Commun., 2020, 56, 9174–9177 RSC.
- D. Chen, M. J. Lu, B. R. Wang, H. F. Cheng, H. Yang, D. Cai, W. Han and H. J. Fan, Nano Energy, 2021, 83, 105835 CrossRef CAS.
| This journal is © The Royal Society of Chemistry 2022 |