 Open Access Article
Facet control of manganese oxides with diverse redox abilities and acidities for catalytically removing hazardous 1,2-dichloroethane†
Baicheng
Shi
,
Zhaoying
Di
,
Xiaonan
Guo
,
Ying
Wei
 ,
Runduo
Zhang
 * and
Jingbo
Jia
*
State Key Laboratory of Chemical Resource Engineering, Beijing Key Laboratory of Energy Environmental Catalysis, Beijing University of Chemical Technology, Beijing 100029, P. R. China. E-mail: zhangrd@mail.buct.edu.cn; jiajb@mail.buct.edu.cn
First published on 11th November 2021
Abstract
The preparation of four kinds of MnO2, namely, α-, β-, γ-, and δ-type MnO2, with distinct crystal phases and tunnel structures was achieved and they were applied for catalytic combustion of 1,2-dichloroethane (1,2-DCE). The redox ability and acidity of MnO2 as well as the corresponding reaction mechanism were studied by means of various surface-sensitive techniques, including TPR, TPD, OIE, XPS, and in situ DRIFTS together with DFT calculations. The catalytic activities for 1,2-DCE combustion demonstrated that γ-MnO2 displayed the most superior activity with the maximum HCl yield of 95% and CO2 yield of 92% due to its abundant oxygen vacancies on the surface, easy formation of reactive oxygen species, and strong acidity to readily react with the adsorbed reactant to form HCl, which reflects the synergistic effect of its redox properties and acidity. However, the strong Mn–Cl bonding associated with high valence Mn4+ and the scarcity of acidic sites in β- and δ-MnO2 hinder the HCl elimination process, even leading to the undesirable chlorine deposition associated with a series of polychlorinated byproducts including 1,1,2-C2H3Cl3 and CCl4via a Cl substitution process. A mechanism for 1,2-DCE combustion involving dehydrochlorination via C–Cl bond cleavage at acidic sites as well as excess polychlorination by Cl2 over a relatively oxidative sample was accordingly proposed.
1 Introduction
In recent years, the situation of outdoor air pollution has become more and more serious. As major air pollutants, volatile organic compounds (VOCs) have attracted plenty of attention because of their contribution to the increase of ground-level ozone concentration and the formation of photochemical smog.1,2 Moreover, chlorinated volatile organic compounds (CVOCs) have high toxicity, volatility, low biodegradability and stability,3 and exhibit deleterious effect on the environmental ecosystem and human health.4 In order to eliminate CVOCs, many control technologies such as ab/adsorption, condensation, biodegradation, non-thermal plasma, biological degradation, and catalytic combustion have been adopted.5–7 Among them, catalytic combustion is the most promising strategy owing to its high purification efficiency and product selectivity, energy-saving nature and less secondary pollution. The challenge is the development of desirable catalysts for practical applications.8,9Noble-metal catalysts,10 zeolite catalysts,11,12 and transition-metal-oxide catalysts8,13 have previously been applied for the catalytic combustion of CVOCs. Noble-metal catalysts commonly show high activity at low temperatures, but their large-scale application is limited by their high cost and sensitivity to chlorine poisoning.14 The abundant acid sites of zeolite catalysts can promote the dechlorination of CVOCs, but it can easily cause carbon deposition.15 Transition-metal-oxide catalysts are also employed for catalytic combustion of CVOCs due to their considerable activity, easily-controllable nanostructure and attractive resistance towards chlorine poisoning.16,17 A yolk–shell-like mesoporous CoCrOx was prepared for deep destruction of dichloromethane and it was found that the strong interaction of Co and Cr elements can generate active Cr6+ and oxygen species, which enhanced the catalytic activity.18 Although the Cr component shows good catalytic activity for purifying CVOCs, its application could cause potential harm to animals and humans.19 Among many transition-metal catalysts, MnOx possess excellent redox properties and adjustable valence states, and have attracted much attention in CVOC combustion.20 Two α-Mn2O3 single crystals exposed with the (1 1 1) facet and exposed with both (1 1 1) and (0 0 1) facets were prepared by Fan et al. and applied for the selective catalytic reduction (SCR) of NOx with NH3, and it was found that the charge redistribution on the surface of the (0 0 1) facet, which produced more adsorption sites, benefited further adsorption and reaction of NH3 and NO molecules and improved the catalytic activity.21 Wang et al. prepared a series of MnOx including γ-MnO2, Mn2O3 and Mn3O4, which were used for catalytic oxidation of benzene and 1,2-DCE, and noted that γ-MnO2 exhibited remarkable activity ascribed to the abundant surface absorbed oxygen species and ideal low-temperature reducibility.22 According to the different tunnel structures of MnO2 formed by MnO6 octahedra connected by common vertices or edges linked into a single chain or double chain structure,23 the crystal phase of MnO2 can be divided into a one-dimensional (α-, β- and γ-type) tunnel structure and a two-dimensional (δ-type) layer structure. Li et al. improved the MnO2 activity via in situ fabrication of a three-dimensional (3D) macroporous γ-MnO2/LaMnO3.15 and revealed that the outstanding activity may be ascribed to the increased BET surface area and the enhanced active reactive oxygen species quantity after γ-MnO2/LaMnO3.15 modification.24 Zhang et al. elaborated the mechanism of catalytic combustion of 1,2-dichloropropane over the LaMnO3 perovskite through experimental and theoretical studies, indicating that further decomposition was strongly dependent on the active reactive oxygen species and the rate-determining step for catalytic oxidation of 1,2-dichloropropane was decided by the reaction conditions.25 Wang et al. introduced CeO2 and HF etching to modify LaMnO3 and found that it could resist the catalyst deactivation, which showed that the loaded CeO2 provided enriched oxygen vacancies to retain the redox ability and the fluoride ions replaced the surface lattice oxygens to promote the mobility of oxygen species.26 Weng et al. explored the influence of phosphoric acid etching and water vapor on dichloromethane elimination over La3Mn2O7 and found that the former enhanced dichloromethane hydrolysis and the latter promoted desorption of accumulative chlorine with elevated temperatures.27 However, the study on CVOC combustion over MnO2 with different crystal planes has rarely been reported. What is more, how to improve the anti-poisoning ability of catalysts and avoid deactivation and production of more harmful by-products is still a challenge in industrial applications.
As a kind of typical CVOCs, 1,2-dichloroethane (1,2-DCE) is often used as a solvent, extractant and raw material for organic synthesis and its catalytic combustion over MnO2 with diverse crystal structures has not been explored. The preparation of α-, β-, γ-, and δ-type MnO2 with different crystal phases and tunnel structures was achieved and used for catalytic combustion of 1,2-DCE in this work. What is more, a lot of characterization studies were carried out to reveal the relationship between their physicochemical properties and catalytic activity and the reaction mechanism was also studied.
2 Experimental
2.1 Preparation of MnO2 catalysts
Four kinds of MnO2 catalysts with distinct crystal phases and tunnel structures were successfully prepared. All reagents used in this work were analytically pure and used without any treatment. The typical synthesis methods are described in the ESI.†2.2 Catalyst characterization
The crystallographic information was investigated by XRD using a diffractometer equipped with Cu Kα radiation (Bruker, Germany). The specific surface areas (SBET) were determined using N2 sorption isothermal analysis (Quantachrome, USA) based on Brunauer–Emmett–Teller (BET) theory. TPR and TPD experiments were carried out on a device with a thermal conductivity detector (TCD, Huasi, China). SEM (S-4800, Hitachi, Japan) was used to observe the morphologies of the prepared MnO2 solids under a 5.0 kV accelerating voltage, and HRTEM (JEM-2100, JEOL, Japan) was employed to observe the microstructures under a 200 kV operating voltage. XPS instrument (Shimadzu, Japan) equipped with a monochromatic Mg/Al Kα X-ray source was used to analyze the superficial elemental properties. The in situ DRIFTS experiments were conducted with a spectrometer (Bruker, Germany) equipped with a mercury cadmium telluride (MCT) detector. The details are given in the ESI.†2.3 Temperature programmed oxygen isotopic exchange (TPOIE) reaction
TPOIE has been used to evaluate oxygen mobility in a wide temperature range.28–30 In this study, the simple heterogeneous oxygen isotopic exchange (OIE) mechanism was involved over the as-prepared samples, and the experimental device, operation method and schematic diagram are depicted in the ESI.†2.4 Density functional theory (DFT) calculations
During the theoretical simulation, the slab models were reconstructed using a [2 × 2 × 1] supercell, and the slabs were periodically repeated with a vacuum spacing of 15 Å for oxygen vacancy formation. All slab calculations were performed using a Monkhorst–Pack grid (3 × 3 × 1 mesh) with a cutoff energy of 400 eV and the smearing parameter set to 0.1 eV. The constraint value was set to 5 × 10⁻⁶ energy charge between two consecutive iterations to achieve SCF convergence. The computational details are given in the ESI.†2.5 Catalytic activity evaluation
The catalytic performance was investigated on a catalyst bed with a quartz tube (i.d. = 4 mm). 0.14 g of catalyst (40–60 mesh) and 1000 ppm of 1,2-DCE under a 100 mL min−1 airstream (20 vol% O2; N2 balanced) with a gas hourly space velocity (GHSV) of 42![[thin space (1/6-em)]](https://www.rsc.org/images/entities/char_2009.gif) 857 mL g−1 h−1 were used in each test. The reaction was performed from 100 to 500 °C in a step mode with a 30 min plateau at each temperature. The outlet gases were measured with an online gas chromatograph (Agilent 7890B) equipped with a TCD and a mass spectrometer (Agilent 5977A).
857 mL g−1 h−1 were used in each test. The reaction was performed from 100 to 500 °C in a step mode with a 30 min plateau at each temperature. The outlet gases were measured with an online gas chromatograph (Agilent 7890B) equipped with a TCD and a mass spectrometer (Agilent 5977A).
3 Results and discussion
3.1 Structural and morphological characterization
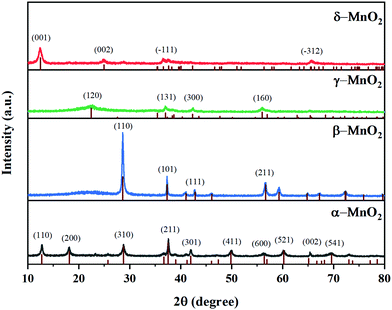
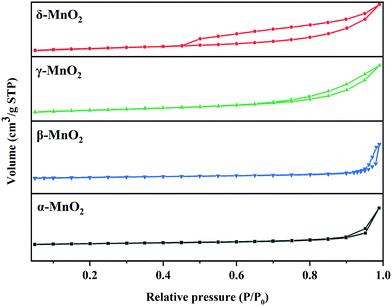
As illustrated in Fig. 1, it is clearly observed that MnO2 catalysts are well indexed to the crystal phases corresponding to JCPDS Card Numbers 44-0141 (α-), 24-0735 (β-), 14-0644 (γ-) and 80-1098 (δ-), respectively. This confirms that the expected MnO2 phases were successfully obtained. β-MnO2 had better crystallinity originating from the narrow peak width and high intensity. As reported, β-MnO2 is favorable for grain growth due to its regular arrangement of [MnO6] octahedra.23 The peaks of γ-MnO2 were relatively wide, suggesting it possessed lower crystallinity. γ-MnO2 has been reported to be ordinarily composed of hybrid phases in which pyrolusite and ramsdellite intergrow irregularly.31The type and size of tunnels, BET surface areas (SBET), and pore volumes of the four catalysts are shown in Table 1 and Fig. 2. It is reported that the different tunnel structures assembled by MnO6 octahedra in MnO2 will affect the related surface areas and pore volumes.32 α- and β-MnO2 presented relatively low specific surface areas (35.9 and 29.9 m2 g−1, respectively) and pore volumes (0.207 and 0.191 cm3 g−1, respectively), while γ- and δ-MnO2 showed higher specific surface areas (87.4 and 86.5 m2 g−1, respectively) and pore volumes (0.313 and 0.271 cm3 g−1, respectively). Among them, γ-MnO2 has the largest specific surface area and pore volume. What is more, the nitrogen adsorption–desorption isotherms of γ- and δ-MnO2 display a type V curve with H3 type hysteresis loops, which implies the existence of mesoporous structures in these two samples. However, the wide relative pressure range of hysteresis loops of δ-MnO2 suggests that pseudopores are formed by the secondary construction of lamellar particles.
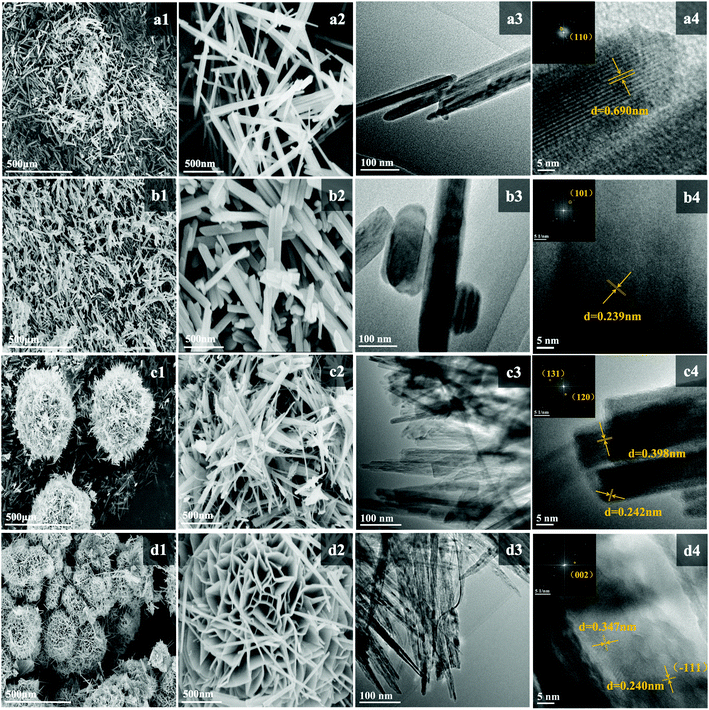
The SEM and TEM images of the as-prepared samples are presented in Fig. 3. α-MnO2 presents a linear nanoneedle morphology with a length of 2–2.5 μm and width of 25–30 nm, which are interspersed and staggered with each other. The well-identified periodic lattice fringes of 6.90 Å size in Fig. 3(a4) correspond to the (1 1 0) facet of α-MnO2. β-MnO2 shows a nanorod-shaped structure with a similar length to that of α-MnO2 and a width 2–5 times that of α-MnO2. The well-identified periodic lattice fringes of 2.39 Å size correspond to the (1 0 1) facet of β-MnO2 in Fig. 3(b4). γ-MnO2 presents a spherical nanostructure, which is assembled by interlaced sharp nanoneedles. The nanoneedles are ∼30 nm in diameter and ∼1 μm in length. The lattice fringes with distances of 3.98 Å and 2.42 Å match well the (1 3 1) and (1 2 0) facets in Fig. 3(c4), respectively. δ-MnO2 shows a flower-globular nanostructure, which is different from the spherical structure of γ-MnO2. It is made up of a large number of small nanosheets intertwined with each other, and the width of these nanosheets is about 15–25 nm. A typical interlayer spacing of 3.47 Å in δ-MnO2 can be observed in Fig. 3(d4).
3.2 H2-TPR and O2-TPD
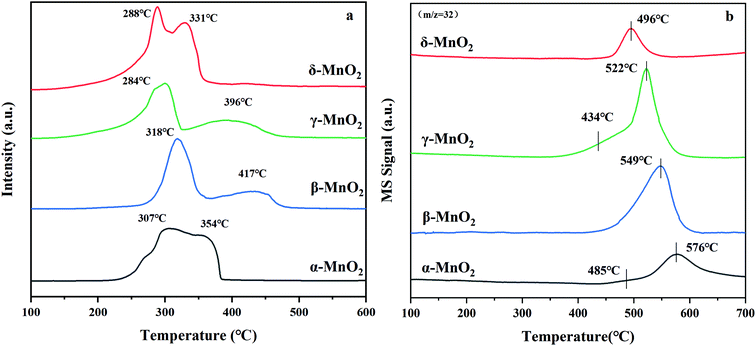
The H2-TPR profiles can be seen in Fig. 4a with H2 consumption depicted in Table 2. Two reduction peaks of each sample emerge from the reduction of MnO2 to Mn2O3/Mn3O4 and successive reduction to MnO, respectively.34 The reduction peaks of α-MnO2 are overlapped and centered at 307 and 354 °C. The ratio of the H2 consumption amount between the former reduction peak and the latter peak of α-MnO2 was calculated to be about 1![[thin space (1/6-em)]](https://www.rsc.org/images/entities/char_2009.gif) :
:![[thin space (1/6-em)]](https://www.rsc.org/images/entities/char_2009.gif) 1, which reveals that the reduction of α-MnO2 might proceed as follows: MnO2 → Mn2O3 → MnO. The reduction peaks of β-MnO2 are centered at 318 and 417 °C. The H2 consumption amount for the former peak is almost twice as large as that for the latter peak, suggesting that the reduction process of β-MnO2 follows the MnO2 → Mn3O4 → MnO order. The H2-TPR profile of γ-MnO2 exhibits a similar shape to the profile of β-MnO2, in which a H2 consumption peak is centered at 284 °C with a hump at 396 °C. The ratio of H2 consumption of the low-temperature peak to the high-temperature peak of γ-MnO2 is about 2
1, which reveals that the reduction of α-MnO2 might proceed as follows: MnO2 → Mn2O3 → MnO. The reduction peaks of β-MnO2 are centered at 318 and 417 °C. The H2 consumption amount for the former peak is almost twice as large as that for the latter peak, suggesting that the reduction process of β-MnO2 follows the MnO2 → Mn3O4 → MnO order. The H2-TPR profile of γ-MnO2 exhibits a similar shape to the profile of β-MnO2, in which a H2 consumption peak is centered at 284 °C with a hump at 396 °C. The ratio of H2 consumption of the low-temperature peak to the high-temperature peak of γ-MnO2 is about 2![[thin space (1/6-em)]](https://www.rsc.org/images/entities/char_2009.gif) :
:![[thin space (1/6-em)]](https://www.rsc.org/images/entities/char_2009.gif) 1, which indicates that the reduction follows the MnO2 → Mn3O4 → MnO order. For δ-MnO2, two overlapped reduction peaks located at 288 and 331 °C were observed. The area proportion of the former peak to the latter peak is approximately 1
1, which indicates that the reduction follows the MnO2 → Mn3O4 → MnO order. For δ-MnO2, two overlapped reduction peaks located at 288 and 331 °C were observed. The area proportion of the former peak to the latter peak is approximately 1![[thin space (1/6-em)]](https://www.rsc.org/images/entities/char_2009.gif) :
:![[thin space (1/6-em)]](https://www.rsc.org/images/entities/char_2009.gif) 1, suggesting that δ-MnO2 is initially reduced to Mn2O3 and then to MnO. According to the location of the initial reduction peak of the MnO2 samples, the reducibility sequence is γ-MnO2 ≈ δ-MnO2 > α-MnO2 ≈ β-MnO2, which indicates that γ- and δ-MnO2 have better redox properties. What stands out is that H2-TPR could reveal the migration of oxygen in the four catalysts because γ-MnO2 displays the lowest temperature reduction peak, and its lattice oxygen species are more mobile with respect to the other three MnO2 samples. This possibly results in more oxygen being absorbed and their further excitation as surface reactive species to participate in the reaction, which is also reflected in the TPOIE reaction below (section 3.4).
1, suggesting that δ-MnO2 is initially reduced to Mn2O3 and then to MnO. According to the location of the initial reduction peak of the MnO2 samples, the reducibility sequence is γ-MnO2 ≈ δ-MnO2 > α-MnO2 ≈ β-MnO2, which indicates that γ- and δ-MnO2 have better redox properties. What stands out is that H2-TPR could reveal the migration of oxygen in the four catalysts because γ-MnO2 displays the lowest temperature reduction peak, and its lattice oxygen species are more mobile with respect to the other three MnO2 samples. This possibly results in more oxygen being absorbed and their further excitation as surface reactive species to participate in the reaction, which is also reflected in the TPOIE reaction below (section 3.4).
| Samples | Reduction peak (°C) | Total H2 consumption (mmol g−1) | |
|---|---|---|---|
| Position (°C) | Position (°C) | ||
| α-MnO2 | 314 | 337 | 10.75 |
| β-MnO2 | 318 | 417 | 10.82 |
| γ-MnO2 | 284 | 396 | 10.73 |
| δ-MnO2 | 288 | 331 | 10.94 |
The O2-TPD profiles are presented in Fig. 4b. It was widely accepted that active physically adsorbed oxygen can be eliminated from the surface at a low temperature, and thus we can confirm that the oxygen desorption peaks at the tested temperatures are categorized as chemisorbed oxygen species.35 In the process of the reaction, molecular oxygen will be firstly absorbed on the surface of the catalysts and then converted into atomic oxygen or other surface reactive oxygen species, such as O−, O2−, etc. There are two peaks for α- and γ-MnO2, while there is only one peak for β- and δ-MnO2. MnO2 surface was mainly covered by Mn3+ species.9 Considering γ-MnO2 has the lowest temperature of the first desorption peak amongst all samples, it is deduced that γ-MnO2 possesses superior oxygen mobility. That is to say, multitudinous surface oxygen vacancies on the surface of γ-MnO2 may tend to form atomic oxygen or other surface reactive oxygen species, which contributes to further oxidation of 1,2-DCE.
3.3 XPS
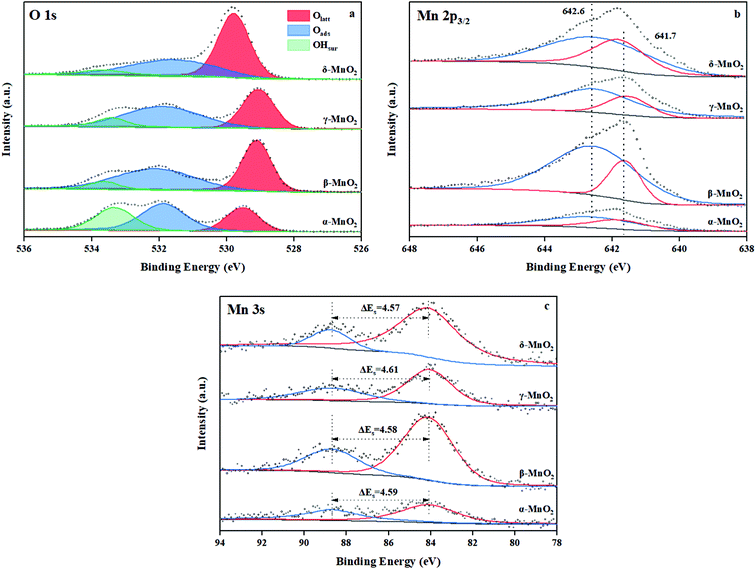
The chemical status and surface composition were acquired by XPS. Fig. 5a displays the O 1s spectrum of MnO2. Generally, the O 1s pattern can be divided into three regions. The binding energy (BE) at 529.2–529.6 eV is ascribed to lattice oxygen (Olatt),22 the BE at 531.6–531.8 eV belongs to surface adsorbed oxygen (Oads), which is naturally chemisorbed in the surrounding of the surface oxygen vacancies,36,37 and the BE at 533.2–533.6 eV is ascribed to the surface hydroxyl (OH) groups (OHsurf).22 Generally gaseous O2 tends to be adsorbed on the surface oxygen vacancies and these absorbed O2 could be further dissociated into atomic oxygen at a certain temperature.38 As indicated in Table 3, γ-MnO2 contained the most abundant surface adsorbed oxygen (Oads) with a ratio of Oads to total oxygen species of 49.5%, which suggests that, among all the samples, γ-MnO2 has abundant oxygen vacancies on its surface.| Samples | Binding energy (eV) and ratio (%) | Average oxidation state (AOS) | ||||
|---|---|---|---|---|---|---|
| Olatt | Oads | OHsur | Mn4+ | Mn3+ | ||
| α-MnO2 | 529.5/26.4 | 531.7/43.3 | 533.3/31.3 | 642.6/75.9 | 641.8/24.1 | 3.78 |
| β-MnO2 | 529.3/47.0 | 531.8/47.3 | 533.5/5.7 | 642.6/77.9 | 641.7/22.1 | 3.80 |
| γ-MnO2 | 529.2/40.6 | 531.7/49.5 | 533.4/9.9 | 642.6/75.7 | 641.6/24.3 | 3.76 |
| δ-MnO2 | 529.6/57.8 | 531.6/36.4 | 533.5/5.8 | 642.5/79.0 | 641.8/21.0 | 3.82 |
Fig. 5b illustrates the Mn 2p3/2 spectrum of MnO2. The peaks at 642.6 and 641.8 eV can be assigned to surface Mn4+ and Mn3+ species.39 From Table 3, the quantitative calculations of the Mn 2p3/2 XPS were conducted and the Mn4+/Mn3+ molar ratio was determined. Obviously, the molar ratio of surface elements Mn4+/Mn3+ is distinct in these four kinds of MnO2. The δ-MnO2 sample exhibits the maximum Mn4+/Mn3+ molar ratio (3.8). Besides, Mn4+–O bonds are more stable than Mn3+–O bonds.40 This suggests that γ-MnO2 contains more unstable Mn–O bonds on the surface, which indicates that the atomic oxygen species absorbed on its surface are more probably released to take part in catalytic combustion. In the same way, the presence of low valence manganese on the surface could facilitate the dissociation and activation of the surrounding atomic oxygen species.9
The average oxidation state (AOS) of manganese on the surface was assessed based on Mn 3s doublet splitting (ΔEs) according to the following relationship:41
| AOS = 8.956 − 1.126ΔEs | (1) |
The AOS follows the order of δ-MnO2 (3.82) > β-MnO2 (3.80) > α-MnO2 (3.78) > γ-MnO2 (3.76), as presented in Fig. 5c. This rule accords well with the result of H2-TPR, which indicates that the content of Mn3+ in γ-MnO2 is the maximum.
3.4 Temperature programmed oxygen isotopic exchange (TPOIE) reaction
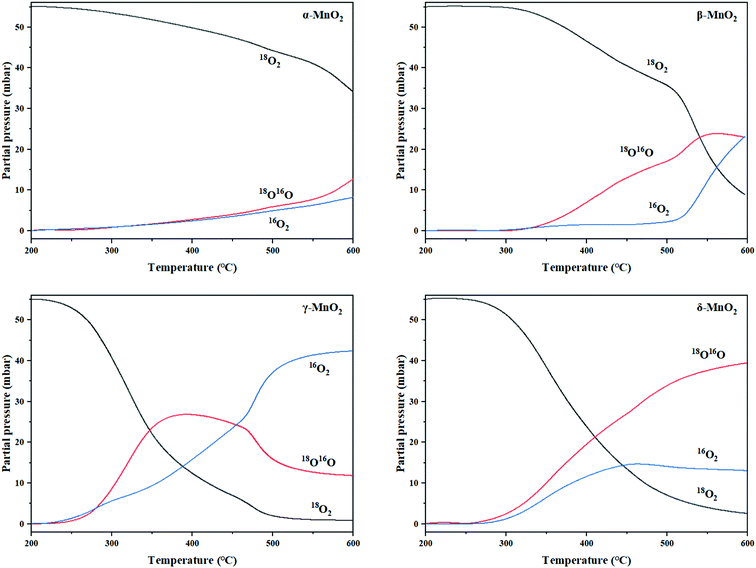
As mentioned above, the four samples followed the sample heterogeneous exchange mechanism, that is, exchange of one oxygen atom at a time. Here, the surface reactivity of the four samples at lower temperatures involving route (2) is accordingly investigated. The heterogeneous exchange reaction involving bulk lattice oxygens is used to evaluate their transfer ability at relatively high temperatures as formulated by route (3).| 18O18O (g) + Mn − 16O (s) ⇔ 18O16O (g) + Mn − 18Osur (ads) | (2) |
| 18O16O (g) + Mn − 16O2 (s) ⇔ 16O16O (g) + Mn − 18O16O (s) | (3) |
From the experiment, the cumulative exchange oxygen atom amounts (Ne) and oxygen exchange rates (Re) with temperature are obtained (Fig. 7a and b). As shown in Fig. 7a, the sum of exchanged oxygen atom amount is distinct in these four kinds of MnO2 samples. The γ-MnO2 sample contains the maximum amount of exchanged 18O atoms and the α-MnO2 sample shows the opposite result. γ-MnO2 has an excellent exchange ability throughout the whole temperature range (200–600 °C) since it has bigger specific surface area for releasing and making use of the surface and lattice oxygen atoms well. What is more, a huge difference among the four MnO2 catalysts can be seen at the initial activated temperature. The temperature of exchange starts at 200 °C for γ-MnO2, 220 °C for δ-MnO2, 240 °C for α-MnO2, and 280 °C for β-MnO2 in an increasing order.
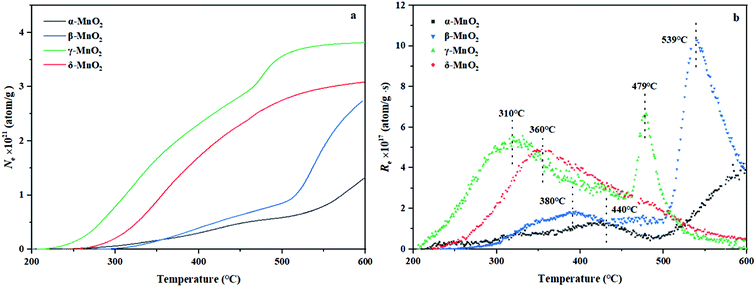 | ||
| Fig. 7 (a) The curves of the total amount of exchanged 18O (Ne) and (b) the exchange rate (Re) with temperature of MnO2. | ||
According to the Re curves, activated temperature for the four MnO2 catalysts (Fig. 7b) indicated the discrepancy in oxygen mobility ability over these catalysts further. In the experimental temperature window, the maximum exchange rate (Remax) value emerges when the gas–solid phase balance of 18O amounts is achieved, and thus the behavior of each catalyst could be distinguished by the starting exchange temperature at which the value of Remax is constant, that is, the lower the starting temperature is, the faster the migration of oxygen is. As displayed in Fig. 7b, the mobility behavior of reactive oxygen species is ranked as follows: γ-MnO2 (310 °C) > δ-MnO2 (360 °C) > β-MnO2 (380 °C) > α-MnO2 (440 °C). It is verified that γ-MnO2 shows the most excellent activity toward the mobility of oxygen species which could be related to its abundant oxygen vacancies to yield the corresponding reactive oxygens. Actually, the formation of reactive oxygen species demands unequal activation energies in the process of isotopic 18O exchange. Interestingly, γ-MnO2 and β-MnO2 have the second extreme points, which likely presented exchange with some lattice oxygens in bulk. In other words, the exchange of lattice oxygen becomes the highest with an increase in temperature. In conclusion, the oxygen mobility of γ-MnO2 is superior at both low and high temperatures, consistent with the O2-TPD result.
3.5 NH3-TPD
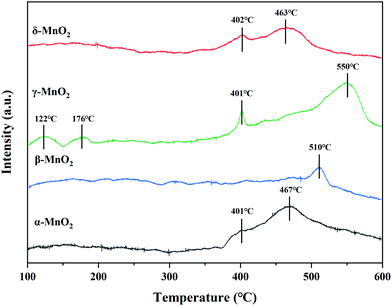
The surface acidity of the catalyst was thought to play a key role in the cleavage of the C–Cl bonding of CVOCs in our previous work.12 Herein, the surface acidity of the catalyst was analyzed by NH3-TPD and the acid amounts of these as-prepared MnO2 catalysts were estimated according to the integral area of the desorption curve. The curve can be divided into three peaks for temperatures < 200 °C, 200–400 °C, and > 400 °C, corresponding to the weakly, moderately and strongly acidic sites for adsorbed ammonia, respectively.27For α-MnO2, there are two peaks centered at 401 and 467 °C, both of which belong to desorption at strong acid sites. There is only one peak centered at 510 °C in the NH3-TPD profile of β-MnO2, corresponding to the strong acid sites. γ-MnO2 shows four NH3 desorption peaks at 122, 176, 401 and 550 °C; the former two peaks are assigned to desorption occurring at weak acid sites and the latter two are attributed to those occurring at strong acid sites. The NH3-TPD curve of δ-MnO2 contains two desorption peaks centered at 402 and 463 °C, both of which are due to desorption at strong acid sites. As displayed in Table 4, among the four samples, the existence of weak acid sites was found only in γ-MnO2, which contained the highest amount of total acid, whereas the lowest acid amount was observed in the case of β-MnO2. CVOCs were reported to be absorbed on acid sites or oxygen vacancies for dechlorination.27 Thus, γ-MnO2 containing relatively abundant acid sites is likely beneficial for C–Cl cleavage and HCl formation to achieve CVOC degradation by selective catalytic combustion.
| Sample | Weak acid (μmol g−1) | Moderate acid (μmol g−1) | Strong acid (μmol g−1) |
|---|---|---|---|
| α-MnO2 | — | — | 67.4 |
| β-MnO2 | — | — | 4.4 |
| γ-MnO2 | 7.8 | — | 65.0 |
| δ-MnO2 | — | — | 31.1 |
3.6 Catalyst performance
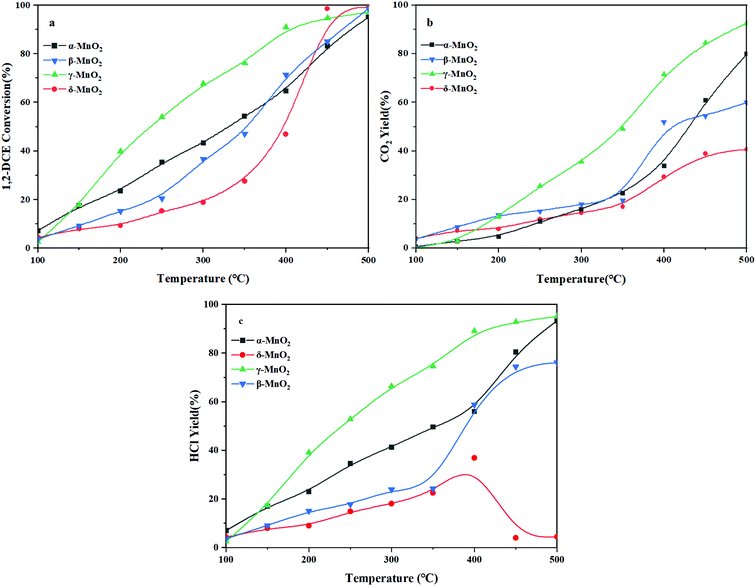
The 1,2-DCE conversion with reaction temperature over the four kinds of MnO2 catalysts is depicted in Fig. 9a. In detail, these catalysts follow the T50 order of γ-MnO2 (236 °C) < α-MnO2 (331 °C) < β-MnO2 (352 °C) < δ-MnO2 (397 °C). Compared to β-, γ-, and δ-MnO2, γ-MnO2 exhibits the most superior catalytic activity in the whole temperature window. The CO2 yield as the desired oxidation products during the 1,2-DCE combustion is shown in Fig. 9b. This shows that γ-MnO2 exhibited the most outstanding CO2 selectivity in the combustion of 1,2-DCE. What is more, it can be observed that the CO2 yield of the catalysts in the whole temperature window follows the order of γ-MnO2 > α-MnO2 > β-MnO2 > δ-MnO2, which indicates that β- and δ-MnO2 would generate a larger number of chlorinated byproducts than α- and γ-MnO2 during the 1,2-DCE combustion. Besides, the yield of HCl is also shown in Fig. 9c, which is another key product that should be considered. The order of HCl yield is as follows: γ-MnO2 > α-MnO2 > β-MnO2 > δ-MnO2.As displayed in Fig. S2 (ESI†), the chlorinated organic byproducts, including C2H3Cl, C2H2Cl2, 1,1,2-C2H3Cl3 and CCl4, are hardly observed on α- and γ-MnO2, but these chlorinated byproducts are readily formed over β- and δ-MnO2, especially on δ-MnO2, resulting in the HCl yield presenting an inflection point at 400 °C, which indicates the occurrence of not only hydrochlorination but also polychlorination during the overall combustion process. Commonly, it is noticeable that all these chlorine-containing byproducts initially increased and then decreased with increasing temperature, which might vanish if the temperature was high enough. The further fatal HCl oxidation into Cl2 would readily induce the formation of polychlorinated byproducts such as 1,1,2-C2H3Cl3 and CCl4, which are enhanced with increasing temperature.42 With further increase of temperature, these chlorinated byproducts will be gradually transformed into final target products. Although α-MnO2 is not found to generate the chlorinated byproducts, the small amount of surface reactive oxygen species resulted in a CO2 yield lower than that achieved over γ-MnO2 (Fig. 5 and 7). Owing to the small amount of acidity, β- and δ-MnO2 cannot easily break the C–Cl bond to produce HCl for dechlorination which also makes further transformation of the chlorinated byproducts difficult (Fig. 8). In spite of the reasonable redox properties of δ-MnO2, it is unable to obtain a satisfactory HCl yield due to its enriched Mn4+, which results in strong Mn–Cl bonding to induce the catalyst inactivation and promote the formation of a large number of polychlorinated compounds. As mentioned above, if the catalyst does not possess both acidic sites and redox properties, 1,2-DCE will not dissolve or break bonds thoroughly, which suppresses the HCl formation at low temperatures. That is to say, with further increase of temperature, the formation of HCl will be very hard unless the temperature is relatively high. From this, we can see that γ-MnO2 is the best catalyst for 1,2-DCE removal, which provides the highest yield of the final target product of HCl with a synergistic effect of acidity and redox properties. Its outstanding CO2 selectivity can be probably attributed to the superior reducibility and abundant surface reactive oxygens, as demonstrated by H2-TPR and OIE (Fig. 4 and 7), which achieves superior combustion of 1,2-DCE at relatively low temperatures. Moreover, the average oxidation state of the γ-MnO2 sample is the lowest among the four samples, which indicates that it possesses more surface oxygen vacancies and relatively few Mn4+ (Fig. 4 and 5). Combined with the NH3-TPD analysis mentioned above (Fig. 8), 1,2-DCE is firstly adsorbed and dissociated on the oxygen vacancies or the acid sites, preventing the formation of a rather stable Mn–Cl bond and undesirable Cl2.
3.7 In situ DRIFTS and reaction mechanism
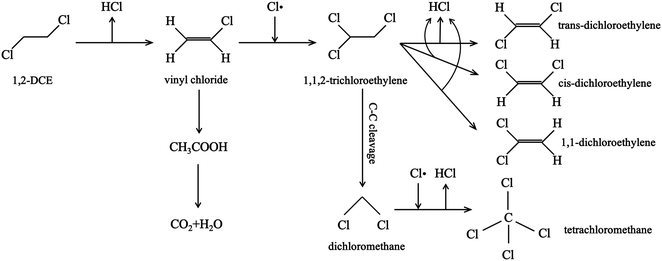
In situ DRIFTS of 1,2-DCE oxidation over the four kinds of MnO2 at different temperatures was conducted as shown in Fig. 10. Besides, the bands at 831 and 933 cm−1 over the β-, γ- and δ-MnO2 catalysts correspond to C–Cl bond vibration.43,44 The C–Cl bond vibration (Fig. 10b) appears on β-MnO2 when the temperature is higher than 200 °C, which is related to the generation of 1,1,2-C2H3Cl3 and CCl4 byproducts. The vibrational bands of this bonding for the γ-MnO2 sample are only visible at temperatures between 50 and 100 °C (Fig. 10c), which is supposed to be the remaining 1,2-DCE in the reaction. The C–Cl bond vibration on δ-MnO2 appears at 100–200 °C, and the stretching vibration peak of C![[double bond, length as m-dash]](https://www.rsc.org/images/entities/char_e001.gif) C on the ethylene substituent is also found at 1621 cm−1 (Fig. 10c),43 so it is inferred that C2H3Cl and cis-C2H2Cl2 are formed. Interestingly, the C–Cl bond (Fig. 10a) was marginally observed on α-MnO2, which is consistent with the activity data. The bands in the 1300–1500 cm−1 region over β-, γ- and δ-MnO2 are assigned to the deformed vibration peaks of –CH2– and –CH–groups,44 which are related to 1,2-DCE and the produced chlorinated hydrocarbons. It is reported that the bands at 1226 and 1237 cm−1 are ascribed to the C–O bond stretching vibration of acidic species,45 which indicates that the acetic acid species were produced by the oxidation of 1,2-DCE and then deeply oxidized to H2O and CO2. The bands at 1284, 1297 and 1464 cm−1 correspond to the vibration in the –CH–group in 1,2-DCE.46 The bands in the range of 3200–3600 cm−1 are associated with the OH group and water stretching vibration, which are observed over γ- and δ-MnO2.47 As reported, the bands at 1555 and 1577 cm−1 over γ- and δ-MnO2 are assignable to the adsorbed carbonate species,12 which are the sources of generation of CO2 and CO products. Combining the results of previous characterization and Fig. 10, the probable combustion mechanisms of 1,2-DCE over the four kinds of MnO2 are summarized in Scheme 1. As reported, the chlorinated compounds caught by the oxygen vacancies are more unstable than those bonded with Mn4+ ions48 and tend to react to form HCl, which facilitates Cl desorption. Hence, it is deduced that 1,2-DCE is firstly activated at surface oxygen vacancies and successively destructed by acid sites via reaction with sufficient H atoms to generate HCl which is finally desorbed. C2H3Cl (by HCl elimination reaction), C2H2Cl2 (by H2 elimination reaction), 1,1,2-C2H3Cl3 (by HCl addition or Cl substitution reaction) and CCl4 (Cl substitution reaction) byproducts are produced, which are thereafter oxidized to acetic acid species. CO2 and CO products are generated by the deep oxidation of acetic acid species and carbonate species. Based on the above analysis, we can find that γ-MnO2 with outstanding C–Cl/C–H cleavage ability displays a better catalytic performance during the 1,2-DCE combustion process, which is attributed to the abundant oxygen vacancies, excellent surface oxygen migration ability, more acid sites and less Mn4+ content on the surface. Furthermore, there are relatively abundant acid sites and few Mn4+ in α-MnO2, and thus we almost cannot observe any chlorinated byproducts, but the yield of CO2 is essentially low because of the poor exchange capacity of the surface oxygen of α-MnO2. The AOS of the Mn element on the surface of β-MnO2 and δ-MnO2 is relatively high, and there are many Mn4+ species. 1,2-DCE mainly dissociates on Mn4+ to form a stable Mn–Cl bond, leading to serious catalyst deactivation.
C on the ethylene substituent is also found at 1621 cm−1 (Fig. 10c),43 so it is inferred that C2H3Cl and cis-C2H2Cl2 are formed. Interestingly, the C–Cl bond (Fig. 10a) was marginally observed on α-MnO2, which is consistent with the activity data. The bands in the 1300–1500 cm−1 region over β-, γ- and δ-MnO2 are assigned to the deformed vibration peaks of –CH2– and –CH–groups,44 which are related to 1,2-DCE and the produced chlorinated hydrocarbons. It is reported that the bands at 1226 and 1237 cm−1 are ascribed to the C–O bond stretching vibration of acidic species,45 which indicates that the acetic acid species were produced by the oxidation of 1,2-DCE and then deeply oxidized to H2O and CO2. The bands at 1284, 1297 and 1464 cm−1 correspond to the vibration in the –CH–group in 1,2-DCE.46 The bands in the range of 3200–3600 cm−1 are associated with the OH group and water stretching vibration, which are observed over γ- and δ-MnO2.47 As reported, the bands at 1555 and 1577 cm−1 over γ- and δ-MnO2 are assignable to the adsorbed carbonate species,12 which are the sources of generation of CO2 and CO products. Combining the results of previous characterization and Fig. 10, the probable combustion mechanisms of 1,2-DCE over the four kinds of MnO2 are summarized in Scheme 1. As reported, the chlorinated compounds caught by the oxygen vacancies are more unstable than those bonded with Mn4+ ions48 and tend to react to form HCl, which facilitates Cl desorption. Hence, it is deduced that 1,2-DCE is firstly activated at surface oxygen vacancies and successively destructed by acid sites via reaction with sufficient H atoms to generate HCl which is finally desorbed. C2H3Cl (by HCl elimination reaction), C2H2Cl2 (by H2 elimination reaction), 1,1,2-C2H3Cl3 (by HCl addition or Cl substitution reaction) and CCl4 (Cl substitution reaction) byproducts are produced, which are thereafter oxidized to acetic acid species. CO2 and CO products are generated by the deep oxidation of acetic acid species and carbonate species. Based on the above analysis, we can find that γ-MnO2 with outstanding C–Cl/C–H cleavage ability displays a better catalytic performance during the 1,2-DCE combustion process, which is attributed to the abundant oxygen vacancies, excellent surface oxygen migration ability, more acid sites and less Mn4+ content on the surface. Furthermore, there are relatively abundant acid sites and few Mn4+ in α-MnO2, and thus we almost cannot observe any chlorinated byproducts, but the yield of CO2 is essentially low because of the poor exchange capacity of the surface oxygen of α-MnO2. The AOS of the Mn element on the surface of β-MnO2 and δ-MnO2 is relatively high, and there are many Mn4+ species. 1,2-DCE mainly dissociates on Mn4+ to form a stable Mn–Cl bond, leading to serious catalyst deactivation.
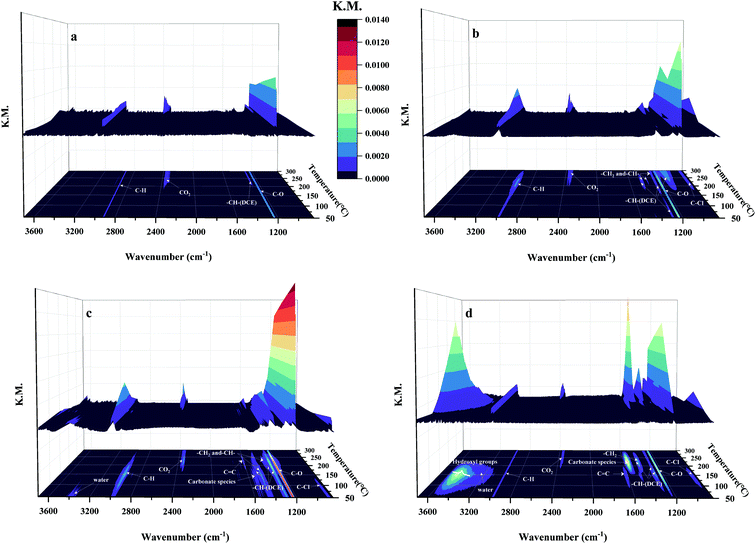 | ||
| Fig. 10 The in situ DRIFTS results for oxidation of 1,2-DCE on (a) α-, (b) β-, (c) γ- and (d) δ-MnO2 at different temperatures. | ||
3.8 DFT calculations
As discussed in the preceding characterization, the surface reactive oxygen species of MnO2 play an important role in 1,2-DCE catalytic combustion reactions. It is believed that the formation of oxygen vacancies is due to an easy loss of the lattice oxygen, and thereafter a large number of surface reactive oxygens can be generated upon these ionic vacancies through a redox cycle, which is conducive to the fast migration of surface oxygen species.36 Therefore, the easy formation of oxygen vacancies theoretically supports the high amount of surface reactive oxygens. γ-MnO2 exhibited the highest specific surface area of 87.4 m2 g−1 associated with the best catalytic performance, while δ-MnO2 exhibited the second largest specific surface area of 86.5 m2 g−1; however, it showed the worst catalytic performance. Thus, the specific surface area should not be the only factor affecting the catalytic performances of the four samples although a higher surface area usually leads to a better activity. In addition, the morphology, especially for the exposed facet, was considered and correlated to catalytic performances in the present work. The diverse morphologies observed by high-resolution transmission electron microscopy (Fig. 3) indicate the distinct crystal planes formed over the as-prepared samples. As illustrated in Fig. 11, a theoretical calculation on the exposed facets was conducted. Herein, the formation energy of oxygen vacancies by removing a lattice oxygen atom from the four kinds of MnO2 catalysts was calculated based on eqn (4):| EOv = Esys-O − Esys + EO2/2 | (4) |
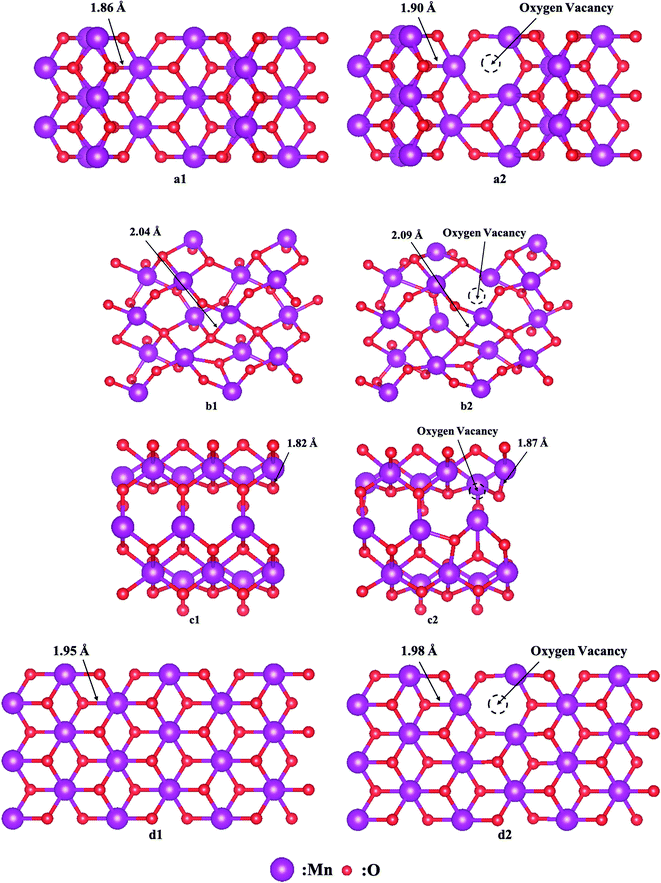 | ||
| Fig. 11 Model structures of (a) α-, (b) β-, (c) γ- and (d) δ-MnO2 (a1–d1) without and (a2–d2) with oxygen vacancies. | ||
Here, Esys-O represents the energy of the system with oxygen vacancies, Esys represents the energy of the system, and EO2 represents the energy of the O2 molecules.
It is noticed that the lengths of the Mn–O bonds around the oxygen vacancies were all extended because of the Jahn–Teller effect,49 causing more activated lattice oxygen to take part in the reaction readily. The EOv of α-, β-, γ- and δ-MnO2 is 1.79 eV, 3.23 eV, 1.47 eV and 2.59 eV, respectively. It is clear that the energy for oxygen vacancy formation follows the sequence: β-MnO2 > δ-MnO2 > α-MnO2 > γ-MnO2, which suggests that the oxygen vacancy is likely to be generated over the γ-MnO2 sample, resulting in adsorption of more reactive oxygen species, which makes it easier to be adsorbed as molecular oxygen and further dissociated on these surface vacancies, in accordance with the results of the present OIE experiment. To sum up the above discussion, we think that morphology is a more crucial factor than specific surface area that can significantly impact the redox ability and thereby improve the corresponding activity.
4 Conclusions
In summary, the preparation of α-, β-, γ-, and δ-type MnO2 was successful for 1,2-DCE catalyst combustion. γ-MnO2 displayed the most excellent catalytic activity to achieve an almost complete oxidation of 1,2-DCE with a synergistic effect of excellent redox properties and strong acidity during the 1,2-DCE oxidation process (T90 = 406 °C, yCO2 = 92% and yHCl = 95%) at 42![[thin space (1/6-em)]](https://www.rsc.org/images/entities/char_2009.gif) 857 mL g−1 h−1 GHSV. It is confirmed that oxygen vacancies tend to form on the surface of γ-MnO2 based on DFT calculations. What is more, combined with O2-TPD, NH3-TPD and TPOIE technique analyses, γ-MnO2 was confirmed to exhibit the most superior surface oxygen migration owing to the enriched surface reactive oxygens on the ionic vacancies. Based on the H2-TPR and XPS analyses, having less Mn4+ on the surface significantly reduced the formation of strong Mn–Cl bonding along with the adsorption of 1,2-DCE, which makes it easy to facilitate the subsequent reaction yielding polychlorinated byproducts. Moreover, the corresponding intermediates could be transformed into CO2 and H2O over catalysts with good redox properties. Besides, it is proved that the HCl formation and C–Cl bond cleavage ability are related to both the relatively abundant acid sites and the surface mobile oxygens, which accelerates the formation of HCl and finally enables conversion into CO2 and H2O. Both the dehydrochlorination by HCl elimination and the polychlorination by Cl substitution contribute to the formation of chlorinated byproducts including C2H3Cl, C2H2Cl2, 1,1,2-C2H3Cl3 and CCl4.
857 mL g−1 h−1 GHSV. It is confirmed that oxygen vacancies tend to form on the surface of γ-MnO2 based on DFT calculations. What is more, combined with O2-TPD, NH3-TPD and TPOIE technique analyses, γ-MnO2 was confirmed to exhibit the most superior surface oxygen migration owing to the enriched surface reactive oxygens on the ionic vacancies. Based on the H2-TPR and XPS analyses, having less Mn4+ on the surface significantly reduced the formation of strong Mn–Cl bonding along with the adsorption of 1,2-DCE, which makes it easy to facilitate the subsequent reaction yielding polychlorinated byproducts. Moreover, the corresponding intermediates could be transformed into CO2 and H2O over catalysts with good redox properties. Besides, it is proved that the HCl formation and C–Cl bond cleavage ability are related to both the relatively abundant acid sites and the surface mobile oxygens, which accelerates the formation of HCl and finally enables conversion into CO2 and H2O. Both the dehydrochlorination by HCl elimination and the polychlorination by Cl substitution contribute to the formation of chlorinated byproducts including C2H3Cl, C2H2Cl2, 1,1,2-C2H3Cl3 and CCl4.
Author contributions
Baicheng Shi: resources, writing – original draft, data curation, formal analysis, writing – review & editing. Runduo Zhang: supervision, funding acquisition, validation. Zhaoying Di: investigation, validation. Xiaonan Guo: investigation, visualization. Ying Wei: project administration, visualization. Jingbo Jia: project administration, visualization.Conflicts of interest
The authors declare that they have no competing financial interests.Acknowledgements
The financial support from the National Natural Science Foundation of China (No. U1862102, 22176010 and 21976012) and the Fundamental Research Funds for the Chinese Central Universities (No. XK1802-1 and JD2117) is gratefully acknowledged.References
- C. He, Z. Jiang, M. Ma, X. Zhang, M. Douthwaite, J. Shi and Z. Hao, Understanding the promotional effect of Mn2O3 on micro-/mesoporous hybrid silica nanocubic-supported Pt catalysts for the low-temperature destruction of methyl ethyl ketone: an experimental and theoretical study, ACS Catal., 2018, 8, 4213–4229 CrossRef CAS.
- S. Wang and J. Hao, Air quality management in China: issues, challenges, and options, J. Environ. Sci., 2012, 24, 2–13 CrossRef CAS.
- M. Tian, M. Ma, B. Xu, C. Chen, C. He, Z. Hao and R. Albilali, Catalytic removal of 1,2-dichloroethane over LaSrMnCoO6/H-ZSM-5 composite: insights into synergistic effect and pollutant–destruction mechanism, Catal. Sci. Technol., 2018, 8, 4503–4514 RSC.
- A. Jamal, M. M. Rahman, S. B. Khan, M. Faisal, K. Akhtar, M. A. Rub, A. M. Asiri and A. O. Al-Youbi, Cobalt doped antimony oxide nano-particles based chemical sensor and photo-catalyst for environmental pollutants, Appl. Surf. Sci., 2012, 261, 52–58 CrossRef CAS.
- M. S. Kamal, S. A. Razzak and M. M. Hossain, Catalytic oxidation of volatile organic compounds (VOCs) – A review, Atmos. Environ., 2016, 140, 117–134 CrossRef CAS.
- T. Chang, Z. Shen, Y. Huang, J. Lu, D. Ren, J. Sun, J. Cao and H. Liu, Post-plasma-catalytic removal of toluene using MnO2–Co3O4 catalysts and their synergistic mechanism, Chem. Eng. J., 2018, 348, 15–25 CrossRef CAS.
- C. He, J. Cheng, X. Zhang, M. Douthwaite, S. Pattisson and Z. Hao, Recent advances in the catalytic oxidation of volatile organic compounds: a review based on pollutant sorts and sources, Chem. Rev., 2019, 119, 4471–4568 CrossRef CAS PubMed.
- Q. Dai, L. Yin, S. Bai, W. Wang, X. Wang, X. Gong and G. Lu, Catalytic total oxidation of 1,2-dichloroethane over VOx/CeO2 catalysts: further insights via isotopic tracer techniques, Appl. Catal., B, 2016, 182, 598–610 CrossRef CAS.
- W. Yang, Z. a. Su, Z. Xu, W. Yang, Y. Peng and J. Li, Comparative study of α-, β-, γ- and δ-MnO2 on toluene oxidation: oxygen vacancies and reaction intermediates, Appl. Catal., B, 2020, 260, 18150 Search PubMed.
- X. Liu, L. Chen, T. Zhu and R. Ning, Catalytic oxidation of chlorobenzene over noble metals (Pd, Pt, Ru, Rh) and the distributions of polychlorinated by-products, J. Hazard. Mater., 2019, 363, 90–98 CrossRef CAS PubMed.
- P. Yang, Z. Shi, F. Tao, S. Yang and R. Zhou, Synergistic performance between oxidizability and acidity/texture properties for 1,2-dichloroethane oxidation over (Ce,Cr)xO2/zeolite catalysts, Chem. Eng. Sci., 2015, 134, 340–347 CrossRef CAS.
- H. Wang, B. Peng, R. Zhang, H. Chen and Y. Wei, Synergies of Mn oxidative ability and ZSM-5 acidity for 1,2-dichloroethane catalytic elimination, Appl. Catal., B, 2020, 276, 118922 CrossRef CAS.
- B. de Rivas, R. López-Fonseca, C. Jiménez-González and J. I. Gutiérrez-Ortiz, Synthesis, characterisation and catalytic performance of nanocrystalline Co3O4 for gas-phase chlorinated VOC abatement, J. Catal., 2011, 281, 88–97 CrossRef CAS.
- Z. El Assal, S. Ojala, S. Pitkäaho, L. Pirault-Roy, B. Darif, J.-D. Comparot, M. Bensitel, R. L. Keiski and R. Brahmi, Comparative study on the support properties in the total oxidation of dichloromethane over Pt catalysts, Chem. Eng. J., 2017, 313, 1010–1022 CrossRef CAS.
- A. Aranzabal, M. Romero-Sáez, U. Elizundia, J. R. González-Velasco and J. A. González-Marcos, Deactivation of H-zeolites during catalytic oxidation of trichloroethylene, J. Catal., 2012, 296, 165–174 CrossRef CAS.
- J. González-Prior, R. López-Fonseca, J. I. Gutiérrez-Ortiz and B. de Rivas, Oxidation of 1,2-dichloroethane over nanocube-shaped Co3O4 catalysts, Appl. Catal., B, 2016, 199, 384–393 CrossRef.
- P. Yang, Z. Shi, S. Yang and R. Zhou, High catalytic performances of CeO2–CrOx catalysts for chlorinated VOCs elimination, Chem. Eng. Sci., 2015, 126, 361–369 CrossRef CAS.
- X. Feng, M. Tian, C. He, L. Li, J. Shi, Y. Yu and J. Cheng, Yolk-shell-like mesoporous CoCrOx with superior activity and chlorine resistance in dichloromethane destruction, Appl. Catal., B, 2020, 264, 118493 CrossRef.
- H. Oliveira, Chromium as an environmental pollutant: insights on induced plant toxicity, J. Bot., 2012, 2012, 1–8 CrossRef.
- G. Zhu, J. Zhu, W. Jiang, Z. Zhang, J. Wang, Y. Zhu and Q. Zhang, Surface oxygen vacancy induced α-MnO2 nanofiber for highly efficient ozone elimination, Appl. Catal., B, 2017, 209, 729–737 CrossRef CAS.
- Z. Fan, Z. Wang, J. Shi, C. Gao, G. Gao, B. Wang, Y. Wang, X. Chen, C. He and C. Niu, Charge-redistribution-induced new active sites on (001) facets of α-Mn2O3 for significantly enhanced selective catalytic reduction of NO by NH3, J. Catal., 2019, 370, 30–37 CrossRef CAS.
- J. Wang, H. Zhao, J. Song, T. Zhu and W. Xu, Structure-activity relationship of manganese oxide catalysts for the catalytic oxidation of (chloro)-VOCs, Catalysts, 2019, 9, 726 CrossRef CAS.
- Q. Feng, H. Kanoh and K. Ooi, Manganese oxide porous crystals, J. Mater. Chem., 1999, 9, 319–333 RSC.
- L. Li, J. Shi, M. Tian, C. Chen, B. Wang, M. Ma and C. He, In situ fabrication of robust three dimensional ordered macroporous γ-MnO2/LaMnO3.15 catalyst for chlorobenzene efficient destruction, Appl. Catal., B, 2021, 282, 119565 CrossRef CAS.
- C. Zhang, H. Cao, C. Wang, M. He, W. Zhan and Y. Guo, Catalytic mechanism and pathways of 1,2-dichloropropane oxidation over LaMnO3 perovskite: an experimental and DFT study, J. Hazard. Mater., 2021, 402, 123473 CrossRef CAS PubMed.
- W. L. Wang, Q. Meng, Y. Xue, X. Weng, P. Sun and Z. Wu, Lanthanide perovskite catalysts for oxidation of chloroaromatics: secondary pollution and modifications, J. Catal., 2018, 366, 213–222 CrossRef CAS.
- X. Weng, Q. Meng, J. Liu, W. Jiang, S. Pattisson and Z. Wu, Catalytic oxidation of chlorinated organics over lanthanide perovskites: effects of phosphoric acid etching and water vapor on chlorine desorption behavior, Environ. Sci. Technol., 2019, 53, 884–893 CrossRef CAS PubMed.
- S. Royer, D. Duprez and S. Kaliaguine, Oxygen mobility in LaCoO3 perovskites, Catal. Today, 2006, 112, 99–102 CrossRef CAS.
- D. Martin and D. Duprez, Mobility of surface species on oxides. 1. isotopic exchange of 18O2 with 16O of SiO2, Al2O3, ZrO2, MgO, CeO2, and CeO2–Al2O3. activation by noble metals. correlation with oxide basicity, J. Phys. Chem., 1996, 100, 9429–9438 CrossRef CAS.
- A. Galdikas, D. Duprez and C. Descorme, A novel dynamic kinetic model of oxygen isotopic exchange on a supported metal catalyst, Appl. Surf. Sci., 2004, 236, 342–355 CrossRef CAS.
- Y. Chabre and J. Pannetier, Structural and electrochemical properties of the proton/γ-MnO2 system, Prog. Solid State Chem., 1995, 23, 1–130 CrossRef CAS.
- J. Zhang, Y. Li, L. Wang, C. Zhang and H. He, Catalytic oxidation of formaldehyde over manganese oxides with different crystal structures, Catal. Sci. Technol., 2015, 5, 2305–2313 RSC.
- S. Devaraj and N. Munichandraiah, Effect of crystallographic structure of MnO2 on its electrochemical capacitance properties, J. Phys. Chem. C, 2008, 112, 4406–4417 CrossRef CAS.
- V. P. Santos, M. F. R. Pereira, J. J. M. Órfão and J. L. Figueiredo, The role of lattice oxygen on the activity of manganese oxides towards the oxidation of volatile organic compounds, Appl. Catal., B, 2010, 99, 353–363 CrossRef CAS.
- W. Bao, H. Chen, H. Wang, R. Zhang, Y. Wei and L. Zheng, Pt nanoparticles supported on N/Ce-doped activated carbon for the catalytic oxidation of formaldehyde at room temperature, ACS Appl. Nano Mater., 2020, 3, 2614–2624 CrossRef CAS.
- M. Li, R. Zhang, H. Wang, H. Chen and Y. Wei, Role of the exposure facets upon diverse morphologies of cobalt spinels on catalytic deN2O process, Catal. Today, 2021, 376, 177–187 CrossRef CAS.
- K. Xiang, Z. Xu, T. Qu, Z. Tian, Y. Zhang, Y. Wang, M. Xie, X. Guo, W. Ding and X. Guo, Two dimensional oxygen-vacancy-rich Co3O4 nanosheets with excellent supercapacitor performances, Chem. Commun., 2017, 53, 12410–12413 RSC.
- G. Bai, H. Dai, J. Deng, Y. Liu, F. Wang, Z. Zhao, W. Qiu and C. T. Au, Porous Co3O4 nanowires and nanorods: highly active catalysts for the combustion of toluene, Appl. Catal., A, 2013, 450, 42–49 CrossRef CAS.
- M. Toupin, T. Brousse and D. Bélanger, Charge storage mechanism of MnO2 electrode used in aqueous electrochemical capacitor, Chem. Mater., 2004, 16, 3184–3190 CrossRef CAS.
- Y. Zhang, Electronegativities of elements in valence states and their applications. 1. electronegativities of elements in valence states, Inorg. Chem., 1982, 21, 3886–3889 CrossRef CAS.
- V. R. Galakhov, M. Demeter, S. Bartkowski, M. Neumann, N. A. Ovechkina, E. Z. Kurmaev, N. I. Lobachevskaya, Y. M. Mukovskii, J. Mitchell and D. L. Ederer, Mn 3s exchange splitting in mixed-valence manganites, Phys. Rev. B: Condens. Matter Mater. Phys., 2002, 65, 113102 CrossRef.
- F. Lin, Z. Zhang, N. Li, B. Yan, C. He, Z. Hao and G. Chen, How to achieve complete elimination of Cl-VOCs: a critical review on byproducts formation and inhibition strategies during catalytic oxidation, Chem. Eng. J., 2021, 404, 126534 CrossRef CAS.
- W. Wang, Q. Zhu, Q. Dai and X. Wang, Fe doped CeO2 nanosheets for catalytic oxidation of 1,2-dichloroethane: effect of preparation method, Chem. Eng. J., 2017, 307, 1037–1046 CrossRef CAS.
- M. Tian, C. He, Y. Yu, H. Pan, L. Smith, Z. Jiang, N. Gao, Y. Jian, Z. Hao and Q. Zhu, Catalytic oxidation of 1,2-dichloroethane over three-dimensional ordered meso-macroporous Co3O4/La0.7Sr0.3Fe0.5Co0.5O3: destruction route and mechanism, Appl. Catal., A, 2018, 553, 1–14 CrossRef CAS.
- P. A. Tarantilis, A. Beljebbar, M. Manfait and M. Polissiou, FT-IR, FT-Raman spectroscopic study of carotenoids from saffron (Crocus sativus L.) and some derivatives, Spectrochim. Acta, Part A, 1998, 54, 651–657 CrossRef.
- Y. Liu, W. Wu, Y. Guan, P. Ying and C. Li, FT-IR spectroscopic study of the oxidation of chlorobenzene over Mn-based catalyst, Langmuir, 2002, 18, 6229–6232 CrossRef CAS.
- J. Wu, Q. Xia, H. Wang and Z. Li, Catalytic performance of plasma catalysis system with nickel oxide catalysts on different supports for toluene removal: effect of water vapor, Appl. Catal., B, 2014, 156–157, 265–272 CrossRef CAS.
- H. A. Miran, M. Altarawneh, Z. Jiang, H. Oskierski, M. Almatarneh and B. Z. Dlugogorski, Decomposition of selected chlorinated volatile organic compounds by ceria (CeO2), Catal. Sci. Technol., 2017, 7, 3902–3919 RSC.
- L. Chen, Y. Liu, X. Fang and Y. Cheng, Simple strategy for the construction of oxygen vacancies on alpha-MnO2 catalyst to improve toluene catalytic oxidation, J. Hazard. Mater., 2021, 409, 125020 CrossRef CAS PubMed.
Footnote |
| † Electronic supplementary information (ESI) available. See DOI: 10.1039/d1ma00943e |
| This journal is © The Royal Society of Chemistry 2022 |

