 Open Access Article
Selective esterification of glycerol over ionic liquid functionalized cellulose (IMD-Si/HSO4@Cellulose) under energy-efficient microwave irradiation†
Nida
Khan
,
Mohd Umar
Khan
and
Zeba N.
Siddiqui
 *
*
Green Chemistry Laboratory, Organic Chemistry Division, Department of Chemistry, Aligarh Muslim University, Aligarh 202002, Uttar Pradesh, India. E-mail: siddiqui_zeba@yahoo.co.in; zeba.ch@amu.ac.in
First published on 23rd March 2022
Abstract
A green and sustainable route for selective esterification of glycerol has been developed. Selectivity towards triacetin was investigated in the esterification of glycerol using highly efficient silica-based imidazolium hydrogen sulphate supported on cellulose (IMD-Si/HSO4@Cellulose) as a heterogeneous catalyst. The cellulose-supported acidic ionic liquid material, IMD-Si/HSO4@Cellulose, was synthesized with cellulose in acetone by simple stirring of the ionic liquid (IMD-Si/HSO4). The synthesized catalyst was characterized by various techniques such as scanning electron microscopy/energy dispersive X-ray (SEM/EDX), elemental mapping, powder X-ray diffraction (XRD), transmission electron microscopy (TEM), thermogravimetric analysis (TGA), and Fourier transform infrared (FTIR) spectroscopy analyses. IMD-Si/HSO4@Cellulose showed excellent activity (100% conversion) and greater selectivity (99%) for the esterification of glycerol leading to the formation of triacetin under microwave irradiation in the minimum time (8 min). The catalyst was reused in up to five runs with insignificant loss in catalytic activity.
1. Introduction
With the increasing global demand for energy, non-renewable energy sources (fossil fuels) are continuously decreasing over the world. Therefore, to avoid this problem, we need to emphasize the use of renewable energy resources. One of the most efficient and convenient renewable energy resources is biodiesel, which is formed by the transesterification reaction between vegetable oils and methanol with alkali-based catalysts.1 Glycerol (a by-product of biodiesel) is economically viable due to its huge accumulation in the market and limited utilization. It is used as a raw material for invaluable chemical preparations, cosmetics, and fuel additives.1 Glycerol esterification with acetic acid or acetic anhydride can produce monoacetin (MAG), diacetin (DAG), and triacetin (TAG), and all of them have a wide range of applications.2 Glycerol-based additives show excellent quality in terms of their performance and are environmentally friendly.3 TAG is widely used as a fuel additive and also used in cosmetic industries.4 Due to the low cost and non-toxic behavior of acetic acid, it is a preferable acetylating agent although its reactivity is less than that of acetic anhydride. The glycerol esterification reaction has been performed efficiently over homogeneous acidic catalysts, such as H2SO4, HCl or p-toluenesulfonic acid (PTSA). However, it is well-known that these acids are non-recyclable and corrosive to equipment, leading to the formation of waste and pollutants. These problems can be overcome by the use of heterogeneous catalysts.2 Several heterogeneous catalysts have been used for the said reaction, such as ion exchange resins, a polysaccharide-derived mesoporous material, zeolites, carbonate-based materials, and alkaline earth metals.5 Heterogeneous catalysts with biodegradable supports such as cellulose, xanthan, starch, polyethylene glycol, and chitosan are of great interest in the field of green and sustainable chemistry. Cellulose is one of the most abundant biopolymers on the earth and is used in packaging and automobile factories. It is also used in biomedical and chemistry areas.6Ionic liquids (ILs) are molten salts consisting of cations (organic) and anions (organic/inorganic). They were initially termed as low melting point salts, but in recent studies, an ionic liquid refers to a molten salt with a melting point below 100 °C. ILs have many advantages such as negligible vapor pressure, good thermal and chemical stability, high ionic conductivity, good solubility and high synthetic flexibility. Among the ILs, imidazolium-based ILs have been extensively used in the field of catalysis due to the presence of a polar head group and a long alkyl side chain that segregates to form non-polar domains. The anionic part can be selected as per the requirements of the reaction to be catalyzed.7,8
Microwave-assisted organic synthesis is simple, clean, fast, efficient, and economically beneficial and is used to minimize the thermal effect of organic reactions on the environment. In the case of polar reactants, the microwave method provides uniform heating of the reaction medium. This quality can be explored in the esterification reaction of glycerol and acetic acid catalyzed by an acid catalyst, as all reaction components are polar in nature, including the acidic sites of the catalyst.9
In continuation of our ongoing research on ILs,10–12 the present work described the production of mono, di, and triacetin in the acetylation of glycerol with acetic acid catalyzed by a cellulose-supported ionic liquid functionalized acid catalyst, silica-based imidazolium hydrogen sulphate, (IMD-Si/HSO4@Cellulose) with superior selectivity for triacetin.
2. Experimental
2.1 General
The FTIR spectra (KBr) were recorded on a PerkinElmer RXI spectrometer. The TGA data were obtained with a DSC-60 Shimadzu instrument. TGA was performed in the temperature range 0–600 °C at a constant heating rate of 20 °C min−1 in a nitrogen atmosphere. X-Ray diffractograms (XRD) of the catalyst were recorded in the 2θ range of 5–90° at a scan rate of 8° min−1 on a Rigaku-Minifax X-ray diffractometer with Ni-filtered Cu Ka radiation at a wavelength of 1.54060 Å. The SEM-EDX characterization of the catalyst was performed on a JEOL JSM-6510 scanning electron microscope equipped with an energy-dispersive X-ray spectrometer operating at 20 kV. The TEM analysis was performed on a JEM-2100 F Model (ACC. Voltage: 200 kV) electron microscope. The Anton Paar Monowave 300 microwave synthesizer was used for the acetylation of glycerol. All solvents and chemicals used were purchased from Merck.2.2 Synthesis of IMD-Si/HSO4@Cellulose
The catalyst was synthesized as follows:2.4 General procedure for acetylation of glycerol under microwave irradiation
Glycerol (0.1 mol), acetic acid (0.6 mol), and IMD-Si/HSO4@Cellulose (20 mg) were taken in a standard borosilicate glass of 30 mL capacity (G30) and irradiated under microwave heating conditions at 100 °C and 110 W for specified periods. After each 60 s, intermittent cooling was done, and meanwhile, the reaction mixture was thoroughly mixed, and the sample was collected for analysis by gas chromatography coupled with mass spectrometry (GC-MS). The reaction progress was observed by thin-layer chromatography (TLC). The TLC measurements were done using a butanol–water (10![[thin space (1/6-em)]](https://www.rsc.org/images/entities/char_2009.gif) :
:![[thin space (1/6-em)]](https://www.rsc.org/images/entities/char_2009.gif) 1) mixture as a developer. After spotting and developing in the developer, the TLC plates were dried in an oven at 60 °C and then put in a TLC chamber containing iodine. If wet TLC plates were directly put in the TLC chamber, the spot along with the developing solvent spread out across the whole TLC plate, which created misjudgment in the confirmation of the product. The formation of triacetin was confirmed by analysis of the eighth sample with TLC and GC-MS.
1) mixture as a developer. After spotting and developing in the developer, the TLC plates were dried in an oven at 60 °C and then put in a TLC chamber containing iodine. If wet TLC plates were directly put in the TLC chamber, the spot along with the developing solvent spread out across the whole TLC plate, which created misjudgment in the confirmation of the product. The formation of triacetin was confirmed by analysis of the eighth sample with TLC and GC-MS.
3. Results and discussion
3.1 Synthesis and characterization of IMD-Si/HSO4@Cellulose
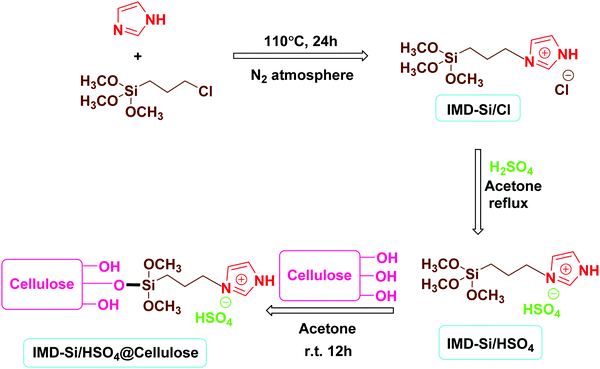
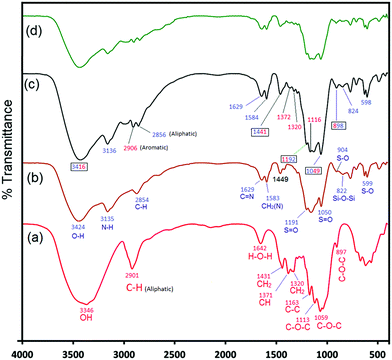
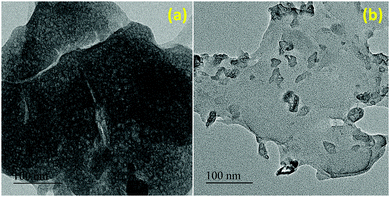
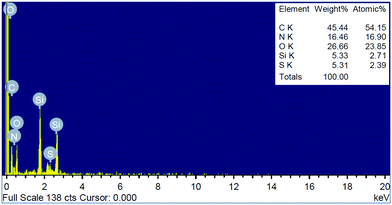
The novel heterogeneous catalyst (IMD-Si/HSO4@Cellulose) was synthesized using a simple impregnation method as outlined in Scheme 1. The synthesized catalyst was characterized by various techniques, including scanning electron microscopy/energy dispersive X-ray (SEM/EDX), elemental mapping, powder X-ray diffraction (XRD), transmission electron microscopy (TEM), thermogravimetric analysis (TGA) and Fourier transform infrared (FTIR) spectroscopy. The results of these characterization techniques have been discussed below.![[double bond, length as m-dash]](https://www.rsc.org/images/entities/char_e001.gif) O asymmetric and symmetric stretching vibrations appeared at 1191 cm−1 and 1050 cm−1, respectively. The FTIR spectrum of the cellulose-supported ionic liquid, IMD-Si/HSO4@Cellulose (Fig. 1c), displayed a broad peak at 3416 cm−1 due to the stretching vibrations of hydroxyl groups in the ionic liquid and cellulose, whereas the peak at 3135 cm−1 was assigned to the N–H stretching of the imidazole ring. The absorption bands at 1049 cm−1 and 1192 cm−1 were due to S
O asymmetric and symmetric stretching vibrations appeared at 1191 cm−1 and 1050 cm−1, respectively. The FTIR spectrum of the cellulose-supported ionic liquid, IMD-Si/HSO4@Cellulose (Fig. 1c), displayed a broad peak at 3416 cm−1 due to the stretching vibrations of hydroxyl groups in the ionic liquid and cellulose, whereas the peak at 3135 cm−1 was assigned to the N–H stretching of the imidazole ring. The absorption bands at 1049 cm−1 and 1192 cm−1 were due to S![[double bond, length as m-dash]](https://www.rsc.org/images/entities/char_e001.gif) O symmetric and asymmetric stretching vibrations, respectively. The bands at 1441 cm−1, 1372 cm−1, and 1320 cm−1 were attributed to CH2 scissoring, C–H bending and CH2 wagging modes of vibrations, respectively. In addition, C–H, C
O symmetric and asymmetric stretching vibrations, respectively. The bands at 1441 cm−1, 1372 cm−1, and 1320 cm−1 were attributed to CH2 scissoring, C–H bending and CH2 wagging modes of vibrations, respectively. In addition, C–H, C![[double bond, length as m-dash]](https://www.rsc.org/images/entities/char_e001.gif) N, and CH2(N) vibrations were observed at 2956 cm−1, 1631 cm−1 and 1584 cm−1, respectively. The peaks at 898 cm−1 and 825 cm−1 were due to C–O–C (cellulosic β-glycocidic linkage)/S–O stretching vibrations and Si–O–Si vibrations, respectively.
N, and CH2(N) vibrations were observed at 2956 cm−1, 1631 cm−1 and 1584 cm−1, respectively. The peaks at 898 cm−1 and 825 cm−1 were due to C–O–C (cellulosic β-glycocidic linkage)/S–O stretching vibrations and Si–O–Si vibrations, respectively.
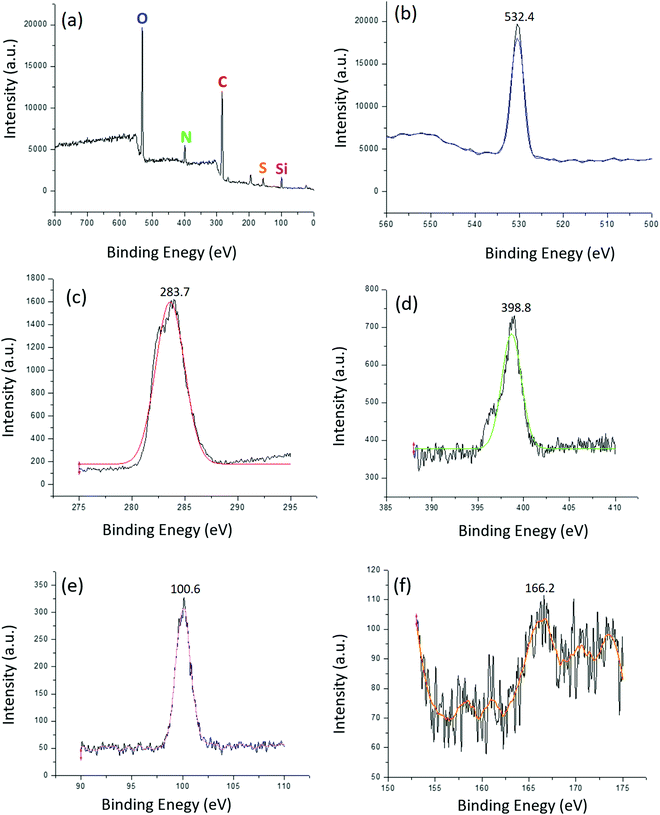 | ||
| Fig. 7 (a) Survey XPS spectrum of IMD-Si/HSO4@Cellulose; high resolution XPS spectrum of individual elements (b) O 1s, (c) C 1s, (d) N 1s, (e) Si 2p, and (f) S 2p. | ||
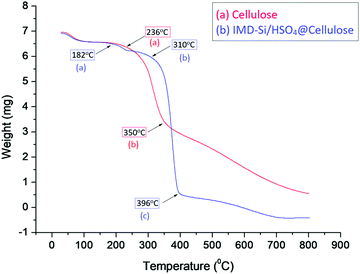
Furthermore, the weight % of elements obtained from XPS analysis showed that each element was present in a stoichiometric amount in the synthesized catalysts (IMD-Si/HSO4@Cellulose) (Table 1). The % content of N 1s (9.57%), Si 2p (5.18%) and S 2p (1.31%) confirmed the presence of a suitable amount of IMD-Si/HSO4 in the catalyst. These results were also in good agreement with TG analysis. 40% weight loss due to the IL was observed in TG analysis which may be composed of C, N, O, Si, S and H. The % content of elements in the 40% weight loss may be due to N (9.57%), Si (5.18%), S (1.31%) and C, O and H (23.94%). The data obtained from XPS analysis and weight loss from TG analysis confirmed the presence of the stoichiometric amount of IL on the surface of the catalyst.
| Element | O 1s | C 1s | N 1s | Si 2p | S 2p |
|---|---|---|---|---|---|
| Weight% | 26.68 | 57.27 | 9.57 | 5.18 | 1.31 |
3.2 Investigation of the acidic behavior of IMD-Si/HSO4@Cellulose by the Hammett indicator method
For estimating the Brønsted acidity of acidic materials, spectroscopic methods have been proven very useful in the last few decades.20 The Brønsted acidity of IMD-Si/HSO4@Cellulose was determined by the Hammett indicator method,21 and 4-nitroaniline was used as an indicator to capture the dissociative protons in water (Table 2). Brønsted acidity has been calculated by using the following equation:| H0 = pK(I)aq + log([I]s/[IH+]s) |
| Entry | Catalyst amount (mg) | A max (a.u.) | [I]s (%) | [IH+]s (%) | H 0 |
|---|---|---|---|---|---|
| a Reaction conditions: concentration of 4-nitroaniline = 10−4 mol L−1, pK(I)aq= 0.99, solvent = CCl4, catalyst = IMD-Si/HSO4@Cellulose, (25 mg), T = 25 °C. | |||||
| 1 | None | 1.0134 | 100 | 0 | — |
| 2 | 25 | 0.6134 | 60.52 | 39.48 | 1.175 |
To avoid the interference of solvent protons in the acidity measurement of IMD-Si/HSO4@Cellulose, the experiment was carried out in an aprotic solvent (CCl4). The variables in the above equation were calculated by applying the Beer–Lambert law in the UV-visible spectrum. The value of pK(I)aq for 4-nitroaniline (0.99) was previously known from the earlier report22 and used in the present study. A stock solution of basic indicator (4-nitroaniline, 10−4 mol L−1) was prepared and used throughout the experiment. By using a spectrophotometer, the first absorption spectrum of 4-nitroaniline was recorded, and the maximum absorbance (Amax) was found to be 1.0134 a.u at wavelength 341.7 nm (Fig. 8). Then, in the previously prepared solution of 4-nitroaniline, 25 mg of IMD-Si/HSO4@Cellulose was added followed by stirring for 20 min to homogenize the solution. The UV-visible spectrum of the mixture was recorded, and Amax was found to be 0.6134 a.u. at 341.7 nm. This was due to the protonation of the indicator with acidic protons of IMD-Si/HSO4@Cellulose to form IH+. From the above observations, the Hammett acidity function (H0 = 1.175) was calculated, and the results are summarized in Table 2. The results revealed the presence of enough acidic sites on the surface of the material (H0 = 1.175).
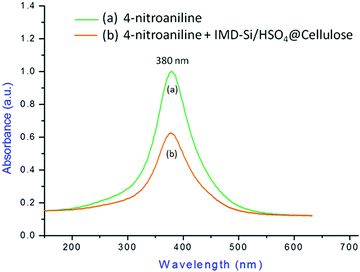 | ||
| Fig. 8 UV-Vis plot of (a) 4-nitroaniline and (b) a mixture of 4-nitroaniline and IMD-Si/HSO4@Cellulose. | ||
3.3 Quantitative estimation of H+ ion concentration in IMD-Si/HSO4@Cellulose by acid–base potentiometric titration
The presence of acidic sites in IMD-Si/HSO4@Cellulose was quantitatively determined by acid–base potentiometric titration. The results of titration confirmed the presence of 5.7 mmol g−1 of H+ ions on the surface of IMD-Si/HSO4@Cellulose. This means that 20 mg of catalyst contained 2.28 mmol g−1 of H+ ions.3.4 Investigation of a suitable catalyst for the selective conversion of glycerol
To select a suitable catalyst for the conversion of glycerol to triacetin, several IL catalysts were tried. First, a silica-based IL having chloride ions as an anion was used as a catalyst and a satisfactory result was obtained (Table 3, entry 1). The chloride ion was then replaced by metallic ions that enhanced the yield of triacetin (Table 3, entry 2–4). Acidic anions were also tried for the catalytic activity showing good to excellent results in terms of yield and reaction time (Table 3, entry 5–7). Among the acidic ILs, IMD-Si/HSO4 showed the best result (Table 3, entry 7). Since the surface area of the catalyst plays an important role in enhancing the rate of reaction; IMD-Si/HSO4 was supported on different biodegradable support materials and tested for catalytic activity (Table 3, entry 8–12). Out of all catalysts used, IMD-Si/HSO4@Cellulose showed the most excellent result because of selectivity and product yield (Table 3, entry 8). As confirmed from the earlier reports,23 selectivity often depends on catalyst activity and % conversion but at a high conversion level, actual selectivity can be misinterpreted. Hence, catalytic comparison at a low conversion level was investigated and is given in Table 3 (entries 13–20). The reaction was carried out under the conventional heating conditions to compare the results fairly as all the reported reactions (Table 3, entries 13–21) were performed in conventional heating conditions. At a low to moderate level of conversion, triacetin selectivity (33%) was very high as compared to other catalysts which showed that IMD-Si/HSO4@Cellulose can be used as a universal catalyst at both low and high conversion levels (Table 3, entries 20). Also, a catalytic test was performed using cellulose alone as a catalyst, and a good result was obtained in terms of triacetin selectivity (13.5%) at 51% glycerol conversion (Table 3, entries 21).| Entry | Catalyst | Conversion (%) | Selectivity (%) | Time | Ref. | ||
|---|---|---|---|---|---|---|---|
| Monoacetin | Diacetin | Triacetin | |||||
| a In microwave heating. b In conventional heating conditions. | |||||||
| 1a | IMD-Si/Cl | 35 | 12 | 28 | 60 | 23 min | This work |
| 2a | IMD-Si/FeCl4 | 43 | 12 | 26 | 62 | 26 min | This work |
| 3a | IMD-Si/ZnCl4 | 51 | 12 | 18 | 70 | 21 min | This work |
| 4a | IMD-Si/CuCl4 | 48 | 13 | 22 | 65 | 28 min | This work |
| 5a | IMD-Si/H2PO3 | 67 | 9 | 15 | 76 | 24 min | This work |
| 6a | IMD-Si/CH3CO2 | 56 | 12 | 16 | 72 | 22 min | This work |
| 7a | IMD-Si/HSO4 | 78 | 1 | 1 | 98 | 14 min | This work |
| 8a | IMD-Si/HSO4@Cellulose | 100 | <1 | <1 | 99 | 8 min | This work |
| 9a | IMD-Si/HSO4@Chitosan | 87 | 3 | 10 | 87 | 10 min | This work |
| 10a | IMD-Si/HSO4@PEG-6000 | 85 | 4 | 12 | 84 | 12 min | This work |
| 11a | IMD-Si/HSO4@Xanthan | 90 | 2 | 10 | 88 | 13 min | This work |
| 12a | IMD-Si/HSO4@Starch | 78 | 6 | 8 | 86 | 12 min | This work |
| Comparison at low conversion level | |||||||
| 13b | NaUSY | 64 | 25 | 1 | 14 | 3 h | 24 |
| 14b | [Hmim][HSO4] | 82.2 | 6.9 | 0 | 26.5 | 30 min | 25 |
| 15b | [HSO3-pmim][HSO4] | 79.3 | 10.3 | 0 | 40.7 | 30 min | 25 |
| 16b | AC | 42 | 54 | 3 | 15 | 3 h | 26 |
| 17b | PW1_AC | 20 | 65 | 14 | 55 | 3 h | 26 |
| 18b | PR | 90.7 | 9.1 | 0.1 | 25.8 | 7 h | 27 |
| 19b | PSPF-1 | 85 | 14.4 | 0.5 | 42 | 7 h | 27 |
| 20b | Cellulose | 51 | 41 | 45.5 | 13.5 | 45 min | This work |
| 21b | IMD-Si/HSO4@Cellulose | 42 | 34 | 33 | 33 | 10 min | This work |
3.5 Catalytic reaction
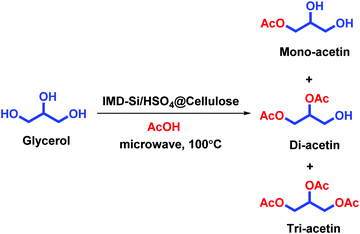
The reaction of glycerol with acetic acid in the presence of IMD-Si/HSO4@Cellulose as a heterogeneous catalyst under microwave irradiation at 100 °C was carried out, which afforded mono, di and triacetin (Scheme 2). The selectivity of triacetin was very high up to 99% in 8 min with a trace amount of mono and diacetin (>1%).3.6 Comparison of the present protocol with previously reported procedures for the esterification of glycerol
The performance of IMD-Si/HSO4@Cellulose for the selective acetylation of glycerol to triacetin was compared with previously reported procedures as given in Table S1 (ESI†). It was observed that IMD-Si/HSO4@Cellulose was superior among all catalysts in terms of selectivity, time and triacetin yield.4. Recyclability of the catalyst
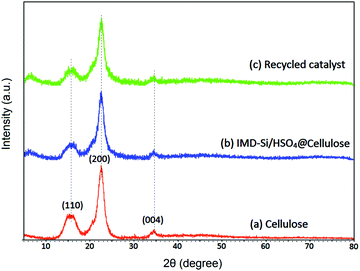
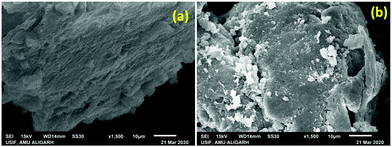
A three-cycle study of the catalyst was performed using a model reaction of glycerol (0.1 mol), acetic acid (0.6 mol), and IMD-Si/HSO4@Cellulose (20 mg) under microwave heating conditions at 100 °C for 3 min. After the completion of the reaction (monitored by TLC and GC-MS), the catalyst was filtered, washed with ethanol thrice, and dried in an oven for further use. The recycled catalyst was characterized with the help of FTIR, SEM, and TG analyses to check the functional changes that occurred during the course of the reaction. The FTIR spectrum (Fig. 1d) of the recycled catalyst showed similar frequency bands to the fresh catalyst indicating that no significant change was observed after the catalytic reaction. The XRD (Fig. 2c) and SEM (Fig. S2a, ESI†) analyses also showed a similar pattern and the same morphology when compared to the fresh catalyst. The TG analysis (Fig. S2b, ESI†) showed the same degradation process of the catalyst at the same temperature showing that the catalyst was thermally stable during the reaction. The catalyst was stable for up to five cycles while a slight decrement in the product yield was observed in the sixth run (Table S2, ESI†).Recyclability experiments at low conversion levels were also carried out to investigate the selectivity of triacetin under thermal conditions. It was observed that at a low conversion level, the selectivity of triacetin was good in the presence of IMD-Si/HSO4@Cellulose. The catalyst was efficient for up to five cycles as given in Table S3 (ESI†).
5. Conclusion
In summary, we have synthesized a novel heterogeneous catalyst, silica-based imidazolium hydrogen sulphate supported on cellulose (IMD-Si/HSO4@Cellulose), for the selective acetylation of glycerol affording triacetin in high yield under microwave irradiation. The catalyst was thoroughly characterized, and the results of characterization showed the successful formation of the desired catalyst. The acidity of the catalyst was investigated by the Hammett's acidity method, which showed high acidity (H0 = 1.175) due to the presence of HSO4 ions in the catalyst. The present methodology offered several advantages including sustainable reaction conditions, high product yield, greater selectivity and recyclability.Conflicts of interest
There are no conflicts to declare.Acknowledgements
The authors are thankful to the university sophisticated instrumentation facility, A. M. U (for SEM/EDX and TEM analysis) and IIT Kanpur (for XPS analysis).References
- B. Cahyono, Z. Rochim, A. Mufrodi, A. Hidayat and A. R. P. N. Budiman, J. Eng. Appl. Sci., 2016, 8, 5194–5197 Search PubMed.
- Y. Jiang, X. Li, H. Zhao and Z. Hou, Fuel, 2019, 255, 115842 CrossRef CAS.
- N. Rahmat, A. Z. Abdullah and A. R. Mohamed, Renew. Sustainable Energy Rev., 2010, 3, 987–1000 CrossRef.
- P. Ferreira, I. M. Fonseca, A. M. Ramos, J. Vital and J. E. Castanheiro, Catal. Commun., 2009, 10(5), 481–484 CrossRef CAS.
- P. S. Kong, M. K. Aroua and W. M. A. W. Daud, Catalytic esterification of bioglycerol to value-added products, Reviews in Chemical Engineering, 2015, vol. 31, pp. 437–451 Search PubMed.
- B. Sadeghiand and M. H. Sowlat Tafti, J. Iran. Chem. Soc., 2016, 8, 1375–1384 CrossRef.
- H. Zhiqi and P. Alexandridis, Phys. Chem. Chem. Phys., 2015, 28, 18238–18261 Search PubMed.
- K. N. Ghaffari, S. B. A. Hamid and S. J. J. Titinchi, Chin. Chem. Lett., 2016, 1, 104–108 Search PubMed.
- D. L. Pastre, D. M. Kochepka, A. Melinski, F. Wypych and C. S. Cordeiro, React. Kinet., Mech. Catal., 2019, 2, 991–1004 Search PubMed.
- M. U. Khan, S. Siddiqui and Z. N. Siddiqui, ACS Omega, 2019, 4(4), 7586–7595 CrossRef CAS PubMed.
- M. U. Khan, S. Siddiqui, W. A. Khan and Z. N. Siddiqui, New J. Chem., 2020, 44(12), 4822–4833 RSC.
- (a) M. U. Khan, R. A. Rather and Z. N. Siddiqui, RSC Adv., 2020, 10(73), 44892–44902 RSC; (b) M. U. Khan and Z. N. Siddiqui, Curr. Res. Green Sustainable Chem., 2021, 4, 100101 CrossRef.
- Q. Lyu, H. Yan, L. Li, Z. Chen, H. Yao and Y. Nie, Polymers, 2017, 9, 447 CrossRef PubMed.
- K. Anuj, Y. S. Negi, V. Choudhary and N. K. Bhardwaj, J. Mater. Phys. Chem., 2014, 1, 1–8 Search PubMed.
- M. Ghorbani, S. Noura, M. Oftadeh and M. A. Zolfigol, RSC Adv., 2015, 68, 55303–55312 RSC.
- W. Masahisa, L. Heux and J. Sugiyama, Biomacromolecules, 2004, 4, 1385–1391 Search PubMed.
- L. C. Yeng, M. U. Wahit and N. Othman, J. Teknol. Lab., 2015, 75, 11 Search PubMed.
- D. Ciolacu, F. Ciolacu and V. I. Popa, Cellul. Chem. Technol., 2011, 45(1), 13 CAS.
- B. Pang, R. Köhler, V. Roddatis, H. Liu, X. Wang, W. Viöl and K. Zhang, ACS Omega, 2018, 3(6), 6841–6848 CrossRef CAS PubMed.
- T. Cécile, H. O. Bourbigou, L. Magna, S. Luts and B. Gilbert, J. Am. Chem. Soc., 2003, 18, 5264–5265 Search PubMed.
- X. Huabin, T. Wang, Z. Zhou and Y. Dai, J. Mol. Catal. A: Chem., 2007, 1-2, 53–59 Search PubMed.
- P. Firdaus, T. Patra and S. Upadhyayula, Carbohydr. Polym., 2016, 135, 280–284 CrossRef PubMed.
- F. Schüth, M. D. Ward and J. M. Buriak, Chem. Mater., 2018, 30(11), 3599–3600 CrossRef.
- P. Ferreira, I. M. Fonseca, A. M. Ramos, J. Vital and J. E. Castanheiro, Catal. Commun., 2009, 5, 481–484 CrossRef.
- L. Xiumei, H. Ma, Y. Wu, C. Wang, M. Yang, P. Yan and U. Welz-Biermann, Green Chem., 2011, 3, 697–701 Search PubMed.
- P. Ferreira, I. M. Fonseca, A. M. Ramos, J. Vital and J. E. Castanheiro, Catal. Commun., 2011, 7, 573–576 CrossRef.
- Y. Jiang, X. Li, H. Zhao and Z. Hou, Fuel, 2019, 255, 115842 CrossRef CAS.
Footnote |
| † Electronic supplementary information (ESI) available. See DOI: 10.1039/d1ma00889g |
| This journal is © The Royal Society of Chemistry 2022 |

