DOI:
10.1039/D1MA00827G
(Paper)
Mater. Adv., 2022,
3, 418-436
Oleic acid induced tailored morphological features and structural defects in CuO for multifunctional applications†
Received
9th September 2021
, Accepted 27th October 2021
First published on 27th October 2021
Abstract
Synergistically tuned noble metals and intentionally formed complex heterostructured nanomaterials can enhance the required application effectiveness but at the cost of tedious synthesis routes, expensive chemicals, and sophisticated instruments. To overcome such demerits, herein, we report on the oleic acid-mediated convenient co-precipitation route using water–hexane as a biphasic solvent for CuO synthesis in the form of nano feathers (CuO-NF), solid/hollow hexagonal thin sheets (CuO-HS), and mega sheets (CuO-MS) at room temperature. The exotic CuO nanoarchitectures achieved were tested and compared with control samples (CuO-IS) for CO2 sensing, natural sunlight induced dye degradation, and catalytic CO2 reduction. Among the various CuO nanostructures synthesized, CuO-HS depicted higher oxygen deficiency, electronic conductivity, and visible light absorption. Most of the solid/hollow hexagonal thin sheets depicted an edge length in the 50–350 nm range with an observed thickness as low as 5 nm. The CuO-HS microsensor demonstrated ultrasensitivity (Rg/Ra = ∼85), dominant selectivity (>6 gases), repeatability (98.7%), CoV (1.3%), and LoD (4.3 ppm) at 32 °C towards CO2 in 20–5000 ppm. The role of structural defects in sensing was confirmed from operando UV-Vis-DRS & PL. Rapid dye degradation in natural sunlight shown by CuO-HS was primarily attributed to the lower charge reunification. Additionally, CuO-HS facilitated methanol formation within 3 h at a rate of 53 and 18 μmol g−1 in the presence of artificial solar and natural sunlight, respectively. Dye degradation and CO2 photoreduction pathways were probed using HPLC and GC-MS, respectively.
1. Introduction
Global concerns such as unrestricted carbon emissions, greenhouse gas management, toxic waste disposal, water purification, energy crisis, and workplace productivity continue to escalate, despite comprehensive research activities. Carbon dioxide (CO2) gas is one reason for many such concerns; hence, its monitoring, utilization, and sequestration remain a priority for every country.1 As per a recent study by the USA Department of Agriculture (USDA), CO2 gas is the most common atmospheric hazard encountered in confined spaces, leading to a decrease in workplace productivity. Shockingly, a typical individual exhales 900 grams of CO2 per day.1 Accurate detection of CO2 gas and its regular monitoring over an extended period at room temperature is a challenging task due to its highly resilient and thermodynamically stable nature.2,3 Among the many sensors reported in the literature,4–6 chemoresistive ones are economical, wherein the devices can be miniaturized with ease and the temperature-dependent sensing results from facile reversible carbonation chemistry. Ultrasensitive, selective, and stable sensors working under dry and humid conditions based on a wide range of nanomaterials have been reported.2–11 Despite several reports, one of the most crucial sensor parameters that still needs consideration is the operating temperature (To). Barring a few,7,9,12–14 most of the CO2 gas sensors reported in the literature operate in the range of 200–500 °C.2–4 Thus, the research activities focused on room temperature sensing are currently being encouraged. As such sensors are safe, perform well in a hazardous environment, and are easy to fabricate.
Furthermore, manufacturing industries in developing countries face the challenge of disposing hazardous organic dyes during the processing of textiles and pharmaceuticals. Globally, as high as 104 tonnes of organic pigment is thrown into freshwater post application processes, resulting in increased toxicity to flora and fauna.15 Dye removal as a part of wastewater treatment is difficult, and to overcome it, many novel nanomaterials have been developed.16–18 Reported studies utilized expensive photocatalytic reactors and many times the reactions conducted on a lab-scale were difficult to mimic in real-time due to customized settings. Furthermore, another severe issue of growing carbon emissions leading to drastic climatic changes and global warming has been trending for the past few decades. Artificial photosynthesis enabled CO2 reduction to hydrocarbon fuels is touted as an effective technique to convert solar energy into chemical energy and mitigate hazardous emissions.19 Despite attempts,20 nanomaterials reported for CO2 photoreduction showed poor stability, a small conversion rate, and lower electron transfer, which are vital for any catalytic process.21 Moreover, the photoreduction process becomes exclusive due to the use of scarcely available elements.22–24 Although several such inclusive studies were reported, there are still ample opportunities for the in-depth investigation leading to the development of synthesis routes to improve application effectiveness.
In this context, CuO is a promising candidate owing to excellent optoelectronic properties stemming from weakly bonded d-electrons and chemistry with CO2 gas due to low electron affinity.23–25 Within this framework, we report on oxygen deficient CuO nanostructures synthesized using a water-hexane biphasic solvent. Insights into the growth mechanism of nanostructures formed by varying oleic acid amounts were detailed. Furthermore, their ability to sense CO2 gas, degrade dyes and CO2 conversion was explored. Ultrasensitive, highly selective, and repeatable CO2 detection at room temperature in dry and wet conditions was achieved by integrating the nanomaterial on an economic planar transducer. A focus was also placed on comprehending sensing phenomena by employing operando techniques supported by VBM-XPS and μ-Raman. The degradation activities were studied under natural sunlight and the mechanism was confirmed using HPLC. The nanoarchitectures were also investigated as photocatalysts with high stability for methanol production in the absence of a photosensitizer under simulated solar and natural sunlight. Methanol evolution from CO2 was probed using an isotope-tracer experiment and correlated with GC-MS data.
2. Experimental section
2.1 Materials and chemicals
Cupric acetate monohydrate (Cu(CH3COO)2·H2O), sodium hydroxide flakes (NaOH), bromocresol purple (C21H16Br2O5S), malachite green (C23H25ClN2), and eosin yellow (C20H6Br4Na2O5) stain powders were acquired from Thermo Fisher Scientific. Extra pure grade oleic acid (C18H34O2), hexane (C6H14), and ethanol (C2H5OH) were procured from Finar Chemicals. Infrared spectroscopy grade potassium bromide (KBr) suitable for FTIR and UV-Vis-DRS was purchased from Sigma Aldrich. All the chemicals received were of analytical reagent (AR) grade and used without any further purification. Double distilled water (15.6 MΩ cm at 32 °C) was used throughout the experimentations.
2.2 Synthesis of CuO nanoarchitectures
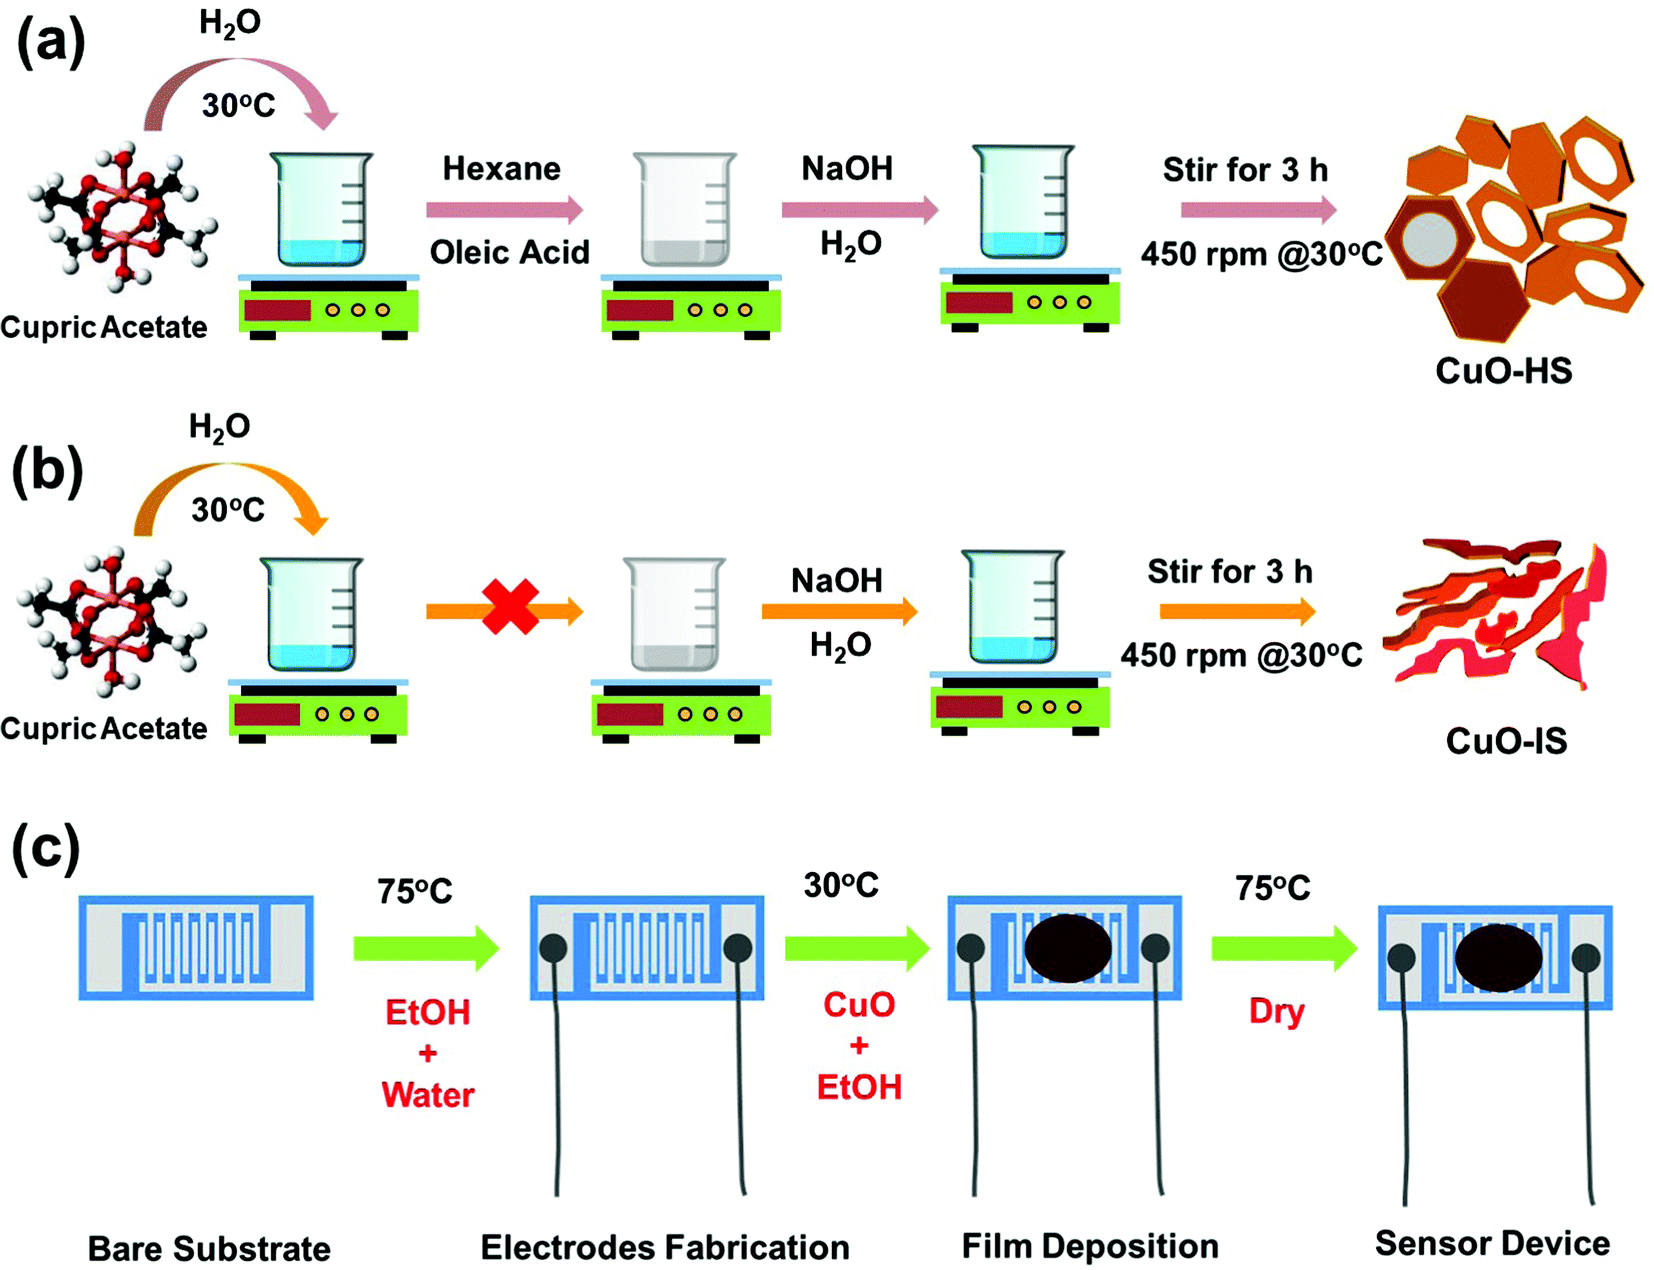
In a typical synthesis procedure, ca. 0.73324 g (4 mmoles) of cupric acetate monohydrate was dissolved in 50 mL of double-distilled water under magnetic stirring at 450 rpm and 32 °C. To the solution, 2.528 mL of oleic acid dissolved in 50 mL of hexane was added dropwise using a micropipette. Then, a solution of NaOH flakes (8 mmoles) dissolved in 30 mL water was added dropwise. During the addition of NaOH solution, the pale blue colored cupric acetate solution with oleic acid and hexane solution started to turn dark blue and eventually turned dark brown. The dark brown suspension was then stirred for 180 min under the same setting. Afterward, the resultant residue was diluted with distilled water and centrifuged (Neospace, BioEra, India) at a speed of 10![[thin space (1/6-em)]](https://www.rsc.org/images/entities/char_2009.gif) 000 rpm for 3 min to obtain a brown product. A continuous cycle consisting of centrifuging, ultrasonication, and washing with distilled water (5–6 times) followed by ethanol wash ensured the complete removal of organic impurities. The product was dried overnight in a hot air oven at 75 °C. Hereafter, the CuO powder synthesized by this route will be referred to as CuO-HS. Two similar CuO samples, namely nano feathers (CuO-NF) and mega sheets (CuO-MS) were synthesized by adding the oleic acid in an amount of 0.5056 and 7.584 mL, respectively. To ascertain the role of the oleic acid–hexane solution as a surfactant, control CuO samples were synthesized by the above route in their absence. Since the electron micrograph depicted the morphology as irregular sheets/structures, the sample henceforth will be referred to as CuO-IS. The synthesis of CuO nanostructures presented here draws inspiration from the previously reported methodologies.26–28 A summary of the synthesis parameters used, and the corresponding morphologies achieved at room temperature is detailed in the ESI† (see the ESI,† Table S1). The schemes depicting the synthesis methodologies followed for achieving CuO nanoarchitects in the form of solid/hollow hexagonal and irregular sheets are shown in Fig. 1a and b.
000 rpm for 3 min to obtain a brown product. A continuous cycle consisting of centrifuging, ultrasonication, and washing with distilled water (5–6 times) followed by ethanol wash ensured the complete removal of organic impurities. The product was dried overnight in a hot air oven at 75 °C. Hereafter, the CuO powder synthesized by this route will be referred to as CuO-HS. Two similar CuO samples, namely nano feathers (CuO-NF) and mega sheets (CuO-MS) were synthesized by adding the oleic acid in an amount of 0.5056 and 7.584 mL, respectively. To ascertain the role of the oleic acid–hexane solution as a surfactant, control CuO samples were synthesized by the above route in their absence. Since the electron micrograph depicted the morphology as irregular sheets/structures, the sample henceforth will be referred to as CuO-IS. The synthesis of CuO nanostructures presented here draws inspiration from the previously reported methodologies.26–28 A summary of the synthesis parameters used, and the corresponding morphologies achieved at room temperature is detailed in the ESI† (see the ESI,† Table S1). The schemes depicting the synthesis methodologies followed for achieving CuO nanoarchitects in the form of solid/hollow hexagonal and irregular sheets are shown in Fig. 1a and b.
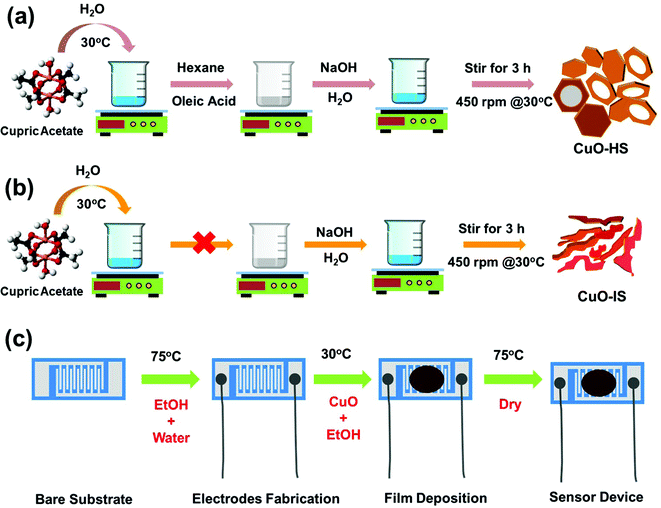 |
| | Fig. 1 Schematic representation illustrating methodologies followed to achieve (a) solid/hollow hexagonal sheets (CuO-HS) and (b) irregular sheets (CuO-IS). (c) Fabrication of sensor device for CO2 gas monitoring. | |
2.3 Materials characterization
Powder X-ray diffractograms (P-XRD) were recorded on a Bruker AXS diffractometer (D8 ADVANCE) with a Cu anode (Kα1 radiation, λ = 1.5406 Å). Ultraviolet-Visible Diffuse Reflectance Spectroscopy (UV-Vis-DRS) was performed on an AvaSpec-ULS2048 Starline fiber optics spectrophotometer. Thermogravimetric (TG) and differential thermal analysis (DTA) were done on a TA Q50 thermo-gravimetric analyzer at a 10 °C min−1 ramp rate in the air from 30 to 800 °C. Fourier transform infrared spectra (FTIR) were recorded using the Bruker ALPHA-T instrument. X-Ray photoelectron spectroscopy (XPS) and valence band maxima (VBM) spectra were collected using the KRATOS AXIS Supra+, and the binding energies (B.E.) were corrected using an internal reference peak of C 1s peak centered at 284.80 eV. Confocal μ-Raman spectroscopy was performed using a Horiba Jobin-Yvon LabRam HR spectrometer. Field emission scanning electron micrographs (FESEM) were recorded on a JEOL JSM-7610F (JEOL Inc. Japan), and energy dispersive X-ray analysis (EDAX) was performed with an OXFORD Inca detector. A technique mimicking operando ultra-violet visible diffuse reflectance spectroscopy (UV-Vis-DRS) was carried out on a Cary 6000i UV-Vis-NIR spectrophotometer. Briefly, 3 mg of CuO-HS sample was ground with 3 g of potassium bromide (KBr) using a mortar-pestle and pressed into a thick pellet with the help of a pellet maker. This was followed by vacuum drying the pellet at 60 °C for 40 min to remove moisture or organic species adsorbed on the surface. The pellet was scanned at room temperature and data were collected in the absence and presence of the target gas. During the in situ measurements, highly concentrated CO2 gas (99.999% purity) was pumped into the sample chamber at a flow rate of 200 sccm using a custom-built gas mixing setup. Similarly, in situ photoluminescence (PL) spectra with and without CO2 gas were recorded using a HORIBA Jobin Yvon Fluorolog FL 3–11 spectrofluorometer. Samples in the form of thin-films were prepared by uniformly dispersing 5 mg of nanomaterial in ethanol followed by drop-casting on an ITO coated rectangular glass slide having resistivity in the range of 15–25 Ω sq−1. Before each run, nanomaterial coated glass slides were vacuum dried at 60 °C for 2 h. High Performance Liquid Chromatography (HPLC) profiles to understand the malachite green dye degradation were collected using a Shimadzu Prominence series liquid chromatography instrument (Shimadzu Corporation, Kyoto, Japan). The instrument consisted of a degassing unit (DGU-20A3), a low pressure gradient flow control valve (LC-20AD), an autosampler (SIL 20ACHT), a system controller (CBM-20A), a solvent delivery module (LC-20AD), a column oven (CTO-10ASvp) and a photodiode array detector (SPD-M20A). During the sample run, ZORBAX 300 Extend C18 column having specifications: inner diameter (ID) – 4.6 mm, length (L) – 150 mm, and particle size – 5 μm was employed. The chromatographic separation was carried out using a mobile phase mixture of deionized water and acetonitrile at 65:35 (v/v) and degassed thoroughly using a vacuum degasser before initiating the sample run. The flow rate was set at 0.7 mL min−1 and the column was maintained at room temperature with an injection volume of 20 μL and the detector wavelength set at 259 nm. The Shimadzu GC-MS analyzer (GC 2010 Plus, GCMS-OP2020) used was equipped with an automated gas valve with helium (He) as the carrier gas, quadrupole detector, capillary column, flame ionization detector (FID), and a thermal conductivity detector (TCD).
2.4 Gas sensor set-up, device fabrication, and sensing characteristics
The gas sensor setup, test patterns, and sensing measurements are as per earlier reports.10,11 The steps involved in the device fabrication are represented in Fig. 1c. In-depth information on the sensor assembly and sensor device fabrication is further illustrated elsewhere (see the ESI,† SI, Section A0, Fig. S1). Before initiating the sensing experiments, the microsensors were heated at 200 °C for 9 to 12 h in dry air as well as in CO2 gas. The heating process carried out for a significant time assured a highly stable response, complete removal of organic moieties, and adsorbed moisture on the surface of the nanomaterial. Post heating, the morphology of the nanomaterials remained unaffected in each case and was confirmed from electron micrographs. The CO2 gas sensing experiments were performed in dry air at 32 °C. The sensor response was also recorded against 59% relative humidity measured at 32 °C. During a standard sensing experiment, high-quality CO2 gas (99.999% purity, industrial grade) in a calculated amount was pumped into the sensor chamber at a gas flow rate of 200 cm3 min−1 using a mass flow controller (MFC) procured from the MKS Instruments. The target gas concentrations in the range of 20–5000 ppm were achieved by diluting CO2 gas with air. Here the gas concentrations are a-100, b-300, c-500, d-700, e-1000, and f-2000 ppm. The selectivity of the samples was determined by exposing them to six industrial relevant gases such as carbon monoxide (CO), nitrogen dioxide (NO2), nitric oxide (NO), sulfur dioxide (SO2), hydrogen (H2), and hydrogen sulfide (H2S). Oxidising by nature, the sensor response (SR) for CO2 gas is usually defined as (Rg/Ra), and the sensitivity (S) is defined as SR × 100 (%). Here, Rg is the resistance in the presence of CO2 gas and Ra is the resistance of the sensor in the air. However, in the current work, we observed a decrease in sensor resistance upon introducing the CO2 gas in the chamber. Hence, the sensor response (SR) for CO2 gas in the current study is defined as (Ra/Rg) based on the raw sensor data. The response time is defined as the time taken to reach nearly 90% of the response magnitude, whereas the recovery time is the time required up to 90% of response recovery. The electrical resistances were recorded using Keysight 34465A 61/2 DM Truevolt multimeters interfaced with LabVIEW. Sensor data analysis was done using Origin Pro 8.5 software.
2.5 Natural sunlight induced dye degradation and photoelectrochemical analysis
The photocatalytic studies were evaluated by monitoring the degradation rate of three organic dyes, namely, bromocresol purple (BP), eosin yellow (EY), and malachite green (MG). Dye solutions were placed in volumetric flasks (Borosil, India) and kept on an open terrace in ambient air at a standard temperature and pressure. Pictorial representation is provided elsewhere (see the ESI,† Fig. S2). Natural sunlight-induced dye degradation studies were carried out from the 12th to 29th March 2021 on the terrace of the main academic building at G. S. Mandal's Marathwada Institute of Technology, Aurangabad, Maharashtra, India, having co-ordinates as 19.8493°N, 75.3216°E. The tests were conducted daily for 3 h from 11 am to 2 pm. During this period, the light intensity measured using a lux meter was in the range of 70 to 100 mW cm−2. In each case, 25 mg of sample powder, that is, individually was suspended through ultrasonication in BP, EY, and MG solution (1 × 10⁻⁵ M, 25 mL) to achieve a standard concentration of the catalyst in the dye solution. All three dye solutions with sample powders (in total, 6 volumetric flasks with dye-catalysts solution) were ultrasonicated for 30 min in the dark to equilibrize a reversible physisorption process of dyes on the sample surfaces. After 30 min of ultrasonication, the volumetric flasks were taken to the institute's terrace and kept in an open area for ease in harnessing the natural sunlight. The aliquots (0.5 mL) were taken out from the volumetric flasks at an interval of 1 h, and the supernatant was collected after centrifuging which was carried out in a programmable microcentrifuge (Minlyn, BioEra, India). The dye concentration was determined by observing the wavelength of maximum absorption of the supernatant by recording the spectra using a UV-Vis spectrophotometer (Model – SL 210, ELICO, India). The calibration plot following Beer–Lambert's law was established by correlating the absorbance to the dye concentration. Repeatability was ascertained by repeating natural sunlight-induced dye degradation studies four consecutive times under the same environment. After each cycle, the sample powder was washed with distilled water and oven-dried at 60 °C for 10 h. Dye degradation was monitored using a TOC-L-CPH Shimadzu analyzer. The methods for sample preparation and photoelectrochemical analysis were carried out as per the earlier report.29
2.6 Catalytic CO2 reduction to methanol
The photoconversion of CO2 gas was carried out in a custom designed quartz reactor with 125 mL overall capacity. Before each run, CuO nanopowder (that is, individually CuO-MS, CuO-HS, CuO-NF, and CuO-IS) in a calculated quantity of 25 mg was dispersed in 75 mL double distilled water. The reactor was continuously purged with N2 gas for 30 min at a 200 cm3 min−1 flow rate to ensure that all the dissolved gases in water and other impurities were removed from the reactor. The uniformly dispersed solution was then purged with industrial-grade CO2 gas for 30 min to saturate the reactor. Thereafter, the flow rate was decreased to 10 cm3 min−1. The flow rate was controlled by a mass flow controller. Then the quartz reactor was completely sealed with a septum to avoid leakage of CO2 gas or the end products. Once the flow was stabilized, the light source was turned on, and the concentrations of products generated versus the irradiation time were recorded. For a comparative performance, four light sources, namely, UV (medium pressure Mercury vapor lamp of 125 W), artificial solar simulation (Xenon arc lamp of 300 W), visible (white cold floodlight LED of 20 W), and natural sunlight, were used. The artificial lamps were purchased from Prism Electronics Systems, Nashik, India. The methodology followed for CO2 conversion to methanol by harvesting natural sunlight was the same as the dye degradation studies. The quartz reactor was equipped with a double-wall jacket, which has an arrangement for cold water circulation to maintain low temperature around the artificial lamp as well as to increase CO2 gas solubility in water. Using similar settings, the blank reactions without CO2 gas, or photocatalyst, or light source were carried out to validate that the product formed is due to CO2 photoreduction in the presence of a photocatalyst. The blank studies did not detect any product. The reaction was regularly monitored by withdrawing the sample (∼0.5 mL) every 1 h with the help of a long needle syringe. A similar protocol was followed during the isotope-tracer experiment performed using 13CO2 (Sigma-Aldrich) as a feedstock with CuO-HS powder.23 Only the CuO-HS catalyst was selected as it showed excellent performance during the initial studies when compared to other CuO samples. The concentrations of gaseous products evolved from the quartz reactor were quantitatively determined using a Shimadzu GC-MS analyzer.
3. Results and discussion
3.1 Initial studies, physicochemical characterization, and growth mechanism
The crystal structure and phase composition of CuO nanoarchitectures were examined by powder-XRD. A typical X-ray diffractogram of CuO-HS showed peaks that can be readily indexed to standard monoclinic tenorite CuO (JCPDS:74-1021, space group: C2/c(15)) with lattice parameters as: a = 4.624 Å, b = 3.409 Å, and c = 5.118 Å (Fig. 2a). Additionally, a secondary phase Cu64O, matching well with the orthorhombic crystal structure (JCPDS:77-1898, space group: Bmm2(38)), was observed in minor percentage. Crystalline phases other than CuO and Cu64O were not detected from the X-ray diffractogram. Slightly broader peaks observed for the CuO-HS sample when compared to the CuO-NF and CuO-IS patterns hinted at smaller-sized grains (see the ESI,† Fig. S3). The average crystallite size, dislocation density, and microstrain induced in the CuO-HS were found to be 7.85 nm, 23.28 × 10⁻³ nm−2, and 4.60 × 10⁻³, respectively. The bandgap of the as-synthesized nanomaterials was evaluated from UV-Vis-DRS (Fig. 2b). The CuO-IS sample demonstrated an absorption edge at 885.72 nm (1.40 eV), whereas CuO-HS showed a bandgap of 1.72 eV (∼719 nm). The hypsochromic shift observed for CuO-HS could be ascribed to the oleic acid-mediated synthesis route using biphasic solvent resulting in increased oxygen vacancies.30 The thermal stability of CuO-HS was confirmed from the TG-DTA technique that showed the presence of two weight loss zones attributed to the removal of moisture and organic matter from the precursor/solvents (Fig. 2c and see the ESI,† Section A1). The nature of chemical bonds in the CuO-IS and CuO-HS samples was probed by FTIR (Fig. 2d and see the ESI,† Section A1).
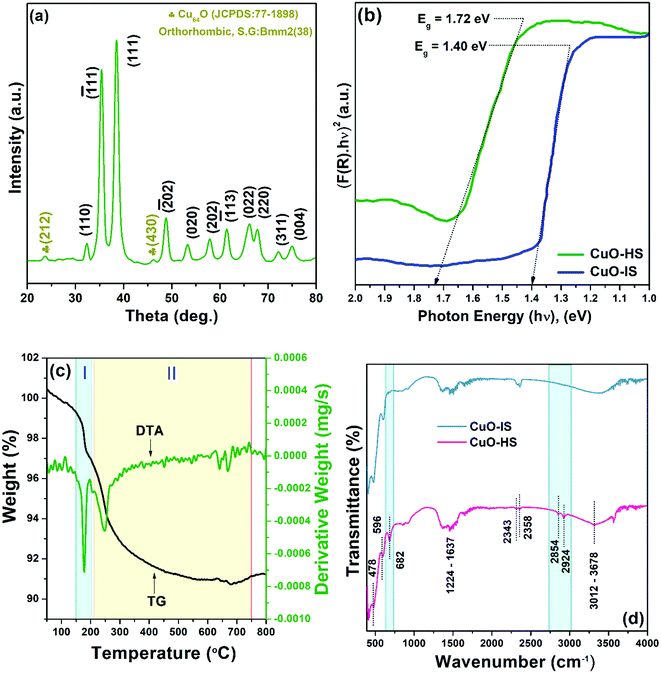 |
| | Fig. 2 (a) Powder X-ray diffractogram for CuO-HS, (b) UV-Vis diffuse reflectance spectra, (c) thermogravimetric differential thermal analysis of CuO-HS, and (d) Fourier transform infrared spectra. | |
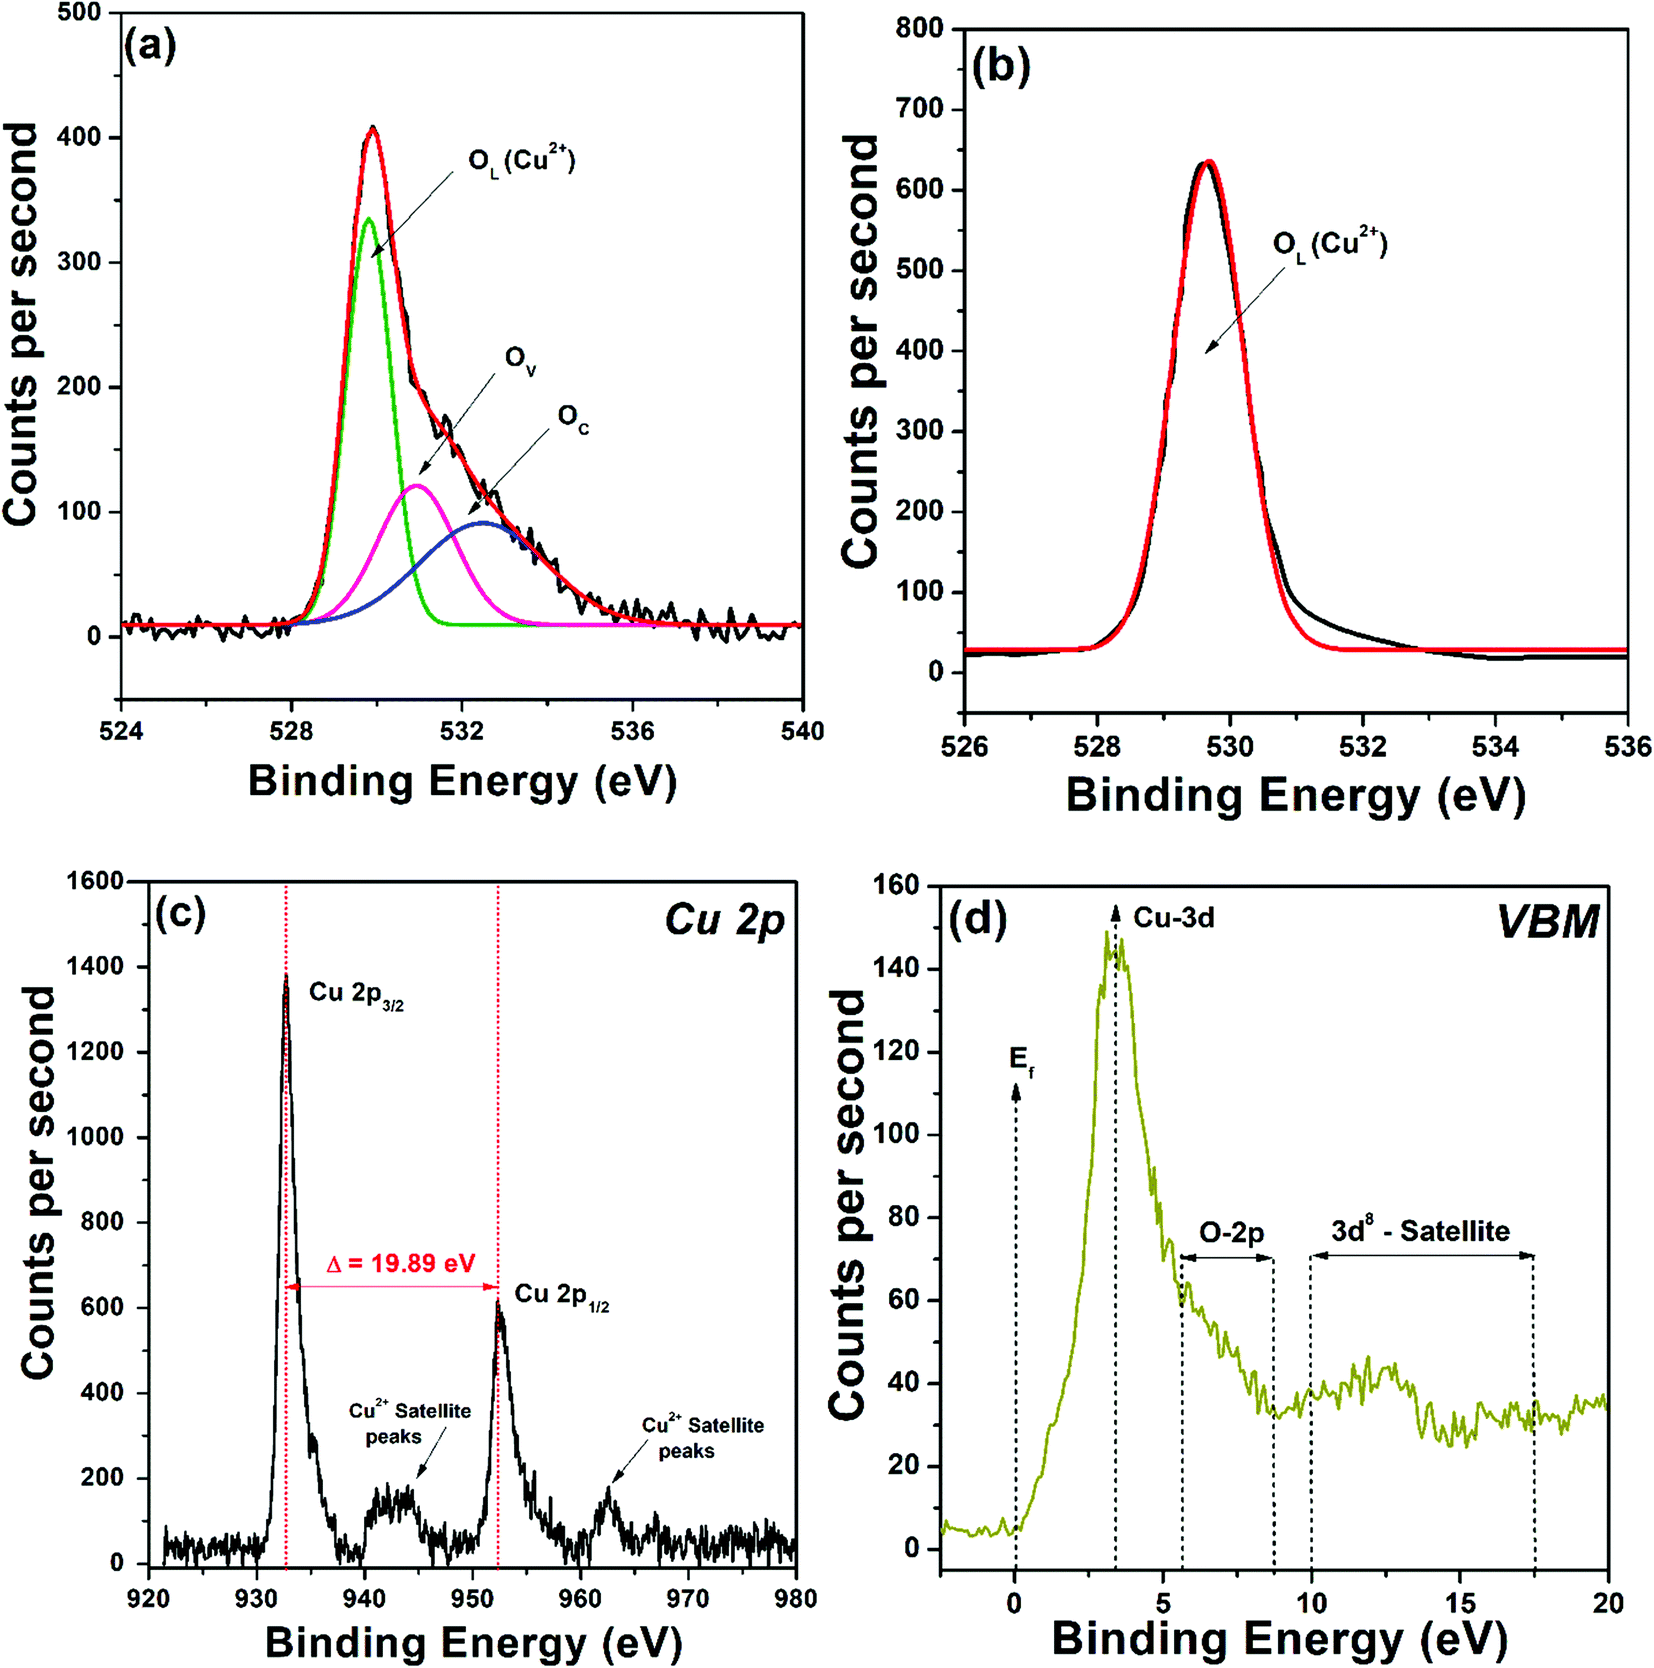
The surface chemistry and oxidation states were investigated using VBM-XPS. The survey spectrum of CuO-HS showed peaks such as Cu 3d, Cu 3p, Cu 3s, C 1s, O 1s, Cu LMM, Cu 2p, and Cu 2s (see the ESI,† Fig. S4). For CuO-HS, CuO-MS, and CuO-NF, the O 1s core level showed an asymmetric curve, readily resolved by Gaussian fitting into three peaks corresponding to lattice/interstitial oxygen (OL), oxygen vacancies (OV), and chemisorbed oxygen (OC) (Fig. 3a and see the ESI,† Fig. S5). The presence of oxygen vacancies is in good agreement with the UV-Vis DRS analysis. In stark contradiction, the O 1s core level for the control sample, that is CuO-IS was found to be symmetric with lattice/interstitial oxygen (OL) percentage as high as 97.35% (Fig. 3b and see the ESI,† Table S2). The CuO-IS sample did not show the presence of OV and OC species, which could be attributed to the absence of oleic acid–hexane mixture during its synthesis. Interestingly, the relative percentage of OC in CuO-HS, CuO-NF, and CuO-MS was found to be 30.64, 20.24, and 18.27%, respectively (see the ESI,† Table S2). A higher percentage of OC is imperative as it directly indicates a nanomaterial's ability to absorb a higher amount of molecular oxygen on its surface.31 Interestingly, chemoresistive CO2 sensors rely predominantly on the adsorbed oxygen species for reversible charge transfer that is eventually taken as a sensor signal.31,32 Furthermore, oxygen vacancies in the metal oxide semiconductor help in delaying the electrons and holes reunification, thus improving its ability to absorb light in the visible region during photocatalysis. Here, the higher percentage of chemisorbed oxygen present in the hexagonal sheets compared to irregular structures is anticipated to endow itself with similar merits in enhancing the natural sunlight-induced dye degradation and CO2 conversion performances. The XPS core level of Cu 2p showed peaks at 952.85 and 932.96 eV, corresponding to Cu 2p1/2 and Cu 2p3/2, respectively (Fig. 3c). The spin–orbital splitting energy of 19.89 eV between Cu 2p1/2 and Cu 2p3/2 confirmed the existence of Cu2+ in monoclinic CuO.10,29 From the valence band maxima, the binding energy of 3.64 eV confirms Cu 3d electrons, and the structure between 5.62 eV and 8.71 eV is attributed to O 2p (Fig. 3d). Additionally, the structure between binding energies of 9.99 and 17.48 eV are related to the d8 final state formed from the d9 initial state.33 The confocal μ-Raman spectrum revealed that the wavenumber values associated with the CuO-HS sample are slightly lower than those reported in the literature (see the ESI,† Fig. S6). A plausible reason could be due to decreased grain size, hollow structures, or the existence of oxygen vacancies in the form of oxygen-deficient regions (Vo), chemisorbed oxygen (OC) or O2− ions at the interstitial sites.34 Raman results are in perfect agreement with XRD, UV-Vis-DRS, and VBM-XPS data.
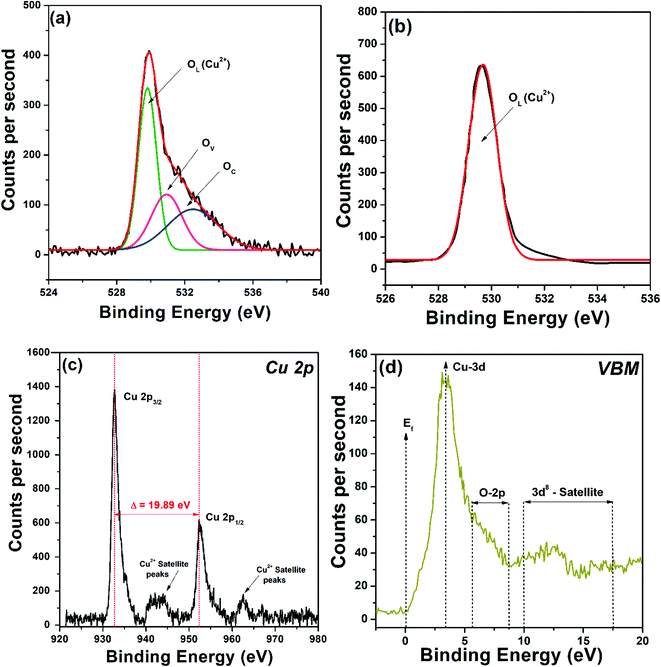 |
| | Fig. 3 X-Ray photoelectron spectroscopy data illustrating core level O 1s for (a) CuO-HS and (b) CuO-IS. (c) Core level Cu 2p and (d) valence band maxima (VBM) for the CuO-HS sample. | |
Morphological evolution and elemental composition were studied using FESEM and EDAX techniques (Fig. 4a–i). All the nanoarchitectures, namely CuO-IS (irregular sheets), CuO-NF (nano feathers), CuO-HS (solid/hollow hexagonal thin sheets), and CuO-MS (mega hexagons), were synthesized at room temperature without any post-processing techniques. Irregular sheets with thicknesses ranging from 5 to 30 nm and with a length from 100 to 800 nm were observed for CuO-IS, which did not involve the use of the oleic acid–hexane solution (Fig. 4a–c). Upon adding oleic acid (0.5056 mL) to hexane, the irregular sheets evolved into highly thin nano feathers (CuO-NF), demonstrating tapered ends and smooth surfaces with thicknesses ranging from 3 to 20 nm and length from 200 to 1000 nm (Fig. 4d–f). Energy-dispersive X-ray scanning and elemental mapping were carried on the CuO-NF sample to realize the uniform presence of elements in the samples (see the ESI,† Fig. S7). The elemental mapping showed an even distribution of copper (Cu) and oxygen (O) along with carbon (C) throughout the area (see the ESI,† Fig. S7). Increasing the oleic acid amount to 2.528 mL whilst keeping hexane fixed at 50 mL led to the formation of solid/hollow hexagonal CuO thin sheets along with agglomerated nanoparticles in significant quantities (Fig. 4g–i). Most of the solid hexagonal sheets were in the size range of 50–150 nm (Fig. 4g and h), whereas the hollow hexagonal sheets ranged from 200–350 nm (Fig. 4i). In both cases, the thickness observed was from 5 to 30 nm. Huge-sized solid hexagons with sizes ranging from 400 nm to 2.5 μm and a thickness of 30 to 60 nm were observed upon increasing the oleic acid volume to 7.584 mL in a 50 mL hexane solution (see the ESI,† Fig. S8). Hollow structures were not visible, however, some mega hexagons appeared to arrange themselves in floral patterns (see the ESI,† Fig. S8.c, and d) hinting at the formation of a hierarchical structure. This will require additional experimentation for the optimization of oleic acid concentration. Morphological evolution as a function of oleic acid–hexane solution is schematically illustrated in Fig. 4j.
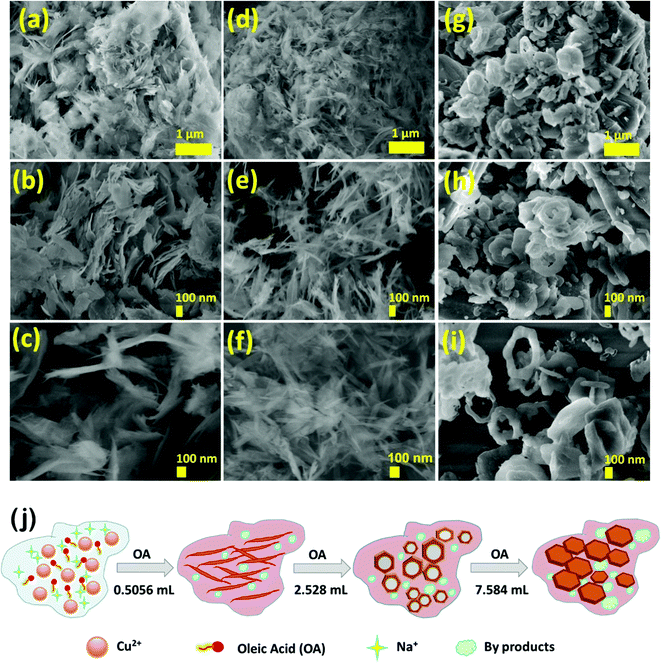 |
| | Fig. 4 Scanning electron micrographs for CuO nanoarchitectures (a–c) without oleic acid–hexane solution (CuO-IS), (d-f) with 0.5056 mL oleic acid in 50 mL hexane (CuO-NF), and (g–i) with 2.528 mL oleic acid in 50 mL hexane (CuO-HS). (j) Schematic illustration depicting morphological evolution as a function of oleic acid (OA) at room temperature in the water-hexane solvent system. | |
In recent times, tenorite CuO has gained considerable attention from fundamental and practical perspectives.35–37 Many studies were devoted to CuO formation in 0D, 1D, and 3D, but rarely 2D architects were reported.35–43 However in the current study, the proposed gram scale synthesis route yields varied 2D CuO nanostructures in the form of feathers, solid/hollow hexagonal sheets, and nano hexagons. Such exotic nanostructures are achieved simply by controlling the oleic acid amount in water–hexane solution at room temperature without the need for high-temperature calcination. Furthermore, as-synthesized CuO solid/hollow hexagonal sheets showed high crystallinity, thermal stability, and are rich in oxygen vacancies. Herein, the oleic acid–hexane solution acts as a surfactant, usually linking to the surface of crystallites via covalent bonds, whereas sodium hydroxide acts as a mineralizer. The growth mechanism of CuO nanostructures can be understood based on the reactions given below:
| | | Cu(CH3COO)2·H2O + x·H2O + C18H34O2 + 2C6H14 → C36H66CuO4 + 2CH3COOH + y·H2O | (1) |
| | | C36H66CuO4 + 2CH3COOH + 4NaOH → Cu(OH)2 + 2C18H33NaO2 + 2CH3COONa + 2H2O | (2) |
The synthesis carried out in the absence of surfactant yielded irregular sheets of CuO in a higher percentage (Fig. 4a–c). This is attributed to a higher concentration of cations and hydroxyl ions in the solvent medium. However, amorphous CuO was formed in the absence of a water medium, indicating that a solvent medium consisting of only oleic acid–hexane is inappropriate. Sodium hydroxide is a strong electrolyte, and it is widely acknowledged for its ability to counterbalance the surface charges on the metal oxides, thus slowing down the aggregation. Moreover, a higher concentration of NaOH solution generates diffusion layers on certain surfaces, facilitating supplementary anisotropic growth, thus permitting the development of few energy-specific crystallographic planes.35 Oleic acid is an unsaturated fatty acid that readily dissolves in hexane and reacts with copper(II) acetate monohydrate to produce copper salt in the form of copper oleate (eqn (1)). Upon adding NaOH to the copper oleate mixture, it reacts to produce copper hydroxide, which eventually transforms to copper oxide species (eqn (2) and (3)). These copper oxide species form seeds that are guided by crystal symmetry to produce a planer nucleus, which in the presence of surfactant leads to the development of the 2D netted structure of CuO nano feathers (Fig. 4d–f). As per the CuO growth process,35 the sequence followed is [010]length > [100]breath > [001]thickness. With an increase in the oleic acid concentration, a decrease in growth rate along [010]length and [001]thickness is observed, leading to the formation of polydispersed 2D hexagonal sheets along with considerable agglomeration (Fig. 4g–i).42,43 Further increase in oleic acid results in an increased size of hexagonal sheets and a simultaneous bonding process. The bonding process continues with two or more individual sheets attaching in an angular manner by masking the areas with higher surface energies (see the ESI,† Fig. S8.c, and d).44 It is anticipated that the bonding process will continue more effectively with a further increase in oleic acid, ultimately leading to hierarchical florets formation. Although the data derived from such studies is alluring, however it is not being reported here and can always be part of our future investigations.
3.2.1 CO2 sensing characteristics.
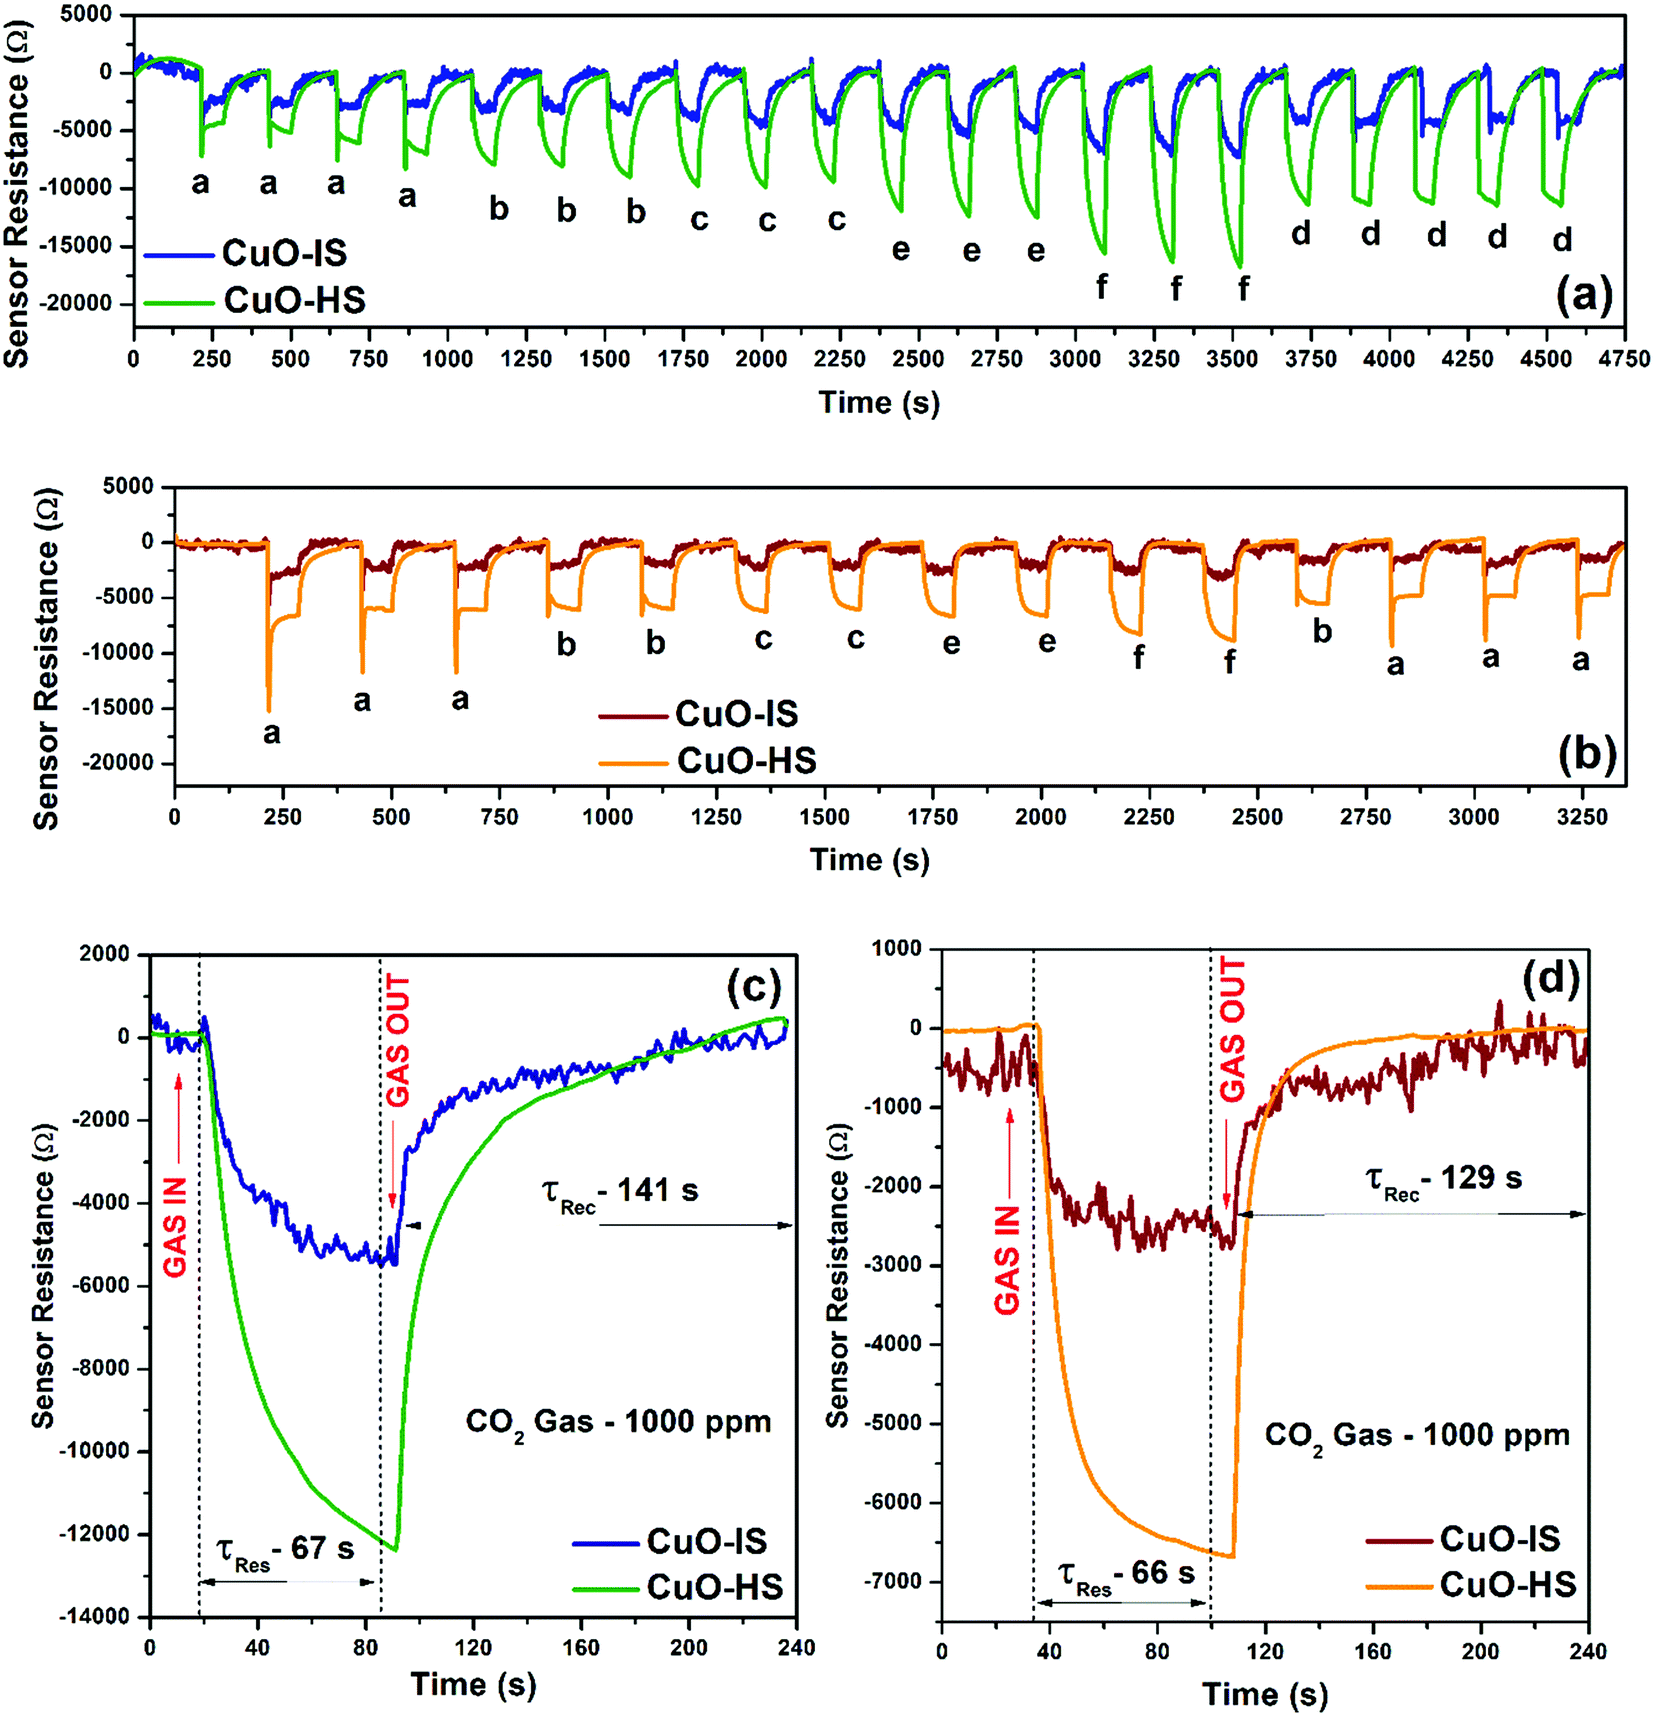
The calibration curves illustrating sensor resistances as a function of CO2 gas concentration at 32 °C for various CuO nanostructures confirmed a near-direct correlation in the 20 to 700 ppm range (see the ESI,† Fig. S9). Additionally, from 700 to 5000 ppm, saturation in sensor response was observed in each case. The observed increase in sensor magnitude followed the order: CuO-HS > CuO-NF > CuO-MS > CuO-IS, and hence most of the studies presented in the current study form a comparison between CuO-HS and CuO-IS. The electrical resistances of CuO-HS and CuO-IS upon exposure to CO2 gas concentrations at room temperature in dry and humid conditions confirm the p-type semiconducting nature of the sensitive layer (Fig. 5a and b). Resistance magnitude decreases rapidly with an increase in CO2 concentrations and recovers quickly upon purging the sensor chamber with air. The dynamic transients in dry and humid air corresponding to various CO2 dilutions ranging from 100 to 2000 ppm revealed a superior performance by CuO-HS over CuO-IS. In dry air, the sensor response (Ra/Rg) at 2000 ppm for CuO-HS and CuO-IS was found to be ∼85 and ∼24, respectively (Fig. 5a). Whereas in humid air, it was around ∼39 and ∼8 respectively (Fig. 5b). The sensor resistances in humid conditions are nearly half of the values compared to the values observed in dry air under the same settings. Dynamic transients were corrected for baseline using OriginPro 8.5 software, and the raw data recorded by the sensor system are detailed elsewhere (see the ESI,† Fig. S10). Raw data revealed significant drifting of the baseline in dry air (see the ESI,† Fig. S10.a), however, a highly stable response was observed in wet conditions (see the ESI,† Fig. S10.b). The response (τRes) and recovery time (τRec) for the CuO-HS sample were 67 and 141 s in dry air (Fig. 5c), and 66 and 129 s in humid condition (Fig. 5d). The response/recovery times in dry and humid conditions in each case are almost the same for CuO-HS and CuO-IS. The only difference is the increased sensor response shown by the CuO-HS sample. The response kinetics reported in the current study is promising from the viewpoints of real-time CO2 detection at room temperature.
 |
| | Fig. 5 Dynamic transients as a function of gas concentrations measured in (a) dry air and (b) humid conditions. Response kinetics measured in (c) dry air and (b) humid air. All the CO2 sensor characteristics were studied at room temperature (that is, 32 °C). Wet conditions refer to 59% relative humidity measured at 32 °C. | |
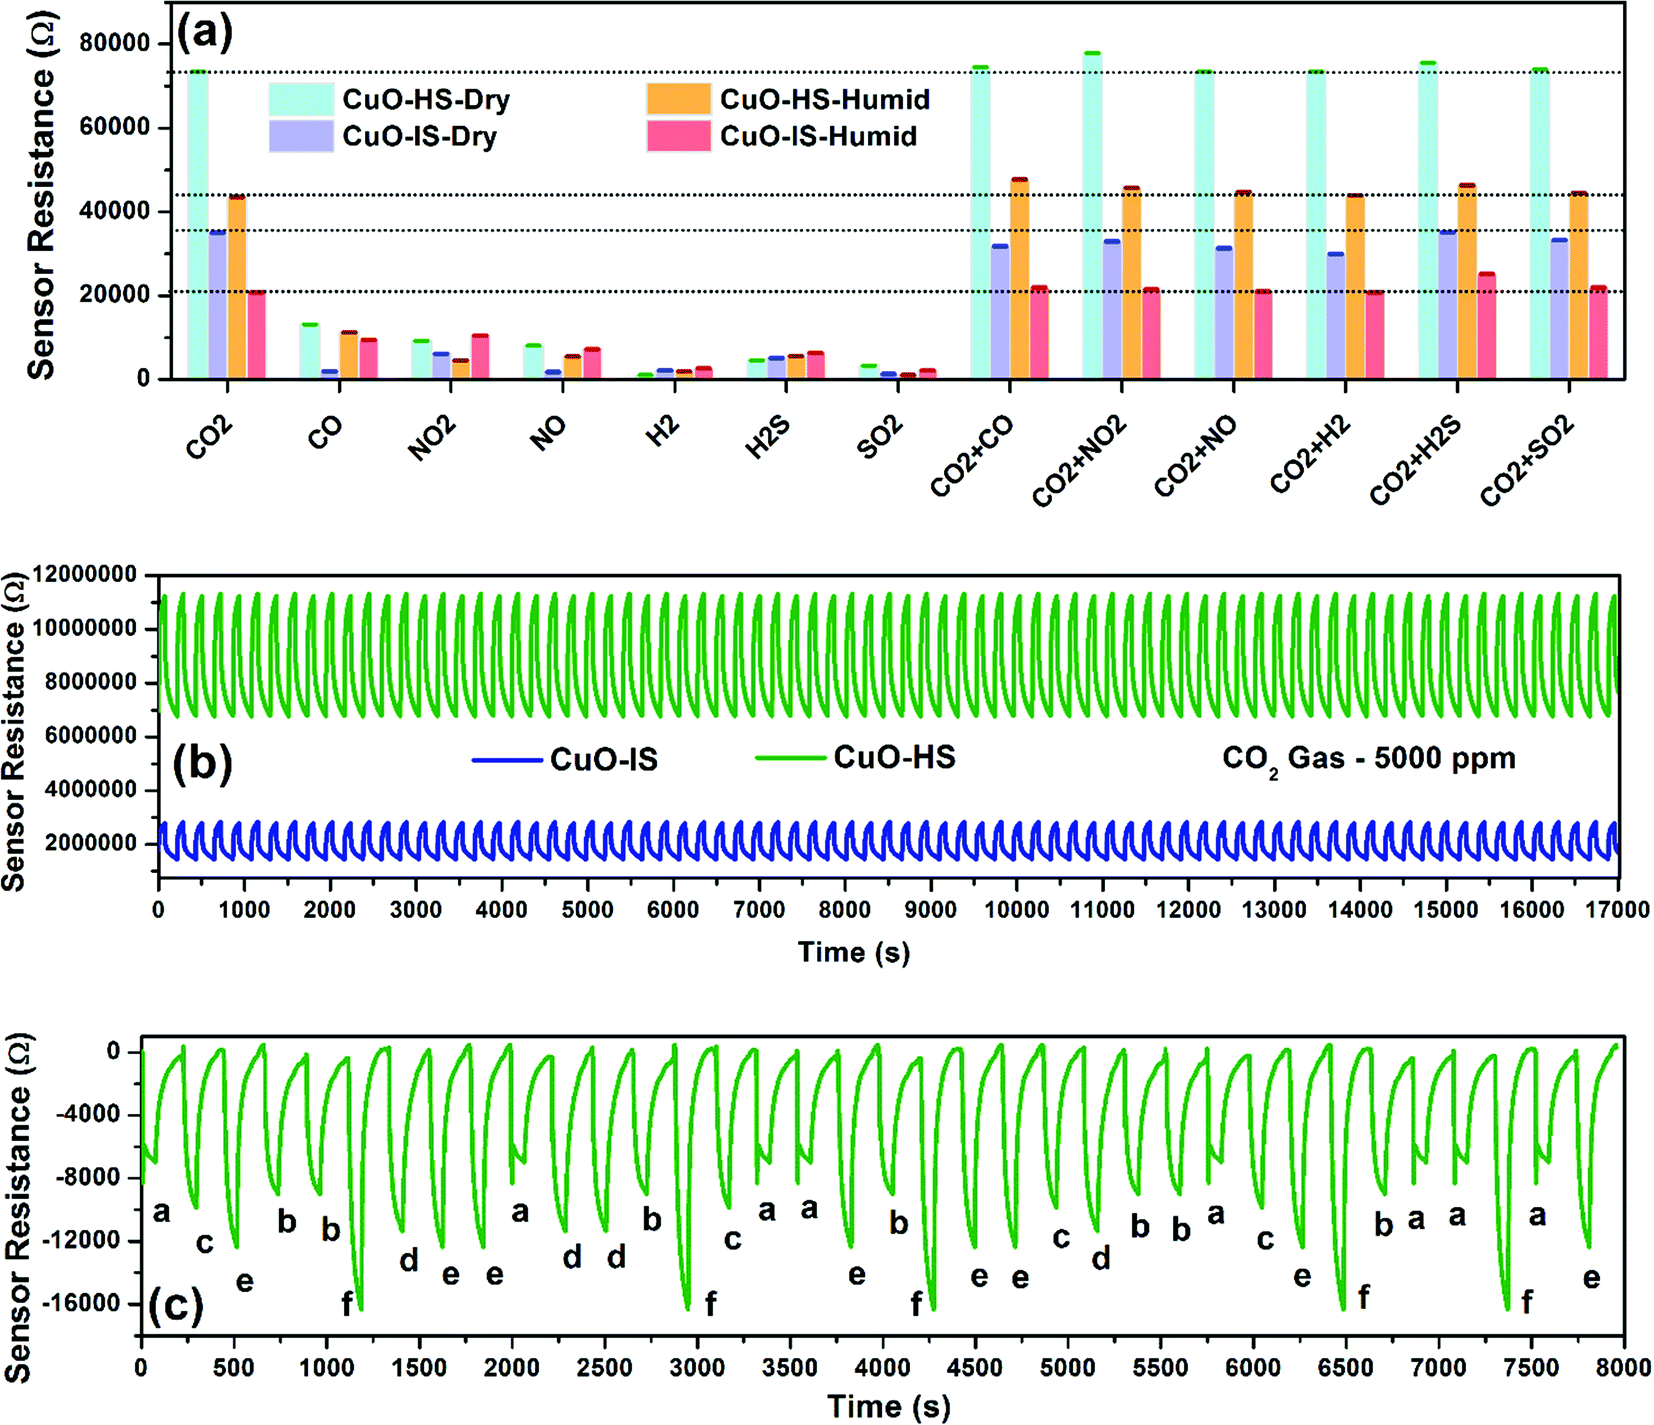
The ability to specifically differentiate CO2 gas in the presence of several interfering gases observed in simulated conditions such as homes, hospitals, and industries for any microsensor is important from intelligent monitoring viewpoints. Such capability of early detection is imperative for any sensor while functioning in a toxic environment.29 Here, we studied CO2 selectivity in the presence of gases such as CO (50 ppm), NO2 (500 ppm), NO (500 ppm), H2 (250 ppm), H2S (100 ppm), and SO2 (50 ppm) balanced with air to form industrially relevant concentrations (Fig. 6a). As per the literature, these gases beyond a certain permissible limit are hazardous and directly participate in the earth's atmospheric chemistry. Such chemical reactions result in petrochemical smog and carbon particulates that contribute to air pollution and ultimately impact the ecosystem.45,46 The gas concentrations tested are above the immediately dangerous levels to life or health as defined by the National Institute for Occupational Safety and Health (NIOSH).47 The selectivity data confirmed exceptional dominance shown by CuO-HS towards CO2 gas in dry and humid settings when compared to CuO-IS. This was again validated by comparing the electrical resistances of both samples towards CO2 gas under similar settings comprising mixed gases, that is, 500 ppm CO2 with interference gas 1 concentration. For example, 500 ppm CO2 + 50 ppm CO, 500 ppm CO2 + 500 ppm NO2, 500 ppm CO2 + 500 ppm NO, and so on. The sensor resistance of CuO-HS was almost twice the response shown by CuO-IS in dry and wet conditions towards the interfering gases (Fig. 6a). Selective dominance towards CO2 gas compared to other gases such as SO2, NO2, or CO is due to its higher affinity for reversible carbonation, that is, the ability to form CuCO3, ultimately read out as the sensor signal. Selectivity performance shown by various CuO nanoarchitectures in the presence of cross-interfering gases is detailed elsewhere (see the ESI,† Fig. S11.a). The exposure limit of CO2 gas that is immediately dangerous to life or health as defined by NIOSH is 5000 ppm. Hence this concentration was used for the stability test.47 The sensor data collection of more than 17000 data points for CuO-HS, and CuO-IS microsensors demonstrated excellent repeatability, stability, accuracy, and superior recovery towards CO2 gas (Fig. 6b). Additionally, the long-term stability was evaluated by exposing the samples to CO2 gas over 30 days continuously at 32 °C (see th eESI,† Fig. S11.b). Here, the CO2 resistance by the CuO-HS and CuO-IS samples was found to be ∼75735 Ω and ∼35897 Ω, respectively. Both the microsensors displayed superior reproducibility with a minimal fluctuation in sensor resistance towards 500 ppm CO2 gas at 32 °C. The ability of a microsensor to remember a particular gas concentration irrespective of a sensing pattern was analyzed using a well-planned memory test (Fig. 6c). The CuO-HS sensor clearly remembered the gas concentrations and accurately depicted similar electrical resistances regardless of their exposure sequence in dry conditions. The limit of detection (LoD) during CO2 sensing experiments was set at 20 ppm. Whereas the theoretical LoD for CuO-HS and CuO-IS was found to be 4.3 and 11.8 ppm, respectively (see the ESI,† Section A2 and Table S3). Herein, the hexagonal CuO sheets (CuO-HS) displayed exceptional sensing performance in comparison to recent reports in the literature and are briefly summarized in Table 1. The sensor characteristics were evaluated from the data depicted in Fig. 5 and 6 and reviewed in Table 2. Compared to many earlier reports,8,12–14,48,50,51,53 the CO2 sensing characteristics reported in the present study are impressive and viable from commercialization viewpoints.
 |
| | Fig. 6 Sensor characteristics were measured at room temperature. (a) Selectivity, where the gas concentrations are CO2 (500 ppm), CO (50 ppm), NO2 (500 ppm), NO (500 ppm), H2 (250 ppm), H2S (100 ppm), and SO2 (50 ppm). The error bars are fitted with standard deviation (±σ) measured for 5 consecutive test cycles. Wet conditions refers to 59% relative humidity measured at 32 °C. (b) Repeatability test conducted on the 18th day from the 30 days long term period and (c) memory effect shown by the CuO-HS sample. | |
Table 1 Comparison of a chemoresistive CO2 sensor employing metal oxide semiconductor sensing layers as reported in the literature
| Material |
T (°C) |
τ
Res (s), τRec (s) |
Sensitivity or sensor response |
Gas range (ppm) |
Selectivity (no. of gases) |
Stability (days) |
Humidity |
Ref. |
|
Some of the data are directly calculated from the published article and could be partially accurate.
|
| CuO |
R.T. |
67, 141 |
∼85 |
20–5000 |
6 |
30 |
59% R.H. |
This work |
| CuO |
R.T. |
67, 141 |
∼24 |
20–5000 |
6 |
30 |
59% R.H. |
This work |
| Na:ZnO |
R.T. |
240, 472 |
1.83a |
20–70 sccm |
N.R. |
N.R. |
N.R. |
12
|
| PEG@Bi2O3 |
R.T. |
82, 132 |
3a |
10–100 |
4 |
N.R. |
20–80% R.H. |
13
|
| SnO2 – rGO |
R.T. |
19, 56 |
1.21% |
5–500 |
N.R. |
28 |
58% R.H. |
14
|
| CuO-BaTiO3 |
25 ± 1 |
300, N.R. |
3.3 |
500–5000 |
N.R. |
N.R. |
40% R.H. |
45
|
| CuO-BaTiO3 |
120 |
5, 18 |
1.24 |
100–10000 |
4 |
180 |
N.R. |
10
|
| 1%Ag CuO-BaTiO3 |
120 |
3, 5 |
1.40 |
100–10000 |
4 |
180 |
N.R. |
10
|
| 25 wt.% CaO/ZnO |
150 |
230, 280 |
77% |
100–10000 |
10 |
40 |
40–85% R.H. |
11
|
| 1%Ag CuO-BaTiO3 |
160 |
300, 320 |
1.062 |
1000–5000 |
10 |
1400 min |
N.R. |
29
|
| 25 wt.% CaO/BaTiO3 |
160 |
7, 6 |
65% |
50–1000 |
10 |
40 |
N.R. |
49
|
| SnO2 |
240 |
4, 350 |
1.24 |
2000–30000 |
N.R. |
N.R. |
14-66% R.H. |
50
|
| 1%Ag CuO-BaTiO3 |
250 |
90, 120 |
3a |
300–1000 |
3 |
200 min |
N.R. |
51
|
| Au/ZnO |
250 |
70, 65 |
3.75a |
1–200 |
2 |
N.R. |
N.R. |
8
|
| CuO/ZnO |
320 |
82, 286 |
28% |
100–10000 |
4 |
40 |
N.R. |
52
|
| 1%Ag CuO/ZnO |
320 |
76, 265 |
35% |
100–10000 |
4 |
40 |
N.R. |
52
|
| ZnO/LaOCl |
400 |
100, 275 |
2 |
250–4000 |
6 |
N.R. |
N.R. |
53
|
Table 2 Summary of the estimated CO2 sensor parameters
| Parameters |
CuO-IS |
CuO-HS |
| Repeatability |
97% |
98.7% |
| Sensor response (Ra/Rg) |
24 (2000 ppm) |
85 (2000 ppm) |
| Coefficient of variance (CoV) |
3% |
1.3% |
| Recovery (%) from raw data |
92 (dry), 46 (wet) |
83 (dry), 96 (wet) |
| Accuracy (contingency- ±20%) |
71 |
89 |
| Average error (measured from ±σ) |
±5.98 |
±3.08 |
|
R
2
|
0.73201 |
0.98464 |
| LoD (experimental) |
20 ppm |
20 ppm |
| LoD (theoretical) |
11.8 ppm |
4.3 ppm |
| Operating temperature |
32 °C |
32 °C |
| Gas concentration range |
20–5000 ppm |
20–5000 ppm |
| Stability |
17000 s |
17000 s |
| Long term repeatability |
30 days |
30 days |
3.2.2 Plausible CO2 sensing mechanism.
Many previous reports confirmed that reversible chemisorption results in surface carbonation in the presence of CO2 gas, which in turn increases the acceptor density in CuO by employing operando DRIFTS.4,10,49,52 This, in turn, leads to variation in the resistance of the sensitive layer, eventually taken as a sensor signal. Moreover, few studies attributed enhancement in the sensing response to adsorbed oxygen species and oxygen vacancies at the interstitial sites.30,32 Hence, to validate the underlying reason for the enhanced sensing phenomenon, the operando UV-Vis-DRS technique was employed.54 In brief, a calculated amount of CuO-HS sample powder was mixed with IR grade KBr and pressed into a thick pellet. The pellet was placed in a sample holder and carefully pumped with pure CO2 gas at room temperature, followed by recording the data. Compared to the spectrum recorded in the absence of target gas, a broad hump in the visible region was observed for the spectrum in the presence of CO2 (Fig. 7a). The occurrence of a broad hump is correlated with the formation of oxygen defects resulting in improved sensor performance.31,32 The presence of oxygen vacancies in the nanomaterials is crucial, as the sensor characteristics rely heavily on the formation of such defects.9–14,31,32,49,52 Additionally, in situ photoluminescence (PL) spectra were recorded with and without exposure to CO2 gas at room temperature to substantiate the presence of oxygen vacancies (Fig. 7b). In the absence of CO2 gas, the PL spectrum of the CuO-HS sample showed a broad hump in the 300–500 nm region along with a sharp visible band emission at 498 nm attributed to the presence of crystal defect impurities, and intermediate phases.55 Upon exposure to pure CO2 gas, the Iuv at 388 nm remained relatively unchanged, whereas IVis at 498 nm increased. A broad hump in the 550–750 nm region was observed, attributed to synchronized contributions from mid bandgap defects and recombination of intra valence band electrons.56 Both changes in the PL spectra upon exposing the CuO-HS sample to CO2 gas directly substantiate the existence of defects and the significant role they play in increasing the sensor response. In metal oxide-based chemoresistive sensors, the sensing mechanism is comprehensively documented as a surface phenomenon based on the widely accepted resistance modulation model.3–5,7–14,29,31,32,49 A change in resistance is detected during the sensing event due to reversible chemisorption and/or physisorption of target gas molecules and their interaction with the surface species present on the sensitive layer (Fig. 7c).29,31,32,49 The chemical pathways leading to the generation of the sensor signal can be assumed to be taking place as below:| | | O2(gas) → O2(ads) → O2(ads)− → 2O(ads)− → O(ads)2− | (4) |
| | | Vo + O2(ads)− → Vo+ + 2O− → Vo+ + O2(ads)− → VO+++ 2O− | (5) |
| | | CO2(gas) → CO2(ads) → CO2(ads) + O(ads)2− → CO32− | (6) |
 |
| | Fig. 7
In situ measurements for the identification of oxygen vacancies (a) UV diffuse reflectance spectra, (b) photoluminescence spectra achieved in the presence of air and CO2 gas, and (c) schematic illustration depicting the CO2 sensing phenomenon at room temperature over hexagonal CuO sheets. | |
Briefly, in ambient air, dissociative chemisorption of molecular oxygen (O2) on the surface of CuO occurs, leading to the formation of an electron depletion layer (EDL).11 When CO2 gas diluted with air is pumped into the sensor chamber, two events materialize simultaneously: rapid surface carbonation of CuO to CuCO3 in dry air and a decrease in the amount of adsorbed oxygen species.10,29,49 These two events further amplify CuO acceptor density leading to a significant change in the resistance magnitude of the sensitive material. The reversible interactions with oxygen species in the presence and absence of CO2 gas result in a resistance change for the CuO, which forms the underlying basis for a highly repeatable, stable, and selective sensing mechanism. Here, the CuO-HS sample is composed of solid/hollow hexagonal thin sheets, whereas CuO-IS is formed of irregular structures. The existence of exotic CuO nanostructures in the form of solid and hollow hexagonal sheets results in rapid gas diffusion and effective gas absorption between the inner and surface regions, thus enhancing the response magnitude. In addition, the chemisorbed oxygen percentage for CuO-HS is as high as 30.64%, while it is negligible for CuO-IS. The presence of chemisorbed oxygen acts as electron traps and enhances the interaction of electrons with oxygen molecules, subsequently leading to a tremendous change in the sensor resistance. Lastly, oxygen vacancies also act as electron donors, promoting the increase of chemisorbed oxygen species during the sensing phenomenon. As a result, a higher amount of molecular oxygen gets dissociatively chemisorbed in an atomic form on the nanomaterial surface, resulting in a superior sensing performance.
3.3 Natural sunlight induced dye degradation
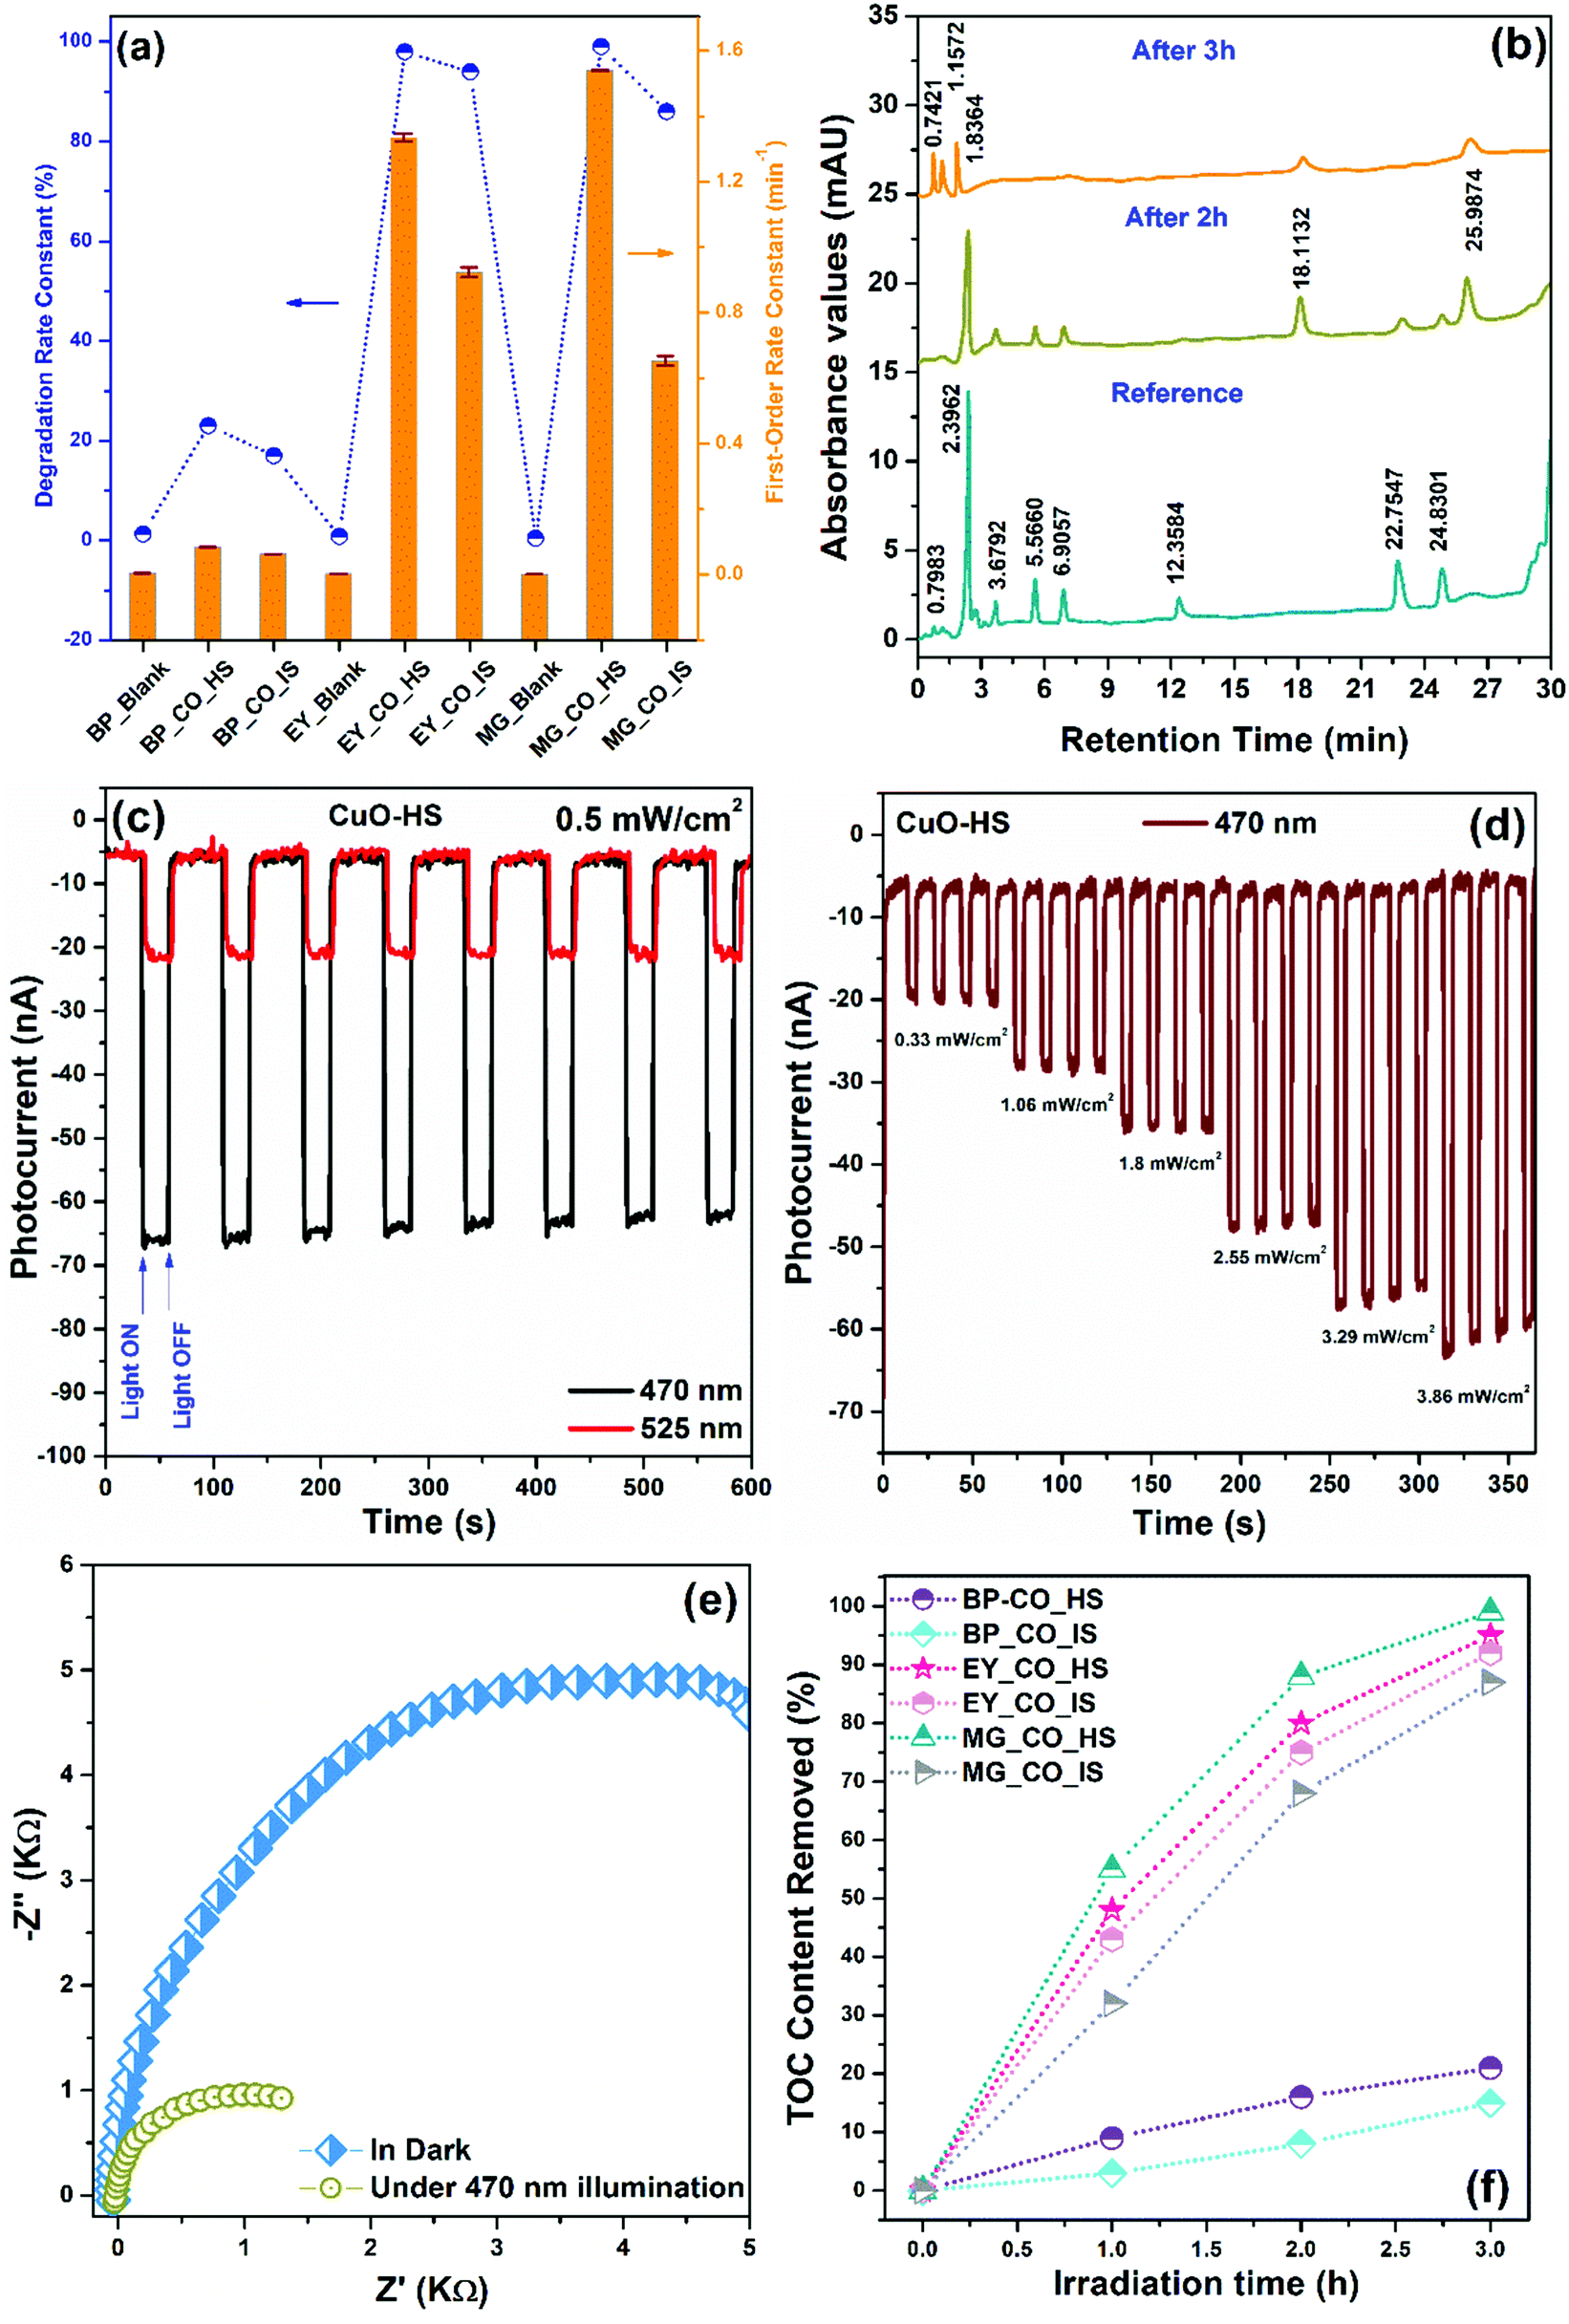
The photocatalytic capability of CuO nanoarchitectures was confirmed by analyzing a model process that involved photooxidation of organic dyes, namely bromocresol purple (BP), eosin yellow (EY), and malachite green (MG) in the presence of natural sunlight. In neutral conditions, pure BP, EY, and MG dyes showed maximum absorption values at 589, 517, and 617 nm, respectively. A comparative dye degradation performance shown by CuO-HS and CuO-IS is detailed in the ESI (Section A3 and Fig. S12–S16). In addition, dye degradation as a function of CuO morphology under the same settings confirmed the order of performance as, CuO-HS > CuO-NF > CuO-MS > CuO-IS (see the ESI,† Fig. S17). The empirical technique to calculate the degradation constant (DC) and first-order reaction rate (κ) from the slope of ln (C0/C) versus irradiation time plot is as per the earlier reports.29,52 The estimated degradation constant and first-order reaction rate for CuO-HS and CuO-IS photocatalysts confirmed the remarkable performance by hexagonal sheets compared to the irregular structures (Fig. 8a). Interestingly, CuO-HS could degrade more than 98% of EY and MG dyes within 3 h and thus depicted the highest values. In the case of EY, the degradation constant and reaction rate values were found to be 98% and 1.33495 min−1 with an accuracy of 0.01199. Under the same settings, the values for MG were calculated to be 99% and 1.53968 min−1 at a precision of 0.00301. Among the three organic dyes considered here, malachite green is hazardous, teratogenic, genotoxic, and mutagenic, owing to which it is banned in many countries.57 A better understanding of malachite green degradation in the presence of natural irradiation was deemed necessary. Hence, a plausible pathway during the malachite green degradation mediated by CuO-HS was confirmed using an HPLC technique equipped with a photodiode array detector with a wavelength tuned to 259 nm (Fig. 8b). The HPLC chromatograms achieved after 2 and 3 h of dye degradation were compared with standard aqueous MG solution used as the reference. After 2 h of exposure to natural irradiation, two new peaks at the retention time of 18.1132 min and 25.9874 min were observed in addition to many other peaks with reduced intensities, matching exactly with the reference profile. The peaks correspond to MG–CH2–2H+O and the leucomalachite green (LMG) structure.57 The spectra after 3 h of irradiation time showed a peak due to 4-(dimethylamino)-benzophenone (DLBP)+OH–CH2 intermediate at 1.83 min.58 Furthermore, our limitations with the HPLC technique made it difficult to analyze the intermediates with peaks at 0.7421 and 1.1572 min, which are not reported even in the literature. Overall, upon increasing the illumination period, a decrease in peak intensities was observed with the simultaneous increase in the concentration of other peaks associated with intermediate products related to dye degradation. Thus, it can be assumed that during the MG photooxidation, the pathway involves hydroxyl radicals addition reaction, N-demethylation, and decomposition of conjugated structures, in agreement with the earlier reports (see the ESI,† Fig. S18).57,58 Furthermore, the ability of charge species to recombine was evaluated from transient photoelectrochemical (PEC) measurements (Fig. 8c and d). Open circuit current densities obtained upon exposure to varying wavelength LEDs showed a highly repeatable and stable performance by CuO-HS (Fig. 8c). Typical LEDs selected were 470 and 525 nm, appropriately representing the visible spectrum region. In the presence of equal light intensities at 0.5 mW cm−2, the maximum photocurrent density was achieved upon irradiating the surface with 470 nm compared to 525 nm. Additionally, the photocurrent magnitude profiles in the presence of illumination by an LED of 470 nm for over four consecutive cycles of varied light intensities further demonstrated the excellent photostability of CuO-HS (Fig. 8d). The experiment also displayed a consistent enhancement in the photocurrent with the increase in light intensities, which is imperative for charge mitigation during dye degradation. Electrochemical impedance spectroscopy (EIS) was conducted to estimate the effect of light irradiation on the charge movement and the efficiency with which species recombine during the photocatalysis (Fig. 8e). The electrochemical impedances are illustrated as complex plane Nyquist plots consisting of an imaginary component (−Z′′) as a function of the real element (Z′), together forming part of the impedance (Z). As per earlier reports,59 the circumference of the semicircle is in direct proportion to the opposition shown by the semiconductor for charge transfer. Analogous EIS curves recorded in the dark and upon illumination for CuO-HS revealed a significant decrease in the response magnitude, thus confirming light-induced excitation of electron–hole pairs and its role in facilitating dye degradation.29,60 A higher percentage of dye degradation in the presence of natural sunlight for MG and EY was shown by CuO-HS which was closely followed by the CuO-IS sample (Fig. 8f). The probable dye degradation mechanism is detailed elsewhere (see the ESI,† Fig. S18). The methodology presented here is convenient, scalable, and can be readily implemented for real-time activities. The process does not use any complex sacrificial agents, high-end photocatalytic reactors, UV/Visible lamps, or expensive/hazardous chemicals to degrade the dye. Such a technique can be efficiently deployed at an economical rate even by conventional households engaged in tie-dye textile coloring (also known as Bandhani prints), an ancient art form and lucrative cloth coloring method that is highly prevalent even today in the western and northern regions of India.
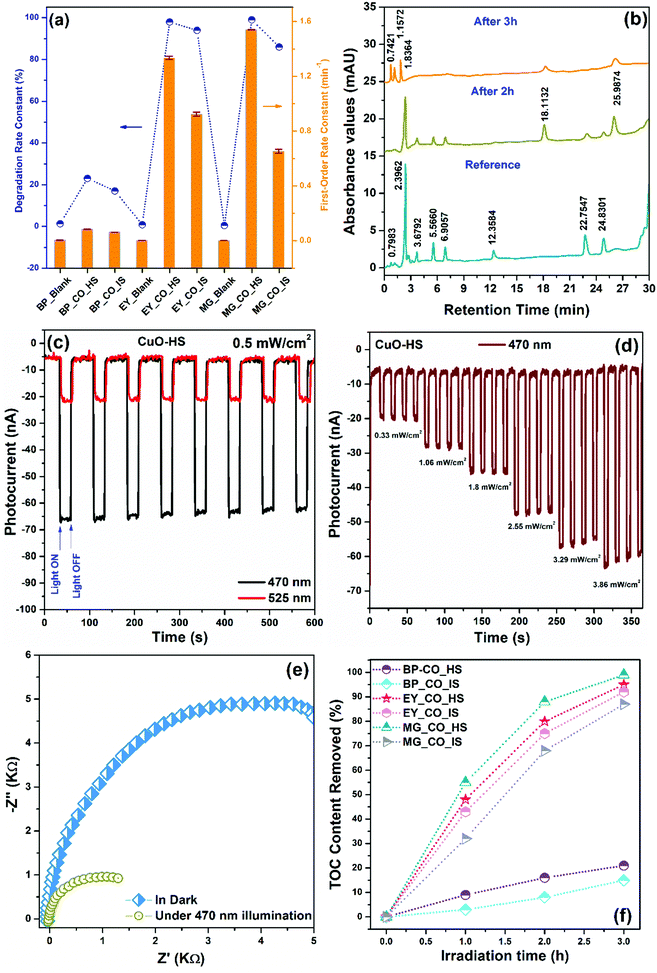 |
| | Fig. 8 (a) Estimated degradation constant (DC) and first-order reaction rate (κ) in the presence and absence of photocatalysts, (b) HPLC profiles depicting malachite green degradation by CuO-HS, (c) comparative photocurrent response at 470 and 525 nm at 0.5 mW cm−2 light intensity, (d) transient photocurrent density versus intensity and time, (e) EIS curves shown by CuO-HS illustrating the charge chemistry in the dark and upon exposure to light irradiation and (f) total organic carbon content removed after natural light-induced degradation of dyes by CuO-HS and CuO-IS. | |
3.4 Catalytic CO2 reduction to methanol
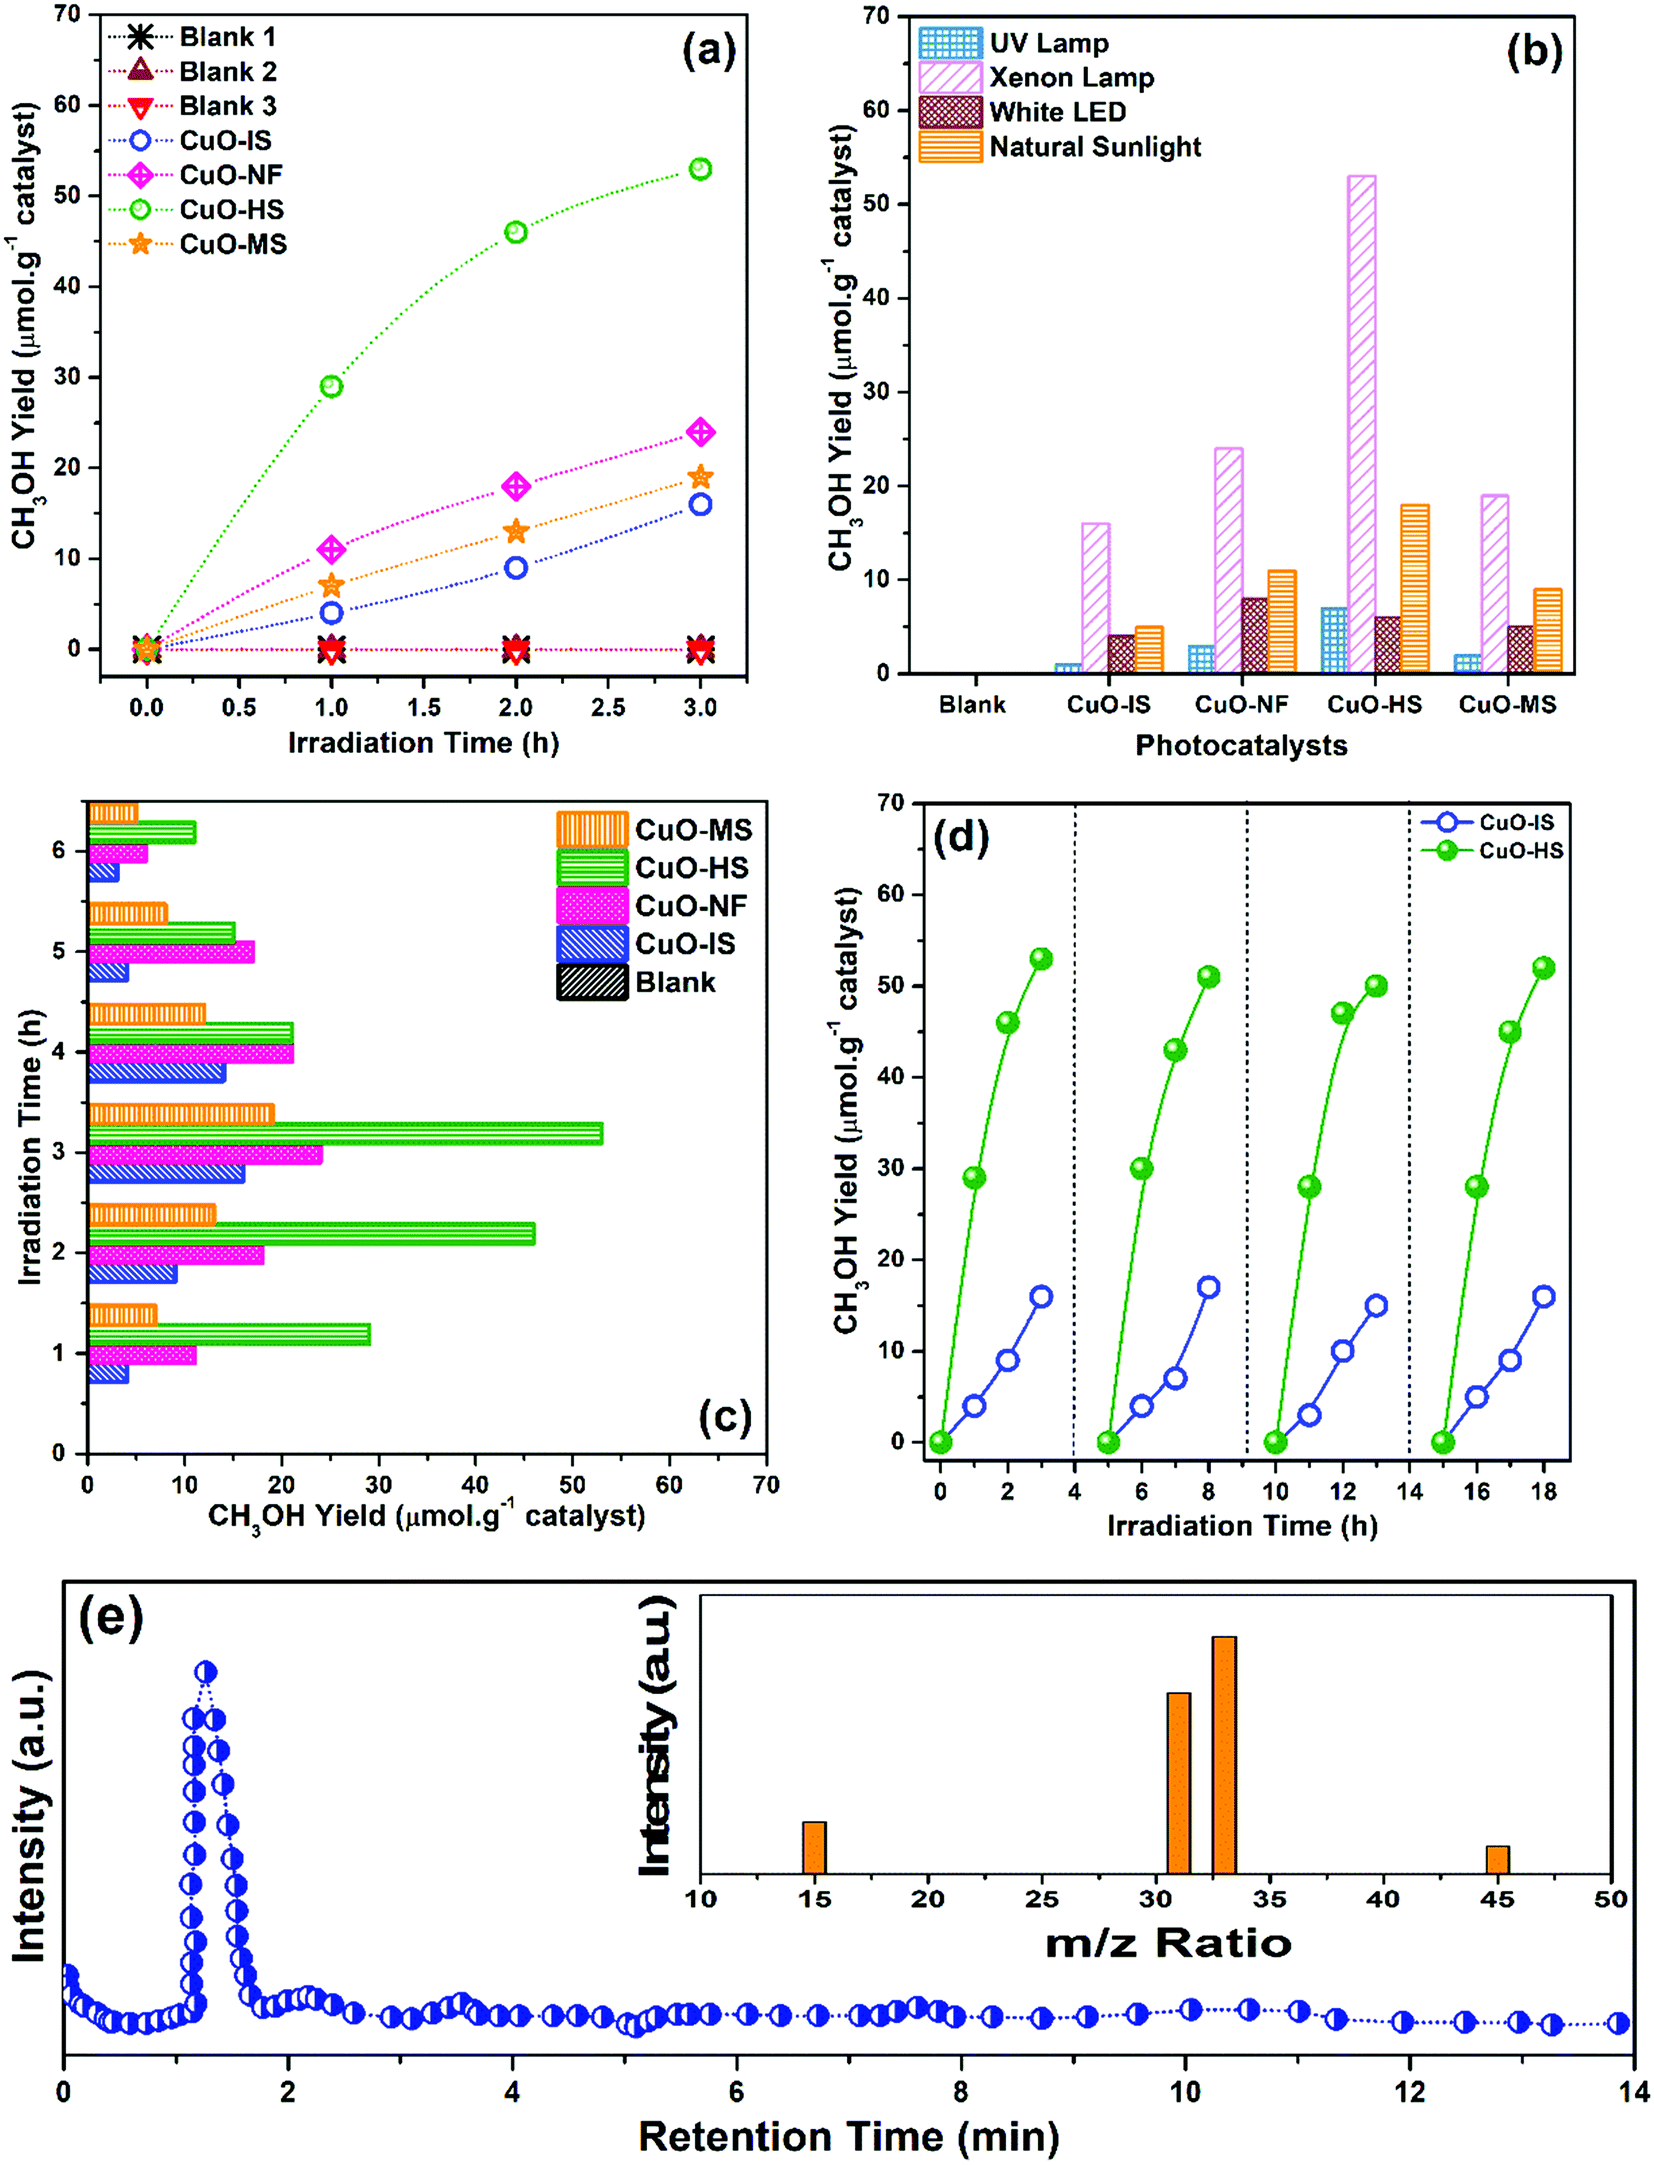
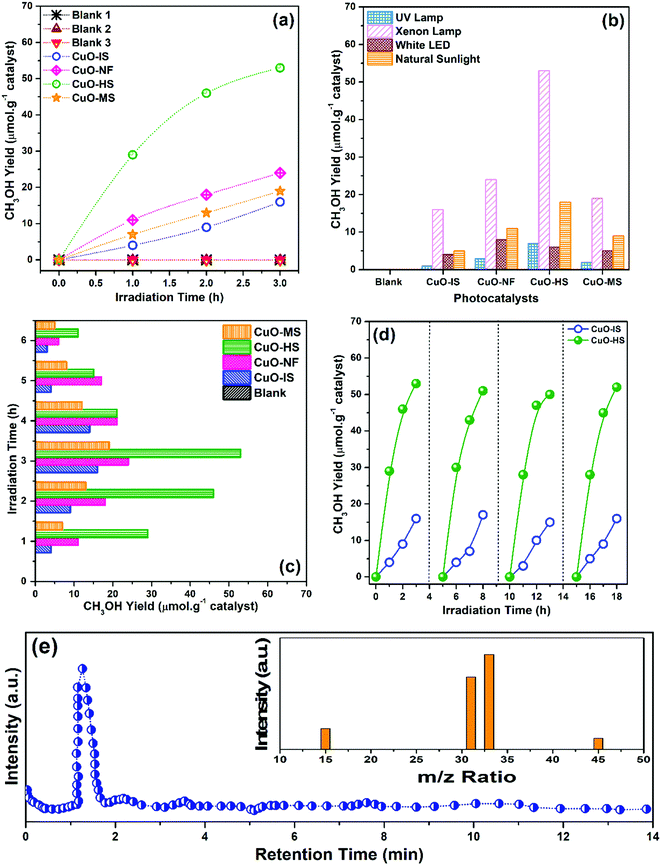
At the start of CO2 photoreduction experiments, three blank tests were performed using water as a reaction source at standard temperature and pressure. No products evolved at the end of blank reactions, thus confirming that CO2 gas, nanocatalysts, and light source are essential. The outcomes of the CO2 photoreduction experiments are summarized in the supporting information (see the ESI,† Table S4). The methanol yield achieved is highly specific to ambient conditions and methodologies used in the current study. The CO2 conversion studies monitored every 1 h for various CuO nanoarchitectures in the presence of artificial solar light and the corresponding CH3OH produced confirm the excellent catalytic capabilities of oleic acid-mediated hexagonal sheets (Fig. 9a). The quantitative methanol yield (μmol g−1 of catalyst) was evaluated from the calibrated data obtained using standard commercial methanol procured from Sigma Aldrich. The highest output was generated by CuO-HS and the lowest by CuO-IS. It is to be noted that the activation source plays a vital role in enhancing the efficiency of the catalytic process and to validate it, four different kinds of light mediums, namely UV, artificial solar, white cold floodlight LED, and natural sunlight were selected and tested (Fig. 9b). The maximum methanol evolution was observed in the presence of an artificial solar source facilitated by a Xenon arc lamp, and CuO-HS showed the ultimate value in each case. The product yield in the presence of artificial solar as demonstrated by the photocatalysts namely CuO-HS, CuO-NF, CuO-MS, and CuO-IS was found to be 53, 24, 19, and 16 μmol g−1, respectively. Interestingly, the amount of methanol generated by CuO-HS was more significant than CuO-IS and could be due to the higher oxygen vacancies percentage and bandgap. The photoconversion experiments carried out in the presence of natural sunlight were reasonably good with the methanol amount estimated as 5, 9, 11, and 18 μmol g−1 for CuO-IS, CuO-MS, CuO-NF, and CuO-HS, respectively. Low activity was detected in the presence of UV illumination. The yield increased with an increase in artificial solar irradiation time of up to 3 h and beyond, and a steady decrease in the photoconversion efficiency was observed (Fig. 9c). The experiment confirmed the optimum irradiation as 3 h. The reduction in the conversion rate could be due to deterioration in adsorption ability and saturation of active sites on the surface of the nanocatalysts. Repeatability was verified by performing four consecutive runs over CuO-IS and CuO-HS in the presence of artificial solar illumination (Fig. 9d). After four cycles, a slight deterioration (∼4%) in photoconversion was shown by CuO-HS and CuO-IS. Methanol as the sole product evolved during the CO2 photoconversion in the presence of the CuO-HS was confirmed by a single sharp peak at a retention time of 1.29 min recorded using a GC-MS analyzer (Fig. 9e). The mass to charge (m/z) ratio at 15, 31, 33, and 45 further corresponded to (CH3)+, (CH3O)+, (CH3OH˙)+and (13CO2) species, which is in line with previously reported values.23,61 The analysis further assured that in the presence of a suitable nanocatalyst and light sources, methanol was observed as the primary product. The results are encouraging from an application viewpoint as a straightforward reduction to hydrocarbon fuel takes place. Additionally, the evolution of other organic compounds was not observed and could be due to insignificant ingestion of proton and electron species during the photoreduction process.
 |
| | Fig. 9 Catalytic CO2 reduction experiment depicting the methanol (MeOH) evolution rate, with (a) CuO nanoarchitectures as a function of artificial solar irradiation time, (b) various light sources versus photocatalysts, (c) optimum irradiation plot, (d) repeatability, and (e) MeOH yield produced by CuO-HS during the photocatalysis process and measured using GC-MS as a function of retention time. Inset: Mass spectra recorded using a GC-MS analyzer. In cases where the reaction conditions are not mentioned, it is to be assumed that all the photoconversion experiments were carried out in the presence of artificial solar irradiation with water as a solvent medium. | |
In neutral conditions and upon exposure to a suitable light-medium, CO2 photoreduction will take place in the presence of water. Considering the ideal situation, wherein the reduction potential of CO2 gas (E°(CO2/CH3OH) = −0.399 V vs. NHE) and the oxidation potential of H2O (E°(H2O/O2) = 0.816 V vs. NHE) satisfactorily fulfill the half-reactions leading to the occurrence of CO2 reduction and H2O oxidation at the same time.62 The conduction and valence band of single structured CuO are positioned at −0.95 and 0.8 eV vs. NHE.63 Based on the band potential values, hexagonal CuO sheets with a bandgap of 1.75 eV on their own can completely carry out CO2 photoconversion to CH3OH as presented in the current report. As its ECB potential (−0.95 eV) is more negative than the standard redox potential (E°(CO2/CH3OH) = −0.399 V vs. NHE), while its EVB potential (0.8 eV) is placed well below the oxidation potential of H2O (E°(H2O/˙OH) = 2.32 V vs. NHE). Herein, in concurrence, the holes (h+) on the surface will react with the adsorbed H2O molecule to produce hydroxyl radicals (˙OH) and protons (H+), whereas the electrons will reduce CO2 gas to generate CH3OH. The methanol generation requires 6e− and 6H+ which are based on the reactions as below:
| | | CO2+ 5H2O + 6e− → CH3OH + 6OH− | (10) |
| | | 2H2O → O2 + 4H+ + 4e− | (11) |
Upon irradiation, electrons and holes are generated at the conduction and valence band in the CuO nanocatalysts, wherein the oxygen vacancies present on the surface act as traps for electrons and holes resulting in the effective separation of charges. The presence of oxygen vacancies restrains the recombination of photogenerated pairs and enhances half-reactions, subsequently leading to improved CO2 photoconversion. In the end, the crystallinity and morphology for the CuO-HS and CuO-IS after the photoreduction experiments were comparatively investigated to validate the stable structure of the catalysts (see the ESI,† Fig. S19 and S20). XPS studies carried for the CuO-HS sample after the CO2 photoreduction experiment indicated no change in valence state (see the ESI,† Fig. S21). The data showed an insignificant shift, thereby confirming the stability of the photocatalyst. Considering the above results, improved performance was shown by CuO-HS compared to CuO-IS mainly stems from three reasons. The first is due to facile CuO synthesis at room temperature that resulted in a nanostructure with high crystallinity, thermal stability, and visible absorption. Second, the unintentional generation of morphology mixture consisting of solid/hollow hexagonal thin sheets proved beneficial leading to a higher percentage of exposed area for reversible surface reactions. Lastly, the structural defects in the form of oxygen vacancies acting as charge traps result in dominant sensing characteristics, dye degradation, and catalytic CO2 conversion. The presence of oxygen defects was confirmed from UV-Vis-DRS, VBM-XPS, and μ-Raman data, and such structural abnormalities indeed facilitate surface-active adsorption and desorption reactions during sensing and heterogeneous catalysis. In addition to the current study, the importance of oxygen vacancies for sensing and catalysis applications and its quantitative correlation with individual oxygen vacancy amount and oxygen vacancy position (surface as well as interior) is part of ongoing research activities.
4. Conclusions
In summary, various CuO nanostructures at room temperature were synthesized using oleic acid as a surfactant and water–hexane as the biphasic solvent medium. The hexagonal CuO sheets depicted excellent CO2 sensing characteristics, photocatalytic dye degradation, and CO2 photoreduction capabilities compared to the control sample. Such remarkable performance was attributed to phase purity, 2D solid/hollow hexagonal sheets, higher absorption in the visible region, and the existence of oxygen vacancies. The superior sensor performance such as ultra-sensitivity (∼3.6 fold), dominant selectivity, and long-term stability over 30 days at 32 °C in dry and humid air was shown by hexagonal sheets. Enhanced reversible chemisorption based on surface carbonation read out as CO2 sensitivity in the presence of oxygen-deficient CuO was proven by employing operando UV-DRS and PL techniques. Similarly, the hexagonal sheets were able to mineralize the organic dyes within 3 h of exposure to natural sunlight with a remarkable degradation constant (99%) and a first-order reaction rate (1.53968 min−1). Additionally, in the presence of artificial solar and natural irradiation, hexagonal sheets could produce methanol at higher rates compared to control samples. In each application, the order of performance effectiveness based on CuO morphologies was found to be, hexagonal sheets > nano feathers > mega hexagons > irregular structures (control sample), which is in direct proportion with the chemisorbed oxygen vacancies. The study presented here demonstrating a gram-scalable chemical technique for the rational design and development of defect-rich CuO in various morphologies with multifunctional capabilities is foreseen to contribute to the ongoing intensified research activities in carbon-neutral technologies, greenhouse emission monitoring, and wastewater treatment.
Author contributions
Amit Kulkarni: methodology, investigation, formal analysis, validation, writing – original draft. Mrudul Satbhai: methodology, investigation, formal analysis, validation, writing – original draft. Wei Li: funding acquisition, and writing – review & editing. Deepak Bornare: resources, investigation, and writing – review & editing. Kaleemuddin Syed: funding acquisition, and writing – review & editing. Shravanti Joshi: conceptualization, data curation, formal analysis, validation, visualization, funding acquisition, project administration, supervision and writing – review & editing.
Conflicts of interest
The authors declare no competing financial interest.
Acknowledgements
SJ acknowledges the generous funds sanctioned under Mission Innovation IC#3 Carbon Capture Challenge with grant number: DST/TM/EWO/MI/CCUS/27/2019 from the Department of Science and Technology (DST), Ministry of Science & Technology, Government of India.
References
- Carbon dioxide measures up as a real hazard, https://ohsonline.com/articles/2006/07/carbon-dioxide-measures-up-as-a-real-hazard.aspx, accessed 3rd April 2021.
- S. Mulmi and V. Thangadurai, Solid-State Electrochemical carbon dioxide sensors: fundamentals, materials, and applications, J. Electrochem. Soc., 2020, 167, 037567 CrossRef CAS.
- M. Y. Rezk, J. Sharma and M. R. Gartia, Nanomaterial based CO2 sensors, Nanomaterials, 2020, 10, 2251 CrossRef CAS.
-
S. Joshi, Tailored nanostructures for CO2 gas sensing applications, PhD thesis, School of Sciences, College of Science, Engineering & Health, RMIT University, Melbourne, Australia, 2017.
-
N. B. Tanvir, Investigation of metal oxide nanomaterials for CO2 gas sensing applications, PhD thesis, University of Freiburg, Freiburg, Germany, 2017.
-
N. Mykhaylova, Low-cost sensor array devices as a method for reliable assessment of exposure to traffic-related air pollution, PhD Thesis, University of Toronto, Canada, 2018.
- N. B. Tanvir, O. Yurchenko, C. Wilbertz and G. Urban, Investigation of CO2 reaction with copper oxide nanoparticles for room temperature gas sensing, J. Mater. Chem. A, 2016, 4, 5294–5302 RSC.
- M. Gonzalez-Garnica, A. Galdamez-Martíneź, F. Malagoń, C. D. Ramos, G. Santana, R. Abolhassani, P. K. Panda, A. Kaushik, Y. K. Mishra, T. V. K. Karthik and A. Dutt, One dimensional Au-ZnO hybrid nanostructures based CO2 detection: growth mechanism and role of the seed layer on sensing performance, Sens. Actuators, B, 2021, 337, 129765 CrossRef CAS.
- C. Willa, A. Schmid, D. Briand, J. Yuan and D. Koziej, Lightweight, Room temperature CO2 gas sensor based on rare earth metal free composites-An impedance study, ACS Appl. Mater. Interfaces, 2017, 9, 25553–25558 CrossRef CAS.
- S. Joshi, S. J. Ippolito, S. Periasamy, Y. M. Sabri and M. V. Sunkara, Efficient heterostructures of Ag@CuO/BaTiO3 for low-temperature CO2 gas detection: Assessing the role of nanointerfaces during sensing by operando DRIFTS technique, ACS Appl. Mater. Interfaces, 2017, 9, 27014–27026 CrossRef CAS.
- S. Joshi, L. A. Jones, Y. M. Sabri, S. K. Bhargava, M. V. Sunkara and S. J. Ippolito, Facile conversion of zinc hydroxide carbonate to CaO-ZnO for selective CO2 gas detection, J. Colloid Interface Sci., 2020, 558, 310–322 CrossRef PubMed.
- M. A. Basyooni, M. Shaban and A. M. Sayed, El. Enhanced gas sensing properties of spin-coated Na-doped ZnO nanostructured films, Sci. Rep., 2017, 7, 41716 CrossRef CAS.
- P. V. Shinde, N. M. Shinde, S. F. Shaikh, D. Lee, J. M. Yun, L. J. Woo, A. M. Al-Enizi, R. S. Mane and K. H. Kim, Room temperature synthesis and CO2 gas sensitivity of bismuth oxide nanosensor, RSC Adv., 2020, 10, 17217–17227 RSC.
- Z. Y. Lee, H. F. B. Hawari, G. W. B. Djaswadi and K. Kamarudin, A highly sensitive room temperature CO2 gas sensor based on SnO2–rGO hybrid composite, Materials, 2021, 14, 522 CrossRef CAS.
- S. Lam, J. Sin, A. Z. Abdullah and A. R. Mohamed, Degradation of wastewaters containing organic dyes photocatalyzed by zinc oxide: A Review, Desalin. Water Treat., 2012, 41, 131–169 CrossRef CAS.
- G. Liu, H. G. Yang, J. Pan, Y. Q. Yang, G. Q. Lu and H. M. Cheng, Titanium dioxide crystals with tailored facets, Chem. Rev., 2014, 114, 9559–9612 CrossRef CAS.
- K. Maeda, Z-scheme water splitting using two different semiconductor photocatalysts, ACS Catal., 2013, 3, 1486–1503 CrossRef CAS.
- J.-C. Wang, H.-H. Lou, Z.-H. Xu, C.-X. Cui, Z.-J. Li, K. Jiang, Y.-P. Zhang, L.-B. Qu and W. Shi, Natural sunlight driven highly efficient photocatalysis for simultaneous degradation of rhodamine B and methyl orange using I/C codoped TiO2 photocatalyst, J. Hazard. Mater., 2018, 360, 356–363 CrossRef CAS PubMed.
- S. Styring, Artificial photosynthesis for solar fuels, Faraday Discuss., 2012, 155, 357–376 RSC.
- X. Chang, T. Wanga and J. Gong, CO2 photoreduction: Insights into CO2 activation and reaction on surfaces of photocatalysts, Energy Environ. Sci., 2016, 9, 2177–2196 RSC.
- Y. Tamaki, T. Morimoto, K. Koike and O. Ishitani, Photocatalytic CO2 reduction with high turnover frequency and selectivity of formic acid formation using Ru (II) multinuclear complexes, Proc. Natl. Acad. Sci. U. S. A., 2012, 109, 15673–15678 CrossRef CAS.
- C. Liu, J. J. Gallagher, K. K. Sakimoto, E. M. Nichols, C. J. Chang, M. C. Y. Chang and P. Yang, Nanowire bacteria hybrids for unassisted solar carbon dioxide fixation to value-added chemicals, Nano Lett., 2015, 15, 3634–3639 CrossRef CAS.
- Y. A. Wu, I. McNulty, C. Liu, K. C. Lau, Q. Liu, A. P. Paulikas, C. J. Sun, Z. H. Cai, J. R. Guest, Y. Ren, V. Stamenkovic, L. A. Curtiss, Y. Liu and T. Rajh, Facet dependent active sites of a single Cu2O particle photocatalyst for CO2 reduction to methanol, Nat. Energy, 2019, 4, 957–968 CrossRef CAS.
- A. E. Nogueira, G. T. S. T. Da Silva, J. A. Oliveira, J. A. Torres, M. G. S. Da Silva, M. Carmo and C. Ribeiro, Unveiling CuO role in CO2 photoreduction process – Catalyst or reactant?, Catal. Commun., 2020, 137, 105929 CrossRef CAS.
- A. Paracchino, V. Laporte, K. Sivula, M. Grätzel and E. Timsen, Highly active oxide photocathode for photoelectrochemical water reduction, Nat. Mater., 2011, 10, 456–461 CrossRef CAS.
- P. D. Cozzoli, A. Kornowski and H. Weller, Low-temperature synthesis of soluble and processable organic-capped anatase TiO2 nanorods, J. Am. Chem. Soc., 2003, 125, 14539–14548 CrossRef CAS PubMed.
- J. Du, M. Yang, S. Nam Cha, D. Rhen, M. Kang and D. J. Kang, Indium hydroxide, and indium oxide nanospheres, nanoflowers, microcubes, and nanorods: Synthesis and optical properties, Cryst. Growth Des., 2008, 8, 2312–2317 CrossRef CAS.
- K.-M. Kim, H.-R. Kim, K.-I. Choi, H.-J. Kim and J.-H. Lee, ZnO hierarchical nanostructures grown at room temperature, and their C2H5OH sensor applications, Sens. Actuators, B, 2011, 155, 745–751 CrossRef CAS.
- S. Joshi, R. K. Canjeevaram Balasubramanyam, S. J. Ippolito, Y. M. Sabri, A. E. Kandjani, S. K. Bhargava and M. V. Sunkara, Straddled band aligned CuO/BaTiO3 heterostructures: role of energetics at nanointerface in improving photocatalytic and CO2 sensing performance, ACS Appl. Nano Mater., 2018, 1, 3375–3388 CrossRef CAS.
- S. A. Ansari, M. M. Khan, S. Kalathil, A. Nisar, J. Lee and M. H. Cho, Oxygen vacancy induced bandgap narrowing of ZnO nanostructures by an electrochemically active biofilm, Nanoscale, 2013, 5, 9238–9246 RSC.
- Y. Wang, Y. Lu, W. Zhan, Z. Xie, Q. Kuang and L. Zheng, Synthesis of porous Cu2O/CuO cages using Cu based metal-organic frameworks as templates and their gas sensing properties, J. Mater. Chem. A, 2015, 3, 12796–12803 RSC.
- J. X. Wang, X. W. Sun, Y. Yang and C. M. L. Wu, N–P Transition Sensing Behaviours of ZnO Nanotubes Exposed to NO2 Gas, Nanotechnology, 2009, 20, 465501 CrossRef CAS PubMed.
- P. Steiner, S. Hüfner, A. Jungmann, V. Kinsinger and I. Sander, Photoemission valence band spectra and electronic density of states in copper oxides and copper based ceramic super-conductors, Z. Phys. B: Condens. Matter, 1989, 74, 173–182 CrossRef CAS.
- J. F. Xu, W. Ji, Z. X. Shen, W. S. Li, S. H. Tang, X. R. Ye, D. Z. Jia and X. Q. Xin, Raman spectra of CuO nanocrystals, J. Raman Spectrosc., 1999, 30, 413–415 CrossRef CAS.
- Y. Chang and H. C. Zeng, Controlled synthesis and self-assembly of single-crystalline CuO nanorods and nanoribbons, Cryst. Growth Des., 2004, 4, 397–402 CrossRef CAS.
- S. H. Lee, Y. S. Her and E. Matijevic, Preparation and growth mechanism of uniform colloidal copper oxide by the controlled double-jet precipitation, J. Colloid Interface Sci., 1997, 186, 193–202 CrossRef CAS PubMed.
- W. Wang, Y. Zhan, X. Wang, Y. Liu, C. Zheng and G. Wang, Synthesis, and characterization of CuO nano whiskers by a novel one-step, solid-state reaction in the presence of a non-ionic surfactant, Mater. Res. Bull., 2002, 37, 1093–1100 CrossRef CAS.
- M. Cao, C. Hu, Y. Wang, Y. Guo, C. Guo and E. Wang, A controllable synthetic route to Cu, Cu2O, and CuO nanotubes and nanorods, Chem. Commun., 2003, 1884–1885 RSC.
- C.-T. Hsieh, J.-M. Chen, H.-H. Lin and H.-C. Shih, Synthesis of well-ordered CuO nanofibers by a self-catalytic growth mechanism, Appl. Phys. Lett., 2003, 82, 3316 CrossRef CAS.
- S. Wang, Q. Huang, X. Wen, X. Y. Li and S. Yang, Thermal oxidation of Cu2S nanowires: A template method for the fabrication of mesoscopic CuxO (x = 1, 2) wires, Phys. Chem. Chem. Phys., 2002, 4, 3425–3429 RSC.
- X. C. Jiang, T. Herricks and Y. N. Xia, CuO nanowires can be synthesized by heating copper substrates in air, Nano Lett., 2002, 2, 1333–1338 CrossRef CAS.
- M. Abaker, A. Umar, S. Baskoutas, S. H. Kim and S. W. Hwang, Structural and optical properties of CuO layered hexagonal discs synthesized by a low-temperature hydrothermal process, J. Phys. D: Appl. Phys., 2011, 44, 155405 CrossRef.
- P. Subalakshmi and A. Sivashanmugam, CuO nano hexagons: An efficient energy storage material for Li ion battery application, J. Alloys Compd., 2017, 690, 523–531 CrossRef CAS.
- T. Ghoshal, S. Kar and S. Chaudhuri, ZnO doughnuts: Controlled synthesis, growth mechanism, and optical properties, Cryst. Growth Des., 2007, 7, 136–141 CrossRef CAS.
- A. D. Bergstra, B. Brunekreef and A. Burdorf, The effect of industry related air pollution on lung function and respiratory symptoms in school children, Environ. Health, 2018, 17, 30 CrossRef.
- A. Ragothaman and W. A. Anderson, Air quality impacts of petroleum refining and petrochemical industries, Environments, 2017, 4, 66 CrossRef.
- Immediately Dangerous to Life or Health (IDLH) Values, https://www.cdc.gov/niosh/idlh/default.html, accessed 18th January 2021.
- J. Herrán, O. Fernández-González, I. Castro-Hurtado, T. Romero, G. G. Mandayo and E. Castano, Photoactivated solid state gas sensor for carbon dioxide detection at room temperature, Sens. Actuators, B, 2010, 149, 368–372 CrossRef.
- S. Joshi, F. Antolasic, M. V. Sunkara, S. K. Bhargava and S. J. Ippolito, Highly selective CO2 gas sensing properties of CaO-BaTiO3 heterostructures effectuated through discretely created n-n nanointerfaces, ACS Sustainable Chem. Eng., 2018, 6, 4086–4097 CrossRef CAS.
- D. Wang, Y. Chen, Z. Liu, L. Li, C. Shi, H. Qin and J. Hu, CO2 sensing properties, and mechanism of nano SnO2 thick film sensor, Sens. Actuators, B, 2016, 227, 73–84 CrossRef CAS.
- S. B. Rudraswamy and N. Bhat, Optimization of RF sputtered Ag-doped BaTiO3-CuO mixed oxide thin film as carbon dioxide sensor for environmental pollution monitoring application, IEEE Sens. J., 2016, 16, 5145–5151 CAS.
- S. Joshi, R. K. Canjeevaram Balasubramanyam, L. A. Jones, E. L. H. Mayes, S. J. Ippolito and M. V. Sunkara, Modulating interleaved ZnO assembly with CuO nanoleaves for multifunctional performance: Perdurable CO2 gas sensor and visible light catalyst, Inorg. Chem. Front., 2017, 4, 1848–1861 RSC.
- N. Van Hieu, N. Duc Khoang, D. Dang Trung, L. Duc Toan, N. Van Duy and N. Duc Hoa, Comparative study on CO2 and CO sensing performance of LaOCl coated ZnO nanowires, J. Hazard. Mater., 2013, 244–245, 209–216 CrossRef PubMed.
- S. Joshi, L. Satyanarayana, P. Manjula, M. V. Sunkara and S. J. Ippolito, Chemoresistive CO2 gas sensor based on CuO-SnO2 heterojunction nanocomposite material, 2nd International Symposium on Physics and Technology of Sensors (ISPTS), IEEE Xplore, 2015, 43–48 CAS.
- X. Liu, B. Du, Y. Sun, M. Yu, Y. Yin, W. Tang, C. Chen, L. Sun, B. Yang, W. Cao and M. N. R. Ashfold, Sensitive room temperature photoluminescence-based sensing of H2S with novel CuO–ZnO nanorods, ACS Appl. Mater. Interfaces, 2016, 8, 16379–16385 CrossRef CAS.
- W.-N. Wang, F. Wu, Y. Myung, D. M. Niedzwiedzki, H. S. Im, J. Park, P. Banerjee and P. Biswas, Surface engineered CuO nanowires with ZnO islands for CO2 photoreduction, ACS Appl. Mater. Interfaces, 2015, 7, 5685–5692 CrossRef CAS.
- L. A. Perez-Estrada, A. Aguera, M. D. Hernando, S. Malato and A. R. Fernandez-Alba, Photodegradation of malachite green under natural sunlight irradiation: Kinetic and toxicity of the transformation products, Chemosphere, 2008, 70, 2068–2075 CrossRef CAS.
- L. Yong, G. Zhanqi, J. Yuefei, H. Xiaobin, S. Cheng, Y. Shaogui, W. Lianhong, W. Qingeng and F. Die, Photodegradation of malachite green under simulated and natural irradiation: kinetics, products, and pathways, J. Hazard. Mater., 2015, 285, 127–136 CrossRef CAS.
- M. Singh, D. Jampaiah, A. E. Kandjani, Y. M. Sabri, E. D. Gaspera, P. Reineck, M. Judd, J. Langley, N. Cox, J. Van Embden, E. L. H. Mayes, B. C. Gibson, S. K. Bhargava, R. Ramanathan and V. Bansal, Oxygen deficient photostable Cu2O for enhanced visible light photocatalytic activity, Nanoscale, 2018, 10, 6039–6050 RSC.
- B. Li, Y. Hao, B. Zhang, X. Shao and L. Hu, A multifunctional noble-metal-free catalyst of CuO/TiO2 hybrid nanofibers, Appl. Catal., A, 2017, 531, 1 CrossRef CAS.
- F. Li, L. Zhang, J. Tong, Y. Liu, S. Xu, Y. Cao and S. Cao, Photocatalytic CO2 conversion to methanol by Cu2O/graphene/TNA heterostructure catalyst in a visible light driven dual chamber reactor, Nano Energy, 2016, 27, 320–329 CrossRef CAS.
- J. Lu, D. Li, Y. Chai, L. Li, M. Li, Y. Zhang and J. Liang, Rational design, and preparation of nanoheterostructures based on zinc titanate for solar-driven photocatalytic conversion of CO2 to valuable fuels, Appl. Catal., B, 2019, 256, 117800 CrossRef CAS.
- J. Yuan, X. Wang, C. Gu, J. Sun, W. Ding, J. Wei, X. ZuO and C. Hao, Photoelectrocatalytic reduction of carbon dioxide to methanol at cuprous oxide foam cathode, RSC Adv., 2017, 7, 24933–24939 RSC.
Footnotes |
| † Electronic supplementary information (ESI) available: Information on synthesis parameters and corresponding morphologies, scheme depicting gas sensor assembly, digital images of dye degradation carried out in natural sunlight on the institute's terrace, XRD pattern of CuO-IS and CuO-NF samples, TG-DTA and FTIR analysis, XPS survey spectrum, core levels of CuO-HS, core level O 1s with curve fitting parameters depicting oxygen vacancy percentage, μ-Raman analysis, EDAX and elemental mapping of the CuO-NF, FE-SEM of the CuO-MS, calibration curves as a function of CuO morphologies, raw sensor data of CuO-HS and CuO-IS under dry and humid conditions, selectivity performance by various CuO nanoarchitectures, long-term stability, LoD calculations, natural sunlight-induced dye degradation studies, digital photographs illustrating decolorization sequence for various organic dyes, dye degradation as a function of CuO morphology, photocatalytic dye degradation mechanism and the stability confirmed after the application studies from XRD, FESEM micrographs, and XPS. See DOI: 10.1039/d1ma00827g |
| ‡ Authors who have contributed equally. |
|
| This journal is © The Royal Society of Chemistry 2022 |
Click here to see how this site uses Cookies. View our privacy policy here. 
 Open Access Article
 This Open Access Article is licensed under a Creative Commons Attribution-Non Commercial 3.0 Unported Licence
 *a
*a