 Open Access Article
Nanodiamond-induced modifications of Eu-doped phosphate glasses toward photonic applications: A synergistic physico-chemical approach
Mariana
Sendova
 a and
José A.
Jiménez
 *b
*b
aOptical Spectroscopy & Nano-Materials Lab, New College of Florida, Sarasota, FL 34243, USA. E-mail: jjimenezlugo@augusta.edu
bDepartment of Chemistry & Physics, Augusta University, Augusta, GA 30904, USA
First published on 3rd November 2021
Abstract
Phosphate glasses were melted with fixed Eu2O3 content and varying amounts of nanodiamond (ND) powder seeking to obtain insights into the physico-chemical aspects underpinning optical properties while tuning the light-emitting properties towards photonic applications. A synergistic quantitative study incorporating X-ray diffraction, optical transmission, photoluminescence (PL) spectroscopy, Raman scattering, and differential scanning calorimetry (DSC) was carried out. The emitted light color was characterized via its CIE coordinates. The data from various techniques were correlated and discussed in the framework of energy band theory, along with the carbon-induced Eu3+ → Eu2+ reduction concomitant with non-bridging oxygen bond modifications. The optical band gap is calculated from the transmission spectra via Tauc plots to narrow from 4.1 eV to 3.3 eV with increasing carbon concentration from ND (CND ∼ 0.14–1.4 mol%). The optical band gap values appear proportional to the integral intensities of the Raman-active bands of the glass. The Eu2+ absorption band of the 4f7 → 4f65d transition is deduced from the absorption spectra of the glass and utilized to explain the optical band gap narrowing concentration-trend with 5d levels introduced below the conduction band edge. A novel method for quantifying the PL emission spectra is suggested and correlated to the CND concentration in the melt and to the optical band gap. Further, DSC was used to corroborate the data with the Raman and optical studies. The study contributes to the fundamental understanding and design of tunable light-emitting Eu-doped phosphate glasses for photonic applications.
1. Introduction
The remarkable physical properties of nanoscale diamond particles, i.e. nanodiamond (ND), have prompted investigations regarding their potential utilization for a wide variety of applications, ranging from biotechnology to integration in photonic devices.1–8 The exceptional mechanical and optical properties coupled to the high surface areas intrinsic to nanoscale materials are some of the key characteristics facilitating various technologies.2,5 On the other hand, ND also holds high chemical stability (low oxidative stress), exhibiting high resistance to harsh environments. This makes ND particularly attractive for applications in high-temperature chemistry wherein a durable form of carbon is preferred over other allotropes such as multi-wall carbon nanotubes (MWCNTs) or graphite. In this context, it has been recently reported by the authors9,10 that ND powder efficiently allows for the synthesis of UV-transparent phosphate glasses in association with P–O–C bond formation effectively increasing the covalent nature (decreasing the optical basicity) of the matrix. The carbon loadings with ND (up to 0.1 wt%)9 were found to be much lower than the concentrations used for co-doped glasses melted with MWCNTs (0.6 wt%)11 or graphite (0.8 wt%).12 Further, the chemical reductant role of the carbon provided in the form of ND (CND) facilitated the Cu2+ → Cu+ → Cu0 valence states changes in copper leading to an efficient plasmonic transformation to Cu nanocomposite glasses.9 Expanding on the chemical/reactant role of CND source in the melt, the present work was carried out on the synthesis of CND and Eu2O3 co-doped light-emitting glasses stimulating the conversion of red-emitting Eu3+ to blue-emitting Eu2+ ions. Hence, we herein report on the results of a multifaceted systematic physico-chemical investigation wherein Eu-doped binary barium-phosphate glasses were prepared by melting with a fixed amount of Eu2O3 and increasing contents of ND powder in the melt. Spectroscopic and calorimetric characterizations were then performed seeking to understand the composition-structure–property relation in the CND/Eu2O3 co-doped phosphate glasses. Insights into the connection amongst optical, structural, and thermal properties were obtained by detailed analyses via optical transmission, photoluminescence (PL) spectroscopy, Raman spectroscopy, and differential scanning calorimetry (DSC). In addition, a novel method for quantifying emission spectra is herein proposed which was correlated to the CND concentration and optical band gap energies assessed. The present work indicating that emission with broad tunability was achieved due to variation in the CND concentration may appeal to material developments in photonics.2. Experimental
2.1. Material synthesis
The glasses were prepared with a 50BaO:50P2O5 (mol%) composition from high purity Alfa Aesar chemicals (P2O5, ≥98% and BaCO3, 99.8%) by the melt-quenching technique.9 Batch materials were weighed, thoroughly mixed and melted in porcelain crucibles at 1150 °C between 15 and 20 min under normal atmospheric conditions and quenched in a steel mold. Annealing to remove mechanical/thermal stress was done at 420 °C for 3 hours. Europium oxide was added as Eu2O3 (Alfa Aesar, 99.99%) at the fixed amount of 1 mol% relative to P2O5 in all glasses, prepared with different amounts of ND powder (Sigma-Aldrich, <10 nm, ≥97%) added as part of the batch materials as 0.010, 0.040, 0.070 and 0.10 wt%. The glasses presented colorless and transparent appearance [photograph of some samples shown in Fig. 2(a)]. Glasses were cut and polished to produce slabs for optical measurements with final thicknesses of about 1.0 mm. Sample codes and translated nominal molar compositions for the glasses of this study are summarized in Table 1.| Glass | BaO | P2O5 | Eu2O3 | CND |
|---|---|---|---|---|
| Eu | 49.750 | 49.750 | 0.500 | — |
| EuND1 | 49.680 | 49.680 | 0.497 | 0.142 |
| EuND2 | 49.470 | 49.470 | 0.495 | 0.566 |
| EuND3 | 49.260 | 49.260 | 0.493 | 0.986 |
| EuND4 | 49.053 | 49.053 | 0.491 | 1.403 |
2.2. Measurements
X-Ray diffraction (XRD) measurements were performed on the glasses to confirm the overall amorphous structure with a Rigaku MiniFlex benchtop X-ray diffractometer with Cu-Kα radiation (λ![[thin space (1/6-em)]](https://www.rsc.org/images/entities/char_2009.gif) =
= ![[thin space (1/6-em)]](https://www.rsc.org/images/entities/char_2009.gif) 1.5406 Å) over the 10° ≤ 2θ ≤ 80° angular range.
1.5406 Å) over the 10° ≤ 2θ ≤ 80° angular range.
The UV/Vis optical transmission measurements were performed on the glass slabs fixed on a custom-made sample holder with an Agilent Cary 300 series double-beam spectrophotometer; the reference during the measurements was always air.
The PL data was acquired with a Horiba-PTI QM-8075-21 spectrofluorometer equipped with a continuous illumination Xe lamp. Corrected spectra were obtained under the steady-state conditions through the FelixGX software by utilizing instrument calibration files provided by the manufacturer to perform the spectral corrections. The step size used for spectral acquisitions was 1 nm. All PL measurements were recorded with samples mounted in a solid sample holder with attention given to sample position and keeping conditions constant during experiments.
Raman spectra were acquired using a Leica DMLP microscope coupled to a Raman system from Kaiser Optical Systems Inc. RamanRxn1™ analyzer incorporates a thermoelectrically-cooled charge-coupled device detector for maximum sensitivity, Invictus™ near-IR semiconductor laser with wavelength of 785 nm to minimize the PL from Eu3+ ions. The spectrometer has a holographic grating to provide fast simultaneous full spectral collection of Raman data. The spectral resolution of the Raman system is 5 cm−1. All spectroscopy measurements were carried out at room temperature.
The glass transition temperature, Tg, the activation energy of the glass transition regime, ETg and the liquid fragility factor, m, with the associated uncertainties, were determined from a set of measurements carried out with a TA Instruments Q20 differential scanning calorimeter following the constant cooling rate cycles developed in our group.13 OriginPro and GRAMS spectroscopy software were used for data analysis.
3. Results and discussion
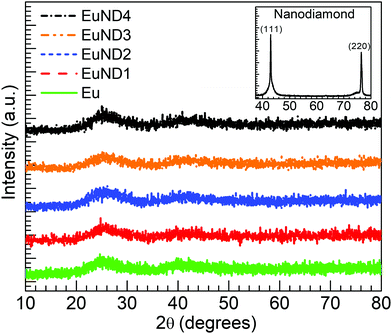
Presented in Fig. 1 are the results from the XRD characterization performed on the Eu and EuND1–4 glasses synthesized. The inset shows the diffractogram obtained for the ND powder used as raw material for which the characteristic (111) and (220) diffraction peaks of diamond NPs are observed.14 The broad diffuse scattering at lower angles typical of long-range structural disorder is noticeable for all five glasses. This, along with the fact that there are no sharp peaks detected, support the overall amorphous nature of the glasses. The authors suggest that the ND powder serves as an efficient carbon source due to its favorable etching rate. It was reported that at 600 °C the etching rate is 10 nm h−1.15 Given the melting temperature/time (1150 °C/≥15 min) and the starting ND particle size, <10 nm, it is highly unlikely that any ND particles have survived in the final glass matrix. The XRD data in Fig. 1 supports this hypothesis. The presented XRD spectra have no indication of actual nano-diamond structures surviving in the final glass.Fig. 2(a) shows the optical transmission spectra obtained for the various glasses under consideration. The Eu glass exhibits the dip in the transmission spectrum around 393 nm due to 7F0 → 5L6 transition of Eu3+ ions,16,17 while the host absorption edge characterizes the decreased transmission toward shorter wavelengths.9 It is observed for the EuND1 glass that a decreased transmission developed around 320 nm while the glass appears to have the transmission edge shifted towards shorter wavelengths. A similar result is observed for the EuND2 glass, however with more pronounced reduction in the transmission around 320 nm. Thereafter, the increase in the ND contents results in a significantly decreased transmission for the EuND3 and EuND4 glasses. Such lowering in the transmission around 320 nm is attributed to the 4f7 to 4f65d inter-configurational transitions in Eu2+ ions which are quite intense due to the allowed character for the light absorption process.18,19 The results resemble the recently reported for the glasses melted with Eu2O3 and MWCNTs in our group,20 however the current spectra are achieved with ten times lower carbon (CND) loadings. Similar evolution in transmission spectra were also reported by Tratsiak et al.16 and Liang et al.19 following the conversion from Eu3+ to Eu2+ in silicate and borophosphate glasses, respectively. The development of the transmission in Fig. 2(a) decreasing with the increase in ND content is consistent with an increase in Eu2+ concentration up to the EuND4 glass. However, the Eu3+ feature around 393 nm is concurrently seen in all glasses. It indicates the co-existence of both oxidation states of europium as similarly observed in the work reported in ref. 20, and further reflected in the results from PL measurements (vide infra). Hence, in analogy to recent work evaluating the role of MWCNTs,20 the partial Eu3+ → Eu2+ reduction occurring in the melt via carbon provided by ND (CND) may be represented as
| Eu2O3 + CND → 2EuO + CO | (1) |
| Eu2O3 + CO → 2EuO + CO2 | (2) |
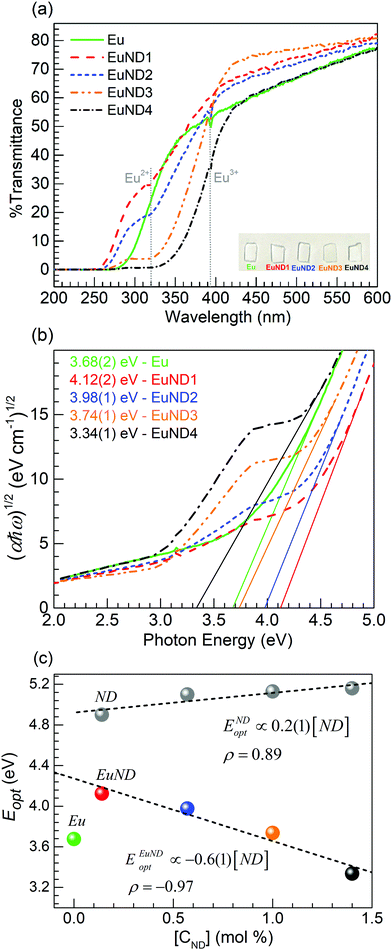 | ||
| Fig. 2 (a) Transmission spectra of the Eu and EuND1–4 glasses (the inset is a photograph of some glass samples on white background). (b) Corresponding Tauc plots with optical band gap values listed. (c) Optical band gaps comparison between two sets of barium phosphate glasses, without Eu, i.e. labeled ND9 and with Eu doping (EuND glasses in this study) correlated to the added CND concentration (mol%) in the melt. | ||
From the transmission spectra, Fig. 2(a), the absorption spectra were calculated, and analyzed. Then, the optical band gap of the glasses is assessed, and its CND concentration trend is discussed within the energy band theory applied to glasses. The optical absorption coefficient, α, exhibits a logarithmic dependence with the optical path length, d. According to the Bouguer–Lambert–Beer absorption law as
 | (3) |
 and finding the position, ħωmax, from
  .10 After establishing the steepest section of the Tauc plot, 5–10 points to the left of the maximum,
  , are employed for a linear regression. The correlation coefficient (Pearson's ρ) is estimated to vary between 0.99998 (for 5 pts regression) and 0.998 (for 10 pts regression). Extrapolating the linear regression to, yields the optical band gap of the glass (Tauc band gap, Eopt). The optical band gap values are listed in the inset of Fig. 2(b), color coded according to the legend. The uncertainty of the single measurement is evaluated from the linear regression analysis, and its value is presented in parentheses, pertaining to the last reported decimal. The reported band gap uncertainty is limited only to the regression analysis. Further on, utilizing the assessed Eopt values, it was established that a strong correlation (Pearson's coefficient ρ = –0.97) exists between the optical band gap values and the ND concentration in the melt, Fig. 2(c) EuND data points, ENDEuopt. In the same figure ENDopt values of a series of CND doped barium phosphate glasses (without the Eu co-doping) are included [grey bullet points Fig. 2(c)]. The optical band gap values, ENDopt, were analyzed and reported in a previous study.9 As the data indicates, the CND co-doping alone, opens the optical band gap, proportionally to the CND concentration in the melt with rate of ∼0.2 eV/(ND mol%), assessed by the slope of the linear fit, presented in Fig. 2(c) (dashed fitting line to the grey data points). The ENDopt widening with CND concentration is associated with the formation of P–O–C bonds, as supported by 31P NMR studies9,10 (Fig. 2 and Table 2 in ref. 9; Fig. 3 and Table 1 in ref. 10) and Raman spectroscopy results reported herein. The P–O–C bonds are suggested to promote electron localization, lowering the valence band edge thus leading to widening the optical band gap, Fig. 2(c), ND data points. Therefore structurally, the ENDopt increase, might be manifested as relative decrease in non-bridging oxygen (NBO) moieties at the expense of the P–O–C bonding (vide infra). According to the perturbed ion (PI) model for calculating the band gap of ionic crystals,22,23 optical absorption arises due to electron transfer from valence band of the anion to the conduction band of the cation. The authors proposed the PI model to be extended to the phosphate glasses under consideration.10 The ionic interactions between the NBOs of the phosphorus tetrahedral units and cationic modifiers are instrumental in shaping the width of the optical band gap. In the current study the ND glasses are additionally co-doped with Eu2O3. Interestingly, the europium co-doping at relatively low levels ∼0.5 mol% turns out to exhibit profound a effect on the optical band gap width. Increasing CND concentrations in the presence of Eu ion, yields strong optical band gap narrowing trend estimated at –0.6 eV/(CND mol%). The estimate is done from the linear fit to the ENDEuopt values, EuND data points, Fig. 2(c). The barium phosphate glass co-doped only with Eu serves as a reference in this study [a green bullet point, Fig. 2(c)]. Quick comparison reveals that the ∼0.5 mol% Eu co-doping negates the band gap broadening of ∼1 mol% of CND in the EuND3 glass, and the reference Eu glass has similar band gap Eopt ≈ 3.7 eV in contrast to the ND glass (grey bullet point) with ENDopt ≈ 5.1 eV. As indicated earlier (vide supra), the reason for such dramatic decrease of the band gap in the presence of europium ions is the reductant role played by the carbon source. CND partially reduces Eu3+ → Eu2+ in the melt which also manifests through the luminescent properties presented below. The optical band gap of the EuND glass series is thus affected by the f-d optical transitions of the Eu2+ions, namely 4f7 to the crystal field split 4f65d level (eg and t2g).18,19
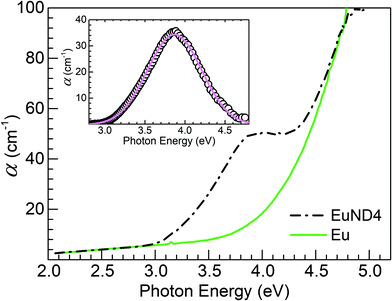
In an attempt to quantify the decreased transmission around 320 nm, Fig. 2(a), the Eu glass reference absorption spectrum was subtracted from the absorption spectrum of the EuND4 glass. Fig. 3 summarizes the analysis process. A Gaussian absorption band with peak at 3.9 eV (318 nm) and full-width at half-maximum (FWHM) of 0.8 eV is revealed after the spectral subtraction. The absorption band peak position agrees with the lower of the two Eu2+crystal field split 4f7 → 4f65d electronic level transitions, namely eg. Nogami et al.18 reported the two absorption bands at 3.9 eV (eg) and 5.1 eV (t2g) in aluminosilicate glass prepared by sol–gel method. Liang et al.19 reported 3.7 eV (eg) and 4.3 eV (t2g) in co-doped borophosphate glasses. Therefore, the Eu2+ ion 5d orbital, split into two components of eg and t2g by the local crystal-field introduces two distinguishable, discrete acceptor type energy levels below the conduction band edge of the phosphate glass host. (1) The t2g energy level, closer to the conduction band edge, is revealed by reduced ENDEuopt values. The transition energy 4f7 → 4f65d (t2g) is reported to be >4.3 eV18,19 and the assessed herein, ENDEuopt with the lowest CND concentration, EuND1 is 4.1(1) eV. Further increase of the concentration of the reduced europium ions leads to increased density of 5d states below the edge of the conduction band, effectively further narrowing the optical band gap, Fig. 2(c) (EuND data points). (2) The electronic transitions to the lower, eg level give rise to the shoulder in the transmission (absorption) spectra, Fig. 2(a, b), Fig. 3. Therefore, there are two opposing trends in relation to the ENDEuopt evolution with increasing CND: (i) lowering the valence band edge due to the increased covalent character of the glass former, via promotion of P–O–C bonds; and (ii) concomitant introduction of Eu2+ 4f65d levels effectively lowering the conduction band edge. It appears that the second effect is dominant. The ratio between the concentration rates of the two opposing processes can be assessed from the ratio of the corresponding linear slopes, Fig. 2(c) inset: (−0.6–0.2)/0.2 = −4. Therefore, the data suggests the reducing role of CND is a four-fold more potent mechanism for altering the optical band gap of the glass than the P–O–C bond formation. The former effect will be examined by PL spectroscopy, while the latter will be further investigated by Raman spectroscopy below.
Shown in Fig. 4 are emission spectra obtained for the glasses under the excitation wavelength of 320 nm in accord with the Eu2+ absorption feature in Fig. 3. The presence of Eu2+ is evidenced for the EuND1–4 glasses by the broad 5d → 4f emission band16,18,24 with maximum around 450 nm which is absent for the Eu glass. However, a saturation in the blue emission from Eu2+ is observed after 1.0 mol% ND. It turns out that the EuND4 glass which presented the lowest transmission in Fig. 2 thus pointing to the highest Eu2+ content, does not show greater intensity in the band emission than the EuND3 glass. In addition, the characteristic emission of Eu3+ ions due to the 5D0 → 7FJ (J = 0, 1, 2, 3, 4) transitions18,24 is seen in the Eu and the EuND1–4 glasses. This harmonizes with the coexistence of Eu3+ ions already indicated by the transmission spectra (Fig. 2) since 320 nm is resonant with exciting the 7F0 → 5H4 transition in Eu3+.17,25 Thus Eu2+/Eu3+ co-doping facilitated by CND introduction in the melt, yields tunable colored emission with color coordinates presented in the CIE diagram, Fig. 4 inset. It is worth noting in Fig. 4 that the emission intensities for the transitions in Eu3+ ions are highest for the EuND1 glass, followed by the Eu reference. The order of the intensity for the most prominent 5D0 → 7F2 transition around 613 nm is as follows: EuND1 (highest) > Eu > EuND2 > EuND3 > EuND4 (lowest). The 613 nm peak intensity increases by about 13% for the EuND1 glass relative to the Eu reference. This is an interesting result given that the EuND1 having less Eu3+ content than the Eu reference would intuitively be expected to have a lower Eu3+ emission intensity. A similar result was recently reported for a glass melted with 0.3 wt% MWCNT together with Eu2O3 where the PL intensity for the 613 nm peak increased relative to the Eu reference.20 In addition, a similar result was observed by Nogami et al.18 who first performed the Eu3+ → Eu2+ reduction in Al2O3–SiO2 sol–gel glass under 20%H2–80%N2 atmosphere, followed by heating in air at 800 °C which led to partial Eu2+ → Eu3+ re-oxidation. It was reported that the luminescence intensity for the Eu3+ ions increased after the heating in air approaching a value larger than 1.5 times the intensity before the 20%H2–80%N2 treatment.18 It was concluded that such enhanced Eu3+ PL was due to the Eu2+ → Eu3+ energy transfer process.18 Such energy transfer similarly acknowledged by other researchers,16,24,26 seems to be manifested herein for the lowest amount of ND powder added to the EuND1 glass which showed greater Eu3+ PL intensity than the Eu glass. On the other hand, the subsequent decrease in Eu3+ emission reflected for the EuND2, EuND3 and EuND4 glasses in Fig. 4 agrees with a decrease in Eu3+ concentration produced by the reducing process supported by the ND, e.g.eqn (1) and (2).
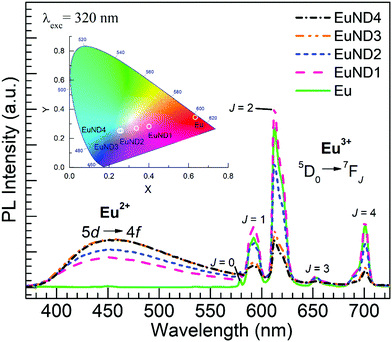 | ||
| Fig. 4 Emission spectra obtained under excitation at 320 nm for the Eu and EuND1–4 glasses. The color coordinates of the emission are presented in the CIE chromaticity diagram, inset. | ||
Fig. 5 shows the PL spectra obtained for the various glasses under excitation at 310 nm to focus on the blue emission from Eu2+, since under such excitation the emission from Eu3+ ions is minimized. The bluish character of the overall luminescence is quantified by the CIE coordinates presented in the inset of Fig. 5. The PL emission trend is clearly seen as a decrease in intensity in the order: EuND3 (highest) ≈ EuND4 > EuND2 > EuND1 > Eu (absent). Again, the trend observed in Fig. 2(a) for the transmission decreasing following the increase in ND content is not followed, as it was similarly observed for the glasses melted with MWCNTs and Eu2O3 as reported.20 As pointed by Tratsiak et al.,16 many excitation-reabsorption processes involving Eu2+ ↔ Eu2+ and Eu2+ → Eu3+ interactions may occur that can lead to a diminution of the PL intensities. Given that the Eu2+ → Eu3+ transfer was indicated in Fig. 4 to be significant merely for the EuND1 glass, we then consider the Eu2+ ↔ Eu2+ interactions being at the origin of the lack of increase in the Eu2+ 5d → 4f blue emission band after 1.0 mol% ND. In other words, the well-known phenomenon of concentration quenching appears to be manifested for Eu2+ for the higher content of ND powder. In addition, a reduction in the optical band gap is suggested as contributing factor to the apparent saturation effect of the emission for EuND4 glass, as considered with the glasses melted with MWCNTs and Eu2O3.19 The Eopt of EuND4 of ∼3.3 eV corresponds to a threshold wavelength of 376 nm, indicating that the excitation beams with wavelengths of 310 nm and 320 nm (∼3.9 eV) are with decreased intensity, yielding comparatively less emission.
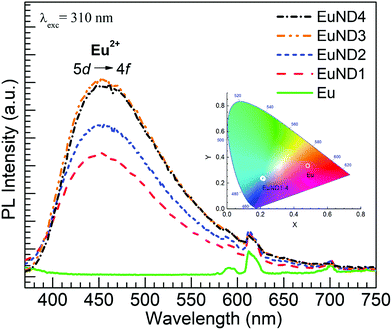 | ||
| Fig. 5 Emission spectra obtained under excitation at 310 nm for the Eu and Eu ND1–4 glasses. The CIE diagram with the color coordinates of the emission is shown in the inset. | ||
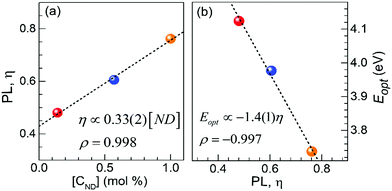
Further on, this study exploits the spectrally well-separated emission ranges of Eu2+ and Eu3+ under 320 nm excitation in attempt to numerically assess the apparent integral ratio  of the emission and to correlate it to the CND concentration in the melts (∼0.14–1.0 mol%). The PL spectra (375 nm to 750 nm) was numerically normalized by the total area, and the integral blue emission of the Eu2+ ions was evaluated by recording the fractional intensity between 375 nm to 575 nm. As expected, a strong positive concentration correlation (Pearson's ρ = 0.998) was revealed, Fig. 6(a). The slope of the fitted linear regression is ∼(+0.33) η/(CND mol%). Thus, the assessed concentration rate of η via the PL spectra, reflects the apparent europium ionic ratio, having in mind some possible underestimation of [Eu2+] due to the suggested above energy transfer indicated in EuND1 sample. The EuND4 glass was omitted in this analysis, because it shows some emission saturation effects. Continuing the analysis, the assessed optical band gap, ENDEuopt, Fig. 2(c), was plotted against the integral PL factor η, for the EuND1–3 glasses, Fig. 6(b). A strong negative correlation (Pearson's ρ = −0.997) was revealed: an increased PL is harmoniously correlated with the Eopt narrowing. Therefore, the absorption studies-based hypothesis of the crucial role of the split Eu2+ 5d levels for optical band gap narrowing in the EuND glass series is in agreement with the integral PL η factor analysis carried out herein.
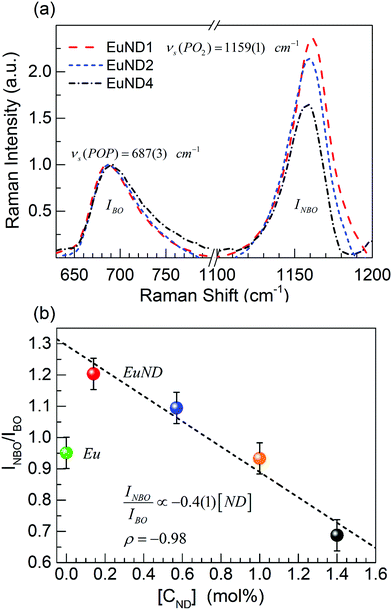
To elucidate structural changes accompanying the trends in optical properties, Raman spectroscopy is employed. The main Raman features for the studied metaphosphate glasses are detected in the range 600–1400 cm−1, Fig. 7(a). According to the Raman bands assignments,27 the investigated range is divided roughly in two sections. A broad asymmetric feature between 650 and 850 cm−1 is an envelope of continuous distribution of bridging oxygens (BOs) bond strengths of the Q2 species, (the superscript indicates the number of BOs). Raman shifts of the νs (POP) frequencies within the envelope are inversely proportional to the phosphate chain length. The second spectral section includes Raman active out-of-chain symmetrical νs (PO2) modes of the Q2 species. In principle, the position of the most intense Raman band, νs (PO2) (at 1159 cm−1 with FWHM ∼60 cm−1) is sensitive to the modifying and doping cations. The intensity of the band reflects the relative concentration of the NBOs. In the studied glass series, Fig. 7(a), no shift of the band position is detected, reflecting the lack of substantial change of the cation electrostatic field. Evidently, the overall amount of the Eu dopant and its charge changes due to the CND co-dopant is not affecting the strength of NBOs bond. The Raman signal across the studied set of EuND glasses differs by the ratio of the integral intensities of the main bands, INBO/IBO. After the background subtraction, the spectra were normalized to the maximum of the BO band, Fig. 7(a). The integral intensities are calculated by numerical integration from 639 to 821 cm−1 for the BO band, IBO, and from 1109 to 1198 cm−1 for the NBOs band, INBO. EuND1 and EuND2 have INBO/IBO ratio slightly >1, while EuND3 and Eu ND4 have INBO/IBO ratio < 1. The INBO/IBO ratio is plotted vs. CND concentration, Fig. 7(b). A compelling negative correlation (Pearson's ρ = −0.98) with the CND concentration is revealed. The slope of the linear fit (dashed black line) is listed as well. With increasing CND concentration, the NBO band is suppressed due to the creation of the P–O–C bonds revealing steady decreasing trend of NBO oscillators. Apparently, the CND co-doping lessens the number of the NBOs. The P–O–C moieties do not yield a detectable new Raman band. However, the CND co-doping lessens the number of the NBOs. Furthermore, from the red shift of the high frequency wing of the νs (PO2) band, it is apparent that there is a tendency for the CND to bond to NBOs more strongly affected by the electrostatic field of the cations. Thus, according to the most prominent Raman band, νs (PO2), the NBO bond distribution in the matrix exhibits a tendency to be symmetrized by the elevated CND doping concentrations. At the same time, the symmetric stretching νs (POP) band position of the EuND4 glass [black dash dot line, Fig. 7(a)] shifts toward higher wavenumbers (stronger bonds) relative to the EuND1 glass. The noticeable integral intensity increase of the Raman BO band of EuND4, indicates the presence of an elevated concentration of BO bonds of Q2 species in agreement with 31P NMR.9,10 Overall, the Raman trends indicate an increased covalent character of the tetrahedral units’ bonds. The observations corroborate with the DSC study of the glass transition regime as considered next.
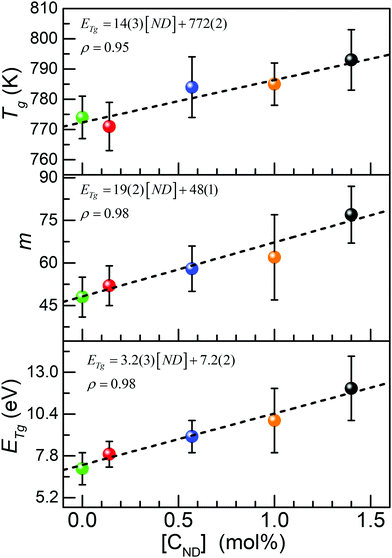
The glass transition range is characterized utilizing a recently proposed new experimental method: the constant cooling rate (CoCR) technique with a novel geometric approach for data analysis.13 The CoCR cycles are made possible by acquiring measurement between two thermally equilibrated points: ∼50 °C above and ∼50 °C below the glass transition temperature, Tg, thus keeping the cooling rates constant, while varying the heating rates. The thermal history for each sample is established by an initial up and down scan cycle setting Tg to be equal to the fictive glass temperature. The proposed glass transition range geometric analysis includes the algorithmized numerical evaluation of Tg, activation energy, ETg, and the liquid fragility parameter, m, and their corresponding uncertainties. Fig. 8 summarizes the results for each EuND glass composition. The DSC analysis gives more specific insight on the overall bond strength via experimental evaluation of the activation energy of the glass transition, ETg. The Tg was determined as the inflection point of the heat flow curve, (not shown) at each one of four DSC ramping rates (10 °C/min, 20 °C/min, 40 °C/min and 60 °C/min). Fig. 8 (top panel) summarizes the results for heating rate 10 °C/min. The measured Tg values show slightly increasing trend with the CND concentration. The confidence interval of the measurand was estimated via a procedure reflecting the broadness of the glass transition regime, rather than the accuracy of the mathematical procedure for finding the inflection point. Utilizing the Tg values obtained for each ramping rate and an Arrhenius-type plot,28 the glass transition activation energy, ETg, of the EuND glasses was determined to be between 7 eV and 11 eV increasing with the CND concentration, Fig. 8 (bottom panel). Similar range of increase, but with much poorer correlation was reported for MWCNT and Eu doped glass.20 The ETg rising trend suggests overall average increase of the covalent nature of glass former, thus increasing the energy threshold for the onset of the P–O bond exchange mechanism. The bond exchange mechanism involves P–O bond severing for allowing a phosphorus exchange between adjacent tetrahedral units.28 Further on, the experimental determination of Tg and ETg allows for assessing the liquid fragility parameter, m, of the carbon-modified host matrix. The liquid fragility, m, is a dimensionless phenomenological description of the structural ordering (‘strength’) of quenched liquids.29 To calculate the liquid fragility, ETg value, in eV is utilized as well as Tg in K (at standard 10 °C per min rate)30 by
 | (4) |
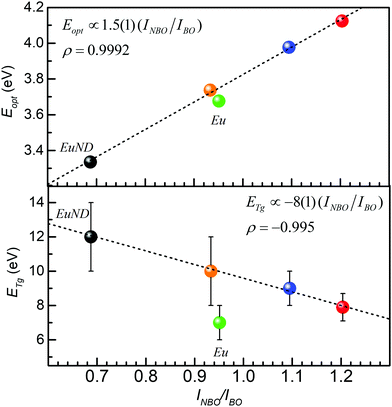
Finally, Fig. 9 summarizes the synergistic connection between UV-Vis transmission, Raman spectroscopy, and the calorimetric study. The positive correlation of the Eopt to Raman band integral intensity ratio, INBO/IBO, suggests the recognizable role the NBO bonds play for the evolution of the Eopt. At the same time, the negative correlation presented in the bottom panel, suggests a prevalent contribution of the BO bonds to the glass transition processes (vide supra). The red data points represent EuND1, the orange data point EuND2, the blue data point EuND3, and the black data point the EuND4 glass. Comparing the slopes of the fitted lines one can propose that ETg is more sensitive (5.3 ×) to the Raman assessed integral structural parameter INBO/IBO. ETg has slope of −8 eV, compared to Eopt fit line with slope of 1.5 eV.
4. Conclusions
A series of five co-doped phosphate glasses were melted with fixed Eu2O3 content and varying amounts of ND powder. Four synergistic techniques: optical transmission, PL spectroscopy, Raman scattering, and calorimetry were applied. A quantitative elucidation of the concentration-related physico-chemical mechanisms of emission spectra and optical band gap evolution in relation to matrix bond structure, suggested from Raman spectroscopy and the DSC analysis was reported. The CND induced structural changes were also previously supported in our group.9,10 A novel integral parameter, η, was proposed for evaluating the PL spectra. Compelling linear correlations were established between the CND concentration and: (1) optical band gap, Eopt; (2) PL η factor; (3) Raman integral intensity band ratio; (4) glass transition temperature, Tg; (5) glass transition activation energy, ETg; and (6) liquid fragility factor, m. The data were correlated and discussed in the context of energy band theory, and the CND induced bond and cation modifications. The optical band gap was calculated from the transmission spectra via Tauc plots to vary between 4.1 eV and 3.3 eV with CND concentration. The optical band gap values were compared and discussed in relation to the barium phosphate glass without europium doping. The band gap values of the EuND1–4 series of glasses inversely correlate to the CND concentration and are proportional to the integral intensity ratio INBO/IBO of the Raman active bands of the phosphate matrix. The Eu2+ absorption band of 4f7 → 4f65d transition was deduced from the absorption spectra and utilized to explain the optical band gap narrowing concentration trend. The novel method for quantifying the photoluminescent spectra suggested was correlated to the CND concentration and to the optical band gap. Further on, DSC was used to corroborate the data with the Raman and optical studies. Emission with broad tunability was achieved due to variation in the CND concentration which may be of interest for material developments toward photonic applications. The CND doping versatility as chemical reductant of Eu3+ ions and as an efficient modifier of the optical properties of the glass matrix appear attractive to exploit for future technologies in glass-based photonics.Author contributions
Mariana Sendova: conceptualization, visualization, methodology, investigation, formal analysis, writing – original draft, reviewing and editing. José A. Jiménez: conceptualization, visualization, methodology, investigation, formal analysis, writing – original draft, reviewing and editing, supervision.Conflicts of interest
The authors declare that they have no known competing financial interests or personal relationships that could have appeared to influence the work reported in this paper.Acknowledgements
M. S. thanks undergraduate student M. Mancini for collecting the DSC data.References
- S.-J. Yu, M.-W. Kang, H.-C. Chang, K.-M. Chen and Y.-C. Yu, Bright fluorescent nanodiamonds:
![[thin space (1/6-em)]](https://www.rsc.org/images/entities/char_2009.gif) no photobleaching and low cytotoxicity, J. Am. Chem. Soc., 2005, 127, 17604 CrossRef CAS.
no photobleaching and low cytotoxicity, J. Am. Chem. Soc., 2005, 127, 17604 CrossRef CAS. - V. N. Mochalin, O. Shenderova, D. Ho and Y. Gogotsi, The properties and applications of nanodiamonds, Nat. Nanotechnol., 2012, 7, 11 CrossRef CAS PubMed.
- B.-M. Chang, H.-H. Lin, L.-J. Su, W.-D. Lin, R.-J. Lin, Y.-K. Tzeng, R. T. Lee, Y. C. Lee, A. L. Yu and H.-C. Chang, Highly fluorescent nanodiamonds protein-functionalized for cell labeling and targeting, Adv. Funct. Mater., 2013, 23, 5737 CrossRef CAS.
- H. Siampour, S. Kumar, V. A. Davydov, L. F. Kulikova, V. N. Agafonov and S. I. Bozhevolnyi, On-chip excitation of single germanium vacancies in nanodiamonds embedded in plasmonic waveguides, Light: Sci. Appl., 2018, 7, 61 CrossRef PubMed.
- M. Radulaski, J. L. Zhang, Y.-K. Tzeng, K. G. Lagoudakis, H. Ishiwata, C. Dory, K. A. Fischer, Y. A. Kelaita, S. Sun, P. C. Maurer, K. Alassaad, G. Ferro, Z.-X. Shen, N. A. Melosh, S. Chu and J. Vučković, Nanodiamond integration with photonic devices, Laser Photonics Rev., 2019, 13, 1800316 CrossRef.
- S.-R. Qin, Q. Zhao, Z.-G. Cheng, D.-X. Zhang, K.-K. Zhang, L.-X. Su, H.-J. Fan, Y.-H. Wang and C.-X. Shan, Rare earth-functionalized nanodiamonds for dual-modal imaging and drug delivery, Diam. Relat. Mater., 2019, 91, 173 CrossRef CAS.
- H.-S. Jung, K.-J. Cho, S.-J. Ryu, Y. Takagi, P. A. Roche and K. C. Neuman, Biocompatible fluorescent nanodiamonds as multifunctional optical probes for latent fingerprint detection, ACS Appl. Mater. Interfaces, 2020, 12, 6641 CrossRef CAS PubMed.
- J.-X. Qin, X.-G. Yang, C.-F. Lv, Y.-Z. Li, K.-K. Liu, J.-H. Zang, X. Yan, L. Dong and C.-X. Shan, Nanodiamonds: Synthesis, properties, and applications in nanomedicine, Mater. Des., 2021, 210, 110091 CrossRef CAS.
- J. A. Jiménez and M. Sendova, Nanodiamond-induced UV transparency in phosphate glasses and development of plasmonic Cu nanocomposites, J. Non-Cryst. Solids, 2020, 544, 120193 CrossRef.
- M. Sendova and J. A. Jiménez, Band gap analysis and correlation with glass structure in phosphate glasses melted with various allotropes of carbon, Chem. Phys., 2021, 547, 111207 CrossRef CAS.
- J. A. Jiménez, M. Sendova, E. R. Fachini and C. Zhao, Enhanced UV transparency in phosphate glasses via multi-wall carbon nanotubes, J. Mater. Chem. C, 2016, 4, 9771 RSC.
- J. A. Jiménez, On the graphite-induced UV transparency in phosphate glasses, Opt. Mater., 2016, 62, 42 CrossRef.
- M. Mancini, M. Sendova and J. C. Mauro, Geometric analysis of the calorimetric glass transition and fragility using constant cooling rate cycles, Int. J. Appl. Glass Sci., 2021, 12, 348 CrossRef CAS.
- S. Tomita, A. Burian, J. C. Dore, D. LeBolloch, M. Fujii and S. Hayashi, Diamond nanoparticles to carbon onions transformation: X-ray diffraction studies, Carbon, 2002, 40, 1469 CrossRef CAS.
- T. Gaebel, C. Bradac, J. Chen, J. M. Say, L. Brown, P. Hemmer and J. R. Rabeau, Size-reduction of nanodiamonds via air oxidation, Diam. Relat. Mater., 2012, 21, 28 CrossRef CAS.
- Y. Tratsiak, M. Buryi, V. Babin, M. Korjik and E. Trusova, The effect of binary glass composition on the Eu-ions luminescence properties, Opt. Mater., 2019, 94, 356 CrossRef CAS.
- J. A. Jiménez, Optical properties of Eu3+-doped aluminophosphate glass with a high concentration of silver and tin, J. Inorg. Organomet. Polym., 2017, 27, 372 CrossRef.
- M. Nogami, T. Yamazaki and Y. Abe, Fluorescence properties of Eu3+ and Eu2+ in Al2O3–SiO2 glass, J. Lumin., 1998, 78, 63 CrossRef CAS.
- X. Liang, Z. Xing, Y. Yang, S. Wang and G. Chen, Luminescence properties of Eu2+/Mn2+ codoped borophosphate glasses, J. Am. Ceram. Soc., 2011, 94, 849 CrossRef CAS.
- J. A. Jiménez, M. Sendova and M. Mancini, Eu2+/Eu3+ activated phosphate glasses synthesized via melting with multi-wall carbon nanotubes, Opt. Mater., 2020, 109, 110336 CrossRef.
- N. Mott and E. Davis, Electronic process in non-crystalline materials, Clarendon Press, Oxford, 2nd edn, 1979 Search PubMed.
- A. Aguado, A. Ayuela, J. M. Lopez, J. A. Alonso, J. F. Rivas-Silva and M. Berrondo, Calculation of the band gap energy of ionic crystals, Rev. Mex. Fis., 1998, 44, 550 CAS.
- V. Luaña and L. Pueyo, Simulation of ionic crystals: The ab initio perturbed-ion method and application to alkali hydrides and halides, Phys. Rev. B, 1990, 41, 3800 CrossRef PubMed.
- E. Malchukova and B. Boizot, Reduction of Eu3+ to Eu2+ in aluminoborosilicate glasses under ionizing radiation, Mater. Res. Bull., 2010, 45, 1299 CrossRef CAS.
- J. A. Jiménez, S. Lysenko, H. Liu, E. Fachini and C. R. Cabrera, Investigation of the influence of silver and tin on the luminescence of trivalent europium ions in glass, J. Lumin., 2010, 130, 163 CrossRef.
- Z. Lian, J. Wang, Y. Lv, S. Wang and Q. Su, The reduction of Eu3+ to Eu2+ in air and luminescence properties of Eu2+ activated ZnO–B2O3–P2O5 glasses, J. Alloys Compd., 2007, 430, 257 CrossRef CAS.
- R. K. Brow, Review: The structure of simple phosphate glasses, J. Non-Cryst. Solids, 2000, 263–264, 1 CrossRef.
- M. Sendova and J. A. Jiménez, Synergistic thermo-Raman and calorimetric kinetic study of the cation (Ca2+, Ba2+, Pb2+) modifier's role in binary metaphosphate glasses, J. Raman Spectrosc., 2018, 49, 1522 CrossRef CAS.
- J. C. Mauro, M. Blodgett, M. L. Johnson, A. J. Vogt and K. F. Kelton, A structural signature of liquid fragility, Nat. Commun., 2014, 5, 4616 CrossRef.
- Q. Zheng, Y. Zhang, M. Montazerian, O. Gulbiten, J. C. Mauro, E. D. Zanotto and Y. Yue, Understanding glass through differential scanning calorimetry, Chem. Rev., 2019, 119, 7848 CrossRef CAS PubMed.
| This journal is © The Royal Society of Chemistry 2022 |

