
 Open Access Article
 This Open Access Article is licensed under a Creative Commons Attribution-Non Commercial 3.0 Unported Licence
Combining standard addition and isotope dilution in order to improve SI traceable LA-ICP-MS measurements†
Lena
Michaliszyn
 *,
Axel
Pramann
,
Anita
Röthke
and
Olaf
Rienitz
*,
Axel
Pramann
,
Anita
Röthke
and
Olaf
Rienitz
Physikalisch-Technische Bundesanstalt (PTB), Bundesallee 100, 38116 Braunschweig, Germany. E-mail: lena.michaliszyn@ptb.de
First published on 30th September 2022
Abstract
Laser ablation (LA) combined with inductively coupled plasma mass spectrometry (ICP-MS) is a common method for analysing non-matrix elements in solid samples directly. Although LA was significantly improved over the last years, SI traceable quantification is still challenging. Therefore, LA-ICP-MS was combined with isotope dilution (ID) in this work. Through the SI traceable solutions and the known reference element content in the sample itself, it is possible to calculate a traceable mass fraction for the analyte element with an uncertainty budget according to the “Guide to the Expression of Uncertainty in Measurements” (GUM). For this new approach, two concentration series – one for the analyte and the other for the reference element – are necessary. These solutions were varied with respect to their isotope ratios. Some instrumental effects like successive clogging of a valve or tube will have a direct influence on the intensity. However, there will be no impact on the measured isotope ratio. The series of solutions have been introduced sequentially into the plasma simultaneously with the ablated material via a y-piece. To show that reliable results can be achieved with the new method, boron was quantified in a glass-based standard reference material (NIST SRM 612). The information value of 32 μg g−1 could be reproduced as (33.3 ± 3.7)![[thin space (1/6-em)]](https://www.rsc.org/images/entities/char_2009.gif) μg g−1 nearly perfectly. Compared with the SI traceable LA-ICP-MS measurement [L. Michaliszyn, T. Ren, A. Röthke and O. Rienitz, J. Anal. At. Spectrom., 2020, 35, 126–135], the result is more accurate and has a lower measurement uncertainty (k = 2).
μg g−1 nearly perfectly. Compared with the SI traceable LA-ICP-MS measurement [L. Michaliszyn, T. Ren, A. Röthke and O. Rienitz, J. Anal. At. Spectrom., 2020, 35, 126–135], the result is more accurate and has a lower measurement uncertainty (k = 2).
1 Introduction
Since the first combination of laser ablation (LA) and inductively coupled plasma (ICP) mass spectrometry (MS) in the 1980s (ref. 1) this technique was further developed and continuously improved over time. LA-ICP-MS made it possible to analyse solid samples directly, without the need of any preparation steps. Because of this, the number of possible sources of error could be reduced.1 Besides this, the main characteristics of this method are fast measurements with high spatial resolution and less sample consumption, simple implementation and excellent detection limits for many elements in the range of ng g−1. Furthermore, matrix effects, especially those caused by organic solvents, could be eliminated.2–4 Different research and industrial5 fields are interested in this technique and the areas of application are wide spread. For example, LA-ICP-MS is used in geology6 and medicine,7,8 and also for provenance analysis9 or forensic science.10Although numerous applications of LA-ICP-MS have been carried out during the last years, it is still challenging to make them quantitative and traceable to the SI (Système international d'unités).11 Due to SI traceability, a measurement result becomes internationally comparable. Additionally, uniformity – the prerequisite for mutual recognition – can be ensured.12,13 Besides internal standardization,14–17 solid certified reference materials (CRMs) can be used to quantify element contents in the sample. To represent the sample as good as possible, it is necessary to use a matrix matched CRM. This becomes difficult, because a suitable CRM is often not commercially available or does not contain the same mass fractions of the elements of interest like the sample does.18,19 A novel method that uses the sample itself as a perfectly matched matrix reference material was published in 2020.20 Here, an element already present in the solid sample with a known mass fraction, has to be chosen as the reference element (R). The ablated material is introduced into the plasma of the ICP-MS simultaneously with a solution. Two series of solutions (one for the analyte (A), the other for the reference (R) element) had to be prepared. The solution i is part of one of these standard (z) series, in which the mass fractions of the respective element vary with i. A linear equation could be derived describing the measurement for both the analyte and the reference element.20
 | (1) |
By dividing the slope (a1) by the y-intercept (a0), eqn (1) can be rearranged yielding an expression for the mass fraction (w) of the element (E) in the solid sample (x) (eqn (2)).20
 | (2) |
Besides the regression parameters the ratio of the mass flows is necessary to calculate wx(E) using eqn (2). Instead of determining the mass flows, this method uses a reference element (R) contained in the solid sample itself with a well-known mass fraction. For R, eqn (2) is rearranged – resulting in an expression for the ratio of the mass flows – and inserted in eqn (2) of the analyte element (A), leading to the final equation (eqn (3)).20 The prerequisites are unchanged plasma conditions and constant mass flows over time as well as the same isotopic pattern in the solid sample and the solutions for the analyte and reference element, respectively.
 | (3) |
In eqn (1), the regression parameters are directly deduced from the measured intensity of the selected isotope (I(jE)). The intensity corresponds, among other things, with the transportation behaviour of the ablated material, the depth of the ablation crater and whether the valves and tubing remain free or become clogged over time.21 For this reason, the presented LA-ICP-MS method (first described in 2020) is expanded by using the concept of isotope dilution (ID) in this work. Isotope dilution is based on the measurement of the isotopic composition of the element of interest, which has to consist of at least two isotopes. By adding an isotopically enriched material to the sample, the isotopic pattern is changed. In most cases, the so-called spike (y) shows an inverted isotopic pattern compared to the standard (z).22 This method is a type of internal standardization, in which the spike isotope acts as the perfect internal standard.23 Because the spike and sample are mixed before any preparation steps like digestion, the impact of the preparation routine is reduced and possible biases can be compensated for.24
For the new method, a blend had to be prepared out of a solution with natural isotopic composition (z) and a spike solution (y). Afterwards, this solution-based blend (bz) and the ablated sample material (x) form some kind of blend (bxz) directly in the sample introduction system of the ICP-MS. The principle of isotope dilution applied to LA-ICP-MS is shown in Fig. 1. To demonstrate the advantages of the new LA-ID-ICP-MS method, boron was chosen as the analyte element, because of its increasing importance for several applications in analytical sciences: the isotopic composition of boron (with reference to the NIST SRM certificate) turned out as a useful “key” tool to observe and understand a lot of geochemical processes,25 like the reconstruction of the past temperature trend in oceans or for provenance determination.26 Furthermore, boron can be used to study the past variations of CO2.27 A central motivation for the investigation of boron is the fact that boron is one of the dominating impurities in the silicon material used for the realization and dissemination of the SI units mole and kilogram.28
 | ||
| Fig. 1 Principle of isotope dilution in a system of two isotopes in combination with laser ablation. The first blend is prepared offline from the reference solution z and the spike solution y, while the second “blend” is formed inside the sample introduction system of the ICP. | ||
2 Equations
This section summarizes the main equations of the new method. A detailed derivation is given in the ESI.†The fundamental assumption for quantitative LA-ICP-MS20 as well as LA-ID-ICP-MS is that the measured intensity of an isotope (jE) of an element (E) corresponds to the flow of analyte ions through the constant k. The flow of analyte ions can be expressed by using the isotope abundance (x), the mass fraction of the element in the sample (w), the mass flow (ṁ), the Avogadro constant (NA) and the molar mass of the element (M). In order to apply eqn (4), the mass flow must be constant over time.
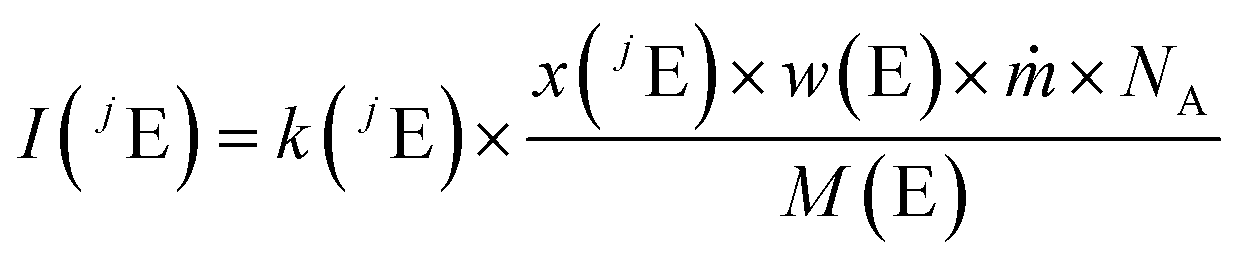 | (4) |
The blend bz was introduced simultaneously with the ablated material into the ICP. Thus, the intensity measured is composed of the intensities from the ablated material (x), the spike (y), and the natural reference (z) solution. Because of the need for several different solutions in one measurement sequence the index i denotes the number of the solution. Since LA-ID-ICP-MS is an isotope ratio method, the intensities of a monitor (2E) and a reference isotope (1E) were needed. If not specified otherwise, the ratio R is defined as R2 = x(2E)/x(1E).
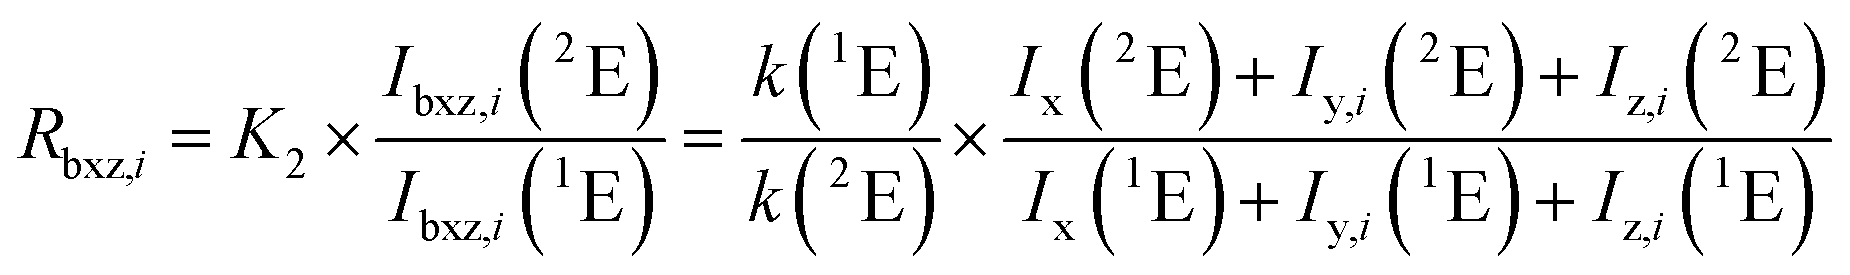 | (5) |
With the prerequisite of the same transportation behaviour and plasma conditions over the whole measurement sequence the constants of proportionality (k(jE)) are reduced to the mass bias correction factor (K). After replacing the intensities in eqn (5) with the expression of eqn (4) and with respect to eqn (6) a new expression is obtained.
 | (6) |
Rearranging the terms yields an equation which represents a linear line with the slope a0 and the y-intercept a1.
 | (7) |
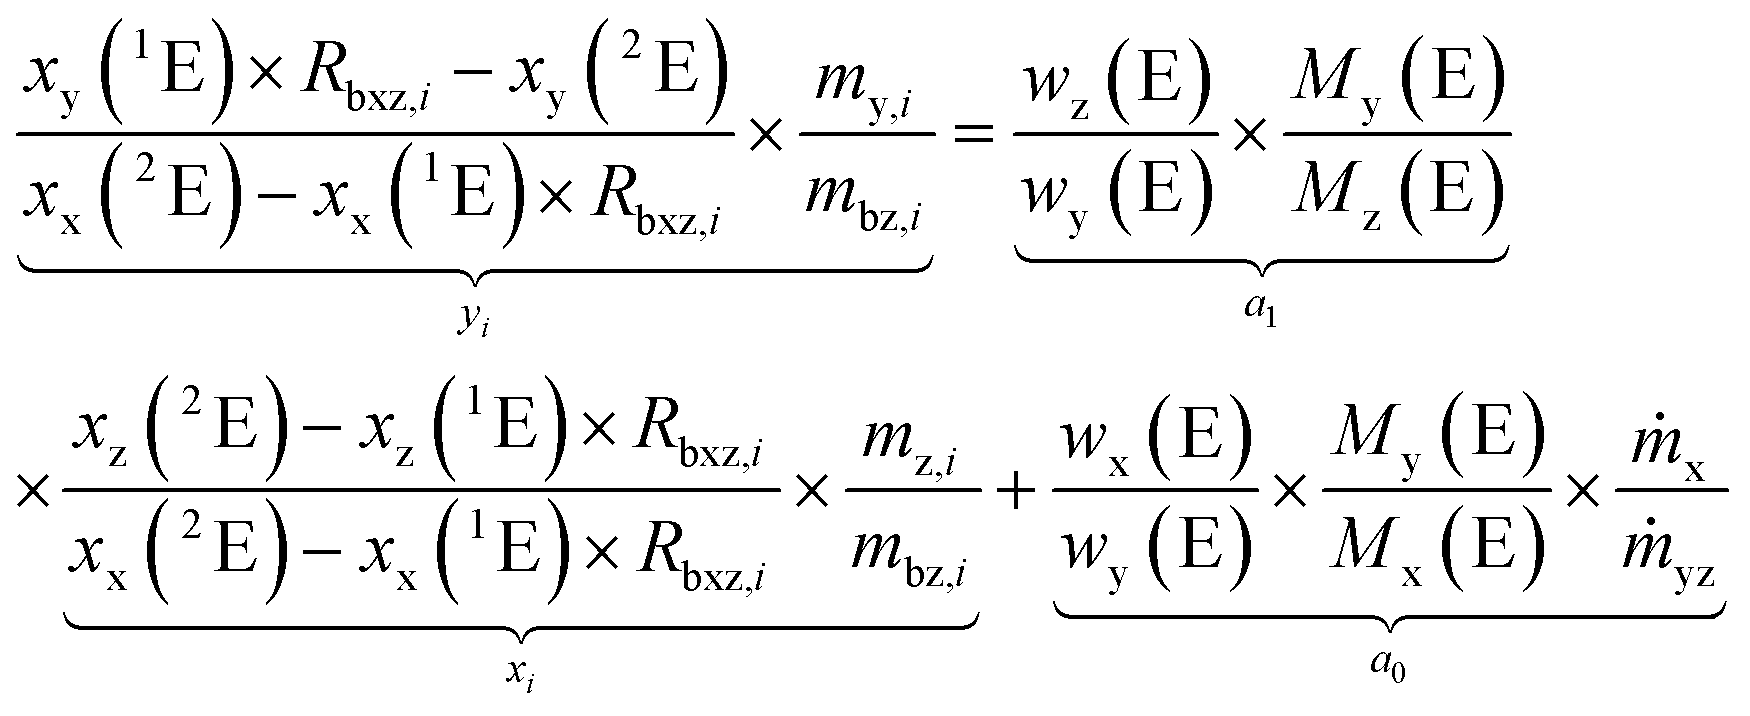
Since the results of an LA-ID-ICP-MS measurement are isotope ratios and not their absolute abundances, the latter have to be replaced by the respective ratios, yielding eqn (8). The total number of isotopes (N) of the considered element is counted by j. Usually j = 1 and j = 2 describe the reference and monitor isotopes, respectively. To conduct a linear regression analysis (eqn (8)), only the parameters to calculate the x- and y-coordinates are necessary. They are either measurement results (R) or the results from the preparation of the solutions (m).
 | (8) |
Eqn (8) is applied two times for one measurement sequence: one time for the analyte element (A) yielding eqn (9) and the other one, to overcome the problem of the unknown mass flows for the reference element (R) with a well known mass fraction in the solid sample itself, yielding eqn (10).
 | (9) |
 | (10) |
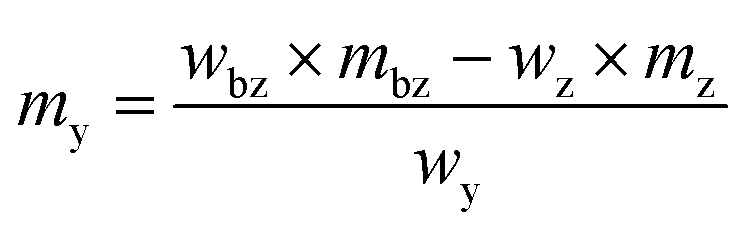
Combining eqn (9) and (10) a final equation (eqn (11)) for the mass content of the analyte element is obtained.
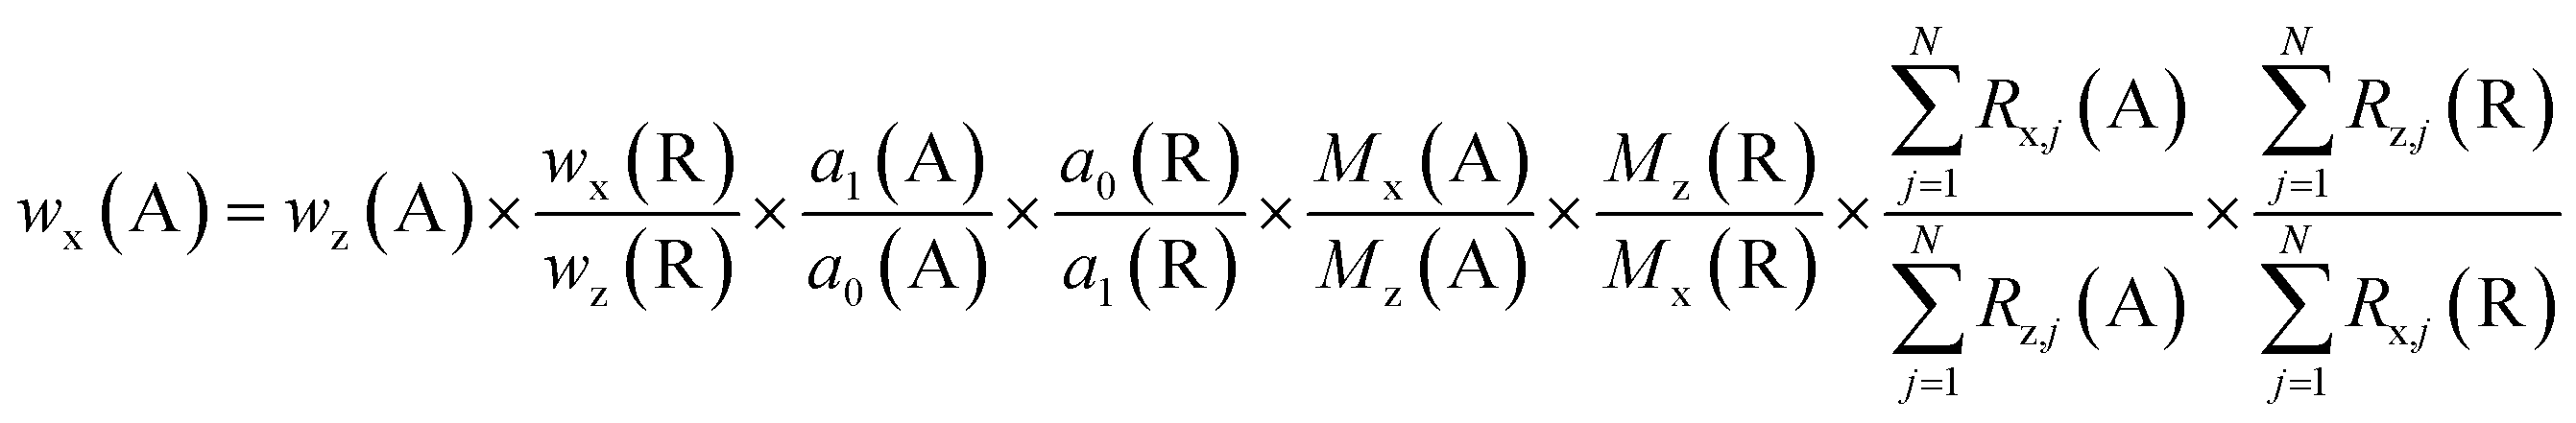 | (11) |
The measurement solutions were prepared from stock solutions with the mass fractions wz and natural isotopic composition. The mass fraction of the reference element in the solid sample (wx(R)) has to be known. In high purity samples the matrix element can be assumed to be 1 g g−1. For other samples or in the case of choosing another element, this mass fraction has to be determined in a separate experiment. The regression parameters a0 and a1 are the results of the evaluation of the measurement results. In cases where the material used to prepare the solution is certified for its isotopic composition, these values can be used for the calculation. In cases where natural isotopic variations are known the isotopic composition has to be determined separately, otherwise it can be taken from ref. 29 and 30.
3 Experimental
The new method was applied to a standard reference material (SRM). Mass fractions of several elements contained in the glass-based NIST SRM 612 were certified or given as information values, like the mass fraction of boron (32 μg g−1).31 For comparison, the established method for SI traceable quantification20 and the new technique were performed separately to determine the boron content in NIST SRM 612.The two methods need a simultaneous introduction of a standard solution and the ablated material. The solutions were part of a concentration series containing five solutions as well as the pure solvent. Because the mass fraction of boron was the measurand of interest, this was used as the analyte element. Silicon acted as the reference element. It was chosen because the SRM consisted of 72% SiO2. Therefore, Si was one of the matrix elements with a homogeneous distribution. The mass fractions of the solutions for the different approaches should be nearly the same with the main difference being that the LA-ID-ICP-MS solutions were mixtures of reference and spike solutions whereas the LA-ICP-MS solutions were made of natural reference solutions only. The intensity determined in the solution with the highest mass fraction should be twice as high as the one from the ablated material. The other mass fractions were evenly distributed between w0 and w5. The mass fractions used are given in Table 1. All solutions were prepared under defined ambient conditions and stored in PFA bottles.
| Series | Unit | i = 0 | i = 1 | i = 2 | i = 3 | i = 4 | i = 5 |
|---|---|---|---|---|---|---|---|
| Silicon | μg g−1 | 0 | 84 | 168 | 252 | 335 | 420 |
| Boron | ng g−1 | 0 | 17 | 34 | 51 | 68 | 85 |
The parameters of ablation, except the carrier gas, and ICP-MS (excluding sample and auxiliary gases) were the same and are summarized in Table 2.
| Ablation | |||
|---|---|---|---|
| Laser | NWR 213 (ESI, USA) | Wavelength | 213 nm |
| Spot size | 80 μm | Distance between two spot centres | 0.12 mm |
| Output energy (pre-ablation) | 10% | Output energy | 80% |
| Repetition rate (pre-ablation) | 10 Hz | Repetition rate | 20 Hz |
| Dwell time (pre-ablation) | 1 s | Dwell time | 25 s |
| Fluence | ≈13 J cm−1 | Carrier gas | 380 mL min−1 to 600 mL min−1 |
| Washout time | 100 s | Warm-up time | 54 s |
| Ablation mode | Single spot | ||
| ICP-MS | |||
|---|---|---|---|
| ICP-MS | Element XR (Thermo Fisher Scientific, Germany) | Rf power | 1160 W |
| Sampler and skimmer cone | Nickel (H skimmer) | Isotopes | 10B, 11B, 28Si, 29Si, 30Si |
| Cool gas | 16 L min−1 | Take-up | 70 s |
| Sample gas | 0.92 L min−1 to 0.99 L min−1 | Auxiliary gas | 0.80 L min−1 to 1.05 L min−1 |
| Detector mode | Counting (B), analogue (Si) | Mass resolution | 4000 (Medium) |
| Nebulizer flow rate | 100 μL min−1 | ||
The order of the single measurements in each sequence was the same and is shown in Fig. 2. Both sequences started with the reference element. At the first (LA-ICP-MS) and third (LA-ID-ICP-MS) measurements, respectively, only the solvent was analysed together with the gas flows to determine the blank. After measuring each solution of the reference material together with the ablated material, the row was concluded by a second blank spot. Afterwards the analyte element was analysed in the same way. For both elements this routine was repeated two more times. This procedure included, for the analyte as well as for the reference element, 6 blank measurements and 18 measurements of the ablated material together with a solution (w0…w5), and in the case of the new method, 8 analyses of the solutions used for the blend.
 | ||
| Fig. 2 Schematic of a sequence for an LA-ID-ICP-MS measurement. The 48 inner numbers represent the part of an LA-ICP-MS sequence. With additional measurements at the beginning and end, it is possible to apply the LA-ID-ICP-MS evaluation. | ||
3.1 LA-ICP-MS
For the LA-ICP-MS measurement 0.15 mol kg−1 HNO3 was used as the solvent for all solutions. The simultaneous introduction of a solution and the ablated material was realized by using a y-piece. The boron solutions were based on NIST SRM 951 (ref. 32) in the case of boron and for silicon on a standard Si solution which is traceable to NIST SRM 723e.33First of all, the average over all blank measurements (for each isotope) was calculated and subtracted from each of the other values. For the LA-ICP-MS method only the isotopes 11B and 30Si were analysed. 11B was chosen because of its higher isotopic abundance and the consequently higher intensity, while for silicon the isotope with the lowest natural isotope abundance was used to protect the detector. After the blank correction the averages for each combination of solution and ablated material were determined. Thus, the result of the evaluation of one measurement sequence includes six average intensities for the boron and six for the silicon measurements.
3.2 LA-ID-ICP-MS
The solid standard silicon (69 mg) as well as the solid spike material (58 mg) for the silicon solutions were dissolved in a mixture of 2.4 g 50% HNO3 and 2.8 g 30% HF.34 After dissolution, the highly concentrated solution was topped up with 0.15 mol kg−1 HNO3 to 100 g. For this reason, the solutions for the LA-ID-ICP-MS measurements were made of 0.15 mol kg−1 HNO3, mainly, but also contained a certain amount of HF (0.5% (w/w)). With a pre-measurement the intensities as well as the isotope ratios of both elements were determined. While the intensities of both solutions with the highest mass fraction should generate a signal twice as high as the ablated material, like in LA-ICP-MS, the ratio must be adjusted as well. The mass of the reference and spike solution was calculated viaeqn (12) and (13). In addition to the final ratio that should be measured (Rbxz,i) and the abundance (x) of the respective isotopes in the solid sample, the reference and spike solutions, as well as the mass (mbz,i) and the mass fraction (wbz,i) of the blend bz were necessary. The last two quantities were specified by the user. Last but not least the equivalent mass fraction of the solid sample (weq) is needed. If the solid sample is a solution it would match this mass fraction. The details are given in the ESI.† | (12) |
 | (13) |
Because of the etching effect of HF, the sample introduction system was modified. A home-made y-piece made of PTFE combined with a torch body and injector made of sapphire were used for these measurements. Besides the measurements of the concentration series, it was necessary to analyse the natural (z) and enriched (y) isotopic stock solutions. This was done at the beginning and the end of each sequence. Thereby it was important to use identical gas flows, like for the measurements with the ablated material, to generate the same background signal.
The measurement result for each analysis was one data set consisting of 25 values. Each value represented a recorded mass spectrum. First of all, a blank correction was applied on all values recorded for solutions with ablated material as well as on the z and y solutions. Afterwards the isotope ratios (10B/11B, 29Si/28Si, 30Si/28Si) were calculated for each of the 25 values of each measurement. For the following evaluation the average of each ratio was used. Because of the time the ablated material needs to reach the detector, the average was calculated for the last 21 values of each measurement while the first were discarded.
The two measurements of the reference solutions (z) were used to calculate the K-factor which was required for the mass bias correction of all of the other ratios. These corrected ratios were finally used to determine the regression parameter of a linear line based on eqn (8) (Fig. 3).
 | ||
| Fig. 3 Schematic of the LA-ID-ICP-MS measurement procedure. The spiked standard solutions for the analyte as well as the reference element were introduced one after another together with the ablated material into the ICP-MS. After an evaluation of the resulting data two regression lines result. With the parameters of these equations the mass fraction of the analyte element can be calculated. xi and yi according to eqn (8). | ||
4 Mass fraction of boron in NIST SRM 612
The mass fraction of boron in the glass-based NIST SRM 612 was determined with the LA-ICP-MS method as well as the new LA-ID-ICP-MS approach. The main difference between these two techniques is that LA-ICP-MS uses the intensity of one isotope of the reference and one of the analyte element, whereas LA-ID-ICP-MS utilizes the ratio of two isotopes of each element. Therefore, a comparison of the quantities used is shown in Fig. 4. In the first seconds of detection the material has not reached the detector. After ≈5 s the ablated material ends up at the detector. For ablation a round spot with a diameter of 80 μm was used. Within the 25 s dwell time a decrease in the intensities of both boron isotopes was observed. This is caused by the ablation crater which became deeper and deeper which affected the material transport. The decrease could also be a result of clogging a valve in the instrument for laser ablation. The magnitude of this effect depends on the element under investigation. Russo et al. pointed out a correlation between the vapour phase composition and the boiling point of the elements contained in the sample. Elements with a higher boiling point are more difficult to transfer in the vapour phase than elements with a lower boiling point.35 Therefore, the decreasing effect is more pronounced for elements like boron with higher boiling points (Tb(B) ≈ 4000 °C)36 and evaporation enthalpies (ΔH(B) ≈ 565 kJ mol−1).36Fig. 4 clearly shows the predicted behaviour: the intensities of the boron isotopes decrease significantly within the ablation windows of 25 s while the intensity ratio stays virtually constant after a short stabilisation time. | ||
| Fig. 4 Comparison of the trend of the average of both boron isotopes (blue squares: 10B, green circles: 11B) as well as the corresponding ratio 10B/11B (red triangles) using NIST SRM 612. All data have been normalised to their particular averages with relative standard deviations calculated from three measurements. | ||
Thus, measurements of the isotope ratio are able to generate more constant measurement values with smaller standard uncertainties, especially in the case of elements usually considered difficult to measure using LA-ICP-MS. Effects like the worse material transport out of the crater, affect all isotopes in the same way whereby the ratio is virtually not influenced, resulting in a more robust final result with a lower measurement uncertainty. The measured ratio was corrected by using the K-factor which was determined by measuring a standard solution prepared from NIST SRM 951 with certified isotope abundances of boron. Even though the isotopic composition of boron in NIST SRM 612 is not certified, independent measurements showed δ(11B) close to 1‰ referenced to NIST SRM 951.37–39 This in turn means that the isotopic composition of NIST SRM 612 is virtually equal to that of NIST SRM 951. This was also underpinned by the results of the LA-ID-ICP-MS measurements. Within the range of measurement uncertainty, the certified ratio of NIST SRM 951 and the measured ratio of NIST SRM 612 are indistinguishable, as shown in the ESI† (Fig. 1). For this reason, it was assumed that fractionation by laser ablation for this boron measurement was negligible. Therefore, the K-factor was calculated from the standard solution and applied to the laser ablation data.
As shown in Fig. 2, each solution was measured three times (together with the ablated material) in each measurement sequence and five solutions containing the respective element were used. With the corresponding (xi|yi) pairs a linear regression according to eqn (8) was performed for the analyte and reference element, respectively. The resulting parameters of an LA-ID-ICP-MS measurement and their standard deviation are summarized in Table 3.
| Element | a 0/1 | s(a0)/% | a 1/1 | s(a1)/% |
|---|---|---|---|---|
| Silicon | 3.3 | 1.5 | 30.8 | 0.5 |
| Boron | 3.3 | 5.6 | 52.1 | 1.2 |
Both LA techniques were performed four times. While the equations for the linear regression and the quantity of interest belonging to the new method are given above (eqn (8) and (11)), the description of LA-ICP-MS equations can be found in ref. 20 but the important equations are given in eqn (1) and (3).
The principles for both methods are identical. After the blank and in the case of LA-ID-ICP-MS the mass bias correction the measurement yields the parameters of linear regressions of the analyte (boron) and reference (silicon) elements. Afterwards the obtained values were inserted in the final equation. In the certificate the information value of the mass fraction of boron is given as 32 μg g−1. The final boron content calculated as the mean value of the four LA-ICP-MS and the new LA-ID-ICP-MS measurement is (23.0 ± 4.8) μg g−1 and (33.3 ± 3.7) μg g−1, respectively. A comparison of the calculated mass fractions is given in Fig. 5 and Table 4. Within a measurement sequence, the laser was moved in such a way that an untouched surface could be used for every ablation. But the distance between two ablations spots was quite small. Otherwise, for the next measurement sequence, an untouched area of the sample was chosen. In doing so, the homogeneity of the sample was tested and verified in parallel to the actual measurement, because a homogenous distribution of the analyte and reference element is a precondition for the new method.
 | ||
| Fig. 5 Comparison of the mass fraction obtained from LA-ID-ICP-MS (red circles) and LA-ICP-MS (black squares). Only the LA-ID-ICP-MS data show a good agreement within Uk=2 with the NIST SRM 612 value (solid blue line). | ||
| w x(B) (μg g−1) | U (μg g−1) | U rel (%) | Δ(%) | ||
|---|---|---|---|---|---|
| Information value31 | 32 | ||||
| LA-ICP-MS | 1 | 20.9 | 5.3 | 25 | −34.7 |
| 2 | 25.7 | 4.7 | 18 | −19.4 | |
| 3 | 23.7 | 5.2 | 22 | −25.9 | |
| 4 | 21.7 | 3.8 | 18 | −32.2 | |
| Mean | 23.0 | 4.8 | 21 | −28.1 | |
| LA-ID-ICP-MS | 1 | 33.3 | 2.8 | 8 | 4.1 |
| 2 | 32.5 | 4.7 | 15 | 1.6 | |
| 3 | 31.5 | 4.6 | 14 | −1.6 | |
| 4 | 35.7 | 2.2 | 6 | 11.6 | |
| Mean | 33.3 | 3.7 | 11 | 3.9 |
Both methods lead to results in the same range as the information value. But while LA-ID-ICP-MS yielded mass fractions which overlap with the information value, the result of LA-ICP-MS does not. Even within the range of uncertainty the mass fraction does not overlap with the NIST value. The low mass fraction of LA-ICP-MS is the result of the decreased intensity over time. During the ablation time the crater became deeper which reduced the material transport out of the crater. For the calculation of the mass fraction the regression parameters were used which are directly connected to the measured intensity. If the intensity decreases, a lower mass fraction is obtained. In contrast to this the isotope ratio is not affected by the intensity decrease. This is why the result of LA-ID-ICP-MS is closer to the value given in the certificate. Besides this, the expanded measurement uncertainty is reduced by more than 50% when changing from LA-ICP-MS to LA-ID-ICP-MS, as clearly shown in Fig. 4. The outcome of the more stable isotope ratio over time is a smaller uncertainty of the regression parameters and thus a smaller uncertainty of wx(A).
5 Conclusion
In this work, a new quantitative, SI traceable method for non-matrix elements in solid samples has been presented. For the determination of the mass fraction of non-matrix elements the established LA-ICP-MS method20 was extended by using the concept of isotope dilution. The principle for both techniques is to analyse the ablated material together with two sets of solutions. In the first set of solutions the mass fraction of A is varied, and in the second, the one of R is varied. The particular solution is introduced into the ICP simultaneously with the ablated material. The mass fraction of the reference element in the actual solid sample must be known either from previous measurements or in the case of high purity samples it can be assumed to be 1 g g−1. Usually, 90% of the sum of all impurities of high purity materials (for which the novel method is best suited) is represented by up to three elements. The novel LA-ID-ICP-MS method is intended to be an alternative to methods which are based on dissolving the sample and separating the elements of interest from the matrix and subsequently applying IDMS. In cases where the dominating elements do not interfere with each other, the novel method can be performed in an even more efficient way by summarising all elements of interest in a single set of solutions. Consequently, the novel method helps to save time.The measured solutions containing the standard (z) and spike (y) yield together with the ablated material (x) different isotope ratios of the analyte (A) and reference (R) elements. From these ratios, the mass fraction of A in the original sample can be calculated by applying the novel approach.
In this work the method was demonstrated using the boron content in the glass-based material NIST SRM 612 as an example. In a direct comparison with the LA-ICP-MS method the new approach yields results with lower expanded measurement uncertainties (k = 2) which are quite close to the information value31 of the material. In contrast, the mass fraction determined without isotope dilution does not show an overlap with the information value. According to that, the combination of LA-ICP-MS with isotope dilution is a suitable method to analyse non-matrix elements in solid samples directly.
Conflicts of interest
There are no conflicts to declare.Acknowledgements
This project (20IND01 MetroCycleEU) has received funding from the EMPIR programme co-financed by the Participating States and from the European Union's Horizon 2020 Research and Innovation Programme. Furthermore, the authors would like to thank Carola Pape for her support during the solution preparation.Notes and references
- A. L. Gray, Analyst, 1985, 110, 551 RSC.
- N. Vorapalawut, P. Pohl, B. Bouyssiere, J. Shiowatana and R. Lobinski, J. Anal. At. Spectrom., 2011, 26, 618–622 RSC.
- J. S. Becker, Spectrochim. Acta, Part B, 2002, 57, 1805–1820 CrossRef.
- D. Günther, Anal. Bioanal. Chem., 2001, 372, 31–32 CrossRef.
- J. Pisonero and D. Günther, Mass Spectrom. Rev., 2008, 27, 609–623 CrossRef CAS.
- D. Günther and B. Hattendorf, TrAC, Trends Anal. Chem., 2005, 24, 255–265 CrossRef.
- M. Resano, M. Aramendía, L. Rello, M. L. Calvo, S. Bérail and C. Pécheyran, J. Anal. At. Spectrom., 2013, 28, 98–106 RSC.
- O. B. Bauer, C. Köppen, M. Sperling, H.-J. Schurek, G. Ciarimboli and U. Karst, Anal. Chem., 2018, 90, 7033–7039 CrossRef CAS PubMed.
- M. Bertini, A. Izmer, F. Vanhaecke and E. M. Krupp, J. Anal. At. Spectrom., 2013, 28, 77–91 RSC.
- I. Deconinck, C. Latkoczy, D. Günther, F. Govaert and F. Vanhaecke, J. Anal. At. Spectrom., 2006, 21, 279 RSC.
- D. Pozebon, G. L. Scheffler, V. L. Dressler and M. A. G. Nunes, J. Anal. At. Spectrom., 2014, 29, 2204–2228 RSC.
- R. Stosch, O. Rienitz, A. Pramann and B. Güttler, Chem. Unserer Zeit, 2019, 53, 256–262 CrossRef CAS.
- M. Buzoianu and H. Y. Aboul-Enein, Accredit. Qual. Assur., 1997, 2, 11–17 CrossRef.
- D. Hare, C. Austin and P. Doble, Analyst, 2012, 137, 1527 RSC.
- K. G. Heumann, S. F. Boulyga and M. Tibi, Anal. Bioanal. Chem., 2004, 378, 342–347 CrossRef PubMed.
- H. P. Longerich, D. Günther and S. E. Jackson, Anal. Bioanal. Chem., 1996, 355, 538–542 CrossRef PubMed.
- P. Phukphatthanachai, J. Vogl, H. Traub, N. Jakubowski and U. Panne, J. Anal. At. Spectrom., 2018, 33, 1506–1517 RSC.
- D. Günther, R. Frischknecht, H.-J. Müschenborn and C. A. Heinrich, Fresenius' J. Anal. Chem., 1997, 359, 390–393 CrossRef.
- R. Russo, Talanta, 2002, 57, 425–451 CrossRef PubMed.
- L. Michaliszyn, T. Ren, A. Röthke and O. Rienitz, J. Anal. At. Spectrom., 2020, 35, 126–135 RSC.
- M. Guillong and D. Günther, J. Anal. At. Spectrom., 2002, 17, 831–837 RSC.
- G. Mana, O. Rienitz and A. Pramann, Metrologia, 2010, 47, 460–463 CrossRef.
- K. G. Heumann, Mass Spectrom. Rev., 1992, 11, 41–67 CrossRef.
- Guidelines for Achieving High Accuracy in Isotope Dilution Mass Spectrometry (IDMS), ed. M. Sargent, R. Harte and C. Harrington, Royal Society of Chemistry, 2007, pp. 1–34 Search PubMed.
- J. Míková, J. Košler and M. Wiedenbeck, J. Anal. At. Spectrom., 2014, 29, 903–914 RSC.
- X. Liao, Z. Hu, W. Zhang, Y. Feng, T. Luo, Z. Wang, M. Li, K. Zong, Y. Liu and S. Hu, Anal. Chem., 2022, 94, 1286–1293 CrossRef PubMed.
- C. D. Standish, T. B. Chalk, T. L. Babila, J. A. Milton, M. R. Palmer and G. L. Foster, Rapid Commun. Mass Spectrom., 2019, 33, 959–968 CrossRef PubMed.
- S. Zakel, S. Wundrack, H. Niemann, O. Rienitz and D. Schiel, Metrologia, 2011, 48, S14–S19 CrossRef.
- J. R. de Laeter, J. K. Böhlke, P. D. Bièvre, H. Hidaka, H. S. Peiser, K. J. R. Rosman and P. D. P. Taylor, Pure Appl. Chem., 2003, 75, 683–800 Search PubMed.
- M. Wang, W. Huang, F. Kondev, G. Audi and S. Naimi, Chin. Phys. C, 2021, 45, 030003 CrossRef.
- NIST, Certificate of Analysis – SRM 612, 2012 Search PubMed.
- NIST, Certificate of Analysis – SRM 951, 1999 Search PubMed.
- Merck KGaA, Certificate of Analysis, Si Standard Solution 1.123210.0500, 2018 Search PubMed.
- A. Rietig, T. Langner and J. Acker, Phys. Chem. Chem. Phys., 2019, 21, 22002–22013 RSC.
- R. E. Russo, X. Mao and S. S. Mao, Anal. Chem., 2002, 70–77 CrossRef.
- Handbook of Chemistry and Physics, ed. D. R. Lide, CRC Press, 88th edn, 2007 Search PubMed.
- S. Kasemann, A. Meixner, A. Rocholl, T. Vennemann, M. Rosner, A. K. Schmitt and M. Wiedenbeck, Geostand. Newsl., 2001, 25, 405–416 CrossRef.
- W. A. Brand, T. B. Coplen, J. Vogl, M. Rosner and T. Prohaska, Pure Appl. Chem., 2014, 86, 425–467 Search PubMed.
- P. J. le Roux, S. B. Shirey, L. Benton, E. H. Hauri and T. D. Mock, Chem. Geol., 2004, 203, 123–138 CrossRef.
Footnote |
| † Electronic supplementary information (ESI) available. See https://doi.org/10.1039/d2ja00243d |
| This journal is © The Royal Society of Chemistry 2022 |