 Open Access Article
Creative Commons Attribution 3.0 Unported Licence
Development of the 3He mass spectrometric low-level tritium analytical facility at the IAEA
Jennifer
Mabry
 *a,
Nicolo
Romeo
a,
Gerhard
Kainz
a,
Lorenzo
Copia
a,
Harue
Masuda
b and
Takuya
Matsumoto
a
aIsotope Hydrology Laboratory, The International Atomic Energy Agency, Vienna, Austria. E-mail: j.mabry@iaea.org
bDepartment of Biology and Geosciences, Osaka City University, Japan
First published on 28th October 2022
Abstract
Here we present a mass spectrometric system specifically developed for the analysis of ultra-low-level tritium by the 3He ingrowth method. The system was designed and developed in the Isotope Hydrology Laboratory of the International Atomic Energy Agency and consists of an off-line water degassing unit to remove pre-existing 3He from sample water and a mass spectrometer system (Thermo Fisher Helix SFT) with a gas purification and separation system. The mass spectrometer system is equipped with a gas pipette system that inlets calibrated amounts of 3He (99.995% 3He spike) to accurately calibrate the mass spectrometer's sensitivity. The procedural blank level of 3He in our system is extremely low and on the order of 10−17 cm3 STP, which enables us to quantify tritium in water samples (100 cm3) as low as 0.05 TU with an ingrowth time of 2 months. Quantification of even lower tritium levels are possible by loading more water and/or by increasing the ingrowth time (e.g., 0.01 TU with 400 cm3 water stored for 4 months). We analysed a set of water samples from the Tritium Intercomparison Exercise by IAEA (TRIC 2018) and confirmed that our data were consistent with the expected values. We have also confirmed that our analysis of natural groundwater samples agree well with the data obtained by the conventional liquid scintillation counting (LSC) method.
1. Introduction
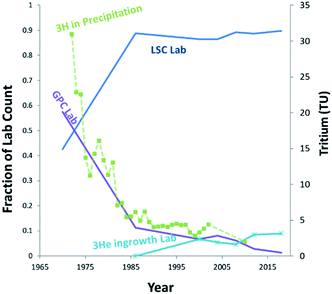
Tritium (3H) is present in the environment as a result of both natural and anthropic sources. Natural tritium levels in precipitation and surface waters, as determined from early (pre-nuclear) measurements and from polar ice cores, were quite low, not exceeding 10 to 20 (TU) (1 tritium unit = a T/H ratio of 10−18).2 This was owing to its low natural production, modulated by cosmic radiation in the upper atmosphere, and to its relatively short half-life of 4500 days.1 In the nineteen-fifties and early nineteen-sixties, however, this low background has increased by a factor of one thousand due to the release of tritium in considerable amounts by the atmospheric tests of nuclear weapons.3 Tritium is also released in various amounts by industrial activities, including the nuclear industry, nuclear weapons production facilities, and the luminous compounds industry.4 Although these tritium sources may be significant locally, at the global scale, tritium has reached steady state levels, with present-day content in precipitation usually below or near the detection limit of conventional liquid scintillation counting (LSC) systems.5–7The so-called 3He ingrowth method was first described in Clarke et al.,8 and is an alternative method of measuring tritium based on the detection of its radioactive daughter 3He by mass spectrometry. This method has been further developed over the last three decades and is now extensively used for routine measurements of very low to ultra-low levels of tritium (in the range 1–0.1 TU) in oceanography and hydrology.9–12 The principle of the method is to remove the 3He initially dissolved in the water sample by degassing under vacuum, then to store it in a closed container to allow for the accumulation of tritiogenic 3He. The tritium content of the sample is subsequently deduced from the mass spectrometric determination of the amount of 3He produced during the storage period. Since 3He is sparingly soluble in organic compounds and readily enters the gas phase, the technique is adaptable to analysis of Organically-Bound-Tritium (OBT) in a wide variety of sample matrices, such as animal tissues, vegetation, and soil.13 In fact, following the globally declining tritium levels, the ingrowth technique has gradually increased its share in the tritium analysis community for hydrological applications, while the labs using conventional gas proportional counter (GPC) have dramatically declined over the last 25 years (Fig. 1). Meanwhile it has become essential to pre-enrich tritium using a dedicated enrichment system for LSC analysis, requiring additional time and up to 2 L of sample water.14 Thus, 3He mass spectrometry should continue to be a promising option for environmental tritium studies and monitoring in coming decades.
The Isotope Hydrology Laboratory (IHL) of the IAEA has been supporting its Member States' water resource management with groundwater age dating by the T–3He method15–20 and by the 4He method.21–23 IHL also houses state-of-the-art analytical equipment for the collection and measurement of tritium from water and hydrological samples by using conventional liquid scintillation counting after enriching samples' tritium levels by electrolysis24 and utilizes it for global programmes Global Network on Isotopes in Precipitation/Rivers (GNIP/GNIR),5 for coordinated research projects (CRPs), ground water age dating, and for global isotope laboratory proficiency testing. In order to ensure that the IAEA is able to provide its Member States with access to and training in the state-of-the-art equipment for environmental tritium analysis for the next decades, we expanded our analytical capability in low-level tritium by developing an integrated tritium analytical system with the 3He ingrowth method. The design target of our system is to analyse low tritium level (∼0.1 TU) in water samples of about 100 cm3 with a maximum of a few months of accumulation time. This design is intended to complement enrichment methods by attaining a lower detection limit with less sample water needed while not increasing the total time excessively. The aim of this contribution is to provide technical details of the new analytical system and its overall performance.
2. Method
2.1 Principle
The ingrowth method involves several phases. First, the collected water sample must be degassed to remove all pre-existing helium isotopes, then the sample must be stored for a time (typically 1–3 months) while 3He accumulates (ingrowth), and then finally the sample can be analysed. Helium ingrowth comes with some advantages over traditional direct counting methods, as helium mass spectrometry is capable of measuring ultra-trace quantities of 3He, thus allowing low-abundance tritium determination without high levels of enrichment, which need large quantities of water.2.2 Sample handling and ingrowth
Water samples are collected using plastic bottles as done for other forms of tritium analysis. No special storage or treatment is necessary at this stage since the water will be completely degassed and no chemical analysis will be performed.The first phase of tritium analysis in water by the 3He ingrowth method is to fully degas the sample of all helium already in the water. This helium can have multiple different sources depending on where the sample was collected, including from tritium decay and dissolved air. Completion of degassing marks the start of the ingrowth period and 3He will begin to accumulate as tritium decays.
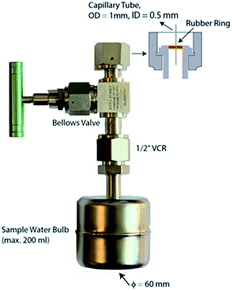
Since the sample will need to be stored for up to a few months during this accumulation phase, it is important to use a sample container which is of suitable volume, is helium leak tight over the entire 3He ingrowth period, and ready to connect to a high vacuum line. We are using 200 cm3 volume stainless steel bulbs with a small magnet inside for stirring during degassing, and an all-metal high vacuum valve (FITOK SWS-FFR8-5) with a ½” VCR fitting and a 0.5 mm inner diameter capillary tube at the exit port (Fig. 2).
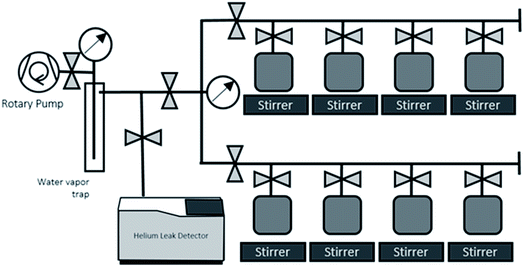
The sample containers are thoroughly dried by evacuating and baking (100C), leak checked, and weighed before putting sample water in. Each sample container with water sample is weighed to determine the weight of water sample before the gas extraction, then attached to the dedicated water degassing unit (Fig. 3). This degassing unit consists of eight sample connection ports for parallel processing of multiple samples, a flow-through water vapour trap cooled by liquid nitrogen, and a rotary vane pump (Edwards 5; 5 m3 h−1 pumping speed) (Fig. 3). The principle behind the gas extraction is that in a vacuum system the dissolved gases are transferred into the sample container's headspace. The vacuum pump and liquid nitrogen-cooled water vapour trap continuously remove the dissolved gases and water vapor from the container's head space, so that the dissolved gases are continuously removed from water. The capillary tube at the container's exit maintains the water vapour stream that drag gas to the pump. This capillary also limits the water vapor flow going out from and coming back to the water bulbs, thus is also to prevent significant water loss and cross contamination of samples during the extraction process.
For the degassing process, the sample valves are opened, exposing the water and headspace to the rough pump, and a magnetic stirrer is turned on for 1–2 hours. After degassing, the sample valves are closed, and the date and time are recorded as the starting point of the 3He ingrowth. The sample container is weighed again to define the starting amount of the degassed water sample (W0). We verified the soundness of this processes by measuring with the mass spectrometer a set of control water standards we created with known tritium content directly after degassing and found no detectable helium. By measuring immediately after degassing, there is no time for ingrowth 3He to accumulate so any detected helium would come from incomplete degassing.
2.3 Sample preparation line and mass spectrometry
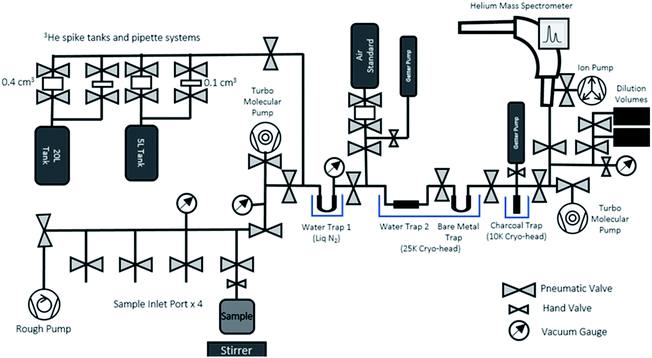
After the end of the ingrowth period, the ingrown 3He can be degassed from the sample water, purified, and measured in the 3He analytical system dedicated to ingrowth tritium analysis (Fig. 4). The system consists of an online sample degassing section directly connected to the gas purification and separation section, and a noble gas mass spectrometer (Thermo Fisher Helix SFT) operated under static vacuum. The system is also equipped with a standard gas pipetting system to deliver controlled amounts of pure-3He to determine the mass spectrometer helium sensitivities. Note that the whole sample processing for the mass spectrometric analysis should be made under static vacuum, without active vacuum pumping, and that the gases released from the sample container should be transferred and purified while preserving the whole helium content for the mass spectrometric analysis. Having the entire system under very good vacuum (<10−8 mbar) before accepting sample gas is essential to minimize the procedural and instrumental baseline of helium isotopes.The degassing section has four ports to connect the sample containers (Fig. 4) after the ingrowth period. As the sample containers' headspace has been kept under vacuum after the initial degassing, the majority of 3He produced by tritium decay should have been transferred and accumulated in the headspace. To ensure a complete removal of the 3He remaining in water, we agitate the sample with a stirrer and use the water vapour flow to Water Trap 1 (a bare metal U-shape trap held at liquid N2 temperature) to transfer the helium to the separation and purification section. The separation and purification system is a dual cryo-head system composed of three separate traps (Janis Research CCS-Double-Trap). There is a tube-shaped water trap (Water Trap 2) and a U-shaped trap (Bare Metal Trap) that are both cooled by the 25 K cryo-head. Following that is charcoal trap cooled by a 10 K cryo-head. All traps have dedicated heaters and controllers for precise temperature control.
The actual sample processing and analysis protocol is as follows:
(1) Open one sample container valve exposing gases in container headspace and dissolved in water to a Water Trap 1 and turn on magnetic stirrer for 20 minutes. Then close the sample container.
(2) Further purify gas with the Water Trap 2 and the 25 K cryogenic trap + getter for any remaining reactive gases or heavy noble gases.
(3) Trap all helium (and any neon) on the 10 K charcoal trap to maximize the sensitivity of the measurement (maximize analyte gas volume).
(4) Release pure helium fraction from the cryogenic trap at 40 K and measure in the mass spectrometer.
One full purification and measurement cycle takes about 1.5 hours. The system is fully automated beyond the manual sample valve. Actual sample analysis consists of multiple cycles of gas inlets typically with: (1) 2 to 3 procedural blanks measured at the beginning, middle, and end of the analysis sequence, (2) multiple helium gas standards from the gas pipette system for calibration of the sensitivity and to monitor signal drift during the run and the long term, (3) sample inlets (single sample measured twice, with the second measurement to confirm complete degassing of 3He from the sample), and (4) a control water standard with known tritium. Procedural blanks are run in exactly the same way as a sample, just without opening any of the sample inlet valves, to determine background levels and in order to make sure that we have no residual or cross-contamination between samples. The control water standards were prepared and degassed the same as any other water standard, simply using water with a known tritium content.
Note that our mass spectrometer and sample processing system was designed and installed exclusively for ingrowth analysis, and we are avoiding inletting a large amount of helium or unpurified gases into the mass spectrometer. This contributes to keeping the instrumental background of 3He significantly low and on an order of 10−17 cm3 STP of 3He. This is roughly 50 times lower than the helium mass spectrometer of the same model in our lab which is being used for measuring all noble gases from natural groundwater samples.
2.4 Calibration of the internal standard (3He spikes and water standards)
We have chosen the amount of gas in our calibration standard pipettes according to the target size of 3He defined from the procedural 3He background and expected amount of 3He in our sample sizes (see Section 3.2 for details). In general, helium measurements by a mass spectrometer are calibrated by analysing a known amount of air, however, the sensitivities of different helium isotopes are known to depend on the pressure in the ion source.25,26 Note that 4He signals in the ingrowth tritium sample are typically close to the blank level of 0.5 fA, indicating that nearly 100% of helium in the mass spectrometer during the analysis is 3He. This means that, if we use an air standard and inlet an aliquot of air with 3He comparable to that from the sample, the total pressure of the mass spectrometer becomes 106 times larger than the case of the helium analysis for ingrowth samples, suggesting that the accurate calibration of the 3He sensitivity is not possible if air is used as a running standard. Therefore, we employed a pure 3He spike gas (Merck/Sigma-Aldrich) with a purity level of 99.95 atom%, 99.995% (chemical purity) as our running standard to calibrate the mass spectrometer's sensitivity for the ingrowth samples. There is no detectable amount of 4He in the spike gas.We have prepared two separate standard gas reservoirs in our system (5 L and 20 L tanks), and each has two automatic pipetting systems composed of a pair of modified pneumatic valves that delivers a fixed amount of standard gas from the tanks (0.4 cm3 or 0.1 cm3) (Fig. 4). We calculated the desired 3He pressure of each tank (in a range of 10−6 mbar) by using a Baratron manometer and volume dilution, but the amounts of 3He in each pipette volume should be accurately and precisely determined, as pressure readouts at this level with our pressure sensors (Penning gauge) are not accurate enough to calibrate the amount of 3He in the tanks which will be used to calibrate the sensitivity the mass spectrometer.
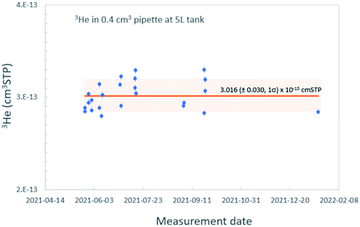
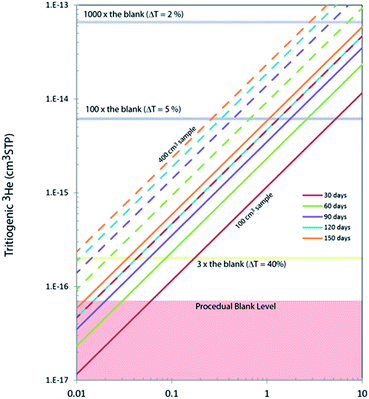
In order to accurately calibrate the amount of 3He in those pipettes, we have prepared an additional set of running standards which are water samples with known amounts of tritium (500, 240, and 120 TU) carefully prepared by gravimetric dilution from NIST SRM 4361C and values confirmed by direct counting results from the Liquid Scintillation Counter in our lab. These water standard samples were processed and stored as described above, and the tritiogenic 3He produced in these samples are measured by the mass spectrometer and compared with the theoretically expected amount of tritiogenic 3He over the given storage time to estimate the sensitivity of the mass spectrometer for 3He. Fig. 5 shows the results of the calibration to determine the 3He contents in the 0.4 cm3 pipette of the 5 L tank. In order to avoid the temporal drift in 3He sensitivity of the mass spectrometer, we used measurements of water standards and the pipetted 3He gases made within 2 or 3 days to calculate amount of 3He in the pipette. Table 1 gives amounts of 3He in the pipette systems with uncertainties. These cover the range from 5 × 10⁻¹⁵ to 3 × 10⁻¹³ cm3 STP. The smallest pipette gives 3He equivalent to a 100 cm3 of water sample with 2 TU for 2 months of storage time (Fig. 6).
| Pipette name | 3He (cm3 STP) |
|---|---|
| 5 L tank | |
| 0.1 cm3 pipette | (9.50 ± 0.03) × 10−14 |
| 0.4 cm3 pipette | (3.01 ± 0.03) × 10−13 |
![[thin space (1/6-em)]](https://www.rsc.org/images/entities/char_2009.gif) |
|
| 20 L tank | |
| 0.1 cm3 pipette | (5.87 ± 0.20) × 10−15 |
| 0.4 cm3 pipette | (2.32 ± 0.07) × 10−14 |
3. Data validation
3.1 Data processing
The first step after fitting the raw measurement data is to correct for the blank if necessary. Blanks of the system are low (3He ∼ 7 × 10⁻¹⁷ cm3 STP, 4He ∼ 1 × 10⁻¹¹ cm3 STP) and are typically negligible but are subtracted if necessary for very low abundance measurements. During the mass spectrometric analysis, we always measure 4He in a sample to verify the integrity of the degassing and storage. Typically, 4He signals in the tritium measurement are in the range of 0–25 fA (up to ∼8 × 10⁻¹⁰ cm3 STP) which are very close to the blank level. We assume that any 4He signals from samples higher than the blank is either due to the incomplete degassing of helium during the initial gas extraction before sample storage, or the air leaked into the container during storage. In either case, a correction is made to subtract 3He associated with the incomplete degassing or air contamination by assuming atmospheric 3He/4He for the additional 4He observed in samples. When there is significant 4He in the sample that cannot be explained and corrected, then we discard that sample and measure the duplicate.Next, the 3He concentrations are subjected to a linearity correction with a slope (sensitivity change vs. absolute 3He signal) determined from measurement of a set of tritiated water standards with a range of tritium contents from 0.5 to 500 TU. The linearity varies about 12% over the approximately 4 orders of magnitude in range of 3He signals. After the correction is applied, generic errors are assigned of 5% of the correction for measurements less than 1 × 10⁻¹⁴ cm3 STP 3He and 1% for measurements greater than this value.
After calibration and all corrections are applied to the data, the tritiogenic 3He is used to calculate, first, the amount of tritium at the start of the ingrowth period using the dates of measurement and degassing as well as the water weight:
Finally, the tritium concentration can be determined at the time of sampling with a simple decay calculation:
| ctrit(sampling) = ctrit(degas)·eλ(ts − te) |
3.2 Uncertainties and data quality
In general, the lower the tritium abundance of a sample, either a longer storage time, or a greater water volume is needed to reach a similar data quality as for high tritium samples. Amounts of tritiogenic 3He in 100 cm3 and 400 cm3 of water accumulated over different storage time are shown in Fig. 6. A typical level of the procedural blank level of our system is about 7 × 10⁻¹⁷ cm3 STP of 3He. The ratio of the 3He signal from the sample and the blank directly affects the uncertainties propagated to the final tritium results. For example, if the signal from tritiogenic 3He is only three times higher the blank, final tritium results would have about 20% uncertainty. In contrast, it is possible to quantify tritium in water with a few % uncertainty if samples are stored long enough to have about 10−14 cm3 STP of 3He (more than 100 times the blank). For our routine tritium analysis, we target the 3He signals to be between 10−15 to 10−13 cm3 STP by adjusting the storage time and the size of samples.Contributions to the total uncertainty come from measurement error of the sample and the running standard and the uncertainties associated with the calibration, linearity, and blank corrections. The standard measurement error for our run settings (25 acquisitions of 33 s integration time each) is typically about 0.5%, rising to a range of 1 to 3% for very low abundance measurements. The uncertainty of the calibration and linearity correction is about 1% for high abundance samples, rising to 5% for low abundance samples. As mentioned above, the blank correction is typically negligible, but in cases of very low abundance measurements can become significant and thus also contribute to the overall uncertainty. The contribution to uncertainties from the blank correction varies from being negligible up to 2% at the lower end of our target measurement range. As can be seen in Table 2, we measured sample T31 twice, once with an ingrowth time of 35 days, and once with an ingrowth time of about 72 days. The uncertainty was reduced by about half for the doubled ingrowth time.
| TRIC sample ID | Water weight (g) | Tritiogenic 3He (×10−15 cm3 STP) | Days from reference time | Storage days | Tritium contents at degassing (TU) | Tritium contents at reference time (TU) | Reference tritium contents (TU) | Evaluation | ||||
|---|---|---|---|---|---|---|---|---|---|---|---|---|
| W 0 | W | t s − te | t e − tm | D | D% | z-Test | ζ-Test | |||||
| a T31 was measured twice with different storage days. | ||||||||||||
| T28 | 0.04 ± 0.04 | 0 | ||||||||||
| T29 | 100.12 | 99.87 | 1.29 ± 0.16 | 1283 | 77 | 0.44 ± 0.11 | 0.54 ± 0.13 | 0.50 ± 0.00 | 0.04 | 8.13 | 0.41 | 0.58 |
| T30 | 97.31 | 97.07 | 4.14 ± 0.41 | 1286 | 71 | 1.57 ± 0.31 | 1.91 ± 0.38 | 2.00 ± 0.01 | −0.09 | −4.54 | −0.91 | −0.48 |
| T31 | 95.87 | 95.6 | 7.29 ± 0.60 | 1322 | 35 | 5.71 ± 0.94 | 7.00 ± 1.15 | 7.01 ± 0.03 | −0.01 | −0.09 | −0.03 | −0.01 |
| T31a | 95.6 | 95.24 | 15.1 ± 0.60 | 1357 | 72 | 5.76 ± 0.20 | 7.10 ± 0.53 | 7.01 ± 0.03 | 0.09 | 1.35 | 0.45 | 0.35 |
3.3 TRIC 2018 samples
In order validate the overall workflow of the tritium analysis by the 3He ingrowth method, we analysed four reference samples prepared for the TRIC2018 (T28, T29, T30 and T31) – the tritium intercomparison exercise organized by the IHL.14 We used the sample containers and extraction devices as described above and performed an initial degassing for samples of about 100 cm3. The ingrowth 3He are measured after 35 to 77 days of storage time and calibrated against the system's 3He pipette. Corrections were made for the procedural blanks, residual/leaked-in 3He, and a minor linearity correction on the absolute sensitivity of the mass spectrometer. These results are summarized in Table 2.The measured value for T28 is below the detection limit of 0.05 TU, confirming the assumption of tritium-free water of this test sample. T29, T30 and T31 were evaluated using the same criteria of individual reports for TRIC2018 with a fully satisfactory outcome.14 The percentage difference between the results and the assigned values (D%) in conjunction with the obtain z-scores, showed an accuracy fit for the purpose of hydrological applications and ground water dating; moreover, ζ-scores showed very good agreement with the assigned values within the claimed uncertainties, confirming the validity of the uncertainty estimation of this analytical procedure. Overall, our analytical procedure developed here to produce statistically acceptable results from 100 cm3 of water samples with 0 to 7 TU.
3.4 Comparison of natural groundwater samples measured by decay counting and by the ingrowth method
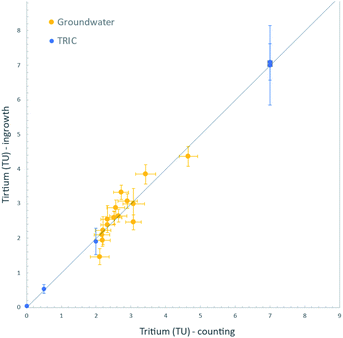
Finally, we analysed a set of natural groundwater samples collected in 2015 from Fukushima Prefecture, Japan, for tritium content both by decay counting and by the 3He ingrowth method. These groundwater samples were collected from wells scattered within an area of about 100 km2 on the western side of the Fukushima Dai-ichi Nuclear Power Station. Hydrogeologic implications of the measured tritium concentrations will be discussed elsewhere; however, we note here that the range of tritium contents (2 to 5 TU) found using our 3He ingrowth system is generally indistinguishable from the precipitation level of the surrounding areas before the accident.27 This is also consistent with their 30 to 60 years of residence times in aquifers as dated by the CFC method.28,29For the ingrowth analysis, we used samples of about 100 cm3 of distilled groundwater and stored them for 3 to 7 months. The ingrown 3He was measured by the mass spectrometer and corrections applied for the instrumental background and sensitivity, including its linearity as described above. For the measured tritium concentration range, the ingrowth method yields the data with propagated uncertainties of between 0.07 and 0.14 TU (1σ). For decay counting, sample of about 500 cm3 were distilled and processed for tritium enrichment by electrolysis, then measured by the liquid scintillation counter. The results of analyses by these two methods are shown in Fig. 7. The ingrowth analysis indeed yielded tritium concentrations consistent with the decay counting results. This is additional confirmation that we have developed the ingrowth method that is a reliable option for low-level tritium analyses in the IHL of the IAEA. Further improvement of the data quality is possible by using increased amount of water or by increasing the storage time, as discussed above.
4. Conclusions
(1) A new analytical facility to analyse trace amounts of tritium in environmental samples by the 3He ingrowth method was designed and built in the isotope hydrology laboratory of the IAEA. The system is composed of a high sensitivity helium isotope mass spectrometer with a purpose-built sample inlet and purification line and an off-line water degassing unit that performs initial removal of 3He from water samples.(2) High purity 3He gas is used as the calibration gas standard for the mass spectrometer, in order to minimize the effects of gross differences in total pressure of helium in the mass spectrometer between analyses on actual samples and on the calibration standards.
(3) Our system is targeted to perform reliable analysis on 100 cm3 of water samples with 2–3 months of storage time for 0.5 to 10 TU samples. It is also possible to combine up to four sample containers (400 cm3) for ultra-low tritium samples or for a short storage time.
(4) Finally, the developed system is also applicable for analysis of Organically Bounded Tritium (OBT), because the in-growth method could be the only methodology for tritium quantification for some forms of OBT samples when available sample size is limited. Performance of OBT analysis by the 3He ingrowth method will be reported in a separate contribution.
Conflicts of interest
There are no conflicts to declare.Acknowledgements
This work is carried out as a part of the IAEA's Peaceful Uses Initiative (PUI) project on “Development of 3He mass spectrometry for ultra-low-level measurement of organically-bound tritium in environmental tritium analysis” funded by the government of Japan (JPM/A/E1-22-2016). Natural groundwater samples for this study were supported by a separate research project IAEA no. 22497 “Tritium Distribution in Natural Waters of Fukushima Prefecture, Japan, After the Accident of Fukushima Daiichi Nuclear Power Plant”.References
- L. L. Lucas and M. P. Unterweger, J. Res. Natl. Inst. Stand. Technol., 2000, 105, 541 CrossRef CAS PubMed.
- E. Fourré, P. Jean-Baptiste, A. Dapoigny, D. Baumier, J.-R. Petit and J. Jouzel, Earth Planet. Sci. Lett., 2006, 245, 56–64 CrossRef.
- K. Rozanski, R. Gonfiantini and L. Araguas-Araguas, J. Phys. G: Nucl. Part. Phys., 1991, 17, S523–S536 CrossRef.
- B. Nie, S. Fang, M. Jiang, L. Wang, M. Ni, J. Zheng, Z. Yang and F. Li, Renewable Sustainable Energy Rev., 2021, 135, 110188 CrossRef CAS.
- Water Isotope System for data analysis, visualization, and Electronic Retrieval, accessed April 2022, https://nucleus.iaea.org/wiser/index.aspx.
- C. V. Tadros, C. E. Hughes, J. Crawford, S. E. Hollins and R. Chisari, J. Hydrol., 2014, 513, 262–273 CrossRef CAS.
- J. D. van Rooyen, L. Palcsu, A. Visser, T. W. Vennemann and J. A. Miller, J. Environ. Radioact., 2021, 226, 106354 CrossRef CAS PubMed.
- W. B. B. Clarke, W. J. J. Jenkins and Z. Top, Int. J. Appl. Radiat. Isot., 1976, 27, 515–522 CrossRef CAS.
- U. Beyerle, W. Aeschbach-Hertig, D. M. D. M. Imboden, H. Baur, T. Graf and R. Kipfer, Environ. Sci. Technol., 2000, 34, 2042–2050 CrossRef CAS.
- P. Jean-Baptiste, E. Fourré, A. Dapoigny, D. Baumier, N. Baglan and G. Alanic, J. Environ. Radioact., 2010, 101, 185–190 CrossRef CAS PubMed.
- L. Palcsu, Z. Major, Z. Köllő and L. Papp, Rapid Commun. Mass Spectrom., 2010, 24, 698–704 CrossRef CAS PubMed.
- L. Papp, L. Palcsu, Z. Major, L. Rinyu and I. Tóth, Isot. Environ. Health Stud., 2012, 6016, 1–18 Search PubMed.
- F. Eyrolle, Y. Copard, H. Lepage, L. Ducros, A. Morereau, C. Grosbois, C. Cossonnet, R. Gurriaran, S. Booth and M. Desmet, Sci. Rep., 2019, 9, 11487 CrossRef PubMed.
- L. Copia, L. I. Wassenaar, S. Terzer-Wassmuth, D. J. Hillegonds, P. M. Klaus and L. J. Araguás-Araguás, Rapid Commun. Mass Spectrom., 2020, 34(17), e8832 CrossRef CAS PubMed.
- T. Matsumoto, D. K. Solomon, L. Araguás-Araguás and P. Aggarwal, Geochem. J., 2017, 51, 385–390 CrossRef CAS.
- L.-F. Han, Z. Roller-Lutz, T. Hunjak, H. O. Lutz, T. Matsumoto and P. Aggarwal, Geochem. J., 2017, 51, 391–407 CrossRef CAS.
- W. G. Darling, D. C. Gooddy, D. White, T. Matsumoto, L.-F. Han and N. Romeo, Geochem. J., 2017, 51, 409–421 CrossRef.
- J. Jankovec, T. Vitvar, M. Šanda, T. Matsumoto and L.-F. Han, Geochem. J., 2017, 51, 423–437 CrossRef CAS.
- L. Palcsu, L. Kompár, J. Deák, P. Szűcs and L. Papp, Geochem. J., 2017, 51, 439–448 CrossRef CAS.
- K. Kamdee, J. A. Corcho Alvarado, O. Occarach, V. Hunyek, A. Wongsit, C. Saengkorakot, P. Chanruang, C. Polee, S. Khaweerat, I. Matiatos and T. Matsumoto, Isot. Environ. Health Stud., 2020, 56, 95–110 CrossRef CAS PubMed.
- P. K. Aggarwal, T. Matsumoto, N. C. Sturchio, H. K. Chang, D. Gastmans, L. J. Araguas-Araguas, W. Jiang, Z.-T. Lu, P. Mueller, R. Yokochi, R. Purtschert and T. Torgersen, Nat. Geosci., 2014, 8, 35–39 CrossRef.
- T. Matsumoto, Z. Chen, W. Wei, G.-M. Yang, S.-M. Hu and X. Zhang, Earth Planet. Sci. Lett., 2018, 493, 208–217 CrossRef CAS.
- K. Zouari, T. Matsumoto, R. Trabelsi and P. Aggarwal, in Patterns and Mechanisms of Climate, Paleoclimate and Paleoenvironmental Changes from Low-Latitude Regions, ed. Z. Zhang, N. Khélifi, A. Mezghani and E. Heggy, Springer International Publishing, Cham, 2019, pp. 61–63 Search PubMed.
- B. Kumar, L.-F. Han, L. I. Wassenaar, P. M. Klaus, G. G. Kainz, D. Hillegonds, D. Brummer, M. Ahmad, D. L. Belachew, L. Araguás and P. Aggarwal, Appl. Radiat. Isot., 2016, 118, 80–86 CrossRef CAS PubMed.
- H. Baur, Trans., Am. Geophys. Union, 1999, 46, F1118 Search PubMed.
- P. G. Burnard and K. A. Farley, Geochem., Geophys., Geosyst., 2000, 1, 1022 CrossRef.
- K. Kashiwaya, Y. Muto, T. Kubo, R. Ikawa, S. Nakaya, K. Koike and A. Marui, Sci. Rep., 2017, 7, 12578 CrossRef PubMed.
- Y. Murasaki, H. Masuda, S. Yamano, R. Inoue, Y. Sakamoto, T. Shintani, N. Hirai, F. Chikaoka, G. Aoi, S. Nakaya, A. Marui and M. Ono, Abstracts, Japan Geoscience Union, AHW36- 01, Geoscience Union Meeting, 2017 Search PubMed.
- K. Sakakibara, S. Iwagami, M. Tsujimura, Y. Abe, M. Hada, I. Pun and Y. Onda, J. Contam. Hydrol., 2019, 223, 103474 CrossRef CAS PubMed.
| This journal is © The Royal Society of Chemistry 2022 |

