 Open Access Article
Creative Commons Attribution 3.0 Unported Licence
Protected lignin biorefining through cyclic extraction: gaining fundamental insights into the tuneable properties of lignin by chemometrics†
Maria
Karlsson
 *ab,
Vijaya Lakshmi
Vegunta
b,
Raghu
Deshpande
b and
Martin
Lawoko
 *ab
*ab
aWallenberg Wood Science Center, Department of Fiber and Polymer Technology, School of Engineering Sciences in Chemistry, Biotechnology and Health, Royal Institute of Technology, KTH Teknikringen 56-58, 100 44 Stockholm, Sweden. E-mail: lawoko@kth.se
bDivision of Wood Chemistry and Pulp Technology, Department of Fiber and Polymer Technology, School of Engineering Sciences in Chemistry, Biotechnology and Health, Royal Institute of Technology, KTH Teknikringen 56-58, 100 44 Stockholm, Sweden
First published on 22nd December 2021
Abstract
Lignin is a renewable source of aromatics with great potential as a substitute for fossil-based phenolic compounds that are used in several material applications. However, the available technical lignins are heterogenic and still structurally not fully understood. This presents hurdles for studies focused on gaining fundamental insights into how materials properties are related to the molecular structure of lignin. In the present study, a novel cyclic extraction process for lignin is more deeply studied to investigate the potential to tailor the chemical and physical properties of lignin. For this purpose, a design of experiment (DoE) approach was adopted as a tool to investigate the effect on the lignin properties of the selected parameters by including linear, quadratic and interaction effects in a multiple linear regression (MLR) model. Molecular characterization techniques included 1D and 2D NMR, SEC and DSC. It was clearly demonstrated that the chemical and physical properties of lignin could be tuned for the cyclic process using the DoE approach, while preserving 66–82% of the commonly known lignin inter-units, substantiating that the cyclic extraction approach offered a decent to excellent level of protection to inter-units when compared to benchmark organosolv and kraft lignin. By manipulation of the extraction conditions, the β-O-4′ content can be tuned between 20 and 35% simultaneously with the content of phenolic and aliphatic hydroxyls. Finally, DSC studies showed Tgs in the range of 150–185 °C which are discussed with respect to the molecular properties of the analysed lignin. Overall, to advance efforts in lignin valorization, a green process to produce a library of well-characterized lignins, tailored with respect to chemical and physical properties by process conditions, is presented.
Introduction
Lignocellulosic biomass is a renewable resource on the Earth. In today's transformation towards a bioeconomy, it is found to play an important role as an alternative to fossil based resources.1 In this context, the role of biorefineries in modern bioeconomies was recently critically reviewed in favour of further research and innovation efforts, which will play a key role in the commercialization phase.2 Lignin is the most abundant source of naturally occurring aromatics constituting 15–30% of the biomass.3 This positions lignin as a key candidate for bio-based aromatic precursors. Not surprisingly, lignin biorefinery concepts have gained increased interest in recent years.4 The valorization of technical lignin produced on a large scale, such as lignin from the Kraft process, has been made possible by the development of technically feasible methods to retrieve it from black liquor. This yields a lignin product such as LignoBoost.5 However promising as this may seem, the use of technical lignin in material applications is still limited due to its complex and poorly understood molecular properties.6 There are other processes producing pulp on a smaller scale, such as the organosolv process, where an aqueous organic solvent, often together with a small amount of an inorganic acid as a catalyst, is applied for the extraction of lignin from the fibres.7,8 One of the organosolv processes that generated high-quality pulp and valuable side products is the Alcell process, where the binary solvent system of aqueous ethanol is used as the cooking liquid.9,10 Ethanol has a relatively low boiling point and can be efficiently recovered by distillation.9,11 The lignin chemistry imposed by the classical organosolv process conditions is however not desirable for the lignin quality. The high temperature and acidic conditions cause the formation of carbocations on the aliphatic side-chain of the lignin molecule that react with the nucleophilic aromatic carbon in a condensation reaction to form stable and recalcitrant carbon–carbon inter-unit bonds. Another common reaction is the formation of Hibbert's ketone derived from the acidolysis reaction of aryl ether bonds in lignin.12,13To reduce the degradation and alteration of the lignin molecules during the extraction process, different methodologies for physical and chemical protection of the lignin structure have been investigated.14 An example is flow-through extraction as a physical protection strategy, yielding a lignin product with a higher amount of arylether (β-O-4′) linkages.15 The same effect is observed using chemical protection approaches with the inclusion of chemical additives to the extraction solvent. These additives end cap the formed carbocation on the aliphatic side-chain on the lignin molecule and consequently prevent lignin repolymerization through condensation reactions. An example is aldehyde-assisted fractionation (AAF), where the aldehyde as an additive provides chemical protection to the lignin structure.16–18 The protected lignins have a high content of aryl ether bonds and are therefore suitable for catalytic depolymerization such as hydrogenolysis and reductive catalytic fractionation (RCF), to yield monomers and smaller oligomers, which can further be used as biobased fuels or as platform chemicals.19–21
For sustainability purposes, there is a need to create value from all the streams resulting from a biorefining process. Sequential extraction where different biopolymers are collected in different streams is one route to meet this challenge.22 From a process efficiency perspective, it is desirable to have as few steps as possible to avoid losses in energy and material but still obtain products that are potentially of high-value.23
We have recently proposed a protection additive-free consolidated biorefinery concept using green solvents, where the main biopolymers in wood, i.e., hemicellulose, lignin, and a cellulose-enriched fibre, were efficiently fractionated.24 This was achieved by sequentially extracting the hemicelluloses with sub-critical water, followed by lignin extraction with sub-critical aqueous ethanol containing catalytic amounts of sulfuric acid. By the adaption of both physical and chemical protection strategies, less degraded lignin could be extracted with a high amount of β-O-4′ inter-unit linkages using a novel cyclic extraction methodology.
In the present study, we sought to investigate further the potential of the consolidated lignin biorefining process to produce a library of well characterized lignins differing in chemical and physical properties. The driving force is to have a single green and sustainable process that can be tuned to produce lignin with targeted and quantifiable properties for specific applications. More specifically, the aforementioned cyclic extraction of lignin was combined with experimental design to investigate the factor dependence on the properties of lignin.
To enhance the optimization of processes, using multivariate analysis and Design of Experiment (DoE) instead of evaluation of one factor at a time (OVAT) is both time- and cost-efficient, since factors often have more than a linear dependence, and there is an imminent risk of missing the optimal response when only linear effects are studied. By using a multivariate approach, other dependencies, such as interaction and quadratic relations, can be evaluated.25 The DoE approach is based on mathematical models which relate experimental data to responses. The values of the factors are altered between the levels within the design region during the experiment. The mathematical models differ depending on the selected design; generally, quadratic models consist of linear, interaction, and quadratic terms. To perform optimizations, quadratic models such as the Box–Behnken design are most appropriate.26 Within the experimental domain, the relationship between the factors and how they affect the responses can be predicted.27
Experimental
Chemicals
Wood chips from Norway spruce (Picea abies) were used in all experiments. Pyridine (anhydrous, 99.8%), endo-N-hydroxy-5-norbornene-2,3-dicarboximide (eHNDI; 97%), chromium(III) acetylacetonate (Cr(acac3); 99.99%), 2-chloro-4,4,5,5-tetramethyl-1,3,2-dioxaphospholane (Cl-TMDP; 95%), [D6]DMSO (99.9 at% D), N,N-dimethylformamide (anhydrous, 99.8%), CDCl3 (≥99.8 at% D), sodium hydroxide (50% in H2O) and sodium acetate (anhydrous, ≥99.0%) were purchased from Sigma-Aldrich. Ethanol (99.8%) and tetrahydrofuran (HPLC grade) were from VWR. Sulfuric acid (>95%, analytical grade) and acetic anhydride (99.7%, analytical grade) were purchased from Fischer Chemicals. The water referred to in the experiments was Milli-Q water (Millipore, Q-POD, Millipak 0.22 μm filter, 18.2 MΩ cm).Materials and software
The wood chips were milled using a Wiley mini-mill (3383L70, Thomas Scientific). The extractions were performed using an Accelerated Solvent Extractor, an ASE 350 (Dionex, Sunnyvale, CA, USA) instrument together with 66 ml Dionium zirconium extraction cells (Dionex). The ASE 350 equipment was controlled using the software Chromeleon 7.2.10 (Dionex, Sunnyvale, CA, USA). The wood was placed between glass fibre cell filters (Dionex, Sunnyvale, CA, USA) in the extraction cell. The extract was collected in 250 ml bottles. The lignin precipitate was filtered through a glass microfibres filter (1.6 μm, 70 mm) purchased from VWR.The 2D-NMR spectroscopy analysis was carried out using a Bruker 400 DMX (Bruker Corporation, Billerica, MA, USA) instrument. The instrument was equipped with a 5 mm Bruker BBI probe (Bruker Corporation, Billerica, MA, USA). The 31P NMR and 13C NMR experiments were performed on a Bruker NMR spectrometer Avance III HD 400 MHz (Bruker Corporation, Billerica, MA, USA) instrument. The instrument was equipped with a 5 mm Z-gradient BBFO broadband smart probe (Bruker Corporation, Billerica, MA, USA). All NMR data were further processed using MestreNova (v.9.0.0, Mestrelab Research).
Size-exclusion chromatography (SEC) was performed on a Waters system (Waters Milford, MA, USA) consisting of an HPLC pump (515), autosampler (2707) and a photodiode array detector (2998) operated at 254 and 280 nm. The system was equipped with a column system of Waters Styragel Guard column (4.6 × 300 mm) in series with Waters Ultrastyragel HR4, HR2 and HR0.5 (4.6 × 300 mm) solvent efficient columns. The calibration was made at 254 nm using polystyrene standards with nominal molecular weights ranging from 162 to 176![[thin space (1/6-em)]](https://www.rsc.org/images/entities/char_2009.gif) 000 Da (specifically; 176
000 Da (specifically; 176![[thin space (1/6-em)]](https://www.rsc.org/images/entities/char_2009.gif) 000, 116
000, 116![[thin space (1/6-em)]](https://www.rsc.org/images/entities/char_2009.gif) 000, 46
000, 46![[thin space (1/6-em)]](https://www.rsc.org/images/entities/char_2009.gif) 400, 18
400, 18![[thin space (1/6-em)]](https://www.rsc.org/images/entities/char_2009.gif) 000, 9600, 6540, 2920, 890, 578, 474, 370, 266 and 162 Da). Data acquisition and processing were performed using the Waters Empower 3 build 3471 software.
000, 9600, 6540, 2920, 890, 578, 474, 370, 266 and 162 Da). Data acquisition and processing were performed using the Waters Empower 3 build 3471 software.
Differential scanning calorimetry (DSC) was performed using a Mettler Toledo DSC1 instrument. The data were processed using the Mettler-Toledo STARe software V15.00a.
Powder X-ray diffraction (XRD) was performed using a PANalytical X'Pert Pro diffractometer. The data were baseline corrected using Origin v.9.1.0 (OriginLab Corporation).
Carbohydrate analysis was performed by using high-performance anion-exchange chromatography with pulsed amperometric detection (HPAEC/PAD), on a HPAEC/PADICS-3000 system (Dionex, Sunnyvale, CA, USA). The system was equipped with a CarboPac PA-1 (Dionex, Sunnyvale, CA, USA) column (4 × 250 mm). The data were processed using Chromeleon 7.1 (Dionex, Sunnyvale, CA, USA) software.
MODDE™ v.9.0.0.0 (Umetrics, Umeå, Sweden) were used for the set-up of the experimental design and evaluation of the model. The visualization of the predicted responses was generated using MODDE™ v.13.0.1.
Methods
Preparation of wood and extraction method
The extraction method was based on a previously published method.24 For consistency, all extractions strictly followed a protocol. The wood chips were ocularly inspected and only bright wood without visible deviations was included in the experiments. The wood chips were milled to a size of 40 mesh using a Wiley mill.For all experiments, 9.281 g oven-dry based Wiley milled wood was placed in a 66 ml Dionium zirconium extraction cell. For the design experiments, in the first step, hot water extraction was performed, with an extraction time of 2 h. The program parameters were as follows: fixed volume of 70 ml, 160 °C and a purge time of 90 s. The fixed volume was set to reach a pressure of 1500–1600 psi, approximately 110 bar.
After the hot water extraction, the system was rinsed with the new solvent system and subsequently, the organosolv extraction of lignin started. In the binary solvent system of ethanol, water was used together with sulfuric acid as a catalyst. The extraction of the design samples was performed in 15 static cycles of 5 min, using the instrumental standard method. The program parameters were as follows: rinse volume of 100% and a purge time of 90 s. The temperature, acid concentration, and ratio of ethanol![[thin space (1/6-em)]](https://www.rsc.org/images/entities/char_2009.gif) :
:![[thin space (1/6-em)]](https://www.rsc.org/images/entities/char_2009.gif) water were altered according to the design matrix. The Alcell benchmark lignin was extracted using the same amount of start wood as for the design experiment in a 66 ml Dionium zirconium cell, using the ethanol
water were altered according to the design matrix. The Alcell benchmark lignin was extracted using the same amount of start wood as for the design experiment in a 66 ml Dionium zirconium cell, using the ethanol![[thin space (1/6-em)]](https://www.rsc.org/images/entities/char_2009.gif) :
:![[thin space (1/6-em)]](https://www.rsc.org/images/entities/char_2009.gif) water (70
water (70![[thin space (1/6-em)]](https://www.rsc.org/images/entities/char_2009.gif) :
:![[thin space (1/6-em)]](https://www.rsc.org/images/entities/char_2009.gif) 30 v/v) solvent system with the addition of 1.5 wt% sulfuric acid. The extraction time was set to 2 h. The program parameters were as follows: static method (notably not cyclic extraction) at 170 °C with a rinse volume of 100% and a purge time of 90 s, at a pressure of 1500–1600 psi, approximately 110 bar.
30 v/v) solvent system with the addition of 1.5 wt% sulfuric acid. The extraction time was set to 2 h. The program parameters were as follows: static method (notably not cyclic extraction) at 170 °C with a rinse volume of 100% and a purge time of 90 s, at a pressure of 1500–1600 psi, approximately 110 bar.
The ethanol in the lignin extract was evaporated under reduced pressure using a rotary evaporator. A similar amount of water was added to the extract to prevent an increase in the acid concentration during the evaporation, where the lignin precipitated. The precipitated lignin was filtered using a glass fibre filter, and thereafter washed with 650 ml water for all design experiments to remove the water-soluble part of the extract. The lignin was dried under vacuum at ambient temperature for approximately 48 h. The extract from the hot water extraction, containing mainly hemicellulose, was directly frozen without any further preparation. The fibre residue was collected on a filter after lignin extraction and rinsed with water to prevent hydrolysis by the acid from the extraction solvent. The fibre was thereafter dried under vacuum at ambient temperature for approximately 48 h.
HSQC, 31P NMR and 13C NMR spectroscopy
For the HSQC analysis, 80 mg lignin was dissolved in 600 μl DMSO-d6. The spectra were acquired using the pulse program “hsqcetgpsi” using 60 scans, a relaxation delay of 2.5 s, and acquisition time of 0.1065 s at a temperature of 298 K, using 16 dummy scans and a spectral window of 199.9 ppm on F1 and 12.0 ppm on F2 using 1024 × 256 increments. The data were processed in a MestReNova using a 90°-shifted square sine-bell apodization window and 1024 × 1024 data points. The data were Fourier transformed, followed by phase correction. The baseline was corrected in both the 1H and 13C dimensions by a Bernstein polynomial fit of the third order. The carbohydrate sample was analysed using the same method, except for the use of 84 scans. Sample preparation for 13C NMR experiments was similar to that for the HSQC experiments, with the exception that the addition of a relaxation agent, specifically 0.01 M chromium(III) acetylacetonate (Cr(AcAc3)). The pulse program “sd_zgig90” was used using 22![[thin space (1/6-em)]](https://www.rsc.org/images/entities/char_2009.gif) 800 scans, a relaxation delay of 1.7 s and an acquisition time of 1.3631 s.
800 scans, a relaxation delay of 1.7 s and an acquisition time of 1.3631 s.
The sample preparation of the lignin samples for quantitative 31P NMR experiments followed an earlier reported method.28,29 Briefly, 30 mg sample was dissolved in 100 μl N-dimethylformamide and 100 μl pyridine. To the dissolved mixture, 50 μl of an internal standard solution (60 mg ml−1 eHNDI in pyridine, 5 mg ml−1 Cr(AcAc3) relaxing agent) was added. Finally, 100 ml of the Cl-TMDP phosphorylating agent was added, followed by the dropwise addition of 450 ml CDCl3. The spectra were acquired using pulse program “zgig30”, 256 scans, a relaxation delay of 5 s and an acquisition time of 1.6777 s at a temperature of 298 K, using 4 dummy scans. The data were processed in a MestReNova and Fourier transformed, followed by phase correction. The baseline was corrected by a Bernstein polynomial fit of the third order.
The diagnostic signals with assigned chemical shifts for different lignin functionalities are presented in Tables S1 and S4.† The C2 signal region in the aromatic ring was used as an internal standard to perform semi-quantification of the inter-unit linkages in the HSQC experiments.30
Size exclusion chromatography
The molecular weight distribution and dispersity were evaluated by size exclusion chromatography (SEC). The lignin samples were acetylated to increase the solubility in tetrahydrofuran (THF) prior to analysis. The acetylation was performed by dissolving 2.5 mg of lignin in equal volumes of acetic anhydride and pyridine (100 μl, 1![[thin space (1/6-em)]](https://www.rsc.org/images/entities/char_2009.gif) :
:![[thin space (1/6-em)]](https://www.rsc.org/images/entities/char_2009.gif) 1, v/v). The sample mixture was stirred overnight at 400 rpm at ambient temperature using a thermomixer. To the sample mixture, ethanol was added dropwise during evaporation of the solvents using a stream of nitrogen. The dried residue was dissolved in 1 ml of THF. The samples were filtered using a 0.2 μm NYL syringe filter prior to analysis. The separation was made using THF as a mobile phase at a flow rate of 0.3 ml min−1. The column temperature was 35 °C and the injection volume was 20 μl.
1, v/v). The sample mixture was stirred overnight at 400 rpm at ambient temperature using a thermomixer. To the sample mixture, ethanol was added dropwise during evaporation of the solvents using a stream of nitrogen. The dried residue was dissolved in 1 ml of THF. The samples were filtered using a 0.2 μm NYL syringe filter prior to analysis. The separation was made using THF as a mobile phase at a flow rate of 0.3 ml min−1. The column temperature was 35 °C and the injection volume was 20 μl.
Differential scanning calorimetry
DSC was used to investigate the thermal transition of the lignin samples. The measurements were performed under a nitrogen atmosphere with a flow rate of 50 ml min−1 and with a heating and cooling rate of 10 °C min−1. Lignin samples in a range of 3–4 mg were placed in an enclosed 40 μl aluminium crucible. In the first heating cycle, the samples were heated from room temperature to 125 °C and kept isothermally for 6 minutes. In the second heating cycle, the samples were heated to 220 °C. The glass transition temperature was determined from the second heating cycle as the midpoint between the onset and end of the step transition. Each sample was measured in duplicates.X-ray diffraction
The crystallinity of the fibre residue (Fibre residue 2, Fig. S32†) was investigated using powder X-ray diffraction (XRD). The experiments were performed using Cu Kα radiation generated at 45 kV and 40 mA, with 2θ scanned from 5° to 50° with a step size of 0.05°, using a scan rate of 3 seconds per step.Carbohydrate analysis and Klason lignin content
The acid hydrolysis protocol was used to quantify the carbohydrate contents31 and the Klason lignin in the wood and fibre residue fractions.32 Briefly, 3 ml of 72% sulfuric acid was added to 200 mg of fibres. The fibres and acid were mixed and placed in a vacuum desiccator, with occasional stirring. After 80 minutes, 84 ml of Milli-Q water was added, and the mixture was placed in an autoclave for 60 minutes at 125 °C. The insoluble residue was thereafter filtered under vacuum. An additional amount of Milli-Q water (5 × 2 ml) was added to rinse the insoluble klason lignin fraction.The quantification of carbohydrates was performed using a HPAEC/PAD system. The method has been reported elsewhere.33 The system was equilibrated using 170 mM sodium acetate and 260 mM sodium hydroxide for 7 minutes, and finally by equilibration using Milli-Q water for 6 minutes. During analysis, Milli-Q was used as an eluent at a flow rate of 1 ml min−1. At the column effluent before the PAD cell, 300 mM sodium hydroxide was added with a flow rate of 0.5 ml min−1.
The Klason lignin was quantified gravimetrically.
Results and discussion
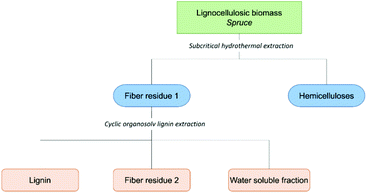
The schematic for the aforementioned consolidated biorefining concept we recently developed is presented in Scheme 1. In short, a sequential extraction of wood meal is performed to obtain a hemicellulose-rich fraction, pure lignin fraction and cellulose-rich fibre residue. The material balance and the environmental aspects of the process are discussed at the end of this paper.Chemometric study and molecular lignin properties
Chemometrics, coupled with advanced characterization was used to gain deeper fundamental insights into how lignin is affected by the cyclic extraction conditions. This will provide insights into the tuneable properties of lignin for targeted applications. The tuning of the chemical and physical properties of lignin is important to meet the pre-requisites of different applications. For instance, for the production of phenolic monomers from lignin a high content of cleavable aryl ether linkages is desirable. On the other hand, for the synthesis of thermosets hydroxyl functionalities are useful chemical handles for further crosslinking reactions, and their concentrations can be used to tailor the number of cross links, which reflect in material properties. Interestingly, the uniqueness of the lignin molecular structure offers a multitude of application possibilities if the process for its extraction can be tailored towards certain structural outcomes. In this context, developing a fundamental understanding will immensely contribute to such control.Several different characterization techniques such as 1D (13C NMR, 31P NMR) and 2D (HSQC) NMR characterization techniques for lignin inter-units and functionalities, and size exclusion chromatography (SEC) for molecular weight studies were used. Extracted lignins were also characterized by differential scanning calorimetry (DSC) to gain insights into how lignin chemical properties affected its thermomechanical properties.
Experimental models were created for commonly reported lignin properties, namely, number of aryl ether (β-O-4′) inter-unit linkages, hydroxyl functionalities, mass-average molecular weight (Mn) and molar mass dispersity (Đ). Lignin yield was also evaluated. By using the combination of the models, deeper insights into lignin reactions and optimal processing conditions can be achieved. The study also assists in gaining fundamental knowledge of lignin properties and reactions during extraction and how the different selected extraction parameters, specifically temperature, acid concentration and ethanol–water ratio, affect the structural features of lignin. The model within this study is created based on lignin extraction from spruce wood. The design of the process does not follow a lignin first-principle but is more towards a classical process concept where the easiest part, herein the hemicellulose part, is extracted first, followed by lignin extraction.
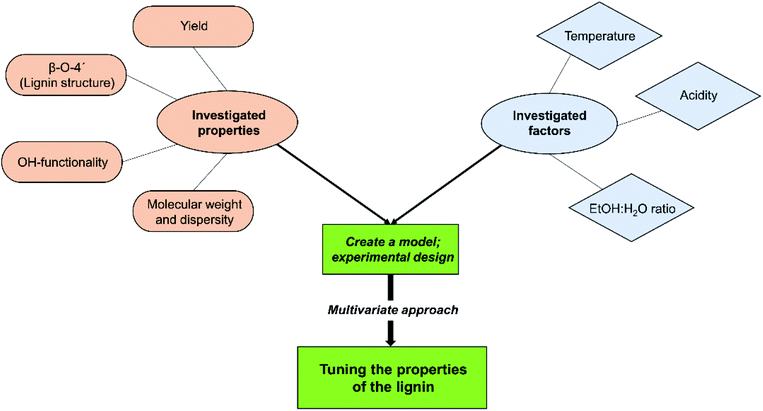
An illustration of the set-up for the study is given in Scheme 2.
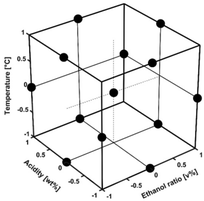
The Box–Behnken design does not include extreme points such as corner points, meaning that the extreme points are not run simultaneously as for other types of surface designs such as central composite designs. The advantages are that the range can be expanded, which is especially beneficial if the equipment has limitations. The Box–Behnken design is a second-order interaction model and consists of constant (intercept), linear terms, interaction terms, quadratic terms, and residue. By changing the factors at different levels within the design region, the response can be predicted for all potential experiments within the experimental domain. The design matrix of the Box–Behnken design consisted of 15 runs including three centre points, i.e., replicates for variability evaluation, named D1 to D15, where D13–D15 are the three centre points. The levels are normalized and correspond to the maximum, middle, and minimum levels, Fig. 1 and Table 1, and the design matrix in Table S10.†
![[thin space (1/6-em)]](https://www.rsc.org/images/entities/char_2009.gif) :
:![[thin space (1/6-em)]](https://www.rsc.org/images/entities/char_2009.gif) water ratio was investigated quantitatively. The factors was selected based on the literature and on an experience
water ratio was investigated quantitatively. The factors was selected based on the literature and on an experience
| Factor | Variable range | Unit | ||
|---|---|---|---|---|
| −1 | 0 | 1 | ||
| Temperature (Temp.) | 110 | 140 | 170 | °C |
| Acid (Aci) | 0.5 | 1.5 | 2.5 | wt% |
Ethanol![[thin space (1/6-em)]](https://www.rsc.org/images/entities/char_2009.gif) : :![[thin space (1/6-em)]](https://www.rsc.org/images/entities/char_2009.gif) water (EtO) water (EtO) |
60![[thin space (1/6-em)]](https://www.rsc.org/images/entities/char_2009.gif) : :![[thin space (1/6-em)]](https://www.rsc.org/images/entities/char_2009.gif) 40 40 |
70![[thin space (1/6-em)]](https://www.rsc.org/images/entities/char_2009.gif) : :![[thin space (1/6-em)]](https://www.rsc.org/images/entities/char_2009.gif) 30 30 |
80![[thin space (1/6-em)]](https://www.rsc.org/images/entities/char_2009.gif) : :![[thin space (1/6-em)]](https://www.rsc.org/images/entities/char_2009.gif) 20 20 |
v/v |
Experimental design
The hydroxyl-OH functionalities which include both aliphatic-OH and phenolic-OH (C5-condensed and non-condensed) were investigated by 31P NMR, the β-O-4′ inter-unit linkages by HSQC NMR and the Mn and Đ by SEC. There are certain general expectations from delignification processes based on well-established studies. For instance, the cleavage of aryl ether linkages is enhanced by the severity of the extraction process34–36 leading to the generation of new phenolic ends on lignin. Lignin condensation reactions are also known to occur under severe extraction conditions.37 Consequently, there is a competition between depolymerisation and re-polymerisation reactions.38,39 Although such reactions are now common, the validation of their occurrences using the DoE setup is required for a new process concept. In this study, however, the DoE served mainly as a tool for investigating possibilities of tailoring lignin properties while retaining its structural integrity. The studied properties have underpinnings for lignin valorisation.The experimental data were fitted with multiple linear regression (MLR). For all lignin properties, Scheme 2, significant models were created. The variation of the responses explained by the model (R2), the variation caused by the model evaluated by cross-validation (Q2), model validity and reproducibility are reported in Table S11.† The models were further validated by the investigation of the distribution of the error terms, Fig. S25,† and the correlation between observed responses versus the predicted responses, Fig. S24.†
The significant model terms, including linear, interaction and quadratic effects on the yield, β-O-4′ content and aliphatic- and aromatic hydroxyl contents, are illustrated in Fig. 2. The untuned model includes the linear term temperature (Temp.), ethanol![[thin space (1/6-em)]](https://www.rsc.org/images/entities/char_2009.gif) :
:![[thin space (1/6-em)]](https://www.rsc.org/images/entities/char_2009.gif) water ratio (EtO), and acid concentration (Aci) together with the interaction terms Temp. × EtO, Temp. × Aci, EtO × Aci, and the quadratic terms Temp.2, EtO2 and Aci2. All models were tuned, and insignificant terms were excluded according to model hierarchy, meaning that lower order insignificant model terms, such as a linear term, cannot be excluded if a higher order model term is of significance. For the model term to be statistically significant, the p-value must be <0.05. The model terms which have a p-value >0.05 were excluded, however, if the model term was a part of a higher order term, the term was still included but of no significance, illustrated with the uncertainty range crossing zero, Fig. 2. The coefficient values are normalized and indicate their influence on the responses. The significant factors Mn and Đ are shown in Fig. S26.†
water ratio (EtO), and acid concentration (Aci) together with the interaction terms Temp. × EtO, Temp. × Aci, EtO × Aci, and the quadratic terms Temp.2, EtO2 and Aci2. All models were tuned, and insignificant terms were excluded according to model hierarchy, meaning that lower order insignificant model terms, such as a linear term, cannot be excluded if a higher order model term is of significance. For the model term to be statistically significant, the p-value must be <0.05. The model terms which have a p-value >0.05 were excluded, however, if the model term was a part of a higher order term, the term was still included but of no significance, illustrated with the uncertainty range crossing zero, Fig. 2. The coefficient values are normalized and indicate their influence on the responses. The significant factors Mn and Đ are shown in Fig. S26.†
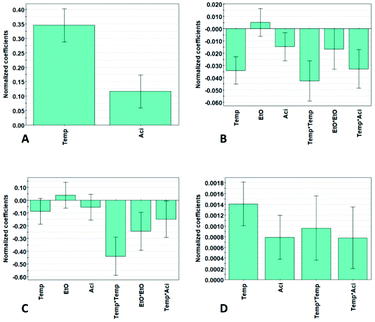 | ||
| Fig. 2 Coefficient plots, illustrating the influence of the significant factors, of (A) yield, (B) β-O-4′, and (C) aliphatic hydroxyls, and (D) aromatic hydroxyls, using a 95% confidence level. | ||
To obtain a high yield, the temperature has the most significant influence, followed by the acid concentration. It is noticeable that only the linear terms are of significance. There is a contradiction between obtaining high yield and high β-O-4′ content simultaneously, meaning that the highest yield and β-O-4′ content cannot be obtained at the same time, and they have to be weighed against each other. The extraction parameters for the lignin properties in terms of β-O-4′, aliphatic-hydroxyl and aromatic-hydroxyl content have a more complex relation, including interaction and quadratic terms and cannot be easily interpreted from Fig. 2. Nevertheless, the revelation of these higher order effects demonstrates the benefits of the DoE approach over the OVAT (one-variable at a time) approach. As can be interpreted from the results, most of the results cannot be explained by only taking each individual factor into account, since the factors are highly dependent on each other. This is substantiated by the observation that alterations of the levels of the factors in certain combinations gave a similar outcome of the results.
Generally, high temperature and high acid concentration generated lignin with lower β-O-4′ and lower aliphatic-hydroxyl content. This is illustrated by the fact that the temperature and acid concentration have a negative influence on the β-O-4′ and lead to a lower aliphatic-hydroxyl content, Fig. 2. Further explanations will be discussed in a later section. The aromatic-hydroxyl content follows a similar trend as the yield, where the content increases with higher temperature and acid concentration. An explanation for this is an increase in the partial hydrolysis of β-O-4′ bonds under these conditions, leading to the generation of new phenolic hydroxyl groups. As illustrated in Fig. 2, temperature and acid concentration have a positive effect on the yield illustrated by the positive coefficients of the temperature and acid concentration. The increased yield of lignin at high temperature and acidity is also expected and can be explained by the improved solubility of lignin due to the enhanced hydrolysis of biomass under these conditions. However, it is worth noting that the benefit of yield is often compromised by the lower quality of lignin in terms of the quantifiable inter-units.
Although this observation partly holds in this work, it is worth mentioning that decent yields of pure lignin containing a relatively better preserved structure than technical lignins, are achieved in this work, thanks to the protection strategies. This is further discussed in another section of this paper.
Tuning of properties and investigation of selected responses
The factors were tuned by MLR using software MODDE™ and the factors were optimized towards desired conditions of different responses, Scheme 2. The optimization function in MODDE was used to find the optimal set points to tune the responses to obtain desired lignin properties. The optimization was made towards optimal log(D), i.e., distance to the target and DPMO, which is an indication of robustness values.Chemical and physical properties of lignin in relation to lignin yield
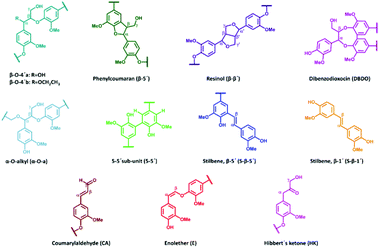
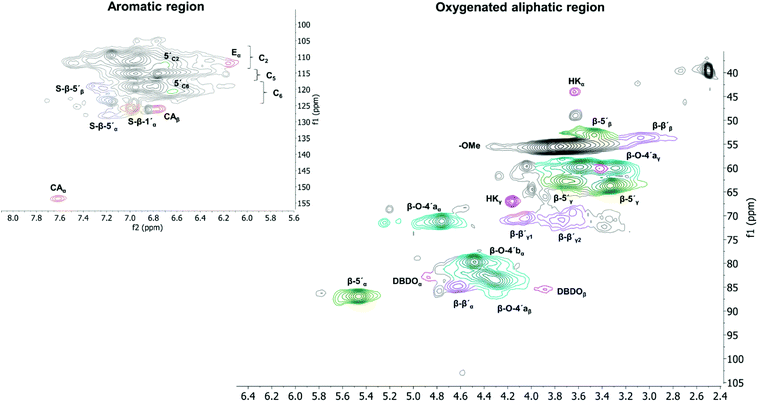
All extracted lignins where characterized by 2D NMR techniques, Fig. S1–S17.† The quantified inter-unit linkages are illustrated in Fig. 3 and an example of the assigned HSQC spectrum is shown in Fig. 4.A summative diagram of quantitation is presented in Fig. 5 for the different lignin extraction conditions indicated in Table 2. For comparison, the structural analysis of kraft lignin (lignoboost) and an Alcell lignin are used as benchmarks. In general, the highest amount of quantified inter-unit linkages by HSQC alone was found in the cyclic extracted lignins, with the highest values achieved for design number D10 (Table 2, 140 °C, 80% EtOH, 0.5 wt% acid) at 63 per 100 aromatic rings, Fig. 5, Table S2.† Technical lignins on the other hand showed a significantly lower amount of the commonly known native lignin inter-units. This highlights the efficiency of preservation of the native lignin structure under the applied cyclic extraction conditions, which is accredited to both chemical and physical protection. The physical protection results from cyclic extraction and the chemical protection is a result of reactive site capping reactions of ethanol during extraction.23 Notably, no extra protection additives other than the solvent are present. Three samples from the design had a significantly lower amount of quantified inter-unit linkages (Table 2) namely D8 (170 °C, 70% EtOH, 2.5 wt% acid) D4 (170 °C, 80% EtOH, 1.5 wt% acid) and D2 (170 °C, 60% EtOH, 1.5 wt% acid). Interestingly, they have all been extracted at 170 °C with an acid concentration ≥1.5 wt% (Table 2). High temperature in combination with higher acidity therefore seems to enhance reactions, which cause alterations of the lignin structure with the consequence of a low amount of commonly reported inter-unit linkages. For instance, the amount of Hibbert's ketone resulting from aryl ether bond cleavages is higher in these samples. Furthermore, it is well documented that acid-catalyzed condensation reactions as well as temperature initiated radical formation and subsequent condensation reactions are effective and yield new types of linkages that escape the HSQC analysis.16,24 For all the samples within the design boundaries, the β-O-4′ content is still relatively high (≥20 per 100 Ar) when compared to classical Alcell lignin and kraft lignin (Fig. 5). This is attributed to the aforementioned protection strategies as features of cyclic extraction.
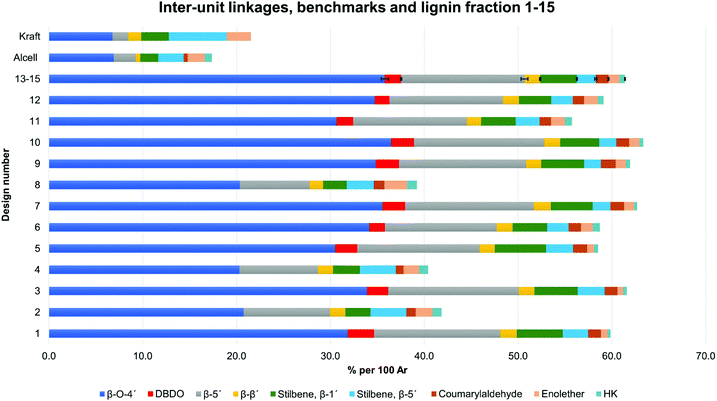 | ||
| Fig. 5 Quantification and the sum of common inter-unit linkages in the lignin fractions. The design numbers D13–D15 correspond to three replicates, with standard deviation illustrated by error bars, Tables S2 and S3.† | ||
| Design number | Temperature [°C] | EtOH![[thin space (1/6-em)]](https://www.rsc.org/images/entities/char_2009.gif) : :![[thin space (1/6-em)]](https://www.rsc.org/images/entities/char_2009.gif) H2O [v/v] H2O [v/v] |
Acid [wt%] |
|---|---|---|---|
| 1 | 110 | 60 | 1.5 |
| 2 | 170 | 60 | 1.5 |
| 3 | 110 | 80 | 1.5 |
| 4 | 170 | 80 | 1.5 |
| 5 | 110 | 70 | 0.5 |
| 6 | 170 | 70 | 0.5 |
| 7 | 110 | 70 | 2.5 |
| 8 | 170 | 70 | 2.5 |
| 9 | 140 | 60 | 0.5 |
| 10 | 140 | 80 | 0.5 |
| 11 | 140 | 60 | 2.5 |
| 12 | 140 | 80 | 2.5 |
| 13 | 140 | 70 | 1.5 |
| 14 | 140 | 70 | 1.5 |
| 15 | 140 | 70 | 1.5 |
As can be seen from other design entries, extraction at high temperature but lower acidity, or at high acidity and lower temperature, minimizes the alteration of the lignin structures.
To gain further insight into the preservation of lignin inter-units achieved in this work, SEC data were used together with the HSQC results to derive the theoretical maximum of inter-units per lignin molecule. This was then further used to evaluate lignin quality with respect to the analysable, by the state-of the art techniques, inter-unit linkages. Accordingly, from the results of SEC, Tables S7 and S8,† the degree of polymerization (DPn) was determined using 180 Da as a representative repeating monomeric unit.29 As a caution, the applied 180 Da is used for milled wood lignin and may not be an accurate value for this specific lignin. The estimated DPn for the lignins are shown in Tables S7 and S8.† Typically, DPn values between 5 and 9 are reported, which translate to the theoretical amount of inter-unit linkages of 80–89 respectively per 100 aromatic rings, on average. The theoretical maximum value of inter-unit linkages per 100 aromatic rings are then plotted together with the HSQC-analysed inter-units in Fig. 6 for each lignin sample. A further synthesis of the data presented in Fig. 6 reveals, with the exception of the samples D2, D4 and D8, that HSQC analysis of the extracted lignins can account for roughly 75% of the inter-unit linkages. However, the HSQC quantitation does not include the 5–5′ inter-unit linkages, with the exception of the dibenzodioxocin (DBDO) substructure. The 5–5′ units are abundant in native spruce lignin.40,41 Unlike arylether linkages, these 5–5′ linkages are stable under common processing conditions and may therefore constitute the majority of unquantified inter-units. Luckily these linkages cause diagnostic shifts to aromatic resonances at C2H2 and C6H6 on the HSQC spectra, (labelled 5′ C2 and 5′ c6 respectively in Fig. 4, aromatic region).23 The intensities of the said diagnostic signals are only indicators of the presence of 5–5′ sub-structures due to several other overlapping signals. Quantitation was therefore performed by quantitative 13C NMR on selected samples (D4 and D12), and the signal at 132.5 ppm representing C5 in 5–5′, G-units42 was used for quantification, to yield about 19% of the aromatics for both samples, Fig. S22.† However, these values also include the DBDO substructures. Subtraction of the HSQC obtained values for DBDO yields 5–5′ that are non-DBDO related at roughly 13% for the D12 and 18% for the D4 samples. If these values are then added to the HSQC quantitation, Fig. 6, we obtain for D12 a total of 82% of the inter-units analysed. A similar calculation for the D4 sample suggests that 66% of the inter-units in this sample are analysed. The other samples were not quantified for the 5–5′ sub-unit but the amounts in them are likely to be within 13–18%. In summary, more than 80% of the inter-units are accounted for in the samples extracted below 170 °C and more than 65% for those extracted at 170 °C. The same detail cannot be achieved for the benchmark samples (as manifested in Fig. 5). The accountability of inter-unit linkages in lignin is of particular importance for fundamental studies on structure–property relationships and is therefore an important quality measure of lignin. Other quality measures include the physical and chemical properties with underpinnings for reactivity, and are application-specific. In general, from a lignin-valorization viewpoint, the chemical and physical properties of lignin are equally important as the yields of extracted lignin. The lignin yields obtained for the cyclic extractions are reported in Table S12.† In this context, the Alcell lignin benchmark gives a highest yield of extracted lignin (Table S12†) but significantly poorer lignin quality with respect to quantifiable inter-unit linkages. It is notable that all design samples are superior in lignin quality (i.e. 66–82% of the inter-units quantifiable by HSQC + 13C NMR) when compared to benchmarks (20% for kraft lignin and 25% for Alcell). It is noteworthy that the 5–5′ sub-units were not analysed for the benchmark technical lignins due to the more complicated nature of lignin modifications through ring condensations that may interfere with this evaluation. However, estimating from the HSQC spectra, the amount of 5–5′sub-units in the Alcell lignin may lie in the region of 20%. Recent work on kraft lignin also estimates these structures at not more than 20%.43 A good compromise between lignin quality and yield is manifested in samples D2 (170 °C, 60% EtOH, 1.5 wt% acid), D4, (170 °C, 80% EtOH, 1.5 wt% acid) D8, (170 °C, 70% EtOH, 2.5 wt% acid) and the sample at 160 °C, and 1.5% acid. These samples had greater that 60% of the inter-units quantified and lignin yields of 57, 74, 67 and 52%, respectively. On the other hand, for academic studies, such as gaining insights into how the lignin structure may affect the properties of materials made from it, the lignin quality becomes more relevant and yield is interesting only to meet the analytical demands. In this context, the samples with over 80% quantifiable inter-units are more interesting.
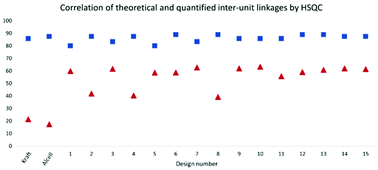 | ||
| Fig. 6 Theoretical and quantified inter-unit linkages analysed by HSQC NMR, presented as inter-unit linkages per 100 aromatic rings. | ||
The molecular weight and DPn are higher for the fractions extracted at higher temperature and acid concentrations, Table S7.† Only high temperature or acid concentrations does not cause the same effect. This observation also correlates with the response surface plot illustration in Fig. S29,† where the highest Mn is obtained at high temperature and acid concentration. This points towards repolymerization reactions being more extensive under these conditions, as described earlier.
At the same time, acid hydrolysis is more pronounced at higher acidity, and high temperature fastens the kinetics. Therefore, it seems likely that depolymerization and repolymerization reactions are occurring simultaneously. As can be seen in the coefficient plot for Mn values, Fig. S26,† the temperature and acid concentration have a significant influence on the molecular weight. However, ethanol concentration appears not to influence the increase in Mn but has a more pronounced effect on the Đ. This might be explained by the change of the molecular weight, Mw, term, Table S7,† since the larger molecules in the molecular mixture have a larger contribution than the smaller molecules. Higher acid concentration has an increased effect on both Mn and Mw.
In contrast, the benchmark Alcell lignin, had a comparable Mn value to D11, and not far different from several other design entries, but the Mw term was significantly higher than that of all design entries. The Mw was 13![[thin space (1/6-em)]](https://www.rsc.org/images/entities/char_2009.gif) 550 da compared with the highest Mw for the design entries of 7033 da corresponding to the D4 (Tables S7 and S8†). This supports that the occurrence of lignin condensation reactions was far more significant in the benchmark than in the cyclic extracted lignins. At the same time, the broad polydispersity (Đ = 9.8) of the benchmark sample may support simultaneous occurrence of depolymerization and re-polymerization reactions during lignin extraction.
550 da compared with the highest Mw for the design entries of 7033 da corresponding to the D4 (Tables S7 and S8†). This supports that the occurrence of lignin condensation reactions was far more significant in the benchmark than in the cyclic extracted lignins. At the same time, the broad polydispersity (Đ = 9.8) of the benchmark sample may support simultaneous occurrence of depolymerization and re-polymerization reactions during lignin extraction.
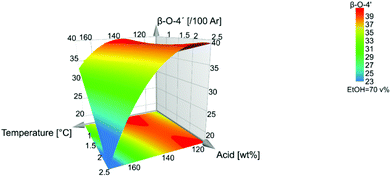
In Fig. 7, the response surface plot illustrates the correlation between the β-O-4′ content and the temperature and acid concentration. It shows that the highest amount of β-O-4′ is obtained at a temperature of 140 °C for low acid concentrations and at 110 °C for high acid concentration of 2.5 wt%. Interestingly, the mildest conditions do not give the highest β-O-4′ content. This could be explained by the effect of the subcritical water extraction of hemicellulose that was performed before lignin extraction. Some lignin depolymerization may have occurred during subcritical water pretreatment and these were easily extractable under much milder conditions in the subsequent lignin organosolv extraction.
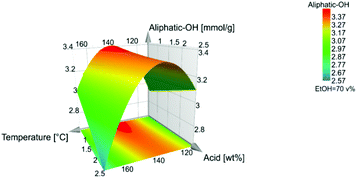
The high β-O-4′ content and high aliphatic-OH content (Table S5†) have similar trends, and they both have their optimal value at a temperature of 140 °C, however, the aliphatic-OH decreases at a higher acid concentration. It is worth noting that the aliphatic-OH solely originated from lignin since no carbohydrate signals where detectable by HSQC in the samples. It is therefore evident for this condition that other reactions on the aliphatic side chain of lignin are more prone to occur than the cleavage of the β-O-4′ inter-unit linkages. Such reactions as demonstrated by the HSQC analysis include enhanced end capping of benzylic cations in β-O-4′ substructures (see Fig. 3 and 4 for substructure and related HSQC signals).
For a fixed value of 1.5 wt% acid, the optimal β-O-4′ is achieved at around 140 °C and at 70% ethanol.
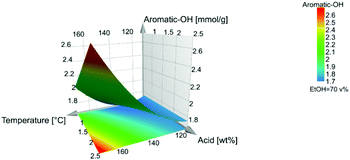
The temperature and acid concentration had a negative influence on the β-O-4′ and aliphatic hydroxyl content. The higher temperature and acid concentration generally decrease the β-O-4′ and aliphatic hydroxyl content, Fig. 2. However, as also indicated in Fig. 7 and 8 that the temperature and acid concentration depend on each other and the relationship between them is not linear.
The aromatic-OH content is the highest at 170 °C and 2.5 wt% acid.
Interestingly, as can be seen from the influence on β-O-4′ and the aliphatic-OH content, Fig. 7 and Fig. 8, the quadratic effect from ethanol has a negative influence on both β-O-4′ and aliphatic-OH response. This is a consequence of that the midpoint conditions, around 70![[thin space (1/6-em)]](https://www.rsc.org/images/entities/char_2009.gif) :
:![[thin space (1/6-em)]](https://www.rsc.org/images/entities/char_2009.gif) 30 ethanol
30 ethanol![[thin space (1/6-em)]](https://www.rsc.org/images/entities/char_2009.gif) :
:![[thin space (1/6-em)]](https://www.rsc.org/images/entities/char_2009.gif) water (v/v), are favourable in terms of high β-O-4′ inter-unit linkages and aliphatic-OH content. There is a shift where ethanol closer to 80 v% leads to higher responses of the β-O-4′ inter-unit linkages content than to 60 v%, Fig. S30.† The effect was further investigated with fixed temperatures and acid concentrations in the model, where all the trials gave the same result of an optimal ethanol concentration of 70 v%, which also is a fixed condition in Fig. 7–9.
water (v/v), are favourable in terms of high β-O-4′ inter-unit linkages and aliphatic-OH content. There is a shift where ethanol closer to 80 v% leads to higher responses of the β-O-4′ inter-unit linkages content than to 60 v%, Fig. S30.† The effect was further investigated with fixed temperatures and acid concentrations in the model, where all the trials gave the same result of an optimal ethanol concentration of 70 v%, which also is a fixed condition in Fig. 7–9.
31P NMR analysis (Fig. S20†) showed that increasing the temperature from 110 °C to 140 °C at the same acidity increases both the aliphatic and aromatic hydroxyl content. Interestingly, the increase in aromatic hydroxyls is especially the C5 condensed phenolics, which may suggest hydrolysis of ether bonds in 4-O etherified 5–5′ substructures and α-O-4′ bond in phenylcoumaran (in addition to β-O-4′ inter-unit linkages as seen in the HSQC NMR spectra). These are consistent with the disappearance of for example DBDO and the decrease in the phenylcoumaran content. A further increase from 140 °C to 170 °C increases the aromatic hydroxyls further but decreases aliphatic hydroxyls, Fig. S20.† This is consistent with deformylation reactions leading to stilbene formation, which is also observed to increase, as observed from the HSQC NMR spectra, Fig. S21.†
As illustrated in the coefficient plot, Fig. 2, the amount of ethanol in the extraction solvent showed no significant effect, neither on the content of aromatic-OH nor the yield. High temperature and acid concentration, which negatively affect the β-O-4′ and aliphatic-OH content, also have a positive effect on the yield, Fig. S27.† These observations are consistent with the known chemistry to the effect that hydrolytic cleavage of β-O-4′ linkages yields phenolic hydroxyls. At the same time, the depolymerization may enhance lignin solubility and consequently improve extraction yields. Ethanol is kept in the middle level since it had no significance in the model, Fig. 9.
In general, all the design entries have a significantly higher aliphatic OH content (2.5–3.4 mmol g−1 lignin, Table S5†) when contrasted with the benchmark Alcell lignin (1.3 mmol g−1 lignin Table S6†). The Alcell lignin on the other hand has a higher content of phenolic hydroxyls (2.8 mmol g−1versus 1.6–2.5 mmol g−1 for the design entries, Tables S5 and S6†). The low aliphatic content of the benchmark could be explained by the increased occurrence of the carbocation and subsequent lignin condensation reactions, while the higher phenolic content is a result of hydrolysis of aryl ether linkages. Thus, the occurrence of both depolymerisation and re-polymerization, also supported by the molar mass analysis discussed earlier, is further substantiated.
An important aspect of this study is to investigate the use of DoE combined with chemometric modelling as a means to tailor lignin properties while maintaining lignin quality. In this context, it is possible to predict the exact conditions required for a targeted response using the optimizer function in MODDE. For instance, using the optimizer function, the highest β-O-4′ content within the design boundaries is obtained when the extraction is carried out at 140 °C, 70% ethanol and at 0.5% acid. The same conditions apply for the highest aliphatic hydroxyls.
Differential scanning calorimetry
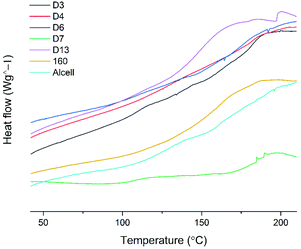
The thermal properties of selected lignins were also studied by DSC analysis. The glass transition temperatures are given as the average value ± SD, Fig. 10.The lignin samples in the DSC experiments were selected to span over the design area, according to Table S9.† It is observed that the samples extracted at the lowest and highest temperatures, i.e. 110 °C and 170 °C, respectively, had the highest Tg values in the range of 170 °C–185 °C, while those extracted at intermediate temperatures (140 °C–160 °C) had Tgs in the range of 150 °C–160 °C. The high Tg of lignin extracted at lower temperatures is likely due to the preserved branched structure of native lignin extracted under these mild conditions. For instance, HSQC signals assigned to α-O-alkyl linkages in lignin were more prominent under milder conditions than under severe conditions. These linkages together with 4-O-etherified 5–5′ linkages, which have been shown to constitute branching points in lignin40,41 are more likely to survive hydrolysis under milder conditions, and hence branching at a high Tg is observed for the D3 and D7 entries. The Tg may then drop as the lignin becomes more linear through ether bond hydrolysis at intermediate temperatures (entry D13 and sample 160 °C, 1.5% acid) and then rise again on the onset of lignin repolymerization reactions as observed for D4 and D6 entries. In any case, the physical properties of lignin can be tuned through experimental design and together with the benefits offered by the cyclic extraction in terms of lignin quality, and will be useful for gaining insights into the structure–property relationships.
Properties of the hemicellulose-rich fraction, water soluble fraction and the fibre residue
Fig. S32† shows the identity of the fractions discussed in this section. We previously reported that the hemicellulose fractions were extracted as oligomers, and constituted mainly a galactoglucomannan fraction with O-acetyl decorations. The whole fraction constitutes 17 mass% of the original material. The HSQC spectra is reported in Fig. S19,† representing that the main fraction is polysaccharides with trace signals from aromatics.44 These hemicelluloses could be used to produce platform chemicals and at the same time recover the acetic acid resulting from the post-hydrolysis of O-acetyl groups.Another fraction of interest, accounting for as much as 23% of the original fraction is the water soluble fraction (see Fig. S32†). This fraction is left as a water soluble fraction following lignin precipitation by evaporation of ethanol. The fraction constitutes mainly mono-sugars, sugar dimers and water soluble LCC molecules, all resulting from the acid hydrolysis of bonds that occurs during the cyclic extraction of lignin. These were identified by HSQC analysis, Fig. S18.† Typical aromatic- and sugar-signals are seen in the NMR spectrum. This fraction could potentially be a third stream for value-addition, pending further investigations on its purification.
Finally, a fibre residue (Fibre residue 2, Fig. S32†) was obtained constituting mainly cellulose (65–80%, Table S13†). The fraction also contains significant amounts of lignin (12–30%) and a trace amount of hemicelluloses. The overall lignin balance in this fraction (w/w%, i.e., of lignin in fraction as a percentage of lignin in original fibres) lies in the range of 10–73%. This is as expected, in agreement with the previously discussed lignin yields. The higher the yield of lignin extracted in the organosolv process, the lower the amount of lignin in the fibres.
The fibre residue was further studied by XRD analysis and was shown to be highly crystalline (Fig. S23†). Research on lignin containing cellulose nano-fibrils and crystals is of interest. It has for instance been shown that the aromatic component improves the thermal stability of such materials.45 This fraction could potentially serve in such applications pending deeper studies.
Green metrics evaluation and sustainability aspects of the consolidated lignin biorefining process
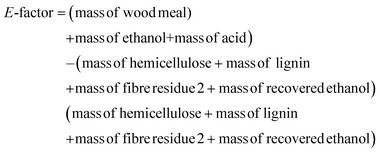
To gain some insight into the potential of this process with respect to green metrics, we have measured the environmental (E)-factor,46,47 which is in its simplest form a measure of the material recovery from the process. More complex E-factor measurement approaches are recommended for the processes in advance stages.46,47 This simplest evaluation was chosen since this process is still in the early stages of investigation. Accordingly, for our process, we selected the most interesting design points which represented a good compromise in lignin yield and lignin quality (D2, D4, D8 and 160 °C and 1.5% acid). The E-factor is calculated as follows:From the equation, it is clear that the ideal E-factor is zero and a lower E-factor is better for the environment.
Specific to our process, the E-factor is calculated as follows:
A few assumptions were made in the calculation. The first is that water is excluded from the calculation in order to allow meaningful comparisons of processes.46 Secondly, recovery of ethanol is assumed at 95% based on Aspen Plus simulations of ethanol-based organosolv processes.48
Accordingly, the E-factor for the selected samples from the DoE lies between 0.05 and 0.08. To put these values into context, we compared them to those of benchmarks which consisted of prehydrolysis kraft and sulphite pulping; two technical biomass fractionation processes. The prehydrolysis kraft process in Domsjö-Adityabirla fabrikerna located in Sweden produces dissolving pulp and biogas from the hemicellulose fraction (Fig. S33†). With this process we obtain an E-factor of approximately 1. The sulphite pulping process on the other hand produces dissolving pulp and lignosulphonate as market products (Fig. S34†). The E-factor for this process is approximately 0.5.
The biorefining process presented in this study is therefore attractive with respect to these metrics, when benchmarked against existing technical processes since the E-factor is significantly lower.
Other advantages of the process with respect to greenness and sustainability include the use of green solvents (water and ethanol), the low boiling points of the solvents which imply that they can be recovered at lower temperatures by distillation. A previous study applying Aspen Plus simulations of the ethanol-based organosolv process showed a solvent recovery efficiency of >95% through distillation.48 Furthermore, the use of catalytic rather than stoichiometric amounts of inorganics, in this case sulphuric acid, is another advantage. The potential for circularity of the process is also good since ethanol could be produced from the fibre residues, water soluble fractions and the hemicellulose fraction.
Conclusions
In our previous work, a consolidated lignin biorefinery process, where hemicellulose, lignin and fibres are collected in different streams, was developed. Focus was placed on developing a cyclic organosolv (ethanol![[thin space (1/6-em)]](https://www.rsc.org/images/entities/char_2009.gif) :
:![[thin space (1/6-em)]](https://www.rsc.org/images/entities/char_2009.gif) water) extraction process to obtain pure lignin that was less degraded.
water) extraction process to obtain pure lignin that was less degraded.
In the present work, the cyclic extraction step is evaluated in more detail in order to gain a fundamental understanding that could form a rationale for a single tuneable process to produce lignin with targeted chemical- and physical-properties. For this purpose, a design of experiment (DoE) approach was adopted as a tool to investigate the effect of the selected parameters by including linear, quadratic and interaction effects in a multiple linear regression (MLR) model. The process of tuning the lignin structure was demonstrated by DoE in combination with chemometrics. Irrespective of the conditions used within the boundaries of the experiment, the known lignin inter-units, analysed by HSQC and quantitative 13C NMR, accounted for 66–82% of the theoretically calculated inter-units in the extracted lignins, confirming that the cyclic lignin extraction process was superior for the preservation of the lignin structure when compared with benchmark organosolv (Alcell) and kraft processes. Furthermore, fundamental insights into structural changes and how these may affect some of the molecular properties are discussed.
DSC analysis of selected lignins showed that Tgs of lignin extracted at milder temperatures were similar to those extracted at high temperatures but higher than that of lignins obtained at intermediate temperatures. These differences were explained by molecular branching, linearity and molar mass effects.
Overall, the work demonstrates the potential to tune lignin's chemical and physical properties by DoE using a green cyclic extraction approach and has underpinning for lignin valorisation.
Author contributions
M. Lawoko supervised the work. M. Karlsson designed and performed the DoE experiments, and performed the NMR, SEC and DSC characterization. Vijaya and Raghu performed the sugar and klason lignin experiments. All authors contributed to the data analysis. M. Lawoko and M. Karlsson wrote the first draft of the manuscript. All authors contributed to the final version of the manuscript.Conflicts of interest
There are no conflicts of interest to declare.Acknowledgements
The work was financed by the Knut and Alice Wallenberg (KAW) foundation. The authors want to acknowledge Pär A. Lindén for assisting in the Bruker 400 DMX NMR experiments.References
- J. J. Bozell and M. K. Patel, Feedstocks for the Future, American Chemical Society, Washington, DC, 2006.
- P. Manzanares, Acta Innovations, 2020 Search PubMed.
- E. Ahmad and K. K. Pant, in Waste Biorefinery, Elsevier, 2018, pp. 409–444 Search PubMed.
- S. Gillet, M. Aguedo, L. Petitjean, A. Morais, A. da Costa Lopes, R. Łukasik and P. Anastas, Green Chem., 2017, 19, 4200–4233 RSC.
- F. Öhman, H. Theliander, P. Tomani and P. Axegard, (LignoBoost), US 8486224B2, 2006.
- F. S. Chakar and A. J. Ragauskas, Ind. Crops Prod., 2004, 20, 131–141 CrossRef CAS.
- T. N. Kleinert, US3585104A, 1971.
- M. Graglia, N. Kanna and D. Esposito, ChemBioEng Rev., 2015, 2, 377–392 CrossRef.
- E. K. Pye and J. H. Lora, Tappi J., 1991, 74, 113–118 CAS.
- R. A. Young and M. Akhtar, Environmentally friendly technologies for the pulp and paper industry, John Wiley & Sons, 1997 Search PubMed.
- Y. Liu, S. Carriero, K. Pye and D. S. Argyropoulos, ACS Publications, 2000.
- H. E. Fisher, M. Kulka and H. Hibbert, J. Am. Chem. Soc., 1944, 66, 598–601 CrossRef CAS.
- D. M. Miles-Barrett, A. R. Neal, C. Hand, J. R. D. Montgomery, I. Panovic, O. S. Ojo, C. S. Lancefield, D. B. Cordes, A. M. Z. Slawin, T. Lebl and N. J. Westwood, Org. Biomol. Chem., 2016, 14, 10023–10030 RSC.
- X. Luo, Y. Li, N. K. Gupta, B. Sels, J. Ralph and L. Shuai, Angew. Chem., Int. Ed., 2020, 59, 11704–11716 CrossRef CAS PubMed.
- D. S. Zijlstra, J. de Korte, E. P. de Vries, L. Hameleers, E. Wilbers, E. Jurak and P. J. Deuss, Front. Chem., 2021, 9, 329 Search PubMed.
- L. Shuai, M. T. Amiri, Y. M. Questell-Santiago, F. Héroguel, Y. Li, H. Kim, R. Meilan, C. Chapple, J. Ralph and J. S. Luterbacher, Science, 2016, 354, 329–333 CrossRef CAS PubMed.
- W. Lan, M. T. Amiri, C. M. Hunston and J. S. Luterbacher, Angew. Chem., 2018, 130, 1370–1374 CrossRef.
- R. Vendamme, J. Behaghel de Bueren, J. Gracia-Vitoria, F. Isnard, M. M. Mulunda, P. Ortiz, M. Wadekar, K. Vanbroekhoven, C. Wegmann, R. Buser, F. Héroguel, J. S. Luterbacher and W. Eevers, Biomacromolecules, 2020, 21, 4135–4148 CrossRef CAS PubMed.
- Y. Li, B. Demir, L. M. Vázquez Ramos, M. Chen, J. A. Dumesic and J. Ralph, Green Chem., 2019, 21, 3561–3572 RSC.
- T. Renders, G. Van den Bossche, T. Vangeel, K. Van Aelst and B. Sels, Curr. Opin. Biotechnol., 2019, 56, 193–201 CrossRef CAS PubMed.
- P. J. Deuss, K. Barta and J. G. de Vries, Catal. Sci. Technol., 2014, 4, 1174–1196 RSC.
- T. V. Lourençon, L. G. Greca, D. Tarasov, M. Borrega, T. Tamminen, O. J. Rojas and M. Y. Balakshin, ACS Sustainable Chem. Eng., 2020, 8, 1230–1239 CrossRef.
- M. Galbe and O. Wallberg, Biotechnol. Biofuels, 2019, 12, 1–26 CrossRef PubMed.
- M. Karlsson, N. Giummarella, P. A. Lindén and M. Lawoko, ChemSusChem, 2020, 13, 4666–4677 CrossRef CAS PubMed.
- R. Leardi, Anal. Chim. Acta, 2009, 652, 161–172 CrossRef CAS PubMed.
- G. E. Box and D. W. Behnken, Technometrics, 1960, 2, 455–475 CrossRef.
- T. Lundstedt, E. Seifert, L. Abramo, B. Thelin, Å. Nyström, J. Pettersen and R. Bergman, Chemom. Intell. Lab. Syst., 1998, 42, 3–40 CrossRef CAS.
- D. Argyropoulos, Res. Chem. Intermed., 1995, 21, 373 CrossRef CAS.
- A. Granata and D. S. Argyropoulos, J. Agric. Food Chem., 1995, 43, 1538–1544 CrossRef CAS.
- M. Sette, R. Wechselberger and C. Crestini, Chem. – Eur. J., 2011, 17, 9529–9535 CrossRef CAS PubMed.
- SCAN-CM 71:09, Pulps – Carbohydrate content Scandinavian Pulp, Paper and Board testing Committee, Stockholm, Sweden, SCAN standards, 2009 Search PubMed.
- TAPPI T 222 om-02, Acid insoluble lignin in wood and pulp, TAPPI standards, 2002 Search PubMed.
- S. Azhar, G. Henriksson, H. Theliander and M. E. Lindström, Carbohydr. Polym., 2015, 117, 19–24 CrossRef CAS PubMed.
- S. Cao, Y. Pu, M. Studer, C. Wyman and A. J. Ragauskas, RSC Adv., 2012, 2, 10925–10936 RSC.
- H. Nimz, Angew. Chem., Int. Ed. Engl., 1966, 5, 843–843 CrossRef.
- M. R. Sturgeon, S. Kim, K. Lawrence, R. S. Paton, S. C. Chmely, M. Nimlos, T. D. Foust and G. T. Beckham, ACS Sustainable Chem. Eng., 2014, 2, 472–485 CrossRef CAS.
- K. Shimada, S. Hosoya and T. Ikeda, J. Wood Chem. Technol., 1997, 17, 57–72 CrossRef CAS.
- J. Li and G. Gellerstedt, Ind. Crops Prod., 2008, 27, 175–181 CrossRef CAS.
- T. Kobayashi, B. Kohn, L. Holmes, R. Faulkner, M. Davis and G. E. Maciel, Energy Fuels, 2011, 25, 1790–1797 CrossRef CAS.
- M. Balakshin, E. A. Capanema, X. Zhu, I. Sulaeva, A. Potthast, T. Rosenau and O. J. Rojas, Green Chem., 2020, 22, 3985–4001 RSC.
- I. Sapouna and M. Lawoko, Green Chem., 2021, 23, 3348–3364 RSC.
- D. Roberts, in Methods in lignin chemistry, ed. S. Y. L. a. C. W. Dence, Springer, 1992, p. 264 Search PubMed.
- N. Giummarella, P. r. A. Lindén, D. Areskogh and M. Lawoko, ACS Sustainable Chem. Eng., 2019, 8, 1112–1120 CrossRef.
- N. Giummarella and M. Lawoko, ACS Sustainable Chem. Eng., 2017, 5, 5156–5165 CrossRef CAS.
- C. M. Ewulonu, X. Liu, M. Wu and H. Yong, J. Bioresour. Bioprod., 2019, 4, 3–10 CrossRef CAS.
- R. A. Sheldon, Catal. Today, 2011, 167, 3–13 CrossRef CAS.
- C. T. Matos, L. Gouveia, A. R. C. Morais, A. Reis and R. Bogel-Łukasik, Green Chem., 2013, 15, 2854–2864 RSC.
- M. González, Á. Tejado, C. Peña and J. Labidi, Ind. Eng. Chem. Res., 2008, 47, 1903–1909 CrossRef.
Footnote |
| † Electronic supplementary information (ESI) available. See DOI: 10.1039/d1gc04171a |
| This journal is © The Royal Society of Chemistry 2022 |

