 Open Access Article
 This Open Access Article is licensed under a
 Creative Commons Attribution 3.0 Unported Licence
Enzymatic X-ray absorption spectroelectrochemistry†
Karolina
Cząstka
a,
Alaa A.
Oughli
b,
Olaf
Rüdiger
 *a and
Serena
DeBeer
*a
*a and
Serena
DeBeer
*a
aMax Planck Institute for Chemical Energy Conversion, Mülheim an der Ruhr, DE, Germany. E-mail: serena.debeer@cec.mpg.de; olaf.ruediger@cec.mpg.de
bTechnical University Munich, Campus Straubing for Biotechnology and Sustainability, Uferstraße 53, 94315 Straubing, Germany
First published on 13th December 2021
Abstract
The ability to observe the changes that occur at an enzyme active site during electrocatalysis can provide very valuable information for understanding the mechanism and ultimately aid in catalyst design. Herein, we discuss the development of X-ray absorption spectroscopy (XAS) in combination with electrochemistry for operando studies of enzymatic systems. XAS has had a long history of enabling geometric and electronic structural insights into the catalytic active sites of enzymes, however, XAS combined with electrochemistry (XA-SEC) has been exceedingly rare in bioinorganic applications. Herein, we discuss the challenges and opportunities of applying operando XAS to enzymatic electrocatalysts. The challenges due to the low concentration of the photoabsorber and the instability of the protein in the X-ray beam are discussed. Methods for immobilizing enzymes on the electrodes, while maintaining full redox control are highlighted. A case study of combined XAS and electrochemistry applied to a [NiFe] hydrogenase is presented. By entrapping the [NiFe] hydrogenase in a redox polymer, relatively high protein concentrations can be achieved on the electrode surface, while maintaining redox control. Overall, it is demonstrated that the experiments are feasible, but require precise redox control over the majority of the absorber atoms and careful controls to discriminate between electrochemically-driven changes and beam damage. Opportunities for future applications are discussed.
Introduction
Enzymatic X-ray absorption spectroscopy
X-ray absorption spectroscopy (XAS) has had a longstanding and an important impact on our understanding of metalloenzyme active sites.3–14 In particular, the extended X-ray absorption fine structure (EXAFS) region of the spectrum is well known for having provided the first experimental measurements of the metal–ligand bond distances in the complex FeMo-cofactor of nitrogenase11,14–16 and in the Mn4CaO5 oxygen evolving complex (OEC) of photosystem II (PSII).17,18 While in both cases, the EXAFS data could not provide a definitive three-dimensional topological model, for both systems, EXAFS was able to provide average metal–ligand bond distances with high accuracy (∼0.02 Å) and importantly, several decades before the first crystal structures of either enzyme was reported.19,20Much of the power of XAS lies in its ability to provide element specific information about changes in the oxidation state and the metrical parameters of a given photoabsorber. For instance, XAS has been utilized at both the Mo and Fe K-edges in order to obtain geometric and electronic structural information about the FeMo-cofactor and correspondingly at the Mn and Ca K-edges for the OEC.21–32 The resultant data provide information about the average oxidation state of each metal and the identity, coordination number and distances of the ligands coordinated to the selected metal, allowing for a relatively detailed picture of the active site geometric and electronic structure to be derived. As such, XAS is of particular utility for the characterization of reactive intermediates in an enzyme’s catalytic cycle. The OEC of PSII is perhaps the most well-characterized example, in large part because laser flashing allows one to discretely advance from the resting state to the various intermediate “S states” of the catalytic cycle.33 However, in addition to the OEC, the intermediates in a wide range of metalloproteins have been characterized by XAS. These include the Fe and Mo sites of nitrogenase intermediates,34,35 the binuclear iron sites in soluble methane monooxygenase36,37 and ribonucleotide reductases,38–41 the trinuclear copper site in laccase,42 and the Ni site in methyl coenzyme M reductase,43 to name only a few. In almost all cases, the enzymes are prepared utilizing freeze quench methods to stop the reaction at a desired time point and enable the measurement of the XAS in the frozen state (most typically at LN2 or LHe temperatures). Measurements of enzymes at cryogenic temperatures are particularly desirable as this helps limit the rate of X-ray beam induced radiation damage. Low temperatures also limit the thermal disorder contributions, thus simplifying the analysis of EXAFS data. While such an approach has led to the characterization of numerous enzyme intermediates, it is limited by the fact that it does not capture the dynamics of an operating catalyst. In this regard, XAS studies of enzymes under operating conditions are of great interest. While operando XAS of heterogeneous catalysts has seen increasing application in recent years,44–46 applications to enzymes remain very limited.47 One area of potentially great utility for operando XAS studies of enzymes is the application of spectroelectrochemistry (SEC). In the next sections, we provide a brief overview of the motivation for SEC, the advantages of combining SEC with XAS (XA-SEC) and the challenges associated with it. We then describe recent literature reports of XA-SEC to enzymes and molecular models and report our own recent application of XA-SEC to the enzyme hydrogenase. Finally, we provide a road map for future applications of XA-SEC to enzymes, with an emphasis on sample requirements and optimizing experimental design. We hope that this discussion will provide the scientific community with key principles to help guide the design of future XA-SEC experiments.
Spectroelectrochemistry: challenges and opportunities
Spectroelectrochemistry is a technique that combines two classical methods, electrochemistry and spectroscopy. The first concept of a spectroelectrochemical experiment was reported over 50 years ago,48 and since that time a large variety of spectroscopic methods combined with electrochemistry have been reported.49–53 Spectroscopic techniques include for example UV/Vis,48,51,54 Raman,51,55,56 IR,55,57–66 and X-ray based spectroscopic techniques.44,67–69 Less commonly developed spectroelectrochemical methods involve EPR,51,56,60 and NMR.70 Electrochemistry by itself is a technique that enables one to determine reaction kinetics, the catalytic activity, and to understand the stability of the system and its behavior towards substrates or inhibitors under the reaction conditions. Nevertheless, electrochemistry only provides activity measurements. Hence, in order to obtain information about the electronic and geometric changes that take place in an operating catalytic system, electrochemistry may be utilized in combination with spectroscopic techniques, as noted above. Accordingly, a spectroelectrochemical experiment can provide a collaborative outcome between spectroscopic and electrical signals that helps to explain the process occurring at the electrode. Therefore, spectroelectrochemical experiments can enable a more qualitative, and in some cases quantitative, picture of the thermodynamic, molecular, and mechanistic aspects of the system under study.Despite these clear advantages, spectroelectrochemistry also presents several limitations. While the low sensitivity of electrochemical methods allows for fast or even extremely fast measurements, these low concentrations result, in most cases, in long spectroscopic measurement times. Another limitation at the moment of writing this manuscript, is that there are very few commercial spectroelectrochemical setups available. Hence, usually each spectroscopic technique requires the design of a specialized spectroelectrochemical cell, which might impose non-ideal electrode geometries, electrolyte composition, volume, etc. Moreover, the choice of solvents, supporting electrolytes, and electrode materials can be limited by the requirements of the spectroscopic methods. Another limitation to be considered in SEC, is that the incident electromagnetic radiation can cause physical and chemical changes to the sample, which are not related to pure electrochemical processes. This is particularly relevant for X-ray spectroscopy, where sample damage induced by the incident beam may cause the formation of the species which are unrelated to the actual mechanism, but may nevertheless affect the electrochemical results. This requires carefully designed experimental protocols, which will be discussed further in a subsequent section.
Given the many advantages of SEC and the ability of XAS to provide element specific access to changes in geometric and electronic structure, the appeal of XA-SEC is clear. However, for the study of enzymes, X-ray absorption SEC can be particularly challenging. For homogeneous catalysts in solution, one possible way of performing SEC is by bulk electrolysis. This works well with small molecules, but such experiments become very inefficient for large and slowly diffusing enzymes, making the use of redox mediators a requirement. If one is aiming to study a catalytic system under turnover conditions, having enzyme, substrate and mediators freely diffusing will result in most of the cases, in a very complex system to analyze, or require impractical amounts of enzyme. A possible solution is to immobilize the enzyme on the electrode surface in a configuration where direct electron transfer (DET) between enzyme and electrode can be established. This technique, called protein film electrochemistry (PFE), can be used in combination with spectroscopy, but it introduces additional challenges to the experiment. The main limitation of combining PFE with spectroscopy, especially when the spectroscopic technique aims at the metal center of the enzyme, is that the relatively large molecular weight of the protein backbone imposes a limitation on the maximum concentration of absorber that can be reached on the electrode surface. PFE on flat electrode surfaces usually are in the range of a few picomol cm−2 of enzyme,71,72 well below the detection limit of a typical XAS experiment. Porous or nanostructured electrodes can be used to compensate for the low enzyme coverage. Another important aspect to consider when combining PFE with SEC, is that the signal response to the applied potential will be proportional to the amount of enzyme that is within a direct electron transfer regime.73,74 This is not trivial for many enzymes, where the electrons will tunnel to the enzyme only when the enzyme is adequately oriented on the electrode surface. It is therefore desirable to efficiently wire the enzyme to the electrode to maximize the changes in the spectra induced by the applied potential. This is particularly relevant for XAS experiments, where the expected shifts on the absorption edge can, in some cases, be very subtle. Porous electrodes, carbon nanotubes, and conductive polymers can be used to favor electron transfer between enzymes and the electrode and should be considered when planning SEC. The final challenge imposed in XA-SEC experiments on enzymes is that, in order to achieve operando conditions, the measurements usually have to be carried in liquid water-based electrolyte, which typically means room temperature or minimally above freezing. Many enzymes, and in particular their active sites, are sensitive to X-ray photodamage, which can be minimized by measuring frozen samples at cryogenic temperatures, which is clearly not possible in operando SEC studies. As a result, very few XA-SEC experiments have been reported in bioinorganic chemistry. In the next sections, we briefly review the cases where XAS and electrochemistry experiments have been reported on enzymes and molecular catalysts.
XA-SEC in the literature
XAS is often used in combination with electrochemical measurements for studies on heterogeneous catalysts, and several recent reviews have summarized the field of in situ and operando XA-SEC.44–46 In contrast, only relatively few reports of XA-SEC on molecular or enzymatic catalysts have been published to date. Here, we briefly review these reports.One of the first XA-SEC studies on a molecular system came from Pushkar and co-workers,75 where they measured a Ru(bda) catalyst (bda is 2,2′-bipyridine-6,6′-dicarboxylate) that is catalytically active for the oxygen evolution reaction. They immobilized the catalyst on a porous indium tin oxide (ITO). Their in situ Ru K-edge EXAFS analysis allowed for the detection and characterization of the key 7-coordinate Ru(V)![[double bond, length as m-dash]](https://www.rsc.org/images/entities/char_e001.gif) O intermediate state.
O intermediate state.
Recently, Crespilho and co-workers47 reported an operando XAS study of bilirubin oxidase from Myrothecium verrucaria (MvBOD). They illustrated the evolution of a redox reaction by probing the Cu K-edge of this copper-containing oxidoreductase. The protein was absorbed on a carbon nanoparticle mesoporous electrode in order to increase the protein coverage on the electrode. XA-SEC measurements provided valuable information about the Cu ions within the enzymatic structure of MvBOD and shed light on its role in the catalytic activity for the oxygen reduction reaction, highlighting the importance of doing these experiments under spectroelectrochemical operando conditions.
In another study, Bhattacharyya et al.,76 reported operando XAS of heme-based biomolecules. They performed Fe K-edge XAS studies in homogenous conditions under electrochemical control simultaneously measuring cyclic voltammetry. They identified that the axial coordination and spin state of the iron active center are closely related to the redox response. Nevertheless, it is clear that these measurements posed experimental challenges. Close inspection of the reported data indicate that proper normalization of the Fe K-edge spectra could not be achieved and thus make it difficult to assess whether the observed differences are due to changes induced by the applied potential and/or differences in the background/normalization.
In another study, Liang and co-workers77 published an in situ/operando XAS study of nickel phthalocyanime (NiPc) supported on carbon nanotubes as molecularly dispersed electrocatalysts (MDEs) that are active for CO2 reduction to CO. Their Ni K-edge XAS analysis allowed them to understand how molecular engineering modulates the electrocatalytic properties of NiPc MDEs. Furthermore, they were able to identify a reduction site, where the first step reduction was located on the phthalocyanine ligand, whereas the second reduction was partially on the Ni center.
Lassalle-Kaiser et al., designed a transmission cell for time-resolved XAS under electrochemical control.78 Combined with a fast scanning monochromator, they could monitor the changes on a Fe solution, with good signal-to-noise spectra for measuring times as short as 5 s, but with the limitation of using a 20 mM Fe solution, a concentration that cannot be reached with most enzymes.78
We have also shown that in situ XAS can be used to identify reactive intermediates on a molecular Ru water oxidation complex, using a XA-SEC cell to titrate complexes in solution while measuring XAS.79 The extremely reactive nature of the Ru(V) intermediate required low temperatures and rapid collecting methods. Additionally, given the broad nature of the spectra at the Ru K-edge, we complemented the results with EPR spectroscopy.79
The lack of more XA-SEC studies on molecular and enzymatic systems are indicative of how challenging these experiments are. Further development of this technique is necessary, so that in the future it can be utilized in a more routine and straightforward manner. This need motivated the XA-SEC studies on [NiFe] hydrogenase, which are reported in the section that follows.
Brief introduction to [NiFe] hydrogenases
Since [NiFe] hydrogenases are well studied using different spectroscopic, as well as spectroelectrochemical techniques,80 we used this enzyme as a model system to see if we could observe electronic and geometric changes that occur during electrocatalysis by utilizing XAS spectra. The possibility of loading the enzyme into a redox polymer allows the enzyme surface concentration to be increased81 in order to enable its detectability by XAS.In this brief introduction to [NiFe] hydrogenases, we want to highlight the most relevant aspects for understanding the measured X-ray spectra. Hydrogenases catalyze the H2 oxidation in a reversible manner.1,82 The active site of [NiFe] hydrogenases (Fig. 1A), consists of a sulfur bridged bimetallic mixed Ni–Fe active-center with an open coordination site on the Ni ion, where the substrates (H2 and H+), as well as inhibitors (O2, CO) can bind. The Ni ion is coordinated by four cysteinyl thiolate ligands, where two of them are bridging to the iron ion and two others are bound to the Ni in a terminal fashion. The iron ion is coordinated by three diatomic inorganic ligands (CO and CN−) forming octahedral site symmetry.2 The bridging ligand coordinating to the Ni and the Fe changes identity depending on the redox state of the enzyme. [NiFe] hydrogenases contain chain iron sulfur clusters, which link the active site electronically with the surface of the protein, allowing for fast electron transfer (ET) during catalysis. The Fe ion remains formally in a divalent configuration throughout the catalytic cycle.
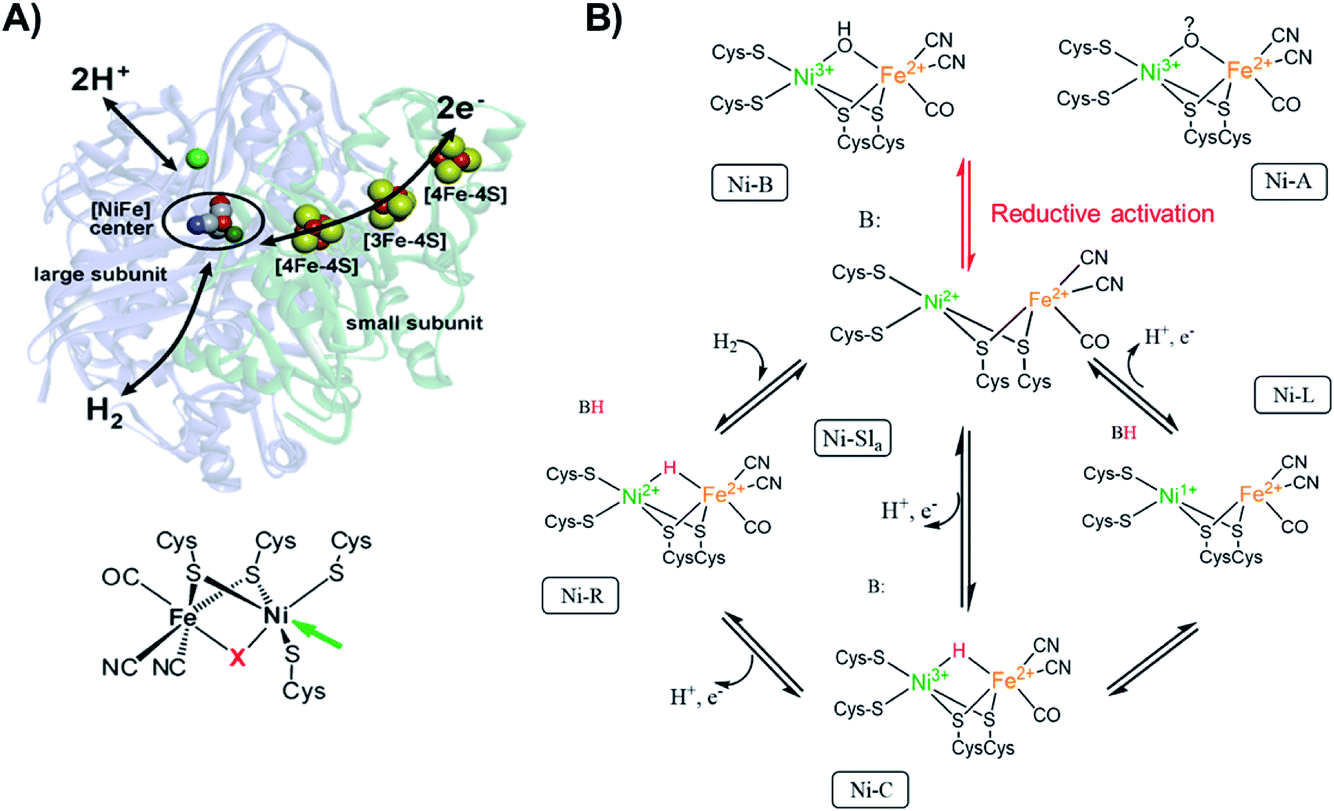 | ||
Fig. 1 (A) [NiFe] hydrogenase from DvMF![[thin space (1/6-em)]](https://www.rsc.org/images/entities/char_2009.gif) 1 with schematically indicated electron transfer chain (via iron-sulfur clusters), and pathways for the hydrogen and the proton transfer. The green sphere above the active center corresponds to the Mg ion. On the bottom, the chemical structure of the active site of [NiFe] hydrogenase. The arrow indicates the open metal coordination site, X corresponds to the bridging ligand that changes identity during catalytic activity. Adapted with permission from Lubitz, et al., “Hydrogenases”, Chem. Rev., 2014, 114(8), 4081. Copyright 2014 American Chemical Society.2 (B) Proposed inactivation/reactivation process (red arrows) and catalytic cycle (black arrows) for [NiFe] hydrogenases. The activation of Ni-A and Ni-B goes through the Ni-SU and Ni-Sir intermediates, which have been left out of the figure for clarity. The initial acceptor of the proton from heterolytic H2 cleavage remains unclear, thus here a generic proton-acceptor is presented as B. 1 with schematically indicated electron transfer chain (via iron-sulfur clusters), and pathways for the hydrogen and the proton transfer. The green sphere above the active center corresponds to the Mg ion. On the bottom, the chemical structure of the active site of [NiFe] hydrogenase. The arrow indicates the open metal coordination site, X corresponds to the bridging ligand that changes identity during catalytic activity. Adapted with permission from Lubitz, et al., “Hydrogenases”, Chem. Rev., 2014, 114(8), 4081. Copyright 2014 American Chemical Society.2 (B) Proposed inactivation/reactivation process (red arrows) and catalytic cycle (black arrows) for [NiFe] hydrogenases. The activation of Ni-A and Ni-B goes through the Ni-SU and Ni-Sir intermediates, which have been left out of the figure for clarity. The initial acceptor of the proton from heterolytic H2 cleavage remains unclear, thus here a generic proton-acceptor is presented as B. | ||
The active site changes in [NiFe] hydrogenases thus occur largely on the Ni ion (Fig. 1B), which changes its oxidation state and geometry during catalysis. The [NiFe] hydrogenase from DvMF is oxygen sensitive, but in its inactive form (Ni-A and Ni-B) is oxygen resistant. The Ni in these oxidized states is in a trivalent Ni electronic configuration organized in distorted square-pyramidal (C4v) geometry.83,84 Upon one-electron reduction the activation occurs, resulting in an active Ni-Sla with a divalent Ni ion.85 The first step of the catalytic cycle is the reaction of H2 with Ni-SIa state, which results in heterolytic H2 cleavage to generate the Ni-R state with a bridging hydride in the [Ni(II)Fe(II)] active site, where Ni is organized in a distorted square-planar geometry (D4h).86 In the next step of the catalytic cycle, one proton and one electron is removed, forming the Ni-C intermediate, which retains a bridging hydride in the [Ni(III)Fe(II)] active site and consists of an [4Fe4S]1+ cluster.2 The final step of the catalytic cycle is believed to be a proton and ET from the bridging hydride in the Ni-C resulting in the Ni-L intermediate formation (with [Ni(I)Fe(II)] active site configuration with an open bridge position)87 and finally regenerating the Ni-SIa state.88
Results and discussion
Operando XAS study of Desulfovibrio vulgaris Miyazaki F [NiFe] hydrogenase in a redox polymer matrix
Before performing the operando measurements, it is important to first establish the changes that may be expected during the catalytic cycle by measuring reference samples. In order to do this the reference samples 1, 2, and 3 were first characterized by FTIR. FTIR characterization of the reference frozen solution of [NiFe] hydrogenase was carried out to quantify the relative distribution of redox states contributing to each of the three samples. Through using FTIR, CO and CN− ligands coordinated directly to the iron ion at the active center of [NiFe] hydrogenase were probed. These ligands are very sensitive to the electronic changes at the active center of [NiFe] hydrogenase due to their strong π-accepting character (with decreasing oxidation state at the [NiFe] hydrogenase active center greater back-donation of the charge from metal to ligand occurs, hence causing the CN and CO stretching modes to shift to lower frequencies). Thus, by FTIR spectra indirect information about the oxidation state of the metals at the active center can be derived. The band positions for the different redox states of the Desulfovibrio vulgaris Miyazaki F (DvMF) [NiFe] hydrogenase have been identified and assigned previously.89The area under the FTIR spectral peaks has been used to estimate the sample composition. For the as isolated sample 1 (Fig. 2), it was found that two intermediate states were present, with 81% Ni-B and 19% Ni-Slr (Table 1). Upon enzyme incubation in H2 (sample 2, Fig. 2) 70% of Ni-R, 25% of Ni-C, and 5% of Ni-Slr were present. [NiFe] hydrogenase reduced with viologen (E = −300 mV vs. SHE) and NaDT (with the redox couple potential of −420 mV vs. SHE at pH 7, sample 3) yields Ni-C (∼70%), and Ni-R (∼25%), and very little (5%) Ni-Slr. Furthermore, based on this FTIR-derived sample composition, the average oxidation state at the Ni center is 2.78, 2.25, and 2.70 (Table 1) for sample 1, 2, and 3, respectively. This analysis is based on assuming formal trivalent oxidation states for Ni-B and Ni-C, and formal divalent oxidation states for Ni-R and Ni-SIr, as summarized in Table 1. Based on the sample compositions, we thus expect changes in both the Ni oxidation state, coordination number, and local site symmetry, which should be observable by Ni K-edge XAS.
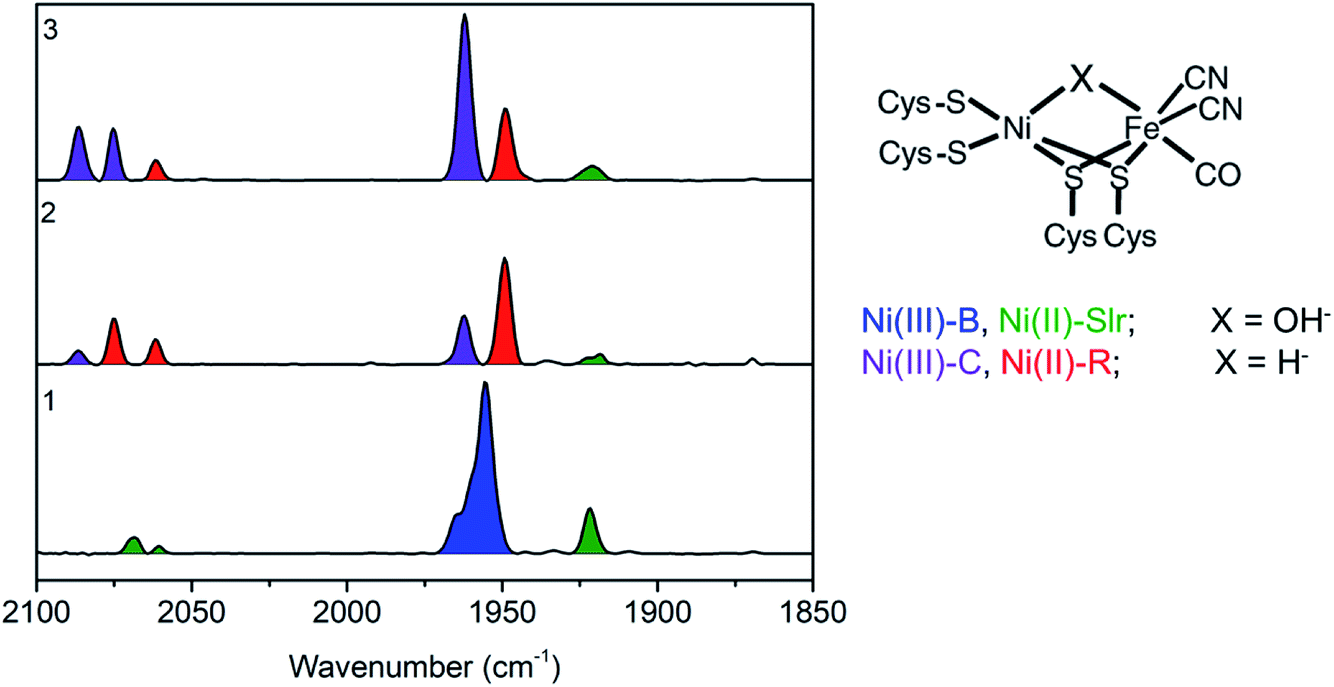 | ||
| Fig. 2 (Left) Baseline corrected FTIR spectra of a DvMF [NiFe] hydrogenase as isolated 1, incubated 4 hours in H2 atmosphere 2, and in 15 μl of viologen and 40 μl NaDT 3. Band positions for the different state are as follows: Ni(III)-B (1955, 2081, and 2090 cm−1), Ni(II)-Slr (1922, 2061, 2070 cm−1), Ni(III)-C (1961, 2074, 2085 cm−1), Ni(II)-R (1948, 2061, 2074 cm−1). (Right) Schematic representation of DvMF [NiFe] hydrogenase active site, where X is identified for each redox state. | ||
| Sample | Ni(III)-B C4v | Ni(III)-C D2d | Ni(II)-R D4h | Ni(II)-SlrC4v | Average oxidation state at Nia |
|---|---|---|---|---|---|
a The average oxidation state at Ni was derived using the following formula: 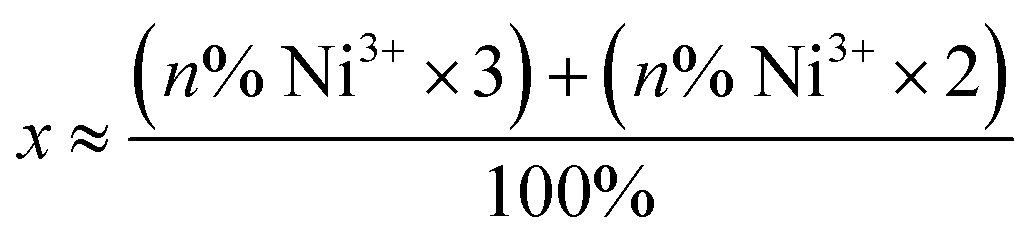 , where n is the sum of the percentage of quantified [NiFe] hydrogenase intermediates where Ni is in the trivalent or divalent electronic configuration. , where n is the sum of the percentage of quantified [NiFe] hydrogenase intermediates where Ni is in the trivalent or divalent electronic configuration.
|
|||||
| 1 | 81% | 19% | 2.78 | ||
| 2 | 25% | 70% | 5% | 2.25 | |
| 3 | 70% | 25% | 5% | 2.70 | |
Fig. 3 shows the Ni K-edge XAS of 1, 2 and 3. While differences are observed, the Ni(II) rich sample 2 actually has the highest energy pre-edge and rising edge feature, while the Ni(III) rich complexes 1 and 3 have lower energy pre-edge and rising edge features (Table 2). This is due to the cancelling effects of changes in oxidation and site symmetry (as discussed in the ESI†) and highlights the importance of measuring reference samples to highlight the expected limits that may be observed during XA-SEC.
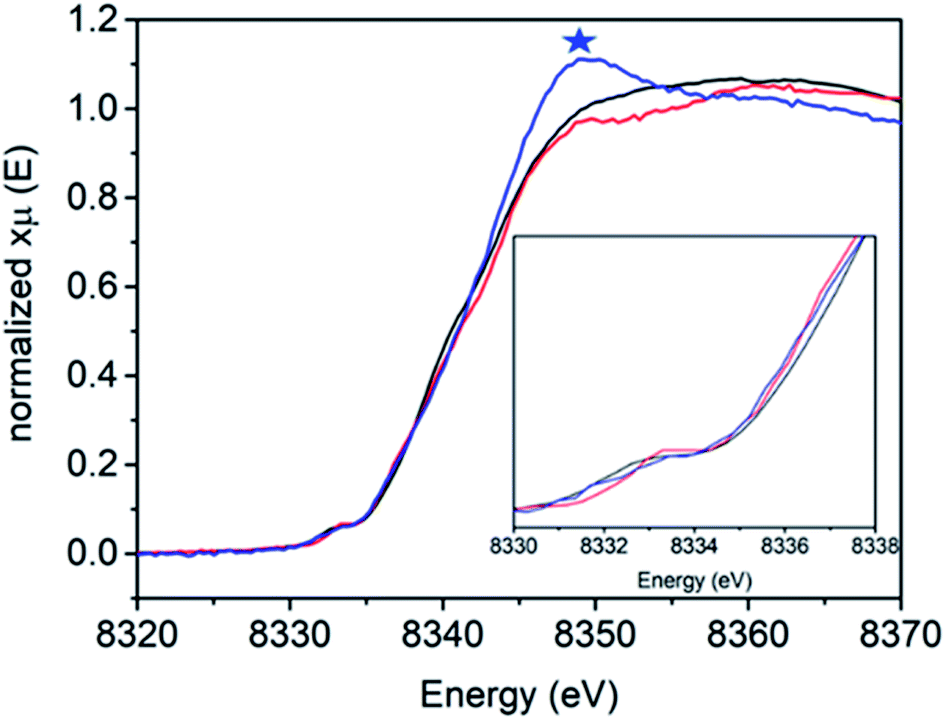 | ||
| Fig. 3 Ni K-edge XAS spectra of [NiFe] hydrogenase from DvMF as isolated 1 (black line), incubated 4 hours with H22 (red line) and reduced with NaDT/viologen 3 (blue line) measured at 10 K at SSRL 9-3 beamline. Blue asterisk corresponds to the energy edge at 8339 eV energy. | ||
| Sample | 1s → 3d pre-edge energy (eV) | Edge energy (E0, eV) | Edge energy at half-height (eV) |
|---|---|---|---|
| 1 | 8331.9 | 8338.7 | 8340.5 |
| 2 | 8332.3 | 8339.1 | 8340.9 |
| 3 | 8332.0 | 8341.7 | 8341.8 |
Operando XAS spectroelectrochemistry
[NiFe] hydrogenase entrapped in the redox polymer on a GC electrode (Fig. 4, pink line) exhibits one pre-edge feature at 8333.0 eV. The Ni K-edge arises at 8342.8 eV (Table 3). The observed changes in shape and the intensity of the Ni K-edge of hydrogel film indicate that the local geometry of the Ni active center is modulated upon electrode preparation, as compared to reference sample 1, suggesting a more distorted tetrahedral configuration (Td).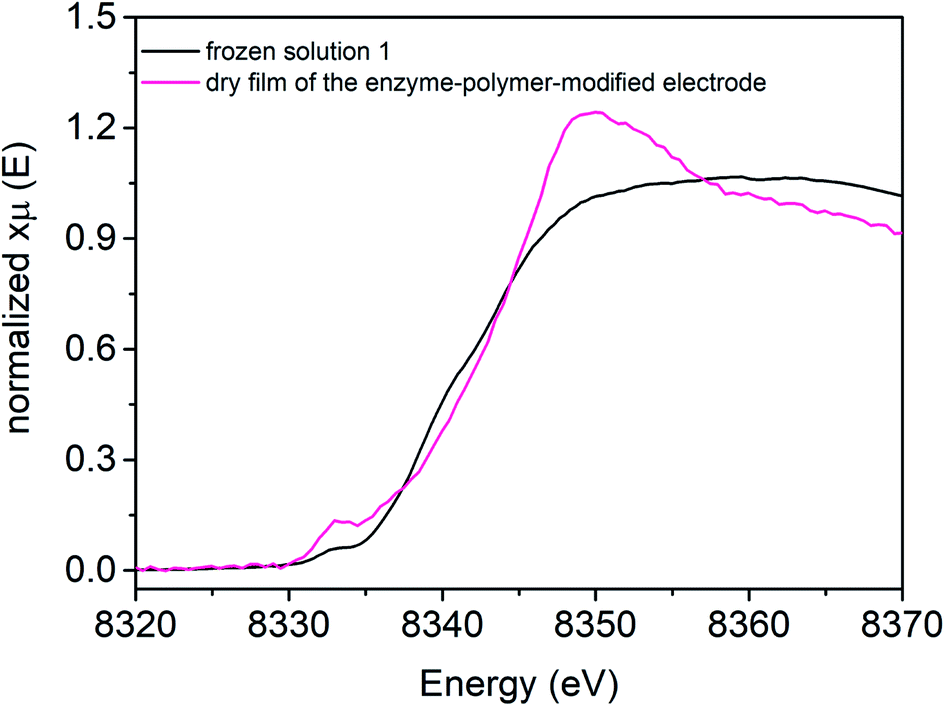 | ||
| Fig. 4 Ni K-edge XAS spectra collected at 298 K at SAMBA Soleil beamline for a hydrogel film with [NiFe] hydrogenase from DvMF on GC electrode (pink line), and reference frozen solution of 1 (black line) measured at 10 K at SSRL 9-3 beamline. | ||
| Conditions of X-ray studies | Edge energy (E0, eV) | Edge energy at half-height (eV) | Edge intensity at 8349 eV |
|---|---|---|---|
| Dry hydrogel film | 8342.8 | 8343.0 | 1.24 |
| OCP, H2 | 8341.8 | 8342.5 | 1.22 |
| E = +200 mV vs. SHE, H2 | 8342.0 | 8342.3 | 1.20 |
| E = −400 mV vs. SHE, H2 | 8340.9 | 8341.1 | 1.12 |
| E = −150 mV vs. SHE, H2 | 8341.4 | 8342.5 | 1.23 |
| E = +200 mV vs. SHE, H2 | 8342.0 | 8342.3 | 1.20 |
The Ni K-edge XAS spectrum of the DvMF [NiFe] hydrogenase-polymer-modified electrode at open circuit potential (OCP), in phosphate buffer pH 7 saturated with H2 is shown in Fig. 5. The spectra were measured after 1 hour of H2 saturated electrolyte flow to activate and let the polymer equilibrate with the buffer. Ni K-edge XAS collected at OCP and H2 flow exhibit a pre-edge feature at 8333.0 eV. The pre-edge intensity subtly increases and the edge shifts 1.0 eV toward lower energy (Fig. 5, Table 3 and ESI, Fig. S6†), and its intensity slightly decreases indicating a similar trend observed for the frozen solution of [NiFe] hydrogenase incubated for 4 hours with H2 (Fig. 3). However, the shape of the edge line is still sharper than those observed for the reference sample. The observed Ni K-edge may be a result of a shorter enzyme contact time with H2, or that the enzyme in the presence of the viologen polymer experiences a different redox potential and therefore the ratio of states is different than under H2 without the polymer. The spectroelectrochemical experiment started at +200 mV where catalytic current for H2 oxidation was observed (Fig. 5B and C). The Ni K-edge spectrum at this high potential shows a subtle shift (∼0.2 eV) towards higher energy on the Ni K-edge line (Fig. 5, Table 3 and ESI Fig. S7†), suggesting either subtle sample oxidation or subtle geometry changes at the active center. At −400 mV, the pre-edge feature gains intensity and the edge shifts 1.1 eV toward lower energy, and loses intensity (Fig. 5, Table 3 and ESI, Fig. S8†). This suggests reduction of the Ni center and a change of the symmetry around the Ni ion. The resulting spectrum is similar to sample 2, which contained mostly Ni-R. Increasing the potential back to +200 mV leaves spectra very similar to the previous one, showing reversibility of the process, something that would be incompatible with beam damage (Table 3). These spectra are also similar to the Ni-C rich spectrum measured at low temperature (sample 3, Fig. 3 and S13†). The pre-edge feature remains at the same position for all measured conditions. Only subtle changes in its intensity have been observed, indicating minor changes in symmetry of Ni at the active site. These results are in agreement with what was observed using a transmission optically transparent thin layer (OTTLE) FTIR cell, where it was found that when [NiFe] hydrogenase is activated and trapped in the polymer, it can access just the catalytically active reduced state such as NiII-Sla, NiIII-C, and NiII-R, since the redox potential of the electron carrier, the viologen, is not positive enough to oxidize the enzyme back to Ni-B.90 The previously reported FTIR SEC experiments were done in the absence of H2. Under H2 oxidation turnover conditions, the ratio of these states will be different. Additionally, kinetic modelling of the diffusion-reaction processes of a thick polymer-enzyme film under turnover conditions has predicted the simultaneous formation of catalytic layers with non-catalytic layers within the film, meaning that only a fraction of the enzyme is involved in catalysis due to the diffusion limitation of electrons and H2 through the polymer film.81 Since the XAS probes the whole film, the data analysis of such a system becomes very complex. Taking all the results into account, it appears that a mixture of Ni-R and Ni-C is present at −400 mV, where the Ni-R intermediate dominates the spectra.
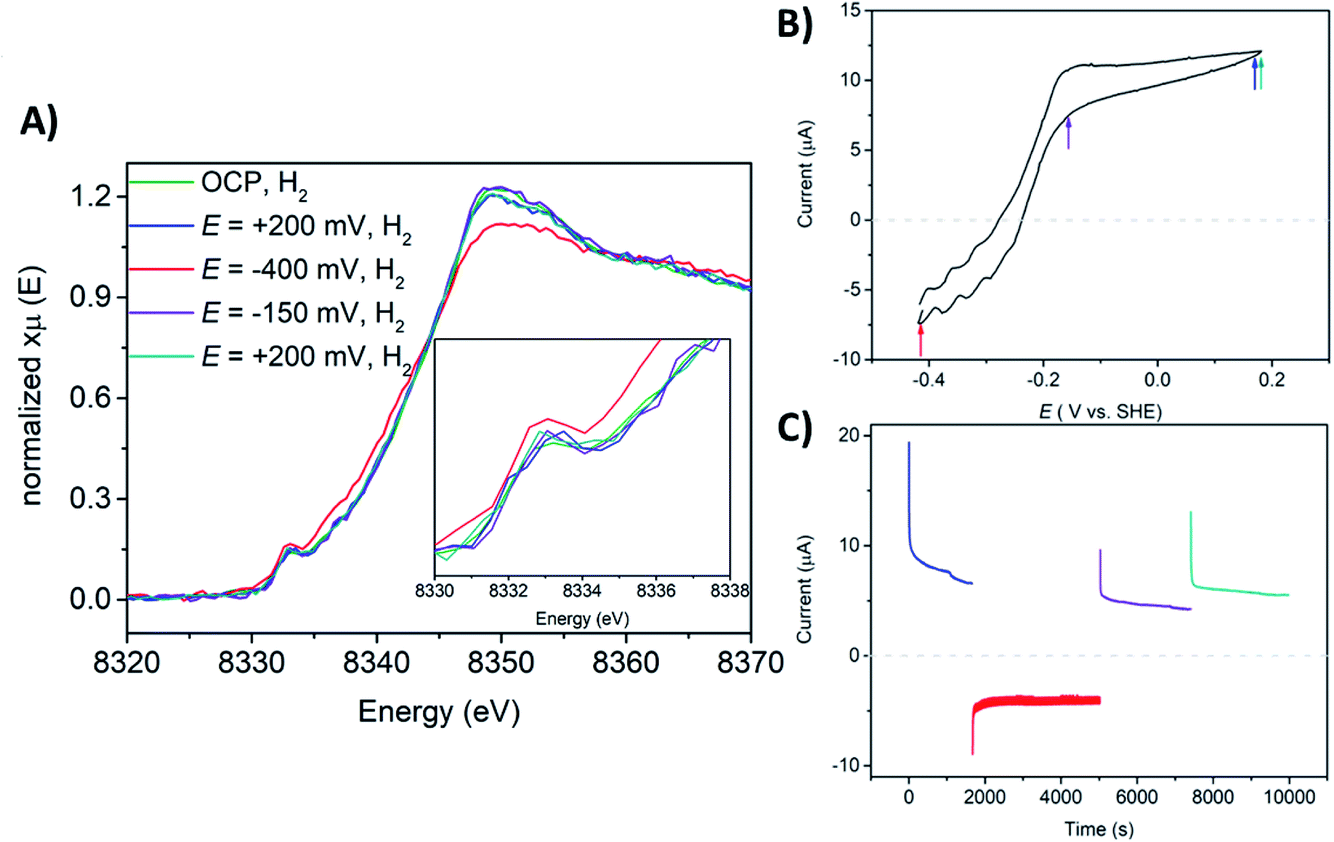 | ||
| Fig. 5 (A) Ni K-edge XAS spectra collected at 298 K at SAMBA Soleil beamline for a hydrogel film with [NiFe] hydrogenase from DvMF on GC electrode, measured upon the flow of phosphate electrolyte pH = 7 saturated with H2 and OCP (green line), at E = +200 mV (blue line), at E = −400 mV (red line), at E = −150 mV (violet line), at E = +200 mV vs. SHE (dark cyan line). (B) Cyclic voltammogram (CV) of a GC electrode with a [NiFe] hydrogenase hydrogel in phosphate buffer at pH = 7 and H2 flow. Measured at room temperature and 20 mV s−1 of scan rate. The colored arrows indicate at what potential X-ray operando measurements have been conducted. (C) Chronoamperometry (CA) experiments showing H2 evolution and H2 oxidation currents, measured at E = +200 mV (blue line), at E = −400 mV (red line), at E = −150 mV (violet line), and at E = +200 mV (dark cyan line). The horizontal dashed lines on CV and CA indicates a zero line current. | ||
The catalytic H2 oxidation current measured during multiple-steps chronoamperometry experiments display stable catalytic currents of ∼21 μA cm−2 for H2 oxidation, lower than what has been reported on a rotating disk electrode (RDE).90 This may be a result of limiting the H2 supply in the flow cell, compared to the RDE setup. The CV measured after operando XAS studies indicates ∼34% loss in the H2 oxidation activity (ESI, Fig. S14†). This can be explained by the fact that during the whole course of the experiment the enzyme-polymer film is slowly washed off the electrode surface while flowing electrolyte through the spectroelectrochemical flow-cell.
These experiments demonstrate that operando electrochemical X-ray experiments are possible, although extremely challenging. The use of polymer films yields an adequate protein loading. We note that our present data suggests that measurements of a monolayer are not currently possible (see ESI†). While the polymer films circumvent this issue, the formation of catalytic and non-catalytic layers associated with H2 and redox gradients, and the complexity of the changes around the Ni ion in the [NiFe] hydrogenase during the catalytic cycle, complicate the data analysis. Furthermore, these investigations indicate that the XA-SEC spectroelectrochemical experiments require precise redox control over the majority of the studied metal centers, to maximize the response of the spectra to the applied potential. Additionally, careful controls are required to distinguish between electrochemically driven changes and enzyme degradation, either just as a result of enzyme instability or induced by the X-ray beam.
Recommendations and concluding remarks
In this section, we want to offer the reader a step-by-step guide on how to plan and execute XA-SEC experiments on enzymes.As we have stated already in this article, measuring XA-SEC on an enzyme immobilized on an electrode surface is challenging, so it is advisable to gather some relevant information before collecting SEC data. Finding existing literature XAS/EXAFS data, and/or measuring the XAS/EXAFS of the studied protein in solution and at low temperature (as well as chemically reduced/oxidized, if experimentally possible) will on the one hand serve as a good reference of the undamaged protein and on the other hand indicate the expected range of changes that could be observed during the SEC experiment.
The next step is to design the SEC cell. As stated above, the experiment will be carried out in fluorescence mode. There are several factors that can be used to maximize the signal that reaches the detector in such a configuration. Defocusing the beam, or the use of rather large beam sizes has the advantage of exposing an increased electrode area, and therefore the amount of absorber. In this sense, bending magnet or wiggler beamlines are better suited to these experiments than beamlines using an undulator insertion device. An advantage of a defocused beam is that the dose per area unit is lowered, which may, to a certain extent, help to prevent beam damage on the sample. Another advantage is that a large beam averages the signal over the electrode surface and minimizes the effect of enzyme film inhomogeneity. On the other hand, the use of large beam spots requires the use of large electrodes. Employing a large working electrode requires the use of an even larger counter electrode. Building such electrochemical cells has to be done with extreme care, and the cell geometry has to be designed so that the applied electrode potential is homogeneous over the whole working electrode surface, to ensure that the whole sample is measured at the same applied electrochemical conditions.
While ideally we would place the electrode at 45° to the beam, decreasing the angle between electrode and beam will result in an increase of effective area of the electrode being probed. Grazing incidence XAS may be particularly useful for measuring electrodes that have been modified with thick enzyme-modified layers (e.g. porous materials, redox polymers and in general composite electrodes). Such configurations could yield layered structures, resulting from electron or substrate/products diffusion limitations through the film, where the enzyme could assume different electronic structures depending on the position of the enzyme in the film, which could be studied by varying the grazing angle.91
The shape of the window should be carefully designed based on the aforementioned criteria, considering the beam path and the projected size of the beam on the electrode. The materials used to construct the cell have to be free of interfering metals that could contribute to the spectra and be compatible with the used electrolytes.
For air-sensitive proteins, the cell has to be designed in such a way that it can be loaded and operated at the facilities available in the synchrotron. Gloveboxes are usually available at most synchrotrons, but the beamline is usually open to air and may be located far from the glovebox. Consider designing a cell that is gas-tight, that can be assembled in the glovebox and then can be anaerobically sealed for transfer to the beamline. If it is a flow cell, the tubes and pump system should be gas-tight and leak-safe to be operated on the beamline.
At the beamline, the first step is to align the cell with the beam and optimize detector positioning. Since in most cases one will be working with a very weak fluorescence signal, a large solid state detector with reasonable energy resolution for rejection of background scattering signals is very helpful. Low-pass Z-1 filters in combination with Soller slits may be utilized to further reject scattering contributions. The distance between sample and detector has to be carefully selected to optimize the counts reaching the detector. Unless working at high energies, the SEC cell will block the beam almost completely, making it difficult to measure a reference foil at the same time as the sample. In such cases, one should remember to measure a reference foil regularly during the beam time, or alternatively, one can utilize a scattering reference upstream in which a portion of the incident beam is deflected to a reference foil just outside the primary beam path.
The next step is to scan the cell surface (preferably using a filter to attenuate the beam and prevent any beam damage during these steps) in order to map the location of the sample on the electrode. Then at a given spot, one measures quick XAS scans, without any attenuating beam filters in order to evaluate how quickly the sample degrades. This can be judged by comparing the edge with reference samples measured at low temperature, and by observing how fast the XAS spectrum shape changes. Usually, the beam will induce metal reduction, which manifests by a shift of the edge to lower energies, but depending on the nature of the damage, changes in the pre-edge region or even in the white line intensity can also be observed. If the spectra are not changing over time, but the shape is different than what was measured for the reference sample at low temperature, this may indicate that the first measured spectra is already damaged. In that case, one should attenuate the beam with carbon or aluminum filters, and/or defocus the beam, and repeat the damage scans to find the exposure limit for a given position of the beam on the electrode. Then the XA-SEC experiment can begin. During the measurements it is advisable to keep track of the beam positions on the electrode that have been irradiated.
Regarding the system to be studied, it is important to have an optimized protein attachment protocol to the electrode surface that yields not only satisfactory electrode coverage, but also great stability of the protein film, since the SEC experiment will require long measuring times. When using redox active matrices (such as polymer films) for increasing the enzyme loading, the film thickness should be adjusted to avoid the concomitant formation of catalytic and non-catalytic layers. Homogeneous distribution of reaction rates, of concentrations and of redox states within the film are desired and obtained when catalysis is limiting the overall current output. This can be verified by comparing the current for different film thicknesses92 and is typically attainable for film thicknesses below 10 μm for hydrogenase modified dendrimer films,93 which are more homogeneous than polymer films at low thicknesses.94,95
Performing experiments with dynamic systems and under turnover conditions, means that the spectra will represent steady state conditions. These types of experiments are useful to identify rate-limiting reaction steps and could be also used to investigate inactivation processes or enzyme degradation pathways under turnover conditions.
Summary
Herein, we have briefly examined the possibilities of XA-SEC and reviewed the very few reports where this technique has been utilized on enzymes and molecular catalysts. We identified the challenges associated with XA-SEC experiments, such as low concentration of the photoabsorber and the instability of the protein in the X-ray beam. Further, we have highlighted the importance of the methods of enzyme immobilization, in order to obtain satisfactory electrode coverage and stability, while maintaining full redox control. Overall, we have demonstrated that the XA-SEC experiments are feasible, but require careful controls to discriminate between electrochemically-driven changes and enzyme degradation as a result of either enzyme instability and/or beam induced damage. Finally, we provided a road map for future applications of XA-SEC to enzymes, as well as the key principles to provide guidance in the experimental design. Further developments of this technique are still necessary so that in the future it can be utilized in a more routine and straightforward manner.Author contributions
SD and OR planned and designed the study. The beamtime data collection and analysis was carried on by KC, OR and SD. AO contributed to the polymer synthesis. The manuscript has been written by KC, OR and SD and checked by all authors.Conflicts of interest
There are no conflicts to declare.Acknowledgements
The authors acknowledge the Max Planck Society for funding. SSRL and SOLEIL are acknowledged for allocating beamtime. Use of the SSRL is supported by the U.S. Department of Energy (DOE), Office of Science, Office of Basic Energy Sciences, under Contract DE-AC02-76SF00515. The authors gratefully acknowledge the Proposal Review Committee of SOLEIL for provision of their synchrotron radiation facilities (Proposal No. 20171380). Matthew Latimer at beamline 9-3 (SSRL), Menlo Park, CA, USA Dr Andrea Zitolo, Dr Gautier Landort and Guillaume Alizon at beamline SAMBA (SOLEIL), Saint-Aubin, France, are gratefully acknowledged for their technical assistance. The authors thank Prof. Dr Nicolas Plumeré for his contribution to polymer synthesis and helpful discussions. Birgit Nöring, Christoph Laurich, and the mechanic workshop at the MPI CEC are thanked for manufacturing the SEC cells. Open Access funding was provided by the Max Planck Society.Notes and references
- H. Ogata, S. Hirota, A. Nakahara, H. Komori, N. Shibata, T. Kato, K. Kano and Y. Higuchi, Structure, 2005, 13, 1635–1642 CrossRef CAS PubMed.
- W. Lubitz, H. Ogata, O. Rüdiger and E. Reijerse, Chem. Rev., 2014, 114, 4081 CrossRef CAS PubMed.
- K. B. Musgrave, H. I. Liu, L. Ma, B. K. Burgess, G. Watt, B. Hedman and K. O. Hodgson, JBIC, J. Biol. Inorg. Chem., 1998, 3, 344–352 CrossRef CAS.
- S. J. George, B. M. Barney, D. Mitra, R. Y. Igarashi, Y. Guo, D. R. Dean, S. P. Cramer and L. C. Seefeldt, J. Inorg. Biochem., 2012, 112, 85–92 CrossRef CAS PubMed.
- J. Kowalska and S. DeBeer, Biochim. Biophys. Acta, Mol. Cell Res., 2015, 1853, 1406–1415 CrossRef CAS PubMed.
- J. K. Kowalska, A. W. Hahn, A. Albers, C. E. Schiewer, R. Bjornsson, F. A. Lima, F. Meyer and S. DeBeer, Inorg. Chem., 2016, 55, 4485–4497 CrossRef CAS PubMed.
- K. M. Lancaster, M. Roemelt, P. Ettenhuber, Y. Hu, M. W. Ribbe, F. Neese, U. Bergmann and S. DeBeer, Science, 2011, 334, 974–977 CrossRef CAS PubMed.
- C. Van Stappen, R. Davydov, Z.-Y. Yang, R. Fan, Y. Guo, E. Bill, L. C. Seefeldt, B. M. Hoffman and S. DeBeer, Inorg. Chem., 2019, 58, 12365–12376 CrossRef CAS PubMed.
- P. Rodríguez-Maciá, L. M. Galle, R. Bjornsson, C. Lorent, I. Zebger, Y. Yoda, S. P. Cramer, S. DeBeer, I. Span and J. A. Birrell, Angew. Chem., Int. Ed., 2020, 59, 16786–16794 CrossRef PubMed.
- M. C. Corbett, Y. Hu, A. W. Fay, M. W. Ribbe, B. Hedman and K. O. Hodgson, Proc. Natl. Acad. Sci. U. S. A., 2006, 103, 1238–1243 CrossRef CAS PubMed.
- S. P. Cramer, K. O. Hodgson, W. O. Gillum and L. E. Mortenson, J. Am. Chem. Soc., 1978, 100, 3398–3407 CrossRef CAS.
- R. G. Shulman, P. Eisenberger, B. K. Teo, B. M. Kincaid and G. S. Brown, J. Mol. Biol., 1978, 124, 305–321 CrossRef CAS PubMed.
- R. G. Shulman, P. Eisenberger and B. M. Kincaid, Annu. Rev. Biophys. Bioeng., 1978, 7, 559–578 CrossRef CAS PubMed.
- C. Van Stappen, A. T. Thorhallsson, L. Decamps, R. Bjornsson and S. DeBeer, Chem. Sci., 2019, 10, 9807–9821 RSC.
- S. P. Cramer, W. O. Gillum, K. O. Hodgson, L. E. Mortenson, E. I. Stiefel, J. R. Chisnell, W. J. Brill and V. K. Shah, J. Am. Chem. Soc., 1978, 100, 3814–3819 CrossRef CAS.
- M. R. Antonio, B. K. Teo, W. Orme-Johnson, M. J. Nelson, S. E. Groh, P. A. Lindahl, S. M. Kauzlarich and B. A. Averill, J. Am. Chem. Soc., 1982, 104, 4703–4705 CrossRef CAS.
- V. K. Yachandra, R. Guiles, A. E. McDermott, J. L. Cole, R. D. Britt, S. Dexheimer, K. Sauer and M. P. Klein, Biochemistry, 1987, 26, 5974–5981 CrossRef CAS PubMed.
- D. B. Goodin, V. K. Yachandra, R. D. Britt, K. Sauer and M. P. Klein, Biochim. Biophys. Acta, Bioenerg., 1984, 767, 209–216 CrossRef CAS.
- J. Kim, D. Woo and D. Rees, Biochemistry, 1993, 32, 7104–7115 CrossRef CAS PubMed.
- A. Zouni, H.-T. Witt, J. Kern, P. Fromme, N. Krauss, W. Saenger and P. Orth, Nature, 2001, 409, 739–743 CrossRef CAS PubMed.
- C. Mller, P. Liebisch, M. Barra, H. Dau and M. Haumann, Phys. Scr., 2005, 847, DOI:10.1238/physica.topical.115a00847.
- P. Gatt, R. Stranger and R. J. Pace, J. Photochem. Photobiol., B, 2011, 104, 80–93 CrossRef CAS PubMed.
- C. Glöckner, J. Kern, M. Broser, A. Zouni, V. Yachandra and J. Yano, J. Biol. Chem., 2013, 288, 22607–22620 CrossRef PubMed.
- M. Risch, K. Klingan, F. Ringleb, P. Chernev, I. Zaharieva, A. Fischer and H. Dau, ChemSusChem, 2012, 5, 542–549 CrossRef CAS PubMed.
- I. Zaharieva, M. M. Najafpour, M. Wiechen, M. Haumann, P. Kurz and H. Dau, Energy Environ. Sci., 2011, 4, 2400–2408 RSC.
- M. C. Corbett, Y. Hu, A. W. Fay, M. W. Ribbe, B. Hedman and K. O. Hodgson, Proc. Natl. Acad. Sci., 2006, 103, 1238–1243 CrossRef CAS PubMed.
- K. B. Musgrave, H. I. Liu, L. Ma, B. K. Burgess, G. Watt, B. Hedman and K. O. Hodgson, JBIC, J. Biol. Inorg. Chem., 1998, 3, 344–352 CrossRef CAS.
- A. W. Fay, M. A. Blank, C. C. Lee, Y. Hu, K. O. Hodgson, B. Hedman and M. W. Ribbe, Angew. Chem., Int. Ed., 2011, 50, 7787–7790 CrossRef CAS PubMed.
- B. Hedman, P. Frank, S. F. Gheller, A. L. Roe, W. E. Newton and K. O. Hodgson, J. Am. Chem. Soc., 1988, 110, 3798–3805 CrossRef CAS.
- F. A. Lima, R. Bjornsson, T. Weyhermüller, P. Chandrasekaran, P. Glatzel, F. Neese and S. DeBeer, Phys. Chem. Chem. Phys., 2013, 15, 20911–20920 RSC.
- R. Bjornsson, F. A. Lima, T. Spatzal, T. Weyhermueller, P. Glatzel, E. Bill, O. Einsle, F. Neese and S. DeBeer, Chem. Sci., 2014, 5, 3096–3103 RSC.
- M. A. Beckwith, W. Ames, F. D. Vila, V. Krewald, D. A. Pantazis, C. Mantel, J. Pécaut, M. Gennari, C. Duboc, M.-N. Collomb, J. Yano, J. J. Rehr, F. Neese and S. DeBeer, J. Am. Chem. Soc., 2015, 137, 12815–12834 CrossRef CAS PubMed.
- J. Messinger, J. H. Robblee, U. Bergmann, C. Fernandez, P. Glatzel, H. Visser, R. M. Cinco, K. L. McFarlane, E. Bellacchio, S. A. Pizarro, S. P. Cramer, K. Sauer, M. P. Klein and V. K. Yachandra, J. Am. Chem. Soc., 2001, 123, 7804–7820 CrossRef CAS PubMed.
- C. Van Stappen, L. Decamps, G. E. Cutsail, R. Bjornsson, J. T. Henthorn, J. A. Birrell and S. DeBeer, Chem. Rev., 2020, 120, 5005–5081 CrossRef CAS PubMed.
- C. Van Stappen, A. T. Thorhallsson, L. Decamps, R. Bjornsson and S. DeBeer, Chem. Sci., 2019, 10, 9807–9821 RSC.
- R. G. Castillo, R. Banerjee, C. J. Allpress, G. T. Rohde, E. Bill, L. Que, J. D. Lipscomb and S. DeBeer, J. Am. Chem. Soc., 2017, 139, 18024–18033 CrossRef CAS PubMed.
- G. E. Cutsail, R. Banerjee, A. Zhou, L. Que, J. D. Lipscomb and S. DeBeer, J. Am. Chem. Soc., 2018, 140, 16807–16820 CrossRef CAS PubMed.
- N. Voevodskaya, F. Lendzian, O. Sanganas, A. Grundmeier, A. Gräslund and M. Haumann, J. Biol. Chem., 2009, 284, 4555–4566 CrossRef CAS PubMed.
- J. M. Younker, C. M. Krest, W. Jiang, C. Krebs, J. M. Bollinger and M. T. Green, J. Am. Chem. Soc., 2008, 130, 15022–15027 CrossRef CAS PubMed.
- E. M. Sproviero, Dalton Trans., 2017, 46, 4724–4736 RSC.
- L. M. K. Dassama, A. Silakov, C. M. Krest, J. C. Calixto, C. Krebs, J. M. Bollinger and M. T. Green, J. Am. Chem. Soc., 2013, 135, 16758–16761 CrossRef CAS PubMed.
- S.-K. Lee, S. D. George, W. E. Antholine, B. Hedman, K. O. Hodgson and E. I. Solomon, J. Am. Chem. Soc., 2002, 124, 6180–6193 CrossRef CAS PubMed.
- R. Sarangi, M. Dey and S. W. Ragsdale, Biochemistry, 2009, 48, 3146–3156 CrossRef CAS PubMed.
- J. Timoshenko and B. Roldan Cuenya, Chem. Rev., 2021, 121, 882–961 CrossRef CAS PubMed.
- Y. Zhai, Z. Zhu, S. Zhou, C. Zhu and S. Dong, Nanoscale, 2018, 10, 3089–3111 RSC.
- C. H. M. van Oversteeg, H. Q. Doan, F. M. F. de Groot and T. Cuk, Chem. Soc. Rev., 2017, 46, 102–125 RSC.
- L. J. A. Macedo, A. Hassan, G. C. Sedenho and F. N. Crespilho, Nat. Commun., 2020, 11, 316 CrossRef CAS PubMed.
- T. Kuwana, R. K. Darlington and D. W. Leedy, Anal. Chem., 1964, 36, 2023–2025 CrossRef CAS.
- J. J. A. Lozeman, P. Führer, W. Olthuis and M. Odijk, Analyst, 2020, 145, 2482–2509 RSC.
- H. Oberacher, F. Pitterl, R. Erb and S. Plattner, Mass Spectrom. Rev., 2015, 34, 64–92 CrossRef CAS PubMed.
- L. Dunsch, J. Solid State Electrochem., 2011, 15, 1631–1646 CrossRef CAS.
- A. J. Wain and M. A. O’Connell, Adv. Phys.: X, 2017, 2, 188–209 CAS.
- Y. J. Tong, Curr. Opin. Electrochem., 2017, 4, 60–68 CrossRef CAS.
- K. J. Lee, N. Elgrishi, B. Kandemir and J. L. Dempsey, Nat. Rev. Chem., 2017, 1, 0039 CrossRef CAS.
- L. León and J. D. Mozo, TrAC, Trends Anal. Chem., 2018, 102, 147–169 CrossRef.
- T. M. Cotton and R. P. Van Duyne, Biochem. Biophys. Res. Commun., 1978, 82, 424–433 CrossRef CAS PubMed.
- N. Chongdar, J. A. Birrell, K. Pawlak, C. Sommer, E. J. Reijerse, O. Rüdiger, W. Lubitz and H. Ogata, J. Am. Chem. Soc., 2018, 140, 1057–1068 CrossRef CAS PubMed.
- C. Sommer, A. Adamska-Venkatesh, K. Pawlak, J. A. Birrell, O. Rüdiger, E. J. Reijerse and W. Lubitz, J. Am. Chem. Soc., 2017, 139, 1440–1443 CrossRef CAS PubMed.
- P. Rodríguez-Maciá, K. Pawlak, O. Rüdiger, E. J. Reijerse, W. Lubitz and J. A. Birrell, J. Am. Chem. Soc., 2017, 139, 15122–15134 CrossRef PubMed.
- A. Adamska, A. Silakov, C. Lambertz, O. Rüdiger, T. Happe, E. Reijerse and W. Lubitz, Angew. Chem., Int. Ed., 2012, 51, 11458–11462 CrossRef CAS PubMed.
- N. Chongdar, K. Pawlak, O. Rüdiger, E. J. Reijerse, P. Rodríguez-Maciá, W. Lubitz, J. A. Birrell and H. Ogata, JBIC, J. Biol. Inorg. Chem., 2020, 25, 135–149 CrossRef CAS PubMed.
- P. Rodríguez-Maciá, L. Kertess, J. Burnik, J. A. Birrell, E. Hofmann, W. Lubitz, T. Happe and O. Rüdiger, J. Am. Chem. Soc., 2019, 141, 472–481 CrossRef PubMed.
- M. Osawa, Surface-Enhanced Infrared Absorption, Springer Berlin Heidelberg, 2001, pp. 163–187, DOI:10.1007/3-540-44552-8_9.
- M. Osawa, Bull. Chem. Soc. Jpn., 1997, 70, 2861–2880 CrossRef CAS.
- P. A. Ash, S. E. T. Kendall-Price and K. A. Vincent, Acc. Chem. Res., 2019, 52, 3120–3131 CrossRef CAS PubMed.
- P. A. Au-Ash, R. Au-Hidalgo and K. A. Au-Vincent, JoVE, 2017, e55858, DOI:10.3791/55858.
- J. Velasco Vélez, L. Falling, D. Bernsmeier, M. Sear, P. Clark, T. Chan, E. Stotz, M. Hävecker, R. Kraehnert, A. Knop-Gericke, C. Chuang, D. Starr, M. Favaro and R. Mom, J. Phys. D: Appl. Phys., 2020 DOI:10.1088/1361-6463/abd2ed.
- L. R. Sharpe, W. R. Heineman and R. C. Elder, Chem. Rev., 1990, 90, 705–722 CrossRef CAS.
- Y. Yang, X. Liu, Z. Dai, F. Yuan, Y. Bando, D. Golberg and X. Wang, Adv. Mater., 2017, 29, 1606922 CrossRef PubMed.
- R. Boisseau, U. Bussy, P. Giraudeau and M. Boujtita, Anal. Chem., 2015, 87, 372–375 CrossRef CAS PubMed.
- H. R. Pershad, J. L. C. Duff, H. A. Heering, E. C. Duin, S. P. J. Albracht and F. A. Armstrong, Biochemistry, 1999, 38, 8992 CrossRef CAS PubMed.
- A. Parkin, G. Goldet, C. Cavazza, J. C. Fontecilla-Camps and F. A. Armstrong, J. Am. Chem. Soc., 2008, 130, 13410 CrossRef CAS PubMed.
- K. A. Vincent, A. Parkin and F. A. Armstrong, Chem. Rev., 2007, 107, 4366–4413 CrossRef CAS PubMed.
- H. R. Pershad, J. L. Duff, H. A. Heering, E. C. Duin, S. P. Albracht and F. A. Armstrong, Biochemistry, 1999, 38, 8992–8999 CrossRef CAS PubMed.
- D. Lebedev, Y. Pineda-Galvan, Y. Tokimaru, A. Fedorov, N. Kaeffer, C. Copéret and Y. Pushkar, J. Am. Chem. Soc., 2018, 140, 451–458 CrossRef CAS PubMed.
- R. N. Samajdar and A. J. Bhattacharyya, J. Phys. Chem. B, 2021, 125, 5258–5264 CrossRef CAS PubMed.
- X. Zhang, Y. Wang, M. Gu, M. Wang, Z. Zhang, W. Pan, Z. Jiang, H. Zheng, M. Lucero, H. Wang, G. E. Sterbinsky, Q. Ma, Y.-G. Wang, Z. Feng, J. Li, H. Dai and Y. Liang, Nat. Energy, 2020, 5, 684–692 CrossRef CAS.
- K. Cheaib, B. Maurice, T. Mateo, Z. Halime and B. Lassalle-Kaiser, J. Synchrotron Radiat., 2019, 26, 1980–1985 CrossRef CAS PubMed.
- N. Levin, C. Casadevall, G. E. Cutsail III, J. Lloret-Fillol, S. DeBeer and O. Rüdiger, ChemElectroChem, 2022, 9, e202101271 Search PubMed.
- H. Ogata, K. Nishikawa and W. Lubitz, Nature, 2015, 520, 571 CrossRef PubMed.
- V. Fourmond, S. Stapf, H. Li, D. Buesen, J. Birrell, O. Rüdiger, W. Lubitz, W. Schuhmann, N. Plumeré and C. Léger, J. Am. Chem. Soc., 2015, 137(16), 5494–5505 CrossRef CAS PubMed.
- A. K. Jones, E. Sillery, S. P. J. Albracht and F. A. Armstrong, Chem. Commun., 2002, 866–867 RSC.
- K. A. Bagley, E. C. Duin, W. Roseboom, S. P. J. Albracht and W. H. Woodruff, Biochemistry, 1995, 34, 5527–5535 CrossRef CAS PubMed.
- K. A. Vincent, A. Parkin, O. Lenz, S. P. J. Albracht, J. C. Fontecilla-Camps, R. Cammack, B. Friedrich and F. A. Armstrong, J. Am. Chem. Soc., 2005, 127, 18179–18189 CrossRef CAS PubMed.
- H. Ogata, P. Kellers and W. Lubitz, J. Mol. Biol., 2010, 402, 428–444 CrossRef CAS PubMed.
- M. Van Gastel, M. Stein, M. Brecht, O. Schröder, F. Lendzian, R. Bittl, H. Ogata, Y. Higuchi and W. Lubitz, J. Biol. Inorg. Chem., 2006, 11, 41–51 CrossRef PubMed.
- T. Krämer, M. Kampa, W. Lubitz, M. van Gastel and F. Neese, ChemBioChem, 2013, 14, 1898–1905 CrossRef PubMed.
- J. L. Barilone, H. Ogata, W. Lubitz and M. van Gastel, Phys. Chem. Chem. Phys., 2015, 17, 16204–16212 RSC.
- D. Millo, M. E. Pandelia, T. Utesch, N. Wisitruangsakul, M. A. Mroginski, W. Lubitz, P. Hildebrandt and I. Zebger, J. Phys. Chem. B, 2009, 113, 15344–15351 CrossRef CAS PubMed.
- N. Plumeré, O. Rüdiger, A. A. Oughli, R. Williams, J. Vivekananthan, S. Pöller, W. Schuhmann and W. Lubitz, Nat. Chem., 2014, 6, 822–827 CrossRef PubMed.
- C. Maurizio, M. Rovezzi, F. Bardelli, H. G. Pais and F. D’Acapito, Rev. Sci. Instrum., 2009, 80, 063904 CrossRef CAS PubMed.
- H. Li, D. Buesen, S. Dementin, C. Léger, V. Fourmond and N. Plumeré, J. Am. Chem. Soc., 2019, 141, 16734–16742 CrossRef CAS PubMed.
- S. Hardt, S. Stapf, D. T. Filmon, J. A. Birrell, O. Rüdiger, V. Fourmond, C. Léger and N. Plumeré, Nat. Catal., 2021, 4, 251–258 CrossRef CAS PubMed.
- D. Buesen, H. Li and N. Plumeré, Chem. Sci., 2020, 11, 937–946 RSC.
- H. Li, D. Buesen, R. Williams, J. Henig, S. Stapf, K. Mukherjee, E. Freier, W. Lubitz, M. Winkler and T. Happe, Chem. Sci., 2018, 9, 7596–7605 RSC.
Footnote |
| † Electronic supplementary information (ESI) available. See DOI: 10.1039/d1fd00079a |
| This journal is © The Royal Society of Chemistry 2022 |