Influence of Al/Fe-based coagulant dosing sequences on floc formation and settling behavior in algae-laden water†
Ming-Han
Tsai
,
Wen-Long
Liang
,
Lap-Cuong
Hua
and
Chihpin
Huang
 *
*
Institute of Environmental Engineering, National Yang Ming Chiao Tung University, Hsinchu 300, Taiwan, Republic of China. E-mail: huang@nctu.edu.tw
First published on 9th November 2021
Abstract
A high dosage of aluminum- (AC) or iron-based coagulant (IC) is required for the efficient destabilization of algae during the coagulation process. However, such a high dosage poses a risk of human exposure to residual aluminum or iron in drinking water, would be costly to apply, and would induce the formation of precipitates that could be deposited in the distribution network. In this study, PACl combined with either monomeric FeCl3 or polymeric polysilicate iron (PSI) was implemented with different dosing approaches including PACl → FeCl3, FeCl3 → PACl, PACl → PSI and PSI → PACl for algal (i.e., Chlorella sp.) removal by sedimentation. The results indicated that PACl → FeCl3 and PACl → PSI achieved the highest algae removal of 94% and 97%, respectively. By contrast, FeCl3 → PACl and PSI → PACl resulted in only 81% and 87% of algae removal, which were 10–13% lower than those that resulted when PACl was dosed first. Importantly, PACl → FeCl3 dosing brought about 2.7 times faster floc aggregation as well as the formation of 26% larger flocs than FeCl3 → PACl dosing resulting in a higher floc settling rate for PACl → FeCl3 dosing. Higher filterability and lower residual Al of the supernatant were also observed with PACl → FeCl3 dosing. It was also found that PACl combined with PSI resulted in slightly higher algae removal (3–6%) than when combined with FeCl3, and the former resulted in a more compact floc structure and a higher floc settling rate, thus leading to higher algae removal than the latter application. Hence, the PACl → FeCl3 and PACl → PSI dosing provided more efficient approaches towards the removal of algae from the water.
Water impactThe removal of algae from alkaline raw water is always challenging using traditional coagulation processes. Excessive Al residues or clogging of iron floc may occur when conventional aluminum- or iron-based coagulants are used. Herein, we highlight that a dosing sequence of polyaluminum chloride followed by iron-based coagulants can improve the algae removal efficiency, produce high filterable water, and minimize Al residues in the processed water. |
1. Introduction
The eutrophication of surface waters associated with seasonal algal bloom has always been a potable water problem worldwide. During summer and fall, algae growth in eutrophicated water can increase considerably,1 which inevitably increases the demand for chemical algae control in water treatment plants. Unlike the naturally turbid particles, algae, characterized with low specific density, high negative charge, and high mobility, are much more difficult to remove from water by coagulation.2,3 Clogging of algal cells on filter beds frequently occurs if the algae are not removed during the coagulation/sedimentation (C/S) process.4 Moreover, the problem of colour, taste, and odour in drinking water, as well as the formation of disinfection byproducts, is also associated with the production of algogenic organic matter (AOM) resulting from the blooming of algae.4,5Conventional C/S processes are important for removing algae in raw water because this process would not rupture the cell walls causing the release of unfavorable intracellular organic matter into the water.6,7 However, large amounts of monomeric coagulants are required to efficiently destabilize the algal cells.8 Previous studies have investigated various conventional monomeric coagulants (mostly trivalent cationic metals, e.g. AlCl3, Al2(SO4)3, FeCl3 and Fe2(SO4)3) and polymeric coagulants, e.g. polyaluminum chloride (PACl), for algae removal. Şengül et al.9 reported that an Al2(SO4)3 dosage of 60 mg L−1 was necessary to remove 93.1% of Microcystis aeruginosa. A similar study conducted by Li et al.10 showed >90% MA removal by FeCl3 at 50 mg L−1. In practice, iron-based coagulants (IC), e.g. FeCl3 and Fe2(SO4)3, have been less frequently used than aluminum-based coagulants (AC), e.g. AlCl3, Al2(SO4)3 and PACl because of their insufficient ability for treating high-turbidity raw water (e.g. >100 NTU) and the formation of large amounts of Fe(OH)3 particles that could easily clog a filter.11 Compared with monomeric coagulants, polymeric PACl showed 94.3% similar cell removal at only 4 mg L−1.12 Although a low dosage of polymeric coagulant is enough to efficiently remove the algal cells, this level of dosage might result in remaining coagulant levels exceeding that of the residual Al (>0.2 mg L−1) in the treated water, particularly for high-alkaline algal-laden water.12,13
The combination of Al and Fe coagulants (dual coagulation) has recently been reported as a more efficient alternative to traditional single coagulant dosing for the removal of particles in water.11,14,15 It has been found that a coagulant combination of either monomeric + polymeric or monomeric + monomeric and their dosing sequence (monomeric → polymeric or polymeric → monomeric) could affect the overall coagulation performance significantly. Cheng et al.16 applied polyferric sulfate (PFS) and Al2(SO4)3 as a dual coagulant (polymer + monomer) dosing for reservoir water treatment. Particle removal increased by 17.4% when Al2(SO4)3 was dosed after PFS (PFS → Al2(SO4)3), compared to single dose of PFS at the same dosage applied. Li et al.15 proposed a combined FeCl3 → AlCl3 (FeCl3 dosed prior to AlCl3) (monomer + monomer) coagulation strategy for high alkaline water. FeCl3 → AlCl3 resulted in 72% of particle removal at optimal dosages, which was still 27% higher than AlCl3 on its own.
The size of the floc is significantly related to the type of coagulant used as well as to the coagulant dosing strategies applied. Flocs formed by FeCl3 → AlCl3 were relatively small (<100 μm)15 compared to that obtained by the combination of monomeric and polymeric coagulants reported by Lin & Ika.11 Our previous study showed that PACl → FeCl3 (PACl dosed prior to FeCl3) outperformed FeCl3 → PACl and single PACl in particle removal by 3–10% for low turbidity water.14 Moreover, a larger floc was observed when PACl → FeCl3 (400 μm) was applied, compared to the single PACl dosing (250 μm). However, the feasibility of dual coagulant dosing to improve algae removal efficiency has been scarcely studied. The properties (e.g. floc size, floc shape, floc structure, floc size distribution and floc settling rate) of dual coagulant flocs formed by different dosing sequences are also unknown.
This study investigated the effect of PACl/IC dosing sequences on algae coagulation performance. Four dual dosing strategies of combining polymeric PACl with either monomeric FeCl3 or polymeric polysilicate iron (PSI) including PACl → FeCl3, FeCl3 → PACl, PACl → PSI and PSI → PACl were compared. Floc formation properties, floc settling behavior as well as the filterability of the treated water are comprehensively discussed. High polymeric PACl was selected because of its high particle neutralization ability compared to traditional monomeric Al (e.g. alum), which is necessary for destabilizing high negatively charged algal cells.17 FeCl3 and PSI as monomeric and polymeric IC were chosen as they produce high density and large floc size.11
2. Materials and methods
2.1 Materials
Chlorella sp. collected from a local reservoir was isolated and cultivated following our previous study, with a minor adjustment.18 The algae was cultivated in a 2 L beaker at 25 °C with an intermittent illumination (16![[thin space (1/6-em)]](https://www.rsc.org/images/entities/char_2009.gif) :
:![[thin space (1/6-em)]](https://www.rsc.org/images/entities/char_2009.gif) 8 light-darkness cycle) by TL 6 lamps (35 μmol photons per m2 s−1). Algal suspension collected at the stationary phase was centrifuged at 4000 rpm at 4 °C for 15 min to separate the algal cells from the cultivation media.
8 light-darkness cycle) by TL 6 lamps (35 μmol photons per m2 s−1). Algal suspension collected at the stationary phase was centrifuged at 4000 rpm at 4 °C for 15 min to separate the algal cells from the cultivation media.
NaClO4 and NaHCO3 were purchased from JT Baker, USA. Commercial FeCl3 was purchased from Jongmaw Chemical, Taiwan. Self-made PACl and PSI used in this study were freshly prepared, following the procedure reported by Wang et al.19 and Shi et al.,20 respectively. Note that PSI was prepared with modification at controlled Si/Fe of 0.5. The speciation of Al and Fe coagulants was analyzed by the Ferron method15 as listed in Table S1.†
2.2 Synthetic water preparation
Synthetic water was prepared by introducing 1.7 × 10⁶ algal cells per mL of deionized water (DI), with the initial turbidity of raw water at 17 ± 1.4 NTU. The ionic strength and alkalinity were obtained by adding 0.01 M of NaClO4 and 100 mg L−1 as CaCO3 of NaHCO3. To simulate high alkaline water, the pH was adjusted to 8.4 ± 0.6 by adding 0.1 M NaOH. The water quality for synthetic water is given in Table 1.| Turbidity (NTU) | Cell number (cells per ml) | pH | Zeta potential (mV) | Alkalinity (mg L−1 as CaCO3) |
|---|---|---|---|---|
| 17 ± 1.4 | 1.7 × 10⁶ | 8.4 ± 0.6 | −37 ± 1.5 | 100 |
2.3 Jar test procedure
A standard jar test (Phipps & Birds, PB-700, USA) was carried out, with a 2.5 L volume jar at room temperature of 25 °C. The schematic diagram of the jar test procedure and the sampling point for water quality and floc analysis is shown in Fig. 1. PACl, FeCl3 and PSI in different PACl/IC dosing sequences for algae removal of PACl → FeCl3, FeCl3 → PACl, PACl → PSI and PSI → PACl were designed as shown in Fig. 1. The FeCl3 group included two dosing sequences of PACl → FeCl3 and FeCl3 → PACl. The PSI group contained PACl → PSI and PSI → PACl. Dual coagulant dosing was done by adding the first coagulant at the start of rapid mixing, followed by second coagulant at 30 s after the first dose (Fig. 1). Doses ranging from 0.02 to 0.081 mM were applied to determine the optimal dosage. In this experiment, the PACl/IC dose ratio was set at PACl![[thin space (1/6-em)]](https://www.rsc.org/images/entities/char_2009.gif) :
:![[thin space (1/6-em)]](https://www.rsc.org/images/entities/char_2009.gif) IC = 2
IC = 2![[thin space (1/6-em)]](https://www.rsc.org/images/entities/char_2009.gif) :
:![[thin space (1/6-em)]](https://www.rsc.org/images/entities/char_2009.gif) 1 in order to reduce the operation cost.
1 in order to reduce the operation cost.
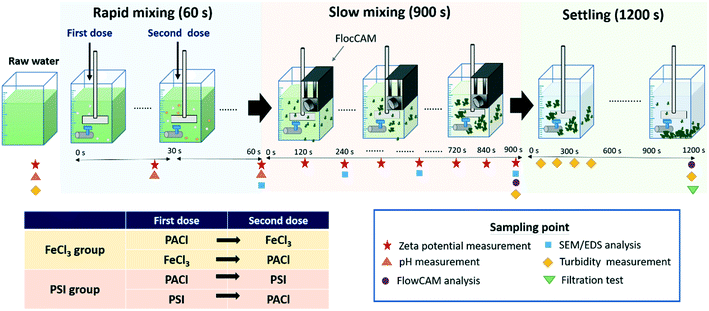 | ||
| Fig. 1 Schematic diagram of the jar test procedure and the sampling point for floc property and water quality analysis. | ||
The jar test was initiated with rapid mixing at 200 rpm (240 G) for 60 s. The first dose was added at the start (0 s) of rapid mixing. After 30 s mixing, the second dose was added. During the whole mixing period, the pH was measured continuously, and the samples were collected via the jar outlet at 0, 30 and 60 s for zeta potential measurement (Zetasizer nano ZS, Malvern).
Following rapid mixing, slow mixing was carried out at 30 rpm (25 G) for 900 s. To clarify the physical and chemical properties of the growing flocs during flocculation, analytical instruments including FlocCAM (Jar FlocCAM®, Durasens), zetasizer, a scanning electron microscope (SEM) equipped with an energy-dispersive X-ray spectrometer (EDS) (JEOL, JSM-6500F) and FlowCAM (Fluid Imaging Technologies, US) were applied. FlocCAM (a camera device) was installed on the jar during the entire flocculation time in order to monitor the formation properties of the growing floc in situ. Floc characteristics including size and fractal dimension (FD) were automatically measured using the FlocCAM software. The details of the working principles of FlocCAM were described in Tsai et al.14
During 900 s of slow mixing, 15 mL of samples was collected at every 120 s with a dropper, and 3 mL of each sample was injected into the cuvettes for zeta potential measurement so as to record the aggregation condition of the growing floc. The other 12 mL of the samples was used for SEM/EDS analysis in order to determine the change in chemical composition and morphology of the growing flocs. SEM/EDS was operated at an accelerating potential of 15 kV with a magnification of 2 k. Prior to SEM/EDS analysis, samples were collected by filtering the 12 mL floc solution through a 0.45 μm filter paper. The flocs deposited on the filter paper were dried at ambient temperature for 48 h and coated with platinum before SEM/EDS analysis.21
At the final point of slow mixing (after 900 s), FlowCAM, as an efficient technique for dynamic particle analysis, was used to give further insights into the structure and shape of the formed flocs (e.g. compactness and aspect ratio), following Hua et al. and Lin et al.,22,23 with some modifications. Then, 20 mL samples were collected and injected into FlowCAM through a >600 μm flow cell. An auto image with a 2× objective was made to determine the particle size, which ranged from 40 to 4000 μm. The flow rate of injection was 5 mL min−1 at a run time of 2 min, and the auto image rate was set at 2 frames per s. The floc compactness was a shape parameter derived from the perimeter and the filled area of particles calculated using the FlowCam software. The compactness is the inverse of circularity (a circle has a value of 1.0). The aspect ratio (range: 0–1) reflected the width and length ratio of the particles. An aspect ratio value approach to 1 meant a more spherical shape of particles.
To explore the size distribution of floc formed and their settling properties, sedimentation was monitored for 20 min. FlowCAM was used to analyze the change in floc size distribution in the supernatant during sedimentation. To evaluate the settling ability of the floc formed by different dosing strategies, the samples were collected at every 5 min during the 0–20 min settling time in order to measure the floc count and the size distribution analysis. The settling rate of floc at 0–5, 5–10, 10–15, and 15–20 min settling time interval was calculated as follows:
2.4 Filtration test
The filterability of the supernatant of treated water was analyzed using a suction time index (STI), which represents the time needed for a 500 mL sample to pass through a 1.0 μm filter. Lower STI values indicate higher water quality with fewer particles remaining in the supernatant.24–262.5 Supernatant analysis
Supernatant collected after sedimentation was directly measured for turbidity and algae cell count. ICP-OES (Agilent, inductively coupled plasma optical emission spectrometry 710 Series ICP-OES, USA) was used to analyze residual soluble Al of the filtered (0.45 μm filter) supernatant.3. Results and discussion
3.1 Coagulation performance
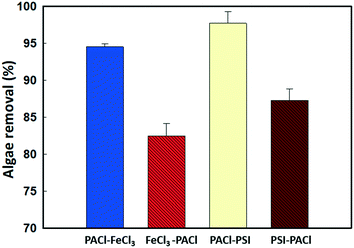
In this study, the coagulation performance (algae removal) was evaluated by measuring the turbidity of the treated water after sedimentation, as the amount of algae in the water showed a linear relationship with the turbidity measured (Fig. S1†). Fig. S2† shows the algae removed after 20 min sedimentation by sequence PACl/iron-based coagulant (IC) coagulation at different applied dosages. Algal removal increased with the increase in dosages for all dosing strategies. The optimal dosage was obtained when more than 94% of the algae were removed.An optimal dosage of 0.054 mM (Fig. 2) PACl → FeCl3 removed 94.3% of algae, which was 12.6% more than that for FeCl3 → PACl (81.7%), where PACl → PSI (97.7%) also exceeded PSI → PACl (87.3%) by about 10% in terms of algae removal, indicating that algae removal was higher when PACl was dosed first. However, the type of IC used in dual dosing unlikely influenced algae removal when an insignificant difference in the removal rate of 3% was found between PACl → FeCl3 and PACl → PSI. Noting that, for single coagulant dosing, a much higher coagulant dosage (FeCl3 at 0.082 mM and AlCl3 at 0.069 mM) was needed to achieve equivalent algae removal of >94% compared to PACl → IC (PACl → FeCl3 and PACl → PSI) dosing (Fig. S3a and b†). Compared to the experiment conducted by Sun et al.12 using commercialized PACl, our PACl → IC strategy required a 2.7 times lower dosage to achieve the same algae removal rate of 94–97%. Furthermore, low residual soluble Al (<0.04 mg L−1) was detected in the supernatant for all dosing strategies applied in this study (Fig. S2c†). Our results demonstrated the effectiveness of PACl → IC dosing for algae removal.
3.2 Change of pH and zeta potential during rapid mixing
The effect of a PACl/IC dosing sequence on the change of zeta potential of the algae cells and the pH values of the solution during rapid mixing is shown in Table 2. The zeta potential of algae cells in the raw water was −37.4 mV, which was lower than that reported by Aktas et al.27 and Tian et al.28 When PACl was dosed first, a slight increase in zeta potential (−37.5 to −30 mV) was detected. A similar phenomenon was also observed when PACl was used as a second dose (−36 to −28 mV), which was attributed to the neutralization effect of the high polymeric PACl that is rich in Al13+.17 By contrast, both FeCl3 and PSI showed weak neutralization ability with only a 1–4 mV increase. The final zeta potential after rapid mixing was ≤26 mV for all dosing strategies. Such negative zeta potentials indicate a more predominant sweep flocculation mechanism for algae destabilization.29| Zeta potential (mV) | Raw water | After 1st dose | After 2nd dose |
|---|---|---|---|
| (dosage 0.054 mM; turbidity 17 ± 1.4 NTU; pH 8.4 ± 0.6; alkalinity 100 mg L−1 as CaCO3). | |||
| PACl → FeCl3 | −37.4 ± 0.4 | −31.0 ± 1.2 | −26.7 ± 0.3 |
| FeCl3 → PACl | −36.0 ± 1.7 | −26.3 ± 1.4 | |
| PACl → PSI | −30.6 ± 0.4 | −26.0 ± 0.0 | |
| PSI → PACl | −36.3 ± 1.7 | −30.3 ± 1.2 | |
| pH | Raw water | After 1st dose | After 2nd dose |
| PACl → FeCl3 | 8.31 ± 0.1 | 7.91 ± 0.17 | 7.58 ± 0.14 |
| FeCl3 → PACl | 7.87 ± 0.07 | 7.69 ± 0.06 | |
| PACl → PSI | 8.05 ± 0.05 | 7.76 ± 0.04 | |
| PSI → PACl | 7.97 ± 0.03 | 7.78 ± 0.04 | |
However, the final pH (pHf) values after the second dose of the coagulant did not vary with dosing sequences. PACl → FeCl3 and FeCl3 → PACl resulted in comparable pHf of 7.58 and 7.69, respectively. Similarly, PACl → PSI and PSI → PACl showed identical pHf of 7.76 and 7.78, respectively. The PSI group had a weaker reduction of pH than that of the FeCl3 group, which was a result of the prehydrolyzed PSI that did not reduce the alkalinity as much as FeCl3. To conclude, the final pH and zeta potential were similar for different dosing sequences for both FeCl3 and PSI group.
3.3 Morphology and chemical compositions of floc during flocculation
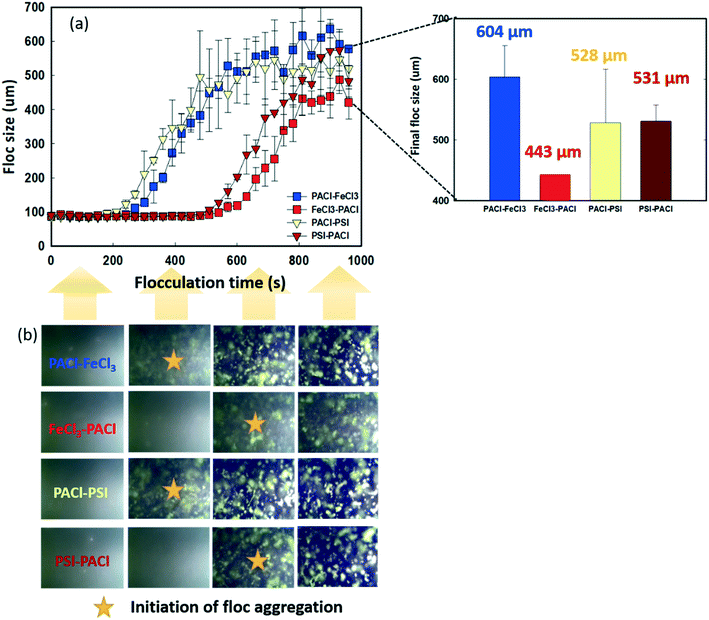
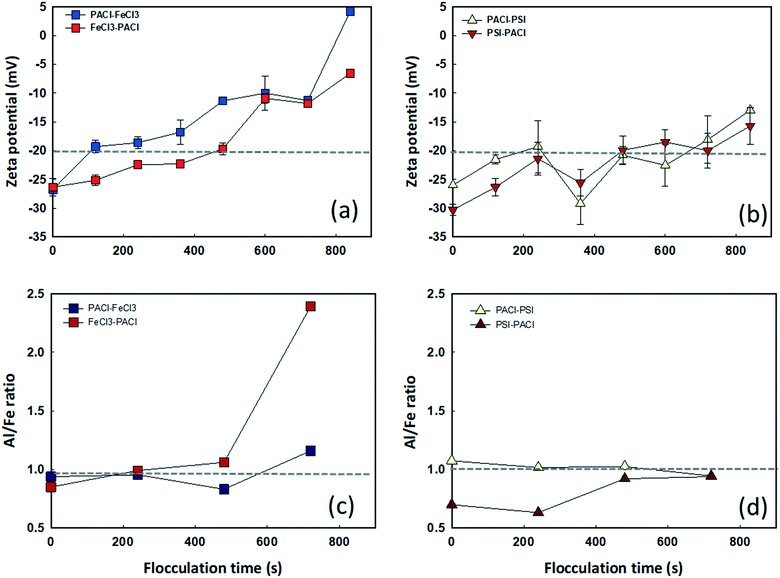
Fig. 3 shows the dynamics of floc growth with PACl/IC dosing during 900 s of flocculation. A 200 s lag time was observed for all dosing strategies (Fig. 3a). At the beginning of flocculation, no aggregation of floc was monitored. The initiation of floc aggregation strongly depended on the PACl/IC dosing sequence. PACl → FeCl3 and PACl → PSI (220–240 s) resulted in a 2.3 times faster floc aggregation than FeCl3 → PACl and PIS → PACl (520–550 s). For both PACl → IC and IC → PACl dosing sequences, the PSI group resulted in a 20–30 s faster floc aggregation than FeCl3, indicating the superior floc aggregation ability of polymeric IC compared to monomeric IC. The initiation of floc aggregation showed a positive correlation with algae removal (Fig. 2), where the earlier floc aggregation was initiated, the higher the rate of removal of algae. However, the final size of the floc at the end of flocculation did not correlate as well with algae removal as expected. The final floc size observed is as follows: PACl → FeCl3 (604 ± 52 μm) > PIS → PACl (531 ± 27 μm) ≈ PACl → PSI (528 ± 88 μm) > FeCl3 → PACl (443 ± 0.2 μm). It was apparent that PACl → FeCl3 formed much larger floc than FeCl3 → PACl. Interestingly, similar sized floc was observed for PIS → PACl and PACl → PSI, which was attributed to the polymeric PSI that resulted in an efficient interparticle bridging mechanism that facilitated the formation of large-sized floc, even when it was dosed first.30To clarify the occurrence of different initiation times of floc growth, the surface charge and chemical composition of the flocs during flocculation were analyzed by zeta potential and SEM/EDS. Fig. 4 shows the change in floc zeta potentials, as well as the Al/Fe ratio on the surface of the floc during 900 s flocculation. A lag time of 200 s was observed (see Fig. 3) due to too negative charge of micro flocs that hindered aggregation. The zeta values increased with the increase in floc size from −26–30 mV to −5–15 mV with the flocculation time of 0 s to 840 s for all dosing strategies (Fig. 4a and b). The floc aggregation was triggered when the zeta potential of the coagulated floc exceeded the critical point of −20 mV for all dosing strategies. Henderson et al.31 pointed out that efficient algae removal could be achieved at a specific range of zeta potential, depending on both the coagulation conditions and the characteristics of the species of algae. The zeta potential of the floc formed by PACl → IC effectively increased from −26 to −20 mV in a much shorter time than that formed by IC → PACl. As the flocculation time proceeded, the collision of flocs further reduced the negative charge on the floc surface, followed by an accelerated floc aggregation (Fig. 3 and 4a and b). A much faster increase of zeta potential of the aggregated floc was observed for the FeCl3 group compared to the PSI group because FeCl3 contributed more positive charge than PSI.
Fig. 4c and d show the Al/Fe ratios (determined by EDS using atomic percentage of Al and Fe) of the growing floc formed by different PACl/IC dosing strategies. It was observed that the Al/Fe ratios were high (0.93–1.03) at the beginning and sustained at nearly 1.0 during the entire flocculation period when PACl was dosed prior to IC. By contrast, low Al/Fe ratios of 0.69–0.84 were observed at the beginning when FeCl3 and PSI were dosed first. However, the Al/Fe ratios increased with the increase in flocculation time, indicating a faster increase in Al than Fe content during floc aggregation. It was found that floc aggregation was initiated at the time where the Al/Fe ratio steadily remained at >1.0. An earlier floc aggregation was thus observed for PACl → IC compared to IC → PACl (Fig. 3). An apparent increase of Al/Fe ratio from 1.1 to 2.4 for FeCl3 → PACl was seen from 500 s to 700 s (Fig. 4c).
Floc aggregation was unfortunately stopped after 800 s. The relatively low amount of Fe (Al/Fe ratio = 2.4) on the floc surface was likely the main factor inhibiting floc growth, resulting in floc of only 443 μm in size at the end of flocculation. However, for PSI → PACl, the Al/Fe ratio remained at ∼1.0 after floc aggregation (Fig. 4d), and a continuous floc aggregation was detected even after 800 s. These results indicated that the floc zeta potential and Al/Fe ratio controlled by PACl/IC dosing sequence were important factors affecting the different initiation times required for floc aggregation.
3.4 Physical properties of the final floc at the end of flocculation
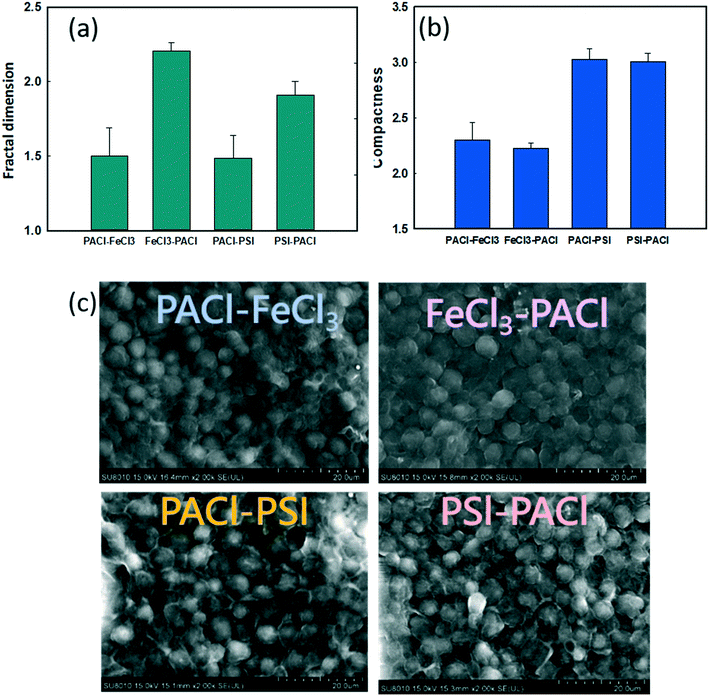
Fig. 5 shows the effect of PACl/IC dosing sequence and IC type on the physical properties of the flocs at the end of flocculation. The fractal dimension (FD) reflects the density of the floc formed. Larger or smaller FD values indicate a denser or a looser floc structure, respectively.32 When IC was dosed first (IC → PACl), higher FD values (1.9–2.2) were detected compared to those when PACl was dosed first (1.48–1.5) (Fig. 5a). These results indicate that the first dose of IC, as the core of the floc, could result in a more dense structure. The high floc density formed by IC was also reported by other researchers.11,33,34 However, the trend of FD values for different dosing strategies in this study was in contrast to that of coagulation performance (high FD value resulting in low algae removal) as generally reported.35 Lin et al.36 reported that floc with high FD values could possibly be eroded by shear, leading to poor settling efficiency.The compactness of floc measured by FlowCAM was used to further determine the appearance of the final floc produced by different dosing strategies. Generally, a higher compactness value indicated a more convoluted shape of the floc while a lower compactness value indicated a more circular floc shape. As illustrated in Fig. 5b, PSI groups formed a more compact floc than FeCl3 groups. This phenomenon was confirmed by SEM images, as shown in Fig. 5c and S4.† It can be seen that the PSI groups showed a more stereoscopic, rough floc surface compared to FeCl3 groups; PSI groups showed a more compact floc structure. In conclusion, PACl → IC formed lower FD of floc than IC → PACl, thus resulting in higher rates of algae removal. However, a PACl/IC dosing sequence did not affect the compactness of floc formed, as expected. Instead, the IC type controlled the compact structure of the floc.
3.5 Effect of PACl/IC dosing sequence on floc size distribution before and after sedimentation
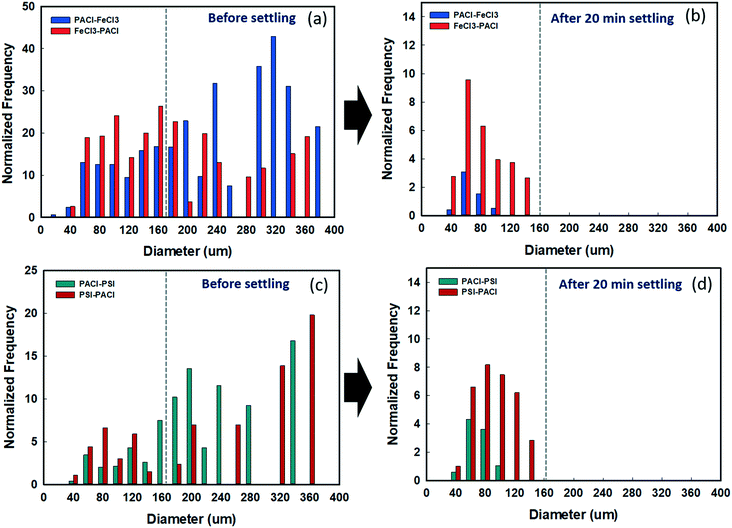
The effect of a PACl/IC dosing sequence on floc size distribution before and after sedimentation was investigated using FlowCAM (Fig. 6). Fig. 6a and c show the size distribution of floc formed by all dosing strategies before settling. For PACl → FeCl3, the floc sizes were generally >160 μm, accounting for 72.5% of the total, while less than <160 μm accounted for 27.5%. By contrast, flocs formed by FeCl3 → PACl were evenly distributed at >160 μm, accounting for 47.8%, while those <160 μm accounted for 52.2% (Fig. 6a). After 20 min settling, flocs >160 μm had settled completely for PACl → FeCl3 and FeCl3 → PACl. Although the remained flocs in the supernatant were mostly 60 μm in size for both PACl → FeCl3 and FeCl3 → PACl, the amount of floc number detected was significantly different (Fig. 6b). Less floc was detected for PACl → FeCl3, indicating its better floc settling efficiency than that of FeCl3 → PACl.For the PSI group, no apparent variation of floc size distribution before settling was observed between PACl → PSI and PSI → PACl (Fig. 6c). PACl → PSI appeared to have a slightly higher percentage (74.5%) of large flocs (>160 μm) than that of PSI → PACl (68.9%). This result indicated that large-sized flocs could easily be formed by the combination of PACl and PSI regardless of dosing sequences. Compared to FeCl3 group, the PSI group resulted in fewer floc numbers over the whole size range. This could be explained by the efficient bridging ability of polymeric PSI that grabs plenty of the small flocs to form large flocs during the flocculation process,30 and hence, a relatively low floc number (0–20 counts) was observed. After 20 min settling, PACl → PSI resulted in lower floc numbers (0–5 counts) of the remaining flocs (40–160 μm) in the supernatant compared to PSI → PACl (Fig. 6d). PACl → PSI thus resulted in higher algae removal than PSI → PACl (Fig. 2).
Overall, the PACl/IC dosing sequence, as well as the type of IC, impacted significantly on the size distribution of the floc formed. Flocs formed by PACl → IC were generally larger, while IC → PACl formed flocs were distributed evenly from large to small. However, PSI → PACl flocs remained large-sized as a result of the existence of dual polymer PSI and PACl that minimized most of the non-aggregated small flocs. After 20 min settling, a PACl → IC dosing sequence resulted in a small amount of remained flocs in the supernatant, thus resulting in high coagulation performance.
3.6 Effect of PACl/IC dosing sequences on floc settling rates
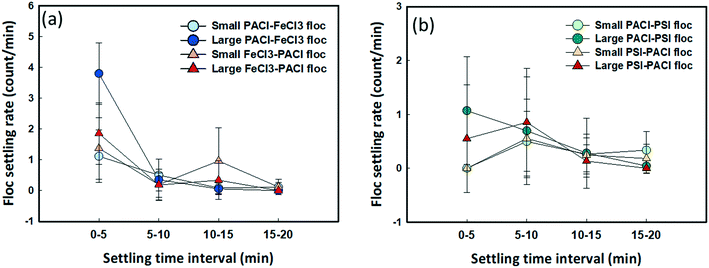
Floc settling rates at different time intervals during the sedimentation process are shown in Fig. 7. The result indicates the fastest settling rate of floc during the first 5 min settling for all dosing strategies. Typically, for those large-sized flocs (160–380 μm), faster settling rates were observed when PACl was dosed first followed by either FeCl3 (3.79 count per min) or PSI (1.07 count per min) compared to FeCl3 → PACl (1.85 count per min) and PSI → PACl (0.54 count per min) at 0–5 min. After 5 min settling where most of the large-sized floc settled, the settling rates reduced significantly to 0.18–0.35 count per min for the FeCl3 group (Fig. 7a). As for small-sized flocs (0–160 μm), the floc settling rates remained slow (0.04–1.3 count per min) during the whole settling period and were not altered by the effect of PACl/IC dosing sequences for all dosing strategies. It is noteworthy that the settling performance of floc was not affected only by the floc size under normal conditions, but the fractal structure of the floc also played an important role, where larger floc fractal dimensions resulted in slower floc settling rates (Fig. 5a), especially during 0–5 min settling. The high setting rates of the PACl → IC group were further confirmed by real-time monitoring of floc settling for 10 min (Fig. S5c†). This result has been positively correlated with algae removal performance.3.7 Filterability of the supernatant
The quality of the supernatant after coagulation/sedimentation process significantly affected the subsequent filtration performance. The suction time index (STI) of the filterability of the treated water showed significant difference between PACl/IC dosing sequences (Fig. 8). Lower STI values (STI = 4–8) were obtained when PACl was dosed first (PACl → FeCl3 and PACl → PSI) compared to those when the IC was dosed first (FeCl3 → PACl and PIS → PACl) (STI = 19–30). This observation indicating that water treated by applying a PACl → IC strategy (higher algae removal) contained smaller amounts of suspended particles or flocs than those in IC → PACl treated water. Although PACl → PSI showed higher algae removal rates than those of PACl → FeCl3, the remained flocs in the supernatant were more susceptible to clog onto the filter. This demonstrated the best filterability of the supernatant treated with a PACl → IC dosing strategy. Furthermore, high algae removal of PACl → IC confirmed its feasibility for real algae coagulation applications.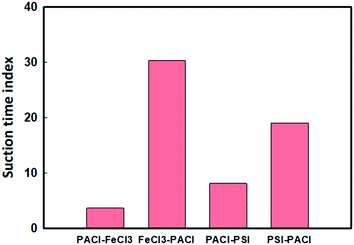 | ||
| Fig. 8 Effect of PACl/IC dosing strategies on the filterability of the treated water (dosage: 0.054 mM, turbidity: 17 ± 1.4 NTU, pH: 8.4 ± 0.6, alkalinity: 100 mg L−1 as CaCO3). | ||
3.8 Coagulation mechanism
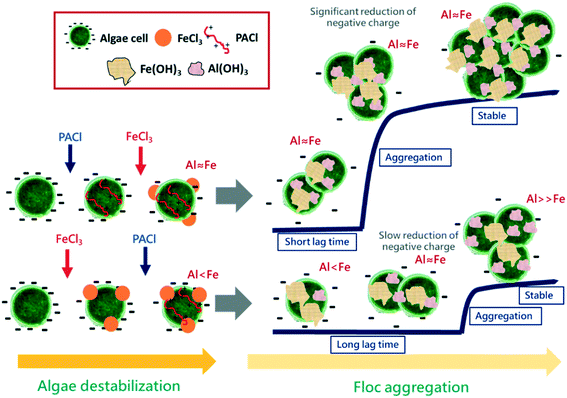
The above-mentioned results indicated the effectiveness of algae removal by dosing PACl prior to FeCl3. The proposed coagulation mechanism for PACl → FeCl3 and FeCl3 → PACl dosing is illustrated in Fig. 9. During the algae destabilization process, PACl → FeCl3 and FeCl3 → PACl dosing resulted in similar amounts of negative charge on the algal cell, indicating that both PACl and FeCl3 had adsorbed onto the cell surface regardless of dosing sequences. However, the PACl/FeCl3 sequence affected the Al/Fe ratio (the amount of Al and Fe) on the algal cell after rapid mixing, which predominated the flocculation performance afterwards. For the PACl → FeCl3 strategy, identical amounts of Al and Fe were detected on the algal cell, while insufficient Al presence on the algal floc surface was observed when FeCl3 → PACl was applied. This result indicated that PACl was difficult to be adsorbed onto the Fe-coagulated algal cell when it was dosed after FeCl3.During the floc aggregation process, significant reduction of negative charge on the PACl → FeCl3 floc was observed due to the identical amount of Al and Fe or sufficient PACl on the floc, which accelerated the aggregation of floc. In contrast, the insufficient-Al FeCl3 → PACl floc showed a long lag time before the initiation of floc aggregation due to slow reduction of negative charge on the floc surface that inhibited the formation of large aggregates. Therefore, FeCl3 → PACl resulted in large amounts of small flocs, which worsen the overall floc settling performance. To conclude, the formation of large-sized PACl → FeCl3 floc and smaller fractal dimension led to faster floc settling rates than FeCl3 → PACl.
4. Conclusions
The influence of coagulant dosing sequences on algae coagulation was investigated. The coagulants applied included one Al-based coagulant (PACl) and two Fe-based coagulants (FeCl3 and PSI). Higher algae removal (94–97%) and better filterability (STI < 10) of the treated water were achieved for PACl → IC coagulants than for IC → PACl coagulants. The better coagulation performance of PACl → IC was attributed to the high Al/Fe ratio of the floc that initiated its fast aggregation. Flocs formed by PACl → IC also exhibited smaller fractal dimension (FD = 1.5) compared to IC → PACl (FD > 1.9), resulting in a higher settling rate of the floc. The IC-type coagulant only slightly affected the algae coagulation performance, whereas the PSI group demonstrated an overall higher algae removal rate and supernatant filterability than the FeCl3 group. The results obtained in this study highlighted the importance of a PACl/IC dosing sequence on algae removal. A PACl → IC strategy is thus recommended for optimizing coagulation efficiency during an algal bloom.Conflicts of interest
There are no conflicts to declare.Acknowledgements
We are thankful for the financial support by Ministry of Science and Technology of Taiwan with this project MOST 108-2221-E-009-075-MY3.References
- H. Lv, J. Yang, L. Liu, X. Yu, Z. Yu and P. Chiang, Temperature and nutrients are significant drivers of seasonal shift in phytoplankton community from a drinking water reservoir, subtropical China, Environ. Sci. Pollut. Res., 2014, 21, 5917–5928 CrossRef CAS.
- A. J. H. Pieterse and A. Cloot, Algal cells and coagulation, flocculation and sedimentation processes, Water Sci. Technol., 1997, 36, 111–118 CrossRef.
- B. Ghernaout, D. Ghernaout and A. Saiba, Algae and cyanotoxins removal by coagulation/flocculation: A review, Desalin. Water Treat., 2010, 20, 133–143 CrossRef CAS.
- R. Henderson, M. Chips, N. Cornwell, P. Hitchins, B. Holden, S. Hurley and B. Jefferson, Experiences of algae in UK waters: a treatment perspective, Water Environ. J., 2008, 22, 184–192 CrossRef CAS.
- L. C. Hua, J. L. Lin, M. Y. Syue, C. Huang and P. C. Chen, Optical properties of algogenic organic matter within the growth period of Chlorella sp. and predicting their disinfection by-product formation, Sci. Total Environ., 2018, 621, 1467–1474 CrossRef CAS.
- M. Ma, R. Liu, H. Liu and J. Qu, Chlorination of Microcystis aeruginosa suspension: cell lysis, toxin release and degradation, J. Hazard. Mater., 2012, 217, 279–285 CrossRef.
- M. Ma, R. Liu, H. Liu, J. Qu and W. Jefferson, Effects and mechanisms of pre-chlorination on Microcystis aeruginosa removal by alum coagulation: significance of the released intracellular organic matter, Sep. Purif. Technol., 2012, 86, 19–25 CrossRef CAS.
- J. L. Lin, M. S. Nugrayanti, A. R. Ika and A. Karangan, Removal of Microcystis Aeruginosa by oxidation-assisted coagulation: Effect of algogenic organic matter fraction changes on algae destabilization with Al hydrates, J. Water Process. Eng., 2021, 42, 102142 CrossRef.
- A. B. Şengül, N. Tüfekçi and S. Aktan, The use of alum as coagulant for removing cyanobacterial cells in drinking water, Desalin. Water Treat., 2016, 57, 25610–25616 CrossRef.
- X. Li, H. Pei and W. Hu, The fate of Microcystis aeruginosa cells during the ferric chloride coagulation and flocs storage processes, Environ. Technol., 2015, 36, 920–928 CrossRef CAS.
- J. L. Lin and A. R. Ika, Enhanced Coagulation of Low Turbid Water for Drinking Water Treatment: Dosing Approach on Floc Formation and Residuals Minimization, Environ. Eng. Sci., 2019, 36, 732–738 CrossRef CAS.
- F. Sun, H. Pei and W. Hu, The cell damage of Microcystis aeruginosa in PACl coagulation and floc storage processes, Sep. Purif. Technol., 2013, 115, 123–128 CrossRef CAS.
- J. Q. Jiang and C. G. Kim, Comparison of algal removal by coagulation with clays and Al-based coagulants, Sep. Sci. Technol., 2008, 43, 1677–1686 CrossRef CAS.
- M. H. Tsai, L. Hua, K. Huang and C. Huang, NOM removal and residual Al minimization by enhanced coagulation: Roles of sequence dosing with PACl-FeCl3, J. Water Supply: Res. Technol.--AQUA, 2020, 69, 616–628 CrossRef.
- N. Li, C. Hu and H. Lan, Enhanced Production of in Situ Keggin Al137+ Polymer by a Combined Fe-Al Coagulation Process for the Treatment of High Alkalinity Water, ACS Sustainable Chem. Eng., 2019, 7, 9544–9552 CrossRef CAS.
- W. P. Cheng, R. F. Yu, C. H. Chen and C. H. Chi, Enhanced coagulation on reservoir water by dual inorganic coagulants, Environ. Eng. Sci., 2003, 20, 229–235 CrossRef CAS.
- J. L. Lin, C. Huang, C. J. M. Chin and J. R. Pan, The origin of Al (OH) 3-rich and Al13-aggregate flocs composition in PACl coagulation, Water Res., 2009, 43, 4285–4295 CrossRef CAS PubMed.
- L. C. Hua, S. J. Chao and C. Huang, Fluorescent and molecular weight dependence of THM and HAA formation from intracellular algogenic organic matter (IOM), Water Res., 2019, 148, 231–238 CrossRef CAS.
- J. Wang, P. Deevanhxay, T. Hasegawa, Y. Ehara, M. Kurokawa, K. Hashimoto and M. Okada, A pilot plant study of polysilicato-iron coagulant, Water Sci. Technol.: Water Supply, 2002, 2, 107–113 CAS.
- B. Shi, G. Li, D. Wang and H. Tang, Separation of Al13 from polyaluminum chloride by sulfate precipitation and nitrate metathesis, Sep. Purif. Technol., 2007, 54, 88–95 CrossRef CAS.
- L. C. Hua, S. R. Tsia, G. S. Wang, C. D. Dong and C. Huang, Increasing Bromine in Intracellular Organic Matter of Freshwater Algae Growing in Bromide-Elevated Environments and Its Impacts on Characteristics of DBP Precursors, Environ. Sci. Technol. Lett., 2021, 8, 307–312 CrossRef CAS.
- L. C. Hua, C. Huang, Y. C. Su and P. C. Chen, Effects of electro-coagulation on fouling mitigation and sludge characteristics in a coagulation-assisted membrane bioreactor, J. Membr. Sci., 2015, 495, 29–36 CrossRef CAS.
- J. L. Lin, L. C. Hua, Y. Wu and C. Huang, Pretreatment of algae-laden and manganese-containing waters by oxidation-assisted coagulation: Effects of oxidation on algal cell viability and manganese precipitation, Water Res., 2016, 89, 261–269 CrossRef CAS PubMed.
- K. Ebie and Y. Azuma, Reducing turbidity and coagulant residue in treated water through optimization of rapid mix conditions, Water Sci. Technol.: Water Supply, 2002, 2, 103–110 CAS.
- D. T. Wang and K. Ebie, Study on coagulating precipitation for treatment of raw water with low turbidity and low temperature, in Water & Wastewater Engineering, 2005, vol. 11 Search PubMed.
- J. L. Lin, C. Huang and W. M. Wang, Effect of cell integrity on algal destabilization by oxidation-assisted coagulation, Sep. Purif. Technol., 2015, 151, 262–268 CrossRef CAS.
- T. S. Aktas, F. Takeda, C. Maruo, N. Chiba and O. Nishimura, A comparison of zeta potentials and coagulation behaviors of cyanobacteria and algae, Desalin. Water Treat., 2012, 48, 294–301 CrossRef CAS.
- C. Tian and Y. X. Zhao, Dosage and pH dependence of coagulation with polytitanium salts for the treatment of Microcystis aeruginosa-laden and Microcystis wesenbergii-laden surface water: The influence of basicity, J. Water Process. Eng., 2021, 39, 101726 CrossRef.
- L. Chekli, C. Eripret, S. H. Park, S. A. A. Tabatabai, O. Vronska, B. Tamburic and H. K. Shon, Coagulation performance and floc characteristics of polytitanium tetrachloride (PTC) compared with titanium tetrachloride (TiCl4) and ferric chloride (FeCl3) in algal turbid water, Sep. Purif. Technol., 2017, 175, 99–106 CrossRef CAS.
- T. Okuda, W. Nishijima, P. Deevanhxay, M. Okada and T. Hasegawa, Improvement of Sedimentation by the Coagulation using Poly-silicate Iron for the Removal of Cryptosporidium Oocyst, Sep. Sci. Technol., 2006, 41, 3387–3396 CrossRef CAS.
- R. K. Henderson, S. A. Parsons and B. Jefferson, Successful removal of algae through the control of zeta potential, Sep. Sci. Technol., 2008, 43, 1653–1666 CrossRef CAS.
- P. Cheng, F. Ge, X. Liu, X. Zeng and B. Chen, Coagulation performance and floc properties of Microcystis aeruginosa in the presence of humic acid, Water Sci. Technol.: Water Supply, 2015, 15, 339–347 Search PubMed.
- A. Matilainen, N. Lindqvist and T. Tuhkanen, Comparison of the effiency of aluminium and ferric sulphate in the removal of natural organic matter during drinking water treatment process, Environ. Technol., 2005, 26, 867–876 CrossRef CAS.
- P. Jarvis, J. Banks, R. Molinder, T. Stephenson, S. A. Parsons and B. Jefferson, Processes for enhanced NOM removal: beyond Fe and Al coagulation, Water Sci. Technol.: Water Supply, 2008, 8, 709–716 CAS.
- J. K. Edzwald, Principles and applications of dissolved air flotation, Water Sci. Technol., 1995, 31, 1–23 CrossRef CAS.
- J. L. Lin, J. R. Pan and C. P. Huang, Enhanced particle destabilization and aggregation by flash-mixing coagulation for drinking water treatment, Sep. Purif. Technol., 2013, 115, 145 CrossRef CAS.
Footnote |
| † Electronic supplementary information (ESI) available. See DOI: 10.1039/d1ew00707f |
| This journal is © The Royal Society of Chemistry 2022 |


