
 Open Access Article
 This Open Access Article is licensed under a
 Creative Commons Attribution 3.0 Unported Licence
Towards an in silico integrated approach for testing and assessment of nanomaterials: from predicted indoor air concentrations to lung dose and biodistribution†
P.
Tsiros‡
 a,
N.
Cheimarios‡
b,
A.
Tsoumanis
b,
A. C. Ø.
Jensen
c,
G.
Melagraki
d,
I.
Lynch
e,
H.
Sarimveis
*a and
A.
Afantitis
*b
a,
N.
Cheimarios‡
b,
A.
Tsoumanis
b,
A. C. Ø.
Jensen
c,
G.
Melagraki
d,
I.
Lynch
e,
H.
Sarimveis
*a and
A.
Afantitis
*b
aSchool of Chemical Engineering, National Technical University of Athens, Athens, Greece. E-mail: hsarimv@central.ntua.gr
bNovaMechanics Ltd, Nicosia, Cyprus. E-mail: afantitis@novamechanics.com
cThe National Research Centre for the Working Environment, Denmark
dHellenic Army Academy, Athens, Greece
eSchool of Geography, Earth and Environmental Sciences, University of Birmingham, Birmingham, UK
First published on 15th February 2022
Abstract
Integrated approaches to testing and assessment (IATA) provide a framework for combining information from different sources (experimental, in silico) for hazard characterisation of chemicals, including nanomaterials (NM), based on a weight of evidence approach. Experimentally acquiring the exposure, hazard and characterisation data for NMs necessary to perform risk assessment is time-consuming and costly, thus driving demand for in silico models to facilitate read-across from data rich NMs to data poor ones, or to predict exposure or hazard. In this work, we present three integrated computational approaches which can be used to generate data relevant to human health risk assessment, namely the multi-box aerosol model for prediction of indoor air concentrations of NMs, the lung exposure model to determine the lung burden of NMs following acute exposures and a physiologically based pharmacokinetic (PBPK) model to determine the biodistribution of the NMs to other organs over longer timescales following inhalation. The lung exposure application is based on empirical deposition equations for calculating the deposited mass in the human respiratory system. The PBPK model extends the lung exposure model by introducing clearance terms and translocation of the NMs to the systemic circulation after passage through the air-blood barrier in the alveoli. Several exposure scenarios with varying conditions are introduced in order to compare the models in relation to the accumulated mass of NMs in the alveolar, tracheobronchial and head airways regions of the respiratory system, thus exploring their capabilities and weaknesses, and potential contribution to a NM-specific IATA for occupational exposure.
Environmental significanceNanomaterials (NMs) have become part of our daily life yet their long term and cumulative impact on human health is unknown. Experiments to understand their biodistribution and clearance are costly and ethically challenging, such that existing data are limited to specific NMs and rodent models. Computational tools are a promising way to assess the impacts of NMs exposure on humans. Despite their promise, such computational tools are currently lacking, and those that are available are not aligned in terms of inputs and outputs to facilitate risk assessment. Here, an integrated computational framework for assessing the internal deposition and distribution of NMs following exposure in an occupational setting is proposed. The computational methodology for calculation of the spatiotemporal emission profile can be further extended to include, in addition to indoor exposure, NM emissions to the surrounding environment. The tool integration connecting an external exposure model with internal exposure models for acute and chronic timescales enables users to conduct a complete in silico environmental risk assessment. |
1. Introduction
From sunscreen and cosmetics to clothes and printer toner, nanomaterials (NMs) have become part of our daily lives. As with many natural (e.g., viruses) and anthropogenic particles, NMs enter the human body through the respiratory system, and can, upon passing through the air-lung barrier, have access to the circulatory system and the whole body. However, as yet, risk assessment of the impacts of NMs on human health is still an open issue and is dependent on costly and time-consuming experiments on animals in many cases. Risk assessment related to NMs requires information on both the likelihood of exposure to the NMs, in terms of concentration, duration and form, and the hazard posed to the organisms the NMs come into contact with. Case-by-case determination of exposure and hazard data for each application and individual NM variant is not possible due to the time and cost required, as well as the ethical challenges inherent in animal experimentation, and thus there is a strong motivation to develop in silico models that can predict human exposure to, and impacts of, NMs based on a reduced set of input parameters, as part of an integrated approach to testing and assessment (IATA). An example of the use of computational tools in the context of risk assessment was introduced by Mollá et al.,1 who recently proposed NanoSerpa, an application for the risk assessment of NMs in the insurance sector, which was developed by integrating hazard-related data and optimized exposure models. The focus of NanoSerpa is on estimation of the insurance liability arising from accidental NMs spills during production, transport or use of NMs-containing products, based on input data regarding the type of NM and the accident scenario, utilising probabilistic models to predict emission, health hazard values and risk indices.1 Other tools for risk assessment of NMs are also emerging, including hazard classification tools,2–4 screening level models for predicting NMs transport and concentrations in the environment such as SimpleBox4Nano,5,6 and probabilistic models of NMs flows7,8 from production to waste treatment. However, the various models have yet to be made inter-operable and combined into an overall IATA in order to facilitate complete (in silico) risk assessment.Such integrated in silico models are potentially of enormous value in the context of NMs risk assessment and more broadly for life cycle impact assessment (LCIA), an important approach for analysing, evaluating, understanding and managing the environmental and health effects of NMs based on inventories of inputs and outputs.9 Both risk assessment (RA) and LCIA have two components, one referring to and characterising the exposure to a toxicant and one characterising the health effects that accompany the exposure. In particular, external exposure models can calculate the spatiotemporal evolution of the concentration of NMs emitted from one or multiple sources, while biokinetics models can transform the external concentration into organ burdens. The internal mass can then be compared with hazard thresholds to evaluate the risk associated with possible adverse health effects. An example of a complete LCIA workflow was presented by Tsang et al.,10 who proposed a dynamic model that involved integration of multiple in silico tools for quantifying the emissions and effects of NMs to human health in an occupational setting. The tools presented in our work aim at generating exposure data relevant to RA and LCIA and the extensive comparison of the lung models performed herein uncovers the relative strengths and weaknesses of the different modelling approaches in terms of their data input needs and the robustness and utility of their outputs.
In this work we present two integrated approaches for assessment of the accumulated doses of NMs in the human respiratory system following exposure to NMs in indoor environments, which can be used in risk assessment and LCIA studies. The approach consists of two parts; the first part is to evaluate the airborne concentration of the specific NM in the indoor environment and the second part is to compute the accumulated mass in the respiratory system. The concentration of the NMs in the indoor environment is calculated with a multi-box aerosol model. The multi-box aerosol model is based on an aerosol dynamics particle population balance equation.11 Although several models have been proposed for the calculation of the concentration of the NMs based on Eulerian,12 Gaussian plume,13,14 Lagrangian,15,16 and Markov chain models,17 the multi-box aerosol model is the most well-established.18 The multi-box aerosol model is based on the assumption of a well-mixed chamber where the NM concentrations are instantly mixed in the entire volume.11 However other models have also been proposed of imperfectly mixed chambers19 or which consider the existence of walls that restrict the flow20–23 or include ventilation and recirculation.24–26
The second part of the model is the calculation of the accumulated NM mass in the human respiratory system. In the present work, two models are used and compared, the lung exposure model and an advanced physiologically-based pharmacokinetic (PBPK) modelling approach. The lung exposure model is based on empirical equations built upon the International Commission on Radiological Protection (ICRP) model for the respiratory system27 while the PBPK model is built using rat inhalation data which was extrapolated to humans by adjusting a number of physiological and substance specific parameters and use of allometric scaling. Both models take as their input the concentration of NMs over time as calculated via the multi-box aerosol model. The lung exposure model supports various NMs such as black toner, TiO2 and TiO2 embedded with AgX, where X = O, Cl or pure Ag (so the particles are TiO2–Ag, TiO2–Ag2O and TiO2–AgCl), as well as user-defined particle size distributions, thus covering a broad range of NMs. The PBPK model currently supports only TiO2 NMs for which biodistribution data was available, although similar models can be constructed in the future provided that biodistribution data for other NMs become available. The lung exposure model calculates the accumulated NM mass in the alveolar, tracheobronchial (TB) and head airways regions, while the PBPK model calculates the accumulated mass in many regions of the human body, including heart, spleen, brain, kidneys, liver, lower respiratory, blood, lungs interstitium and capillaries, soft tissues and skin. Compared to the Lung exposure model, the PBPK modelling approach takes into account clearance processes, i.e., the removal of the NMs from the human body, which makes it more realistic especially over longer-term exposures or for evaluation of cumulative exposures. Freely available web applications have been developed for both models, and for the multi-box exposure model, which in turn constitute part of an integrated computational framework to estimate the deposited doses of NMs in the human respiratory system after occupational/indoor inhalation as part of an overall risk assessment and/or NMs life cycle assessment framework.
The computational framework consists of three independent applications as shown in Fig. 1: a multi-box aerosol model based application, the lung exposure dose calculator and a PBPK model. The overall computation starts by selecting the NMs size-resolved emission rate in the multi-box aerosol model, which estimates the NM concentration inside the different boxes (areas) that the indoor environment has been partitioned into. The computed airborne NMs concentration in the different areas are then introduced into the lung exposure dose calculator which, based on the exposure time and the respired volume rate, estimates the deposited dose in the human respiratory system. For a more detailed output regarding the whole-body biodistribution and long-term kinetics, which takes into account clearance rates, the computed NMs concentrations from the multi-box aerosol model can also be provided to the PBPK model, which estimates the internal doses of the NMs in various tissues as a function of time. In the following sections each model is presented in detail, and the outputs are compared in terms of the utility for human risk assessment and LCIA applications as part of an in silico IATA.
 | ||
| Fig. 1 Schematic of the data transfer from one module to the next in the integrated computational framework for in silico assessment of the inhalation of aerosolized NMs. | ||
2. Materials and methods
2.1 The multi-box aerosol model
The multi-box aerosol model,11,28 is based on the aerosol dynamics particle population balance equation: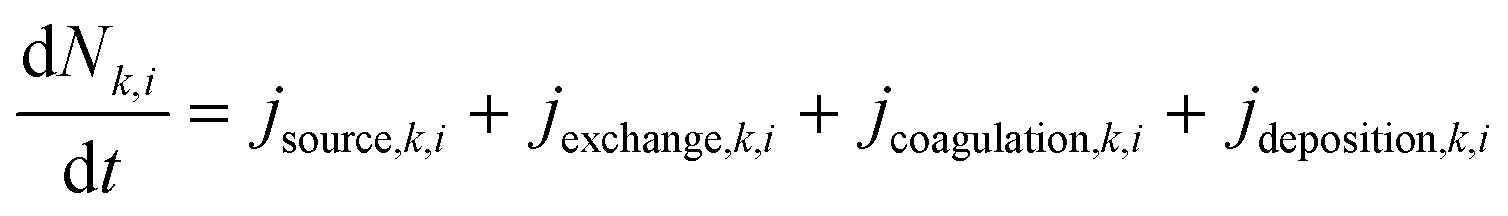 | (1) |
 (m−3 s−1) is the change in particle number concentration over time in box k for size bin i. NF represents the near field and FF represents the far field zone relative to the emission source (see Fig. 3). k assumes values, such as NF, FF1, FF2, etc., depending on the chosen room geometry.
j source,k,i is a single point NM generation term, assumed to be at the center of the NF box:
 | (2) |
 | (3) |
j exchange,k,i is the transport between the kth box and its connected boxes. It is the main driver for the transport processes for the size bin i (in m−3 s−1) in the system:
 | (4) |
j coagulation,k,i is the coagulation due to Brownian collision, Brownian coagulation, and turbulent collision of particles. The number concentration change rate (m−3 s−1) from the process of coagulation is determined as:
 | (5) |
j deposition,k,i describes the removal of aerosol particles that adhere to surfaces in the room:
 | (6) |
2.2 The lung exposure model
The lung deposition model is based on a simplified version of the International Commission on Radiological Protection (ICRP) model.31 The ICRP model was initially developed for estimation of the deposition dose to organs and tissues resulting from the inhalation of radioactive particles, and uses empirical equations based on experimental data and theory to estimate the deposition dose in various regions of the human respiratory system. The developed lung deposition model focuses on three regions, namely alveolar (AL), tracheobronchial (TB) and head airways (HA). The model equations for the deposited dose in the AL (eqn (7)), TB (eqn (8)) and HA (eqn (9)) regions are: | (7) |
 | (8) |
 | (9) |
 | (10) |
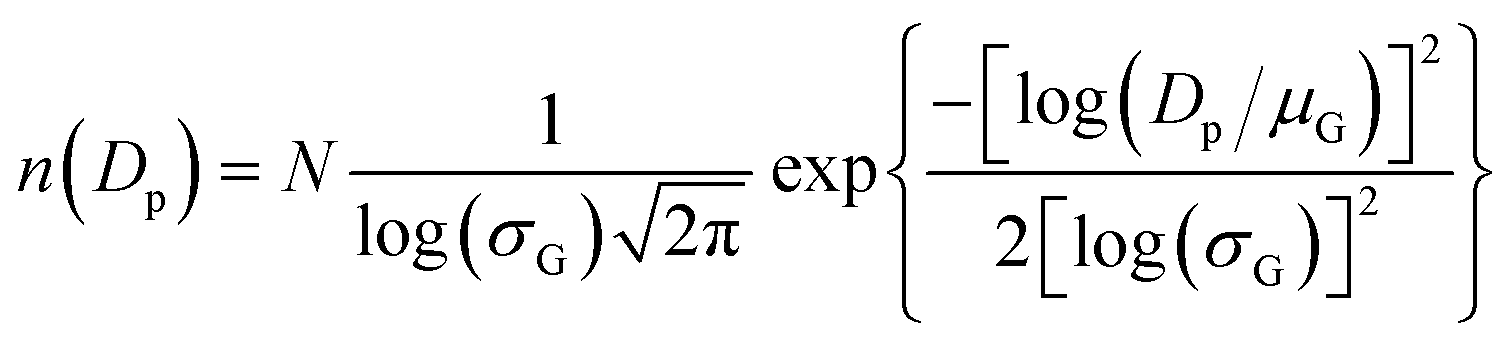
In order to calculate the dose, the mass size distribution is calculated from the NM number size distribution, assuming spherical particles and a NM density, d (eqn (11)):
| mi = 1/6π Dp,i3d | (11) |
 | (12) |
 | (13) |
2.3 PBPK model for inhalation exposure to TiO2 NMs
The PBPK model developed herein to describe the biodistribution of TiO2 NMs after inhalation is based on the structural model presented in ref. 32. Inhalation is considered as the main risk-relevant exposure route in occupational settings, since the amount of particles reaching the systemic circulation through skin penetration can be considered negligible.32,33 Initially, a PBPK model was developed for rats and was then extrapolated to humans. The parameters of the model were recalibrated using the biodistribution data produced by Kreyling et al.,34 in which 20 adult Wistar Kyoto rats were divided into 5 groups and exposed to slightly different doses of 48V-radiolabeled 20 nm TiO2 NM aerosol for 2 hours via an endotracheal tube. Each group was exsanguinated and dissected to extract biodistribution data and the quantities of TiO2 NMs in specific tissues were calculated indirectly using 48V radioactivity, measured with γ-spectrometry, which was then matched to TiO2 through mass and radioactivity balances. The first rat group was sacrificed immediately after exposure, and then the second, third, fourth and fifth groups were euthanized 4 hours, 24 hours, 7 days and 28 days post exposure, respectively.The tissue compartments for which measurements were reported were the total lungs, lavaged lungs, bronchoalveolar lavage cells (BALC), which refers to cells retrieved from the broncho-alveolar lavage procedure, bronchoalveolar lavage fluid (BALF), i.e., free TiO2 NMs in the BALF, trachea, liver, spleen, kidneys, heart, brain, uterus, blood, carcass, skeleton, soft tissue, secondary organs and skin. From those, total lungs, skeleton, soft tissues and secondary organs were not used since they included biodistribution information from combinations of other compartments. With regard to excreta, cumulative faeces and urine data were drawn from the respective plots provided in ref. 35 for the 28 days rat group.
The structural model was mostly guided by the compartments for which biodistribution data were available.34 The most significant compartments were the trachea, BALF, BALC and lavaged lungs. The nature of the exposure is such that most NMs were either deposited in the lung region or excreted, whereas only a small amount were translocated across the air-blood-barrier into the systemic circulation.34 The lung biodistribution is expressed through 4 compartments, one for the tracheobronchial region, one for the alveolar region, one for the interstitium and one for the capillary blood of the lungs. In the first two compartments the NMs exist in a “free” state, while in the alveolar and interstitium regions the NMs can be endocytosed by macrophages which are phagocytizing cells (PCs). In relation to the rest of the tissues, three sub-compartments were considered, one for the capillary blood, one for the tissue interstitium and a compartment for phagocytosis by tissue resident PCs. The capillary blood exchanges NMs with the interstitium compartment, which is also in contact with the PCs sub-compartment.
The TiO2 NMs enter the system via three compartments, namely the tracheobronchial region, the alveolar region and the upper airways. Apart from the respiratory tract, the rat PBPK model contains two blood pools, the arterial and venous, and 8 tissue compartments, namely the liver, spleen, kidneys, heart, brain, uterus, skin and rest of the body, which incorporates all remaining tissues that have not been stated explicitly. Excretion of the NMs takes place via three compartments: (a) in the liver, through hepatobiliary excretion from the liver tissue to faeces, (b) in the kidneys, where NMs are excreted to urine, and (c) through tracheobronchial clearance. The schematic presentation of the developed PBPK model is illustrated in Fig. 2. The model includes a number of physiological (organism-specific) and substance-specific parameters. Organism-specific parameters are the regional blood flows, tissue volumes, volumes of vascular and interstitial spaces, the inhalation volume and rate, and the typical number of PCs in each organ. Regarding the substance specific parameters, these include the deposition fractions, tissue permeability coefficients, tissue:blood partition coefficients, the maximum uptake rates by PCs, the maximum uptake capacity of PCs, the release rate of NMs from PCs, the clearance rates and, finally, the various transfer rates in the respiratory system. The PBPK model equations are presented in section 1 of the ESI† file.
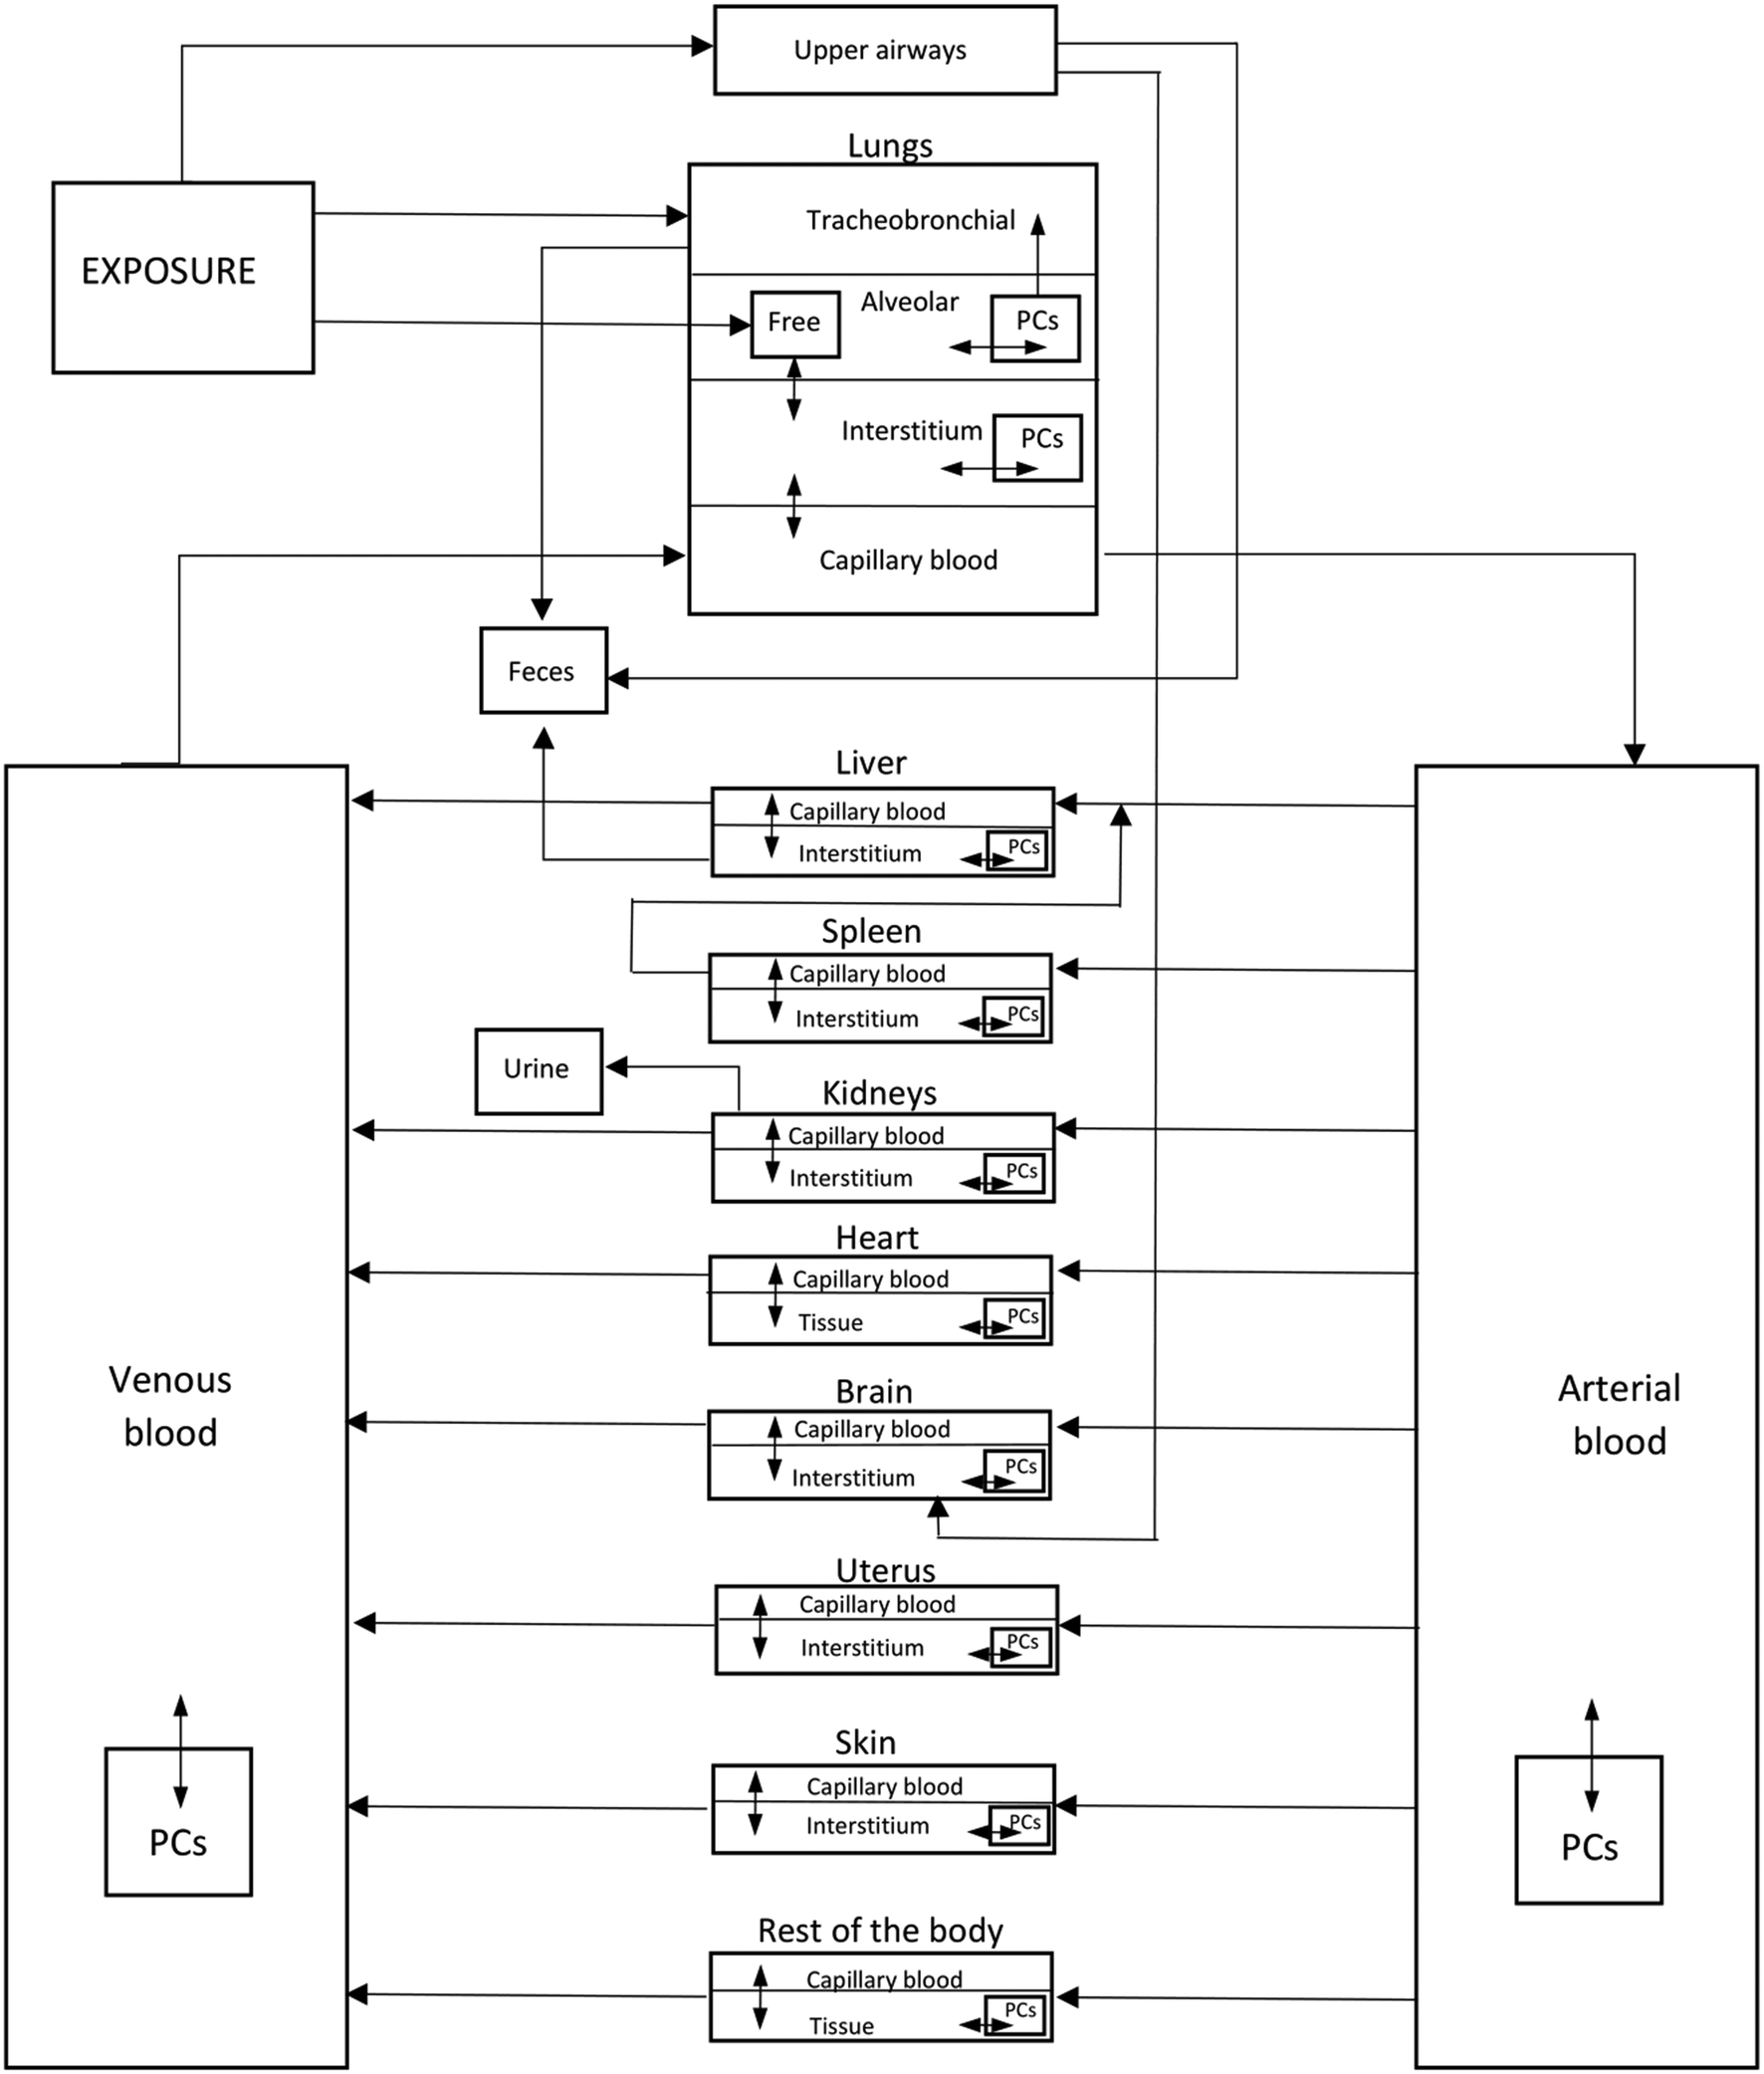 | ||
| Fig. 2 Schematic representation of the structure of the TiO2 NM PBPK model. PC stands for phagocytizing cells which take up NMs and transport them into/between model subcompartments. | ||
After defining the structural model, the next step was to integrate the information contained in the data with prior information found in the literature regarding the parameters of the ordinary differential equations system. This was performed using a dynamic form of the Hamiltonian Monte Carlo (HMC) algorithm, the No-U-Turn Sampler.35 Prior literature knowledge in the form of distributions was drawn from ref. 32 and 36. The statistical model is described in more detail in ref. 37.
After building the rat model, a simple extrapolation approach was followed to acquire a human TiO2 NM inhalation PBPK model. The first extrapolation step involved the replacement of the rat physiological parameters with those of the human. Thiel et al.38 showed that scaling of the physiological parameters was the most efficient univariate change when conducting cross-species extrapolation for a series of drug compounds. Due to the lack of human biokinetic data, the kinetic substance-specific parameters, i.e., clearances, transfer rates, uptake rates etc., could not be precisely extrapolated. Therefore, those parameters were scaled using allometric scaling.36 The parameters of the rat and human models are presented in Tables S1–S4.†
2.4 Computational specifications for integration of the 3 models
The computational framework consists of three parts. The first part is the multi-box aerosol application which is used to compute the concentrations of the NMs in the closed environment, namely the Room. A two-box layout is used, i.e., the Room is partitioned into two areas, an NF area in which the source of the NMs is located and a FF area where the exhaust of the system is located (see Fig. 3a). The Room size is 4 × 4 × 4 m3 which is a common working room size. The NF size is 1 × 1 × 1 m3. A two box layout is selected since this provides the most accurate results while maintaining the computational cost at reasonable levels.11 The flow rate between NF and FF is set to 10 m3 min−1 and the exhaust flow rate is set to 5 m3 min−1, similar to the values used in ref. 10 and 11. A parametric analysis of the input values and their impact on the overall computational outputs is the subject of a forthcoming publication.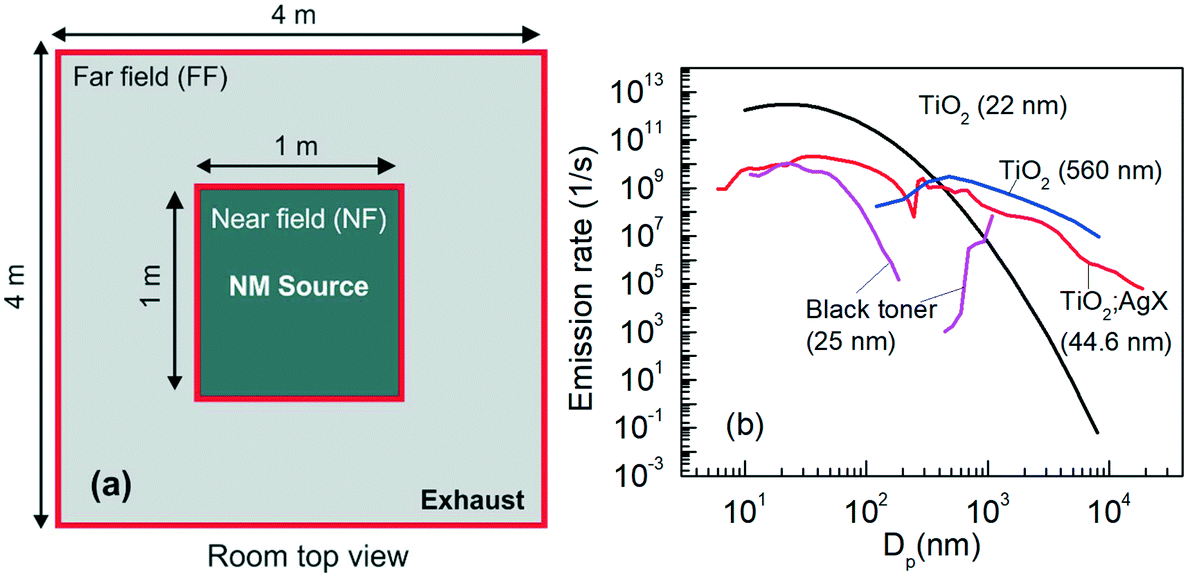 | ||
| Fig. 3 (a) The computational domain, i.e., the Room, indicating the near field (NF) where the source of the NMs is located and the far field (FF) where the exhaust is located. The dimensions of each area used in the integrated model are shown. (b) The size-resolved emission rate distributions of the NMs used in this work. Besides the user defined TiO2 (22 nm), all distributions are based on experimental data.37,39–41 | ||
The initial Dp distributions of the four NMs used in this work are shown in Fig. 3b, namely carbon black (black toner) with a GMD of 25 nm, TiO2 with a GMD of 560 nm, TiO2:AgX particles with a GMD of 44.6 nm and a user defined distribution which corresponds to TiO2 with a geometric average diameter of 22 nm. TiO2 (22 nm) is theoretically constructed viaeqn (3) with N = 2.5 × 10¹², σG = 2.1 and μG = 22 nm. The emission rate, n, is chosen so that a realistic occupational exposure scenario is generated. Specifically, the average NM concentration in the NF using the selected n value results in a time weighted average (TWA) of around 5.8 mg m−3 for the NF and 3.9 mg m−3 for the FF for an 8 hours work shift. These values have a regulatory relevance, since the US National Institute for Occupational Safety and Health (NIOSH) has suggested that for TiO2 NMs a value of 0.3 mg m−3 is the recommended exposure limit (REL) over a 10 hours workday and 40 hours week,42 while 1.2 mg m−3 has been proposed by the Japanese Industrial Technology Development Organization (NEDO).43 The occupational exposure scenarios for comparing the NMs deposition data generated from the lung exposure and the PBPK model utilised the 22 nm TiO2 NMs, as the PBPK model was constructed using biodistribution data referring to 22 nm TiO2 and, thus, the PBPK simulations for TiO2 NMs with similar diameter are considered to be the most credible currently.
The lung exposure and PBPK applications take as input the NM concentrations from each exposure area (room) and compute the deposited dose of the NMs in the various regions of the human respiratory system (and throughout the body in the case of the PBPK model). Using eqn (3), a theoretical lognormal particle size distribution is generated based on 30 size bins. Using the NM density, the particle concentration is converted into mass concentration, which is then provided as input to the two models. Following that, the two models calculate the deposited mass per bin for each lung region, and the deposited mass summation of all bins for each region is the final reported product. All exposure simulations refer to spherical particles.
The lung exposure application can compute the deposited dose in the alveolar, head airways and tracheobronchial regions, while the PBPK application, besides the aforementioned regions, offers the ability to simulate the resulting biodistribution in the organs of the systemic circulation, i.e., the translocation of the NMs through the air-lung barrier. The inhalation rates used as inputs to the lung exposure and PBPK models in order to simulate different inhalation conditions are shown in Table 1.
| Female | Male | |
|---|---|---|
| Sitting | 6.5 | 9 |
| Light exercise | 20.8 | 25 |
| Heavy exercise | 45 | 50 |
Although all three model applications are independent, the lung exposure and PBPK applications have an embedded module allowing the generation of NM concentration-time profiles using the multi-box aerosol model, but also give to the user the ability to provide custom-made occupational exposure scenarios. All applications are freely available and can be found at:
Multi-box aerosol application: https://aerosol.cloud.nanosolveit.eu/
Lung exposure: https://lungexposure.cloud.nanosolveit.eu/
PBPK: https://exposurepbpk.cloud.nanosolveit.eu/
These web applications are offered to the community through the NanoSolveIT44 cloud platform (https://cloud.nanosolveit.eu/) and contribute to implementation of a comprehensive nanoinformatics-driven decision-support strategy that promotes nanosafety based on innovative in silico methods, models and tools, while reducing reliance on animal testing, which is the major goal of the project. Presenting the developed nanoinformatics tools as freely available, user-friendly web applications accompanied by appropriate model documentation and user guides significantly increases model accessibility and usage, even by non-experts. Enhanced understanding, utilization and acceptance of nanoinformatics tools can bridge the gap between nanosafety-related regulators and industry, thus accelerating the industrial and commercial exploitation of nanomaterials in a variety of consumer applications, whilst minimising their environmental and human health impacts.
3. Results
Given that no human in vivo data are available for validating the models, we compare the results obtained from the lung exposure and the PBPK model with the output of the multiple-path particle dosimetry (MPPD) model,45 which is considered the gold standard in the calculation of particle deposition in the respiratory system. Then, the deposited doses reported by the two models are compared against each other for different time intervals, room regions, exercise levels and sexes. This comparison aims at exploring the effect of NM clearance and translocation from the lung into the blood circulation, which are included in the PBPK model but not in the lung exposure model, on the exposure dose, and thus the likely effects over time, which future iterations of our IATA will also incorporate. Finally, additional simulations are performed using the lung exposure model in order to estimate the deposited dose of various NMs in the NF and FF areas of the computational domain.3.1 Comparison of the models with MPPD in the TiO2 NM case
The lung exposure, PBPK and MPPD applications were used to collect and compare biodistribution simulation results, regarding exposure of female and male workers to 22 nm TiO2 NMs, under light exercise as part of an 8 hours work shift (Fig. 4). The MPPD does not include an option for providing a detailed exposure time series, but only allows for an hourly variation of the external concentration, and, thus, a steady concentration equal to 5.85 mg m−3 was used in all three models. Additionally, the Yeh/Schum symmetric lung deposition model was used for the MPPD calculations.46 Since deposition eqn (7)–(9) refer to nose breathing, the same breathing route was considered for the MPPD model. Regarding inhalation and lung parameters, all models used the same values to ensure that any differences between them are related to the underlying model. The input data provided to the MPPD are presented in Table S5.† | ||
| Fig. 4 Comparison of the accumulated mass of TiO2 NMs in the three different lung regions determined using the lung exposure, PBPK and MPPD models for (a) female and (b) male humans under light exercise level physical activity during occupational exposure for 8 hours to 22 nm TiO2 NMs. | ||
The slight differences in the deposited mass between the lung exposure application and the MPPD arise from differences in the deposition fractions. Specifically, in the lung exposure application the deposited mass in the alveolar region is slightly greater than that recorded by the MPPD model, while the reverse behaviour is applied to the head airways. The two models estimate a similar deposited mass for the tracheobronchial region. The greater differences between the deposited mass of these two models and the PBPK model in the alveolar and head airways regions are due to the pulmonary clearance terms included in the PBPK model, i.e., tracheobronchial and head airways NM clearance, and the translocation of NMs from the lung into the systemic circulation, which are initiated as soon as the first particles are deposited in the respiratory system.
3.2 Lung exposure versus PBPK model performance in the TiO2 NMs case – effect of clearance
The effect of clearance on the final deposited dose was investigated via a series of in silico experiments, in which the 22 nm TiO2 NMs were used. Two scenarios were considered; a short term exposure lasting 600 seconds and a long term one, which represented a full 8 hours working day i.e., 28![[thin space (1/6-em)]](https://www.rsc.org/images/entities/char_2009.gif) 800 seconds. In the first case the source was active for the first 300 seconds. For the working day, the simulation time was partitioned into 16 timesteps of 1800 seconds (30 minutes) each with the source being active for the first 900 seconds of each step. The evolution of the average NM concentration, over the Dp distribution, for the NF (i.e., close to the NMs source where the worker is performing the handling operation) is shown in Fig. 5.
800 seconds. In the first case the source was active for the first 300 seconds. For the working day, the simulation time was partitioned into 16 timesteps of 1800 seconds (30 minutes) each with the source being active for the first 900 seconds of each step. The evolution of the average NM concentration, over the Dp distribution, for the NF (i.e., close to the NMs source where the worker is performing the handling operation) is shown in Fig. 5.
 | ||
| Fig. 5 Average concentration evolution of TiO2 NMs (22 nm) in the NF for (a) 600 s simulation time with the source being active for the first 300 s, and (b) over the working day (28800 s equivalent to 8 h) of simulation time. In (b) the simulation time is partitioned into 16 timesteps of 1800 s (30 min) each with the source being active for the first 900 s (15 min) of each step. | ||
Fig. 6 presents the TiO2 NM deposited doses after 600 s of exposure in the NF and FF areas, respectively, for both female and male workers under different exercise levels. As expected, the accumulated mass decreases as we move from the NF, where the source of the NMs is located, to the FF, where the exhaust is located, and increases from sitting to heavy exercise. Male workers register the largest amount of accumulated mass during heavy exercise, due to the higher underlying inhalation rate. In all cases, the alveolar region records the largest amount of accumulated particle mass followed by the tracheobronchial and the head airways regions respectively, in terms of the estimated deposition fractions obtained from the Hinds' equations for the particular particle diameter (Fig. S1†).
 | ||
| Fig. 6 Accumulated mass of the particles from the TiO2 NMs (22 nm) emission computed for 600 s by the lung exposure and PBPK models for female and male workers under different inhalation conditions (sitting, light exercise and heavy exercise) in the (a) NF and (b) FF areas. | ||
Comparison of the lung exposure and PBPK models under the short-term exposure scenario case (Fig. 6) reveals small differences in terms of the computed accumulated NM masses. This is an expected result, because the two models use the same equations for estimating the deposition in the various respiratory regions. Furthermore, the exposure duration is too short compared with the clearance kinetics of the PBPK model to result in substantially reduced accumulated TiO2 mass over short exposure times.
Fig. 7 presents the computed accumulated mass over a full working day in both the NF and FF areas. In this case the exposure duration is long enough for evident alterations in the final deposited mass estimated by the two models to be recorded. In the alveolar region, the clearance term of the PBPK model is slow, since it refers to long term clearance mediated by macrophages (phagocytosing cells as shown in Fig. 2), and the final accumulated mass is not affected significantly by it, as in the short-term exposure case. On the other hand, the clearance from the tracheobronchial and the head airways regions, which directs trapped NMs to the gastrointestinal tract, is fast enough that the decrease in the accumulated mass is important.
 | ||
| Fig. 7 Accumulated mass of particles from the TiO2 NMs (22 nm) emission scenario computed for a working day (8 h) by the lung exposure and PBPK models for female and male workers under different inhalation conditions (sitting, light exercise and heavy exercise) in the (a) NF and (b) FF areas. | ||
To further explore the effect of clearance on the accumulated NM mass we performed simulations for a longer duration using the PBPK model. Specifically, the same 8 hours exposure for a female worker under heavy exercise load in the NF was used as input and the model simulated the evolution of the biodistribution for an extra 98 hours (100 hours of total simulation time). The results are presented in Fig. 8 and illustrate that the alveolar clearance by phagocytizing cells is slow, meaning that the TiO2 mass accumulates in the alveolar region. The tracheobronchial clearance is fast for the first 40 h leading to a rapid decrease in the accumulated mass, but after 40 h, the accumulated mass decreases at a much slower rate. Finally, the clearance of the head airways is fast, meaning that all of the TiO2 dose is removed within 50 h.
 | ||
| Fig. 8 Evolution of the accumulated TiO2 NM (22 nm) mass over 100 hours following 8 hours of exposure of a female worker under heavy exercise conditions in the NF predicted using the human PBPK model. | ||
3.3 Accumulated mass computations for other NMs
Since the PBPK model does not currently support other NMs besides TiO2, we employed the lung exposure model to compute the accumulated mass of the other NMs, i.e., TiO2:AgX (44.6 nm), TiO2 (460 nm) and carbon black from toner (25 nm), for a working day, using the exposure scenario described previously (8 h exposure, split into 16 segments of 30 minutes with the NMs source active for the first 15 minutes of each time segment) using the particle emission rates shown in Fig. 3b. The results are shown in Fig. S2–S4.† As in the case of the TiO2 NMs (22 nm), the accumulated mass of all NMs decreases as we move from NF to FF and increases from sitting to heavy exercise.Fig. S2–S4† show that most of the particle mass is deposited in the head airways. While the TiO2 (22 nm) distribution was constructed using eqn (3), the distributions of the other NMs were derived from experimental data meaning that background particles or other aerosol dynamic effects, such as e.g., aggregation and agglomeration, may influence the measured particle number size distributions and thus the calculated size-resolved emission rates. In the case of TiO2 (560 nm), sanding fragments containing nanosized TiO2 were measured.
From the materials studied, the maximum accumulated mass is 1148.5 mg and is observed in the head airways for TiO2 (560 nm), for male workers during heavy exercise located in the NF, which corresponds to approximately 2.8 × 10¹⁷ TiO2 particles of different sizes according to the experimentally derived size distribution. In terms of maximum accumulated particle number, the same scenario, i.e., male workers during heavy exercise in the NF, TiO2:AgX yields the highest deposition in the head airways, with roughly 1.85 × 10¹⁸ particles (see Fig. 9). This outcome is expected since NMs with bigger particle sizes have lower particle numbers in equivalent mass.
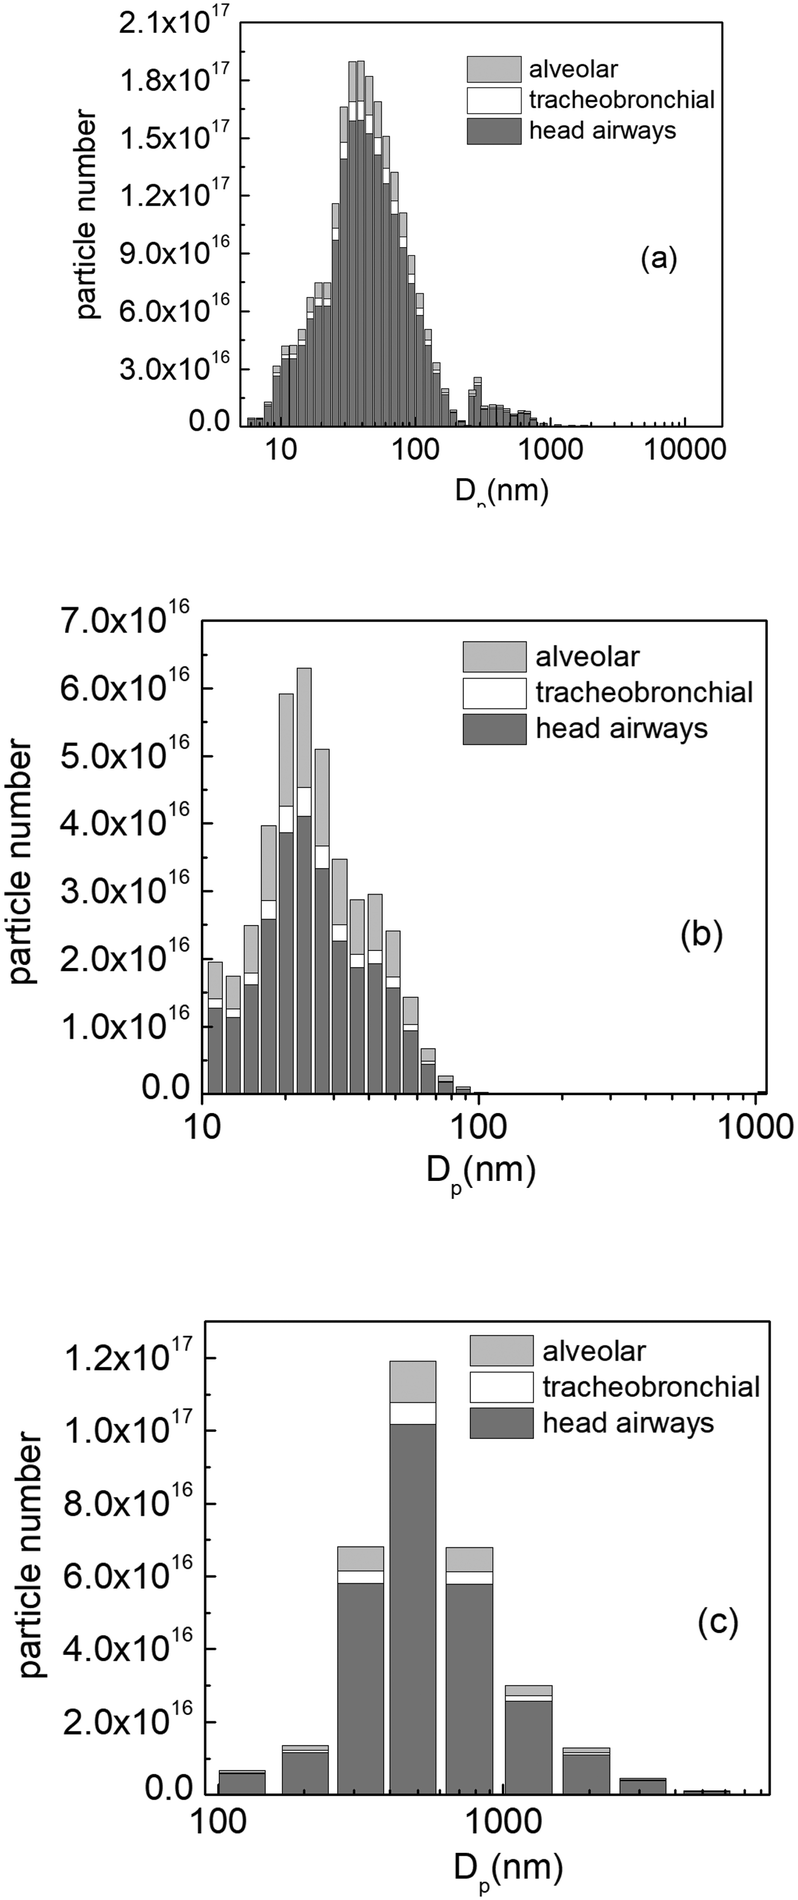 | ||
| Fig. 9 Particle number distribution for (a) TiO2:AgX, (b) black tonner and (c) TiO2. | ||
To understand the impact of the variance of the size distribution on the deposited dose, we introduce an example using the distribution of TiO2:AgX (44.6 nm), with the analysis holding for all other NMs. The value of σG (unitless), the geometrical standard deviation of the particle size distribution, for the experimental distribution of TiO2:AgX (44.6 nm) is 2.5. Using eqn (3), we constructed two alternative distributions with σG = 2.1 and 1.5 (Fig. 10a). The computed accumulated NM masses are shown in Fig. 10b for a female worker during light exercise in the NF area. The results are normalized against the maximum deposited mass in each case, in order to avoid comparability issues, since the accumulated mass varies significantly in each case. As expected, as σG decreases and the distribution becomes narrower around the geometric mean, the ratios of the accumulated NMs masses come into line with the deposition fraction calculated according to Hinds' equation for a particle with a GMD of 44.6 nm. In other words, for similar GMDs, the greater the σG the higher the deposition in the head airways regions.
 | ||
| Fig. 10 TiO2:AgX (44.6 nm) (a) distributions and (b) computed accumulated mass for σG = 2.5, 2.1 and 1.5 for a female undertaking light exercise in the NF area over an 8 h working day. | ||
3.4 Which model provides the optimal predictions for RA and LCIA?
Two in silico approaches for assessing the deposition of NMs in the human respiratory system in an occupational setting are presented, namely the multi-box aerosol model coupled with the lung exposure model and the integration of the multi-box aerosol model with a PBPK model, which form the basis for next generation risk assessment through in silico determination of exposure and consequent human health. At first glance, there seems to be a significant overlap between the two approaches, because both models use the same empirical equations for deriving the deposition fractions. However, the PBPK model includes additional equations to describe in a more holistic manner the biodistribution of TiO2 NMs in the human body after inhalation exposure, which allows simulation of long-term exposure scenarios with more accurate results. Still, the derivation of a PBPK model is a demanding task and requires a comprehensive set of experimental data, such that PBPK models are currently limited to only a handful of NMs, as in the present work for the case of TiO2 NMs. On the other hand, the lung exposure model can calculate the deposited NM mass only in the head airways, alveolar and tracheobronchial regions but for any NM where the inhaled size distribution is known.A weakness of the lung exposure model covered by the PBPK model is the absence of systemic clearance. Therefore, using the lung exposure model under acute exposure scenarios can lead to safe results regarding the deposited mass of NMs in the respiratory system. For longer exposure durations, be it a working day, week, month or year, using the lung exposure model can induce notable overestimations in the calculated mass accumulation, which for precautionary reasons in the context of risk assessment for human health may be beneficial. Thus, the lung exposure application can provide an upper limit for the deposited dose resulting from occupational exposure scenarios to varying concentrations of a NM with a known size distribution, in the absence of more complex mechanistic models.
The deposited mass estimated by both models was similar to the one reported by the MPPD. MPPD is a robust tool that includes a multitude of mechanistic models for estimating the deposition of a wide variety of materials under different exposure scenarios. However, one of its major drawbacks is that it doesn't offer the ability to provide complex concentration-time profiles. This makes it a tool that is more suited to controlled experimental conditions rather than occupational exposure scenarios stemming from complex industrial applications. The lung exposure and PBPK applications fill this gap, allowing for deposition estimation of complex, real-world applications.
Fig. 11 introduces the proposed framework for lung internal deposition prediction. If the spatiotemporal evolution of the concentration of the NM is not known, then it can be estimated using the multi-box aerosol model. The concentration-time profile can then be parsed as input to one of the two biodistribution models. If the exposure is of acute nature, e.g., the result of an accident, then the lung exposure model can be used to estimate the deposited mass in the respiratory system without significant loss of precision due to the absence of clearance mechanisms. The PBPK model is a better tool for estimation of mass deposition following a chronic exposure. It has to be noted that so far, the PBPK model can be used for assessing the internal exposure of TiO2 (preferably around 22 nm) NMs, but can be extended to include more NMs as in vivo data become available or as read-across models increase in power. The lung exposure model can be used for exposure to TiO2, TiO2:AgX, black tonner and carbon black, but can also be used for any NM provided that the particle size distribution emission rate is known.
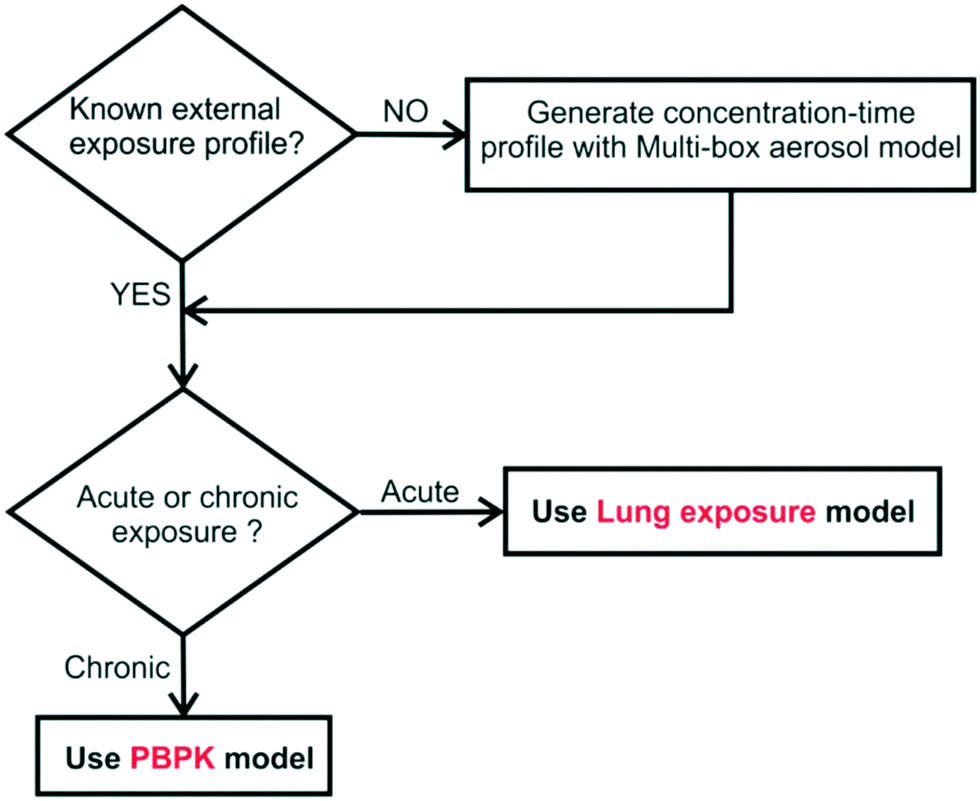 | ||
| Fig. 11 Proposed framework for NMs internal deposition prediction, depending on the available input information. | ||
The underlying goal of deposition prediction is to link it with the toxicity of the material. For conventional chemicals, toxicity is directly related to the amount of administered material, so the most common dose metric in the case of inhalation is the total deposited mass. In the case of NMs, chemical composition is not the only driver of toxicity, with other factors, e.g., NM size, playing an important role as well. Therefore, administered mass alone is not sufficient as a metric to account for the toxicity of a NM, so depending on the exposure conditions, route, NM etc., different dose metrics such as particle number, particle volume or surface area should be examined.47 For instance, Braakhuis et al.48 concluded that in the case of pulmonary inflammation due to inhalation exposure to silver NMs, the appropriate dose metric is the particle surface area in the alveoli. The tools developed in this work report the final deposited mass in three regions of the respiratory system after inhalation exposure, but can be extended to report different dose metrics, e.g., particle number as illustrated in the previous section, or an even more advanced output with particle number per size bin.
The natural next step for enabling risk characterization of occupational inhalation exposure to NMs is the inclusion of hazard values as a toxicity metric related to the NM exposure. For human health risk assessment, the derived no-effect level (DNEL) or occupational exposure limit (OEL) are used to derive the maximum levels of exposure to a chemical that humans should be exposed to. These values can be combined with the results of the models presented here to form the risk characterization ratio (RCR), with the exposure estimator as the numerator and the DNEL or OEL as the denominator. The risk to humans can be considered acceptable if the estimated exposure levels do not exceed the hazard values, i.e., if RCR < 1.
Unfortunately, due to the multitude of NMs and the range of their toxicological responses, such hazard values are rarely found in literature. Using in vivo dose–response data, the benchmark dose (BMD) approach49–51 can be used to derive the point of departure (POD), also known as a reference point, which is the dose above which adverse effects start to emerge. Dividing the POD by a series of appropriate uncertainty factors can produce the corresponding DNEL. An alternative approach is to estimate the hazard values using predictive modelling. More precisely, nano-Quantitative-Structure–Activity-Relationship (nanoQSAR)52,53 models can build a mapping from the structure and physicochemical characteristics of the NMs to the desired response, in this case the hazard values, utilizing data-rich NMs to make predictions about data-poor ones.
Finally, the output of the deposition model could be linked to relevant adverse outcome pathways (AOPs),54 a tool in toxicology and risk assessment for representing biological knowledge spanning multiple biological levels. The AOP links a biological perturbation caused by a stressor through the molecular initiating event to an adverse outcome through a series of key events.
Several NMs-specific AOPs have already been proposed, including a putative AOP for lung fibrosis, in which high exposure, in terms of mass, duration or both, leads to loss of tissue elasticity and reduced lung function and the resulting chronic inflammation is also linked to onset of cancer and other diseases.55 More recently, a putative AOP for deposition and retention of NMs in the lung leading to cancer has been proposed that includes in silico prediction of lung deposited dose.56 The latter example demonstrates how tools for predicting mass deposition in the respiratory system can be linked to AOPs.
4. Conclusion
The presented framework illustrates two different approaches to predict the internal deposition and distribution of NMs following inhalation exposure in an occupational exposure setting. The developed tools have been presented as ready-to-use, well-documented web applications, to support risk-free use of NMs in the near future. In this direction, the integration of hazard values for different NMs along with inclusion of different personal protective equipment into the applications will enable the conduction of a complete occupational risk assessment, and assessment of the effectiveness of various risk mitigation measures as part of the risk management. Extension of the approach to develop an overall framework for assessment of environmental exposures to NMs is also underway.Conflicts of interest
There are no conflicts to declare.Acknowledgements
This work received funding from the European Union's Horizon 2020 research and innovation programme via NanoSolveIT Project under grant agreement number 814572.References
- F. Aznar Mollá, C. Fito-López, J. A. Heredia Alvaro and F. Huertas-López, New Tools to Support the Risk Assessment Process of Nanomaterials in the Insurance Sector, Int. J. Environ. Res. Public Health, 2021, 18(13), 6985–7004 CrossRef PubMed.
- G. Chen, W. Peijnenburg, Y. Xiao and M. G. Vijver, Current Knowledge on the Use of Computational Toxicology in Hazard Assessment of Metallic Engineered Nanomaterials, Int. J. Mol. Sci., 2017, 18(7), 1504–1524 CrossRef PubMed.
- H. J. P. Marvin, Y. Bouzembrak, E. M. Janssen, M. van der Zande, F. Murphy and B. Sheehan, et al., Application of Bayesian networks for hazard ranking of nanomaterials to support human health risk assessment, Nanotoxicology, 2017, 11(1), 123–133 CrossRef CAS PubMed.
- C. Oksel, C. Y. Ma and X. Z. Wang, Structure-activity Relationship Models for Hazard Assessment and Risk Management of Engineered Nanomaterials, New Paradigm Part Sci Technol Proc 7th World Congr Part Technol, 2015, vol. 102, pp. 1500–1510 Search PubMed.
- J. A. J. Meesters, A. A. Koelmans, J. T. K. Quik, A. J. Hendriks and D. van de Meent, Multimedia Modeling of Engineered Nanoparticles with SimpleBox4nano: Model Definition and Evaluation, Environ. Sci. Technol., 2014, 48(10), 5726–5736 CrossRef CAS PubMed.
- J. A. J. Meesters, W. J. G. M. Peijnenburg, A. J. Hendriks, D. Van de Meent and J. T. K. Quik, A model sensitivity analysis to determine the most important physicochemical properties driving environmental fate and exposure of engineered nanoparticles, Environ. Sci.: Nano, 2019, 6(7), 2049–2060 RSC.
- M. Hauser and B. Nowack, Probabilistic modelling of nanobiomaterial release from medical applications into the environment, Environ. Int., 2021, 146, 106184 CrossRef CAS PubMed.
- T. Y. Sun, N. A. Bornhöft, K. Hungerbühler and B. Nowack, Dynamic Probabilistic Modeling of Environmental Emissions of Engineered Nanomaterials, Environ. Sci. Technol., 2016, 50(9), 4701–4711 CrossRef CAS PubMed.
- R. Hischier, Framework for LCI modelling of releases of manufactured nanomaterials along their life cycle, Int. J. Life Cycle Assess., 2014, 19(4), 838–849 CrossRef CAS.
- M. P. Tsang, D. Li, K. L. Garner, A. A. Keller, S. Suh and G. W. Sonnemann, Modeling human health characterization factors for indoor nanomaterial emissions in life cycle assessment: a case-study of titanium dioxide, Environ. Sci.: Nano, 2017, 4(8), 1705–1721 RSC.
- A. C. Ø. Jensen, M. Dal Maso, A. J. Koivisto, E. Belut, A. Meyer-Plath and M. Van Tongeren, et al., Comparison of Geometrical Layouts for a Multi-Box Aerosol Model from a Single-Chamber Dispersion Study, Environments, 2018, 5(5), 52–68 CrossRef.
- L. Xiaoping, N. Jianlei and G. Naiping, Spatial distribution of human respiratory droplet residuals and exposure risk for the co-occupant under different ventilation methods, HVACR Res., 2011, 17(4), 432–445 Search PubMed.
- Y.-S. Cheng, Condensation Particle Counters, In: Aerosol Measurement [Internet], John Wiley & Sons, Ltd, 2011, pp. 381–392, Available from: DOI:10.1002/9781118001684.ch17.
- P. J. Drivas, P. A. Valberg, B. L. Murphy and R. Wilson, Modeling Indoor Air Exposure from Short-Term Point Source Releases, Indoor Air, 1996, 6(4), 271–277 CrossRef CAS.
- C. Y. H. Chao and M. P. Wan, A study of the dispersion of expiratory aerosols in unidirectional downward and ceiling-return type airflows using a multiphase approach, Indoor Air, 2006, 16(4), 296–312 CrossRef CAS PubMed.
- N. P. Gao and J. L. Niu, Modeling particle dispersion and deposition in indoor environments, Atmos. Environ., 2007, 41(18), 3862–3876 CrossRef CAS PubMed.
- C. Chen, W. Liu, C.-H. Lin and Q. Chen, Comparing the Markov Chain Model with the Eulerian and Lagrangian Models for Indoor Transient Particle Transport Simulations, Aerosol Sci. Technol., 2015, 49(10), 857–871 CrossRef CAS.
- M. A. Jayjock, T. Armstrong and M. Taylor, The Daubert standard as applied to exposure assessment modeling using the two-zone (NF/FF) model estimation of indoor air breathing zone concentration as an example, J. Occup. Environ. Hyg., 2011, 8(11), D114–D122 CrossRef PubMed.
- E. J. Furtaw Jr, M. D. Pandian, D. R. Nelson and J. V. Behar, Modeling Indoor Air Concentrations Near Emission Sources in Imperfectly Mixed Rooms, J. Air Waste Manage. Assoc., 1996, 46(9), 861–868 CrossRef CAS PubMed.
- W. W. Nazaroff and G. R. Cass, Mathematical modeling of indoor aerosol dynamics, Environ. Sci. Technol., 1989, 23(2), 157–166 CrossRef CAS.
- J. W. Cherrie and T. Schneider, Validation of a New Method for Structured Subjective Assessment of Past Concentrations, Ann. Occup. Hyg., 1999, 43(4), 235–245 CrossRef CAS.
- T. Hussein, H. Korhonen, E. Herrmann, K. Hämeri, K. E. J. Lehtinen and M. Kulmala, Emission Rates Due to Indoor Activities: Indoor Aerosol Model Development, Evaluation, and Applications, Aerosol Sci. Technol., 2005, 39(11), 1111–1127 CrossRef CAS.
- B. Mølgaard, A.-K. Viitanen, A. Kangas, M. Huhtiniemi, S. T. Larsen and E. Vanhala, et al., Exposure to airborne particles and volatile organic compounds from polyurethane molding, spray painting, lacquering, and gluing in a workshop, Int. J. Environ. Res. Public Health, 2015, 12(4), 3756–3773 CrossRef PubMed.
- J. W. Cherrie, L. Maccalman, W. Fransman, E. Tielemans, M. Tischer and M. Van Tongeren, Revisiting the effect of room size and general ventilation on the relationship between near- and far-field air concentrations, Ann. Occup. Hyg., 2011, 55(9), 1006–1015 CAS.
- G. H. Ganser and P. Hewett, Models for nearly every occasion: Part II - Two box models, J. Occup. Environ. Hyg., 2017, 14(1), 58–71 CrossRef PubMed.
- A. J. Koivisto, A. C. Ø. Jensen, M. Levin, K. I. Kling, M. D. Maso and S. H. Nielsen, et al., Testing the near field/far field model performance for prediction of particulate matter emissions in a paint factory, Environ. Sci.: Processes Impacts, 2015, 17(1), 62–73 RSC.
- International Commission on Radiological Protection, Human respiratory tract model for radiological protection: a report of a Task Group of the International Commission on Radiological Protection: adopted by the Commission in September 1993, Pergamon Press, Oxford, 1994 Search PubMed.
- N. Cheimarios, S. Harrison, A. C. Ø. Jensen, P. Karatzas, A. Tsoumanis and P. Doganis, et al., Chapter FOUR - NanoSolveIT integration of tools for assessment of human and environmental exposure to nanomaterials, In: Handbook of Functionalized Nanomaterials [Internet], ed. C. Hussain and V. Kumar, Elsevier, 2021, pp. 81–120, Available from: https://www.sciencedirect.com/science/article/pii/B9780128224151000019 Search PubMed.
- R. Guichard, A. Tanière, E. Belut and N. Rimbert, Simulation of nanoparticle coagulation under Brownian motion and turbulence in a differential–algebraic framework: Developments and applications, Int. J. Multiphase Flow, 2014, 64, 73–84 CrossRef CAS.
- K. Lai AC and W. W. Nazaroff, MODELING INDOOR PARTICLE DEPOSITION FROM TURBULENT FLOW ONTO SMOOTH SURFACES, J. Aerosol Sci., 2000, 31(4), 463–476 CrossRef.
- W. C. Hinds, Aerosol Technology: Properties, Behavior, and Measurement of Airborne Particles [Internet], Wiley, 1999, (A Wiley interscience publication), Available from: https://books.google.gr/books?id=ORxSAAAAMAAJ Search PubMed.
- M. Senzui, T. Tamura, K. Miura, Y. Ikarashi, Y. Watanabe and M. Fujii, Study on penetration of titanium dioxide (TiO(2)) nanoparticles into intact and damaged skin in vitro, J. Toxicol. Sci., 2010, 35(1), 107–113 CrossRef CAS PubMed.
- M. Crosera, A. Prodi, M. Mauro, M. Pelin, C. Florio and F. Bellomo, et al., Titanium Dioxide Nanoparticle Penetration into the Skin and Effects on HaCaT Cells, Int. J. Environ. Res. Public Health, 2015, 12(8), 9282–9297 CrossRef CAS PubMed.
- W. G. Kreyling, U. Holzwarth, C. Schleh, S. Hirn, A. Wenk and M. Schäffler, et al., Quantitative biokinetics over a 28 day period of freshly generated, pristine, 20 nm titanium dioxide nanoparticle aerosols in healthy adult rats after a single two-hour inhalation exposure, Part. Fibre Toxicol., 2019, 16(1), 29 CrossRef PubMed.
- M. D. Hoffman and A. Gelman, The No-U-Turn Sampler: Adaptively Setting Path Lengths in Hamiltonian Monte Carlo, J. Mach. Learn. Res., 2014, 15(47), 1593–1623 Search PubMed.
- Environmental Protection Agency (EPA), Reference physiological parameters in pharmacokinetic modeling, Office of Health and Environmental Assessment, Washington DC, 1988 Search PubMed.
- A. J. Koivisto, T. Hussein, R. Niemelä, T. Tuomi and K. Hämeri, Impact of particle emissions of new laser printers on modeled office room, Atmos. Environ., 2010, 44(17), 2140–2146 CrossRef CAS.
- C. Thiel, S. Schneckener, M. Krauss, A. Ghallab, U. Hofmann and T. Kanacher, et al., A Systematic Evaluation of the Use of Physiologically Based Pharmacokinetic Modeling for Cross-Species Extrapolation, J. Pharm. Sci., 2015, 104(1), 191–206 CrossRef CAS PubMed.
- V. Gomez, M. Levin, A. T. Saber, S. Irusta, M. Dal Maso and R. Hanoi, et al., Comparison of Dust Release from Epoxy and Paint Nanocomposites and Conventional Products during Sanding and Sawing, Ann. Occup. Hyg., 2014, 58(8), 983–994 CAS.
- A. J. Koivisto, A. C. Ø. Jensen, K. I. Kling, J. Kling, H. C. Budtz and I. K. Koponen, et al., Particle emission rates during electrostatic spray deposition of TiO2 nanoparticle-based photoactive coating, J. Hazard. Mater., 2018, 341, 218–227 CrossRef PubMed.
- A. J. Koivisto, K. I. Kling, A. S. Fonseca, A. B. Bluhme, M. Moreman and M. Yu, et al., Dip coating of air purifier ceramic honeycombs with photocatalytic TiO2 nanoparticles: A case study for occupational exposure, Sci. Total Environ., 2018, 630, 1283–1291 CrossRef CAS PubMed.
- D. A. Dankovic and E. D. Kuempel, Occupational exposure to titanium dioxide, National Institute for Occupational Safety and Health E and IDivision Titanium Dioxide Document Development Team, National Institute for Occupational Safety and Health E and IDivision, editors, 2011, Available from: https://stacks.cdc.gov/view/cdc/5922 Search PubMed.
- H. Shi, R. Magaye, V. Castranova and J. Zhao, Titanium dioxide nanoparticles: a review of current toxicological data, Part. Fibre Toxicol., 2013, 10(1), 15 CrossRef CAS PubMed.
- A. Afantitis, G. Melagraki, P. Isigonis, A. Tsoumanis, D. D. Varsou and E. Valsami-Jones, et al., NanoSolveIT Project: Driving nanoinformatics research to develop innovative and integrated tools for in silico nanosafety assessment, Comput. Struct. Biotechnol. J., 2020, 18, 583–602 CrossRef CAS PubMed.
- O. T. Price, B. Asgharian, F. J. Miller, F. R. Cassee and R. de Winter-Sorkina, Multiple Path Particle Dosimetry model (MPPD v1.0): A model for human and rat airway particle dosimetry, Mult Path Aerosol Dosim Model MPPD V10 Een Model Voor Dosim Van Aerosolen Luchtwegen Van Mens En Rat, 2002 Search PubMed.
- H.-C. Yeh and G. M. Schum, Models of human lung airways and their application to inhaled particle deposition, Bull. Math. Biol., 1980, 42(3), 461–480 CrossRef CAS PubMed.
- C. J. E. Delmaar, W. J. G. M. Peijnenburg, A. G. Oomen, J. Chen, W. H. de Jong and A. J. A. M. Sips, et al., A practical approach to determine dose metrics for nanomaterials, Environ. Toxicol. Chem., 2015, 34(5), 1015–1022 CrossRef CAS PubMed.
- H. M. Braakhuis, F. R. Cassee, P. H. B. Fokkens, L. J. J. de la Fonteyne, A. G. Oomen and P. Krystek, et al., Identification of the appropriate dose metric for pulmonary inflammation of silver nanoparticles in an inhalation toxicity study, Nanotoxicology, 2016, 10(1), 63–73 CAS.
- EFSA Scientific Committee, A. Hardy, D. Benford, T. Halldorsson, M. J. Jeger and K. H. Knutsen, et al., Update: use of the benchmark dose approach in risk assessment, EFSA J., 2017, 15(1), e04658 Search PubMed.
- L. T. Haber, M. L. Dourson, B. C. Allen, R. C. Hertzberg, A. Parker and M. J. Vincent, et al., Benchmark dose (BMD) modeling: current practice, issues, and challenges, Crit. Rev. Toxicol., 2018, 48(5), 387–415 CrossRef PubMed.
- European Food Safety Authority (EFSA), Guidance of the Scientific Committee on Use of the benchmark dose approach in risk assessment, EFSA J., 2009, 7(6), 1150 Search PubMed.
- D. A. Winkler, E. Mombelli, A. Pietroiusti, L. Tran, A. Worth and B. Fadeel, et al., Applying quantitative structure–activity relationship approaches to nanotoxicology: Current status and future potential, Nanotoxicology, 2013, 313(1), 15–23 CAS.
- A. Gajewicz, K. Jagiello, M. T. D. Cronin, J. Leszczynski and T. Puzyn, Addressing a bottle neck for regulation of nanomaterials: quantitative read-across (Nano-QRA) algorithm for cases when only limited data is available, Environ. Sci.: Nano, 2017, 4(2), 346–358 RSC.
- K. Gerloff, B. Landesmann, A. Worth, S. Munn, T. Palosaari and M. Whelan, The Adverse Outcome Pathway approach in nanotoxicology, Comput. Toxicol., 2017, 1, 3–11 CrossRef.
- A. J. Clippinger, A. Ahluwalia, D. Allen, J. C. Bonner, W. Casey and V. Castranova, et al., Expert consensus on an in vitro approach to assess pulmonary fibrogenic potential of aerosolized nanomaterials, Arch. Toxicol., 2016, 90(7), 1769–1783 CrossRef CAS PubMed.
- P. Nymark, H. L. Karlsson, S. Halappanavar and U. Vogel, Adverse Outcome Pathway Development for Assessment of Lung Carcinogenicity by Nanoparticles, Front. Toxicol., 2021, 3, 21 Search PubMed.
Footnotes |
| † Electronic supplementary information (ESI) available. See DOI: 10.1039/d1en00956g |
| ‡ These authors contributed equally. |
| This journal is © The Royal Society of Chemistry 2022 |