 Open Access Article
Year-long evaluation of aerosol chemistry and meteorological implications of PM2.5 in an urban area of the Brahmaputra Valley, India†
Shahadev
Rabha
ab,
Nazrul
Islam
ab,
Binoy K.
Saikia
 *ab,
Gyanesh Kumar
Singh
 c,
Adnan Mateen
Qadri
c,
Vivek
Srivastava
c and
Tarun
Gupta
c,
Adnan Mateen
Qadri
c,
Vivek
Srivastava
c and
Tarun
Gupta
 c
c
aCoal and Energy Division, CSIR-North East Institute of Science and Technology, Jorhat-785006, Assam, India. E-mail: bksaikia@neist.res.in; bksaikia@gmail.com
bAcademy of Scientific and Innovative Research (AcSIR), Ghaziabad, 201002, India
cDepartment of Civil Engineering, Indian Institute of Technology, Kanpur-208016, UP, India
First published on 17th November 2022
Abstract
Atmospheric particulate matter (e.g., PM2.5) contributes to deteriorating air quality, causes respiratory and cardiovascular diseases, and risks human health. In this study, we evaluated the mass concentrations and chemical compositions of PM2.5 in an urban area of Northeast India to determine their seasonal variations and the influence of meteorological factors on PM2.5. PM2.5 was sampled in multiple filter substrates; the water-soluble inorganic ions (WSIs), elemental compositions, and organic carbon (OC)-elemental carbon (EC) were determined by using an ion chromatograph, an energy dispersive X-ray fluorescence spectrometer, and a multi-wavelength thermo-optical carbon analyzer, respectively. The annual mean PM2.5 concentration (48.9 ± 37.7 μg m−3) was observed to be approximately ten times higher than the prescribed WHO safe limit (i.e., 5 μg m−3). The results show that the PM2.5 mass is mainly contributed by WSIs (∼30%), carbonaceous matter (∼21%), and inorganic elements (∼9%). Seasonal analysis also shows the highest concentration of PM2.5 in the winter season (95.3 ± 37.9 μg m−3), which was mainly contributed by the WSIs (22.7 ± 8.1 μg m−3) and carbonaceous matter (26.9 ± 13.9 μg m−3). Also, high concentrations of SO42−, NO3−, and soot-EC were found during the winter, indicating the dominance of coal combustion and vehicular source emissions in the region. Meteorological factors such as humidity, wind speed, and temperature along with the transport of regional air masses significantly influenced the PM concentrations of the Brahmaputra Valley in Northeast India within the Indo-Gangetic Plain (IGP). The study implies the necessity of paying attention to the local emission sources and the meteorological conditions in such growing urban areas for improving air quality.
Environmental significanceThe Indo-Gangetic Plain (IGP) is the global hot-spot for aerosol research, and the Brahmaputra Valley is one of the fast-growing urban areas within this plain. There is lack of aerosol chemistry in this region with reference to the meteorological parameters. The SO42−, NO3−, and EC/OC databases are determined in order to evaluate the chemistry of this globally relevant area to compare with the other urban areas of the world. The study provides the necessity of giving attention not only to the local emission sources but also to the regional sources and the meteorological conditions in these growing urban areas for improving/mitigating air quality. |
1. Introduction
More than 90% of the population in the world is exposed to high air pollution levels, causing over seven million premature deaths every year.1 India experiences around 1.24 million premature deaths per year due to air pollution, which is about 12% of the country's total deaths.2 Out of the world's top 30 most polluted cities during 2019, India hosts 21 cities.1 Most of these cities are located in the Indo-Gangetic Plain (IGP) which is known as one of the global hotspots of air pollutants.3 The main constituent of air pollution is considered as PM2.5 (particulate matter having an aerodynamic diameter ≤ 2.5 μm) that is harmful to both human health and the environment because of its smaller size which makes it more penetrable into the respiratory system. The 24-hour mean permissible limit for PM2.5 (i.e., 15 μg m−3) prescribed by the World Health Organization (WHO) is frequently exceeded in India.4 Lenient emission standards with poor regulation and increasing anthropogenic activities aggravate particulate pollution in India.5In general, water-soluble inorganic ions (WSIs), carbonaceous matter, and inorganic/metal elements are the main chemical compositions of PM2.5 with variations in concentrations. In Delhi, the capital city of India, the PM2.5 mass was reported to be mainly composed of WSIs (∼42%), total carbon (∼22%), and major and trace elements (∼22%).6 Toxic metals such as Cr, Ni, Zn, Mo, Sn, Sb, V, Co, Cu, Cd, and Pb were found as trace elemental composition of PM2.5 in Kolkata, a highly polluted Indian city.7 Devi et al.8 studied PM2.5 characteristics at seven sites in the IGP where the dominance of carbonaceous matter from vehicular and biomass burning sources were reported. In the Kathmandu Valley, the main compositions of PM1 were organic aerosols (35%), black carbon (26%), and sulfates (21%).8
WSIs such as NH4+, SO42−, and NO3− are the key chemical constituents of PM2.5, which influence the acidity of the particles and precipitation and worsen human health.9,10 In addition, the trace elements such as Si, Ti, V, Mn, Fe, Co, Ni, Zn, Pb, etc., are the main toxic components of PM2.5. Exposure to most of these elements can severely affects human health, causing several cardiovascular diseases and other adverse health effects.11–13 Furthermore, carbonaceous aerosols including organic carbon (OC) and elemental carbon (EC) derived from combustion of fossil fuels and biomass burning are another toxic component of PM2.5.14,15 In addition, carbonaceous aerosols, especially EC, plays a vital role as a climate-forcing agent with strong warming potential.16 Therefore, the effects of PM2.5 are broad and diverse, affecting both ecosystems and human livelihoods.
While the characteristics of PM2.5 have been broadly reported in the mainland of India, there are limited studies in the rapidly urbanized Brahmaputra Valley in the Northeast region of India. Anthropogenic emission sources including brick kilns, biomass burning, and vehicular emissions are significantly increasing PM2.5 pollution in this region.17–20 Apart from emission sources, meteorology also plays a significant role in the formation and dispersion of PM2.5, thus affecting the PM2.5 concentrations.21,22 Transport of regional air mass impacts the PM2.5 concentrations in the Northeast region of India, especially during winter and post-monsoon seasons.23 In this context, comprehensive and quantitative chemical evaluations of PM2.5, their seasonal variation and their relationships with meteorology are essential to understand the particulate pollution in this region within the IGP.
In the present study, we have carried out an extensive and year-long evaluation of PM2.5 chemical compositions along with meteorological parameters and back trajectory analysis to comprehend the seasonality and regional influx of the particulates. This work provides a better enumeration of PM2.5 chemistry in the Brahmaputra Valley site which will be useful for policy makers for designing strategies and regulations for air quality improvement in similar urban areas.
2. Materials and methods
2.1. Sampling site and particulate matter collection
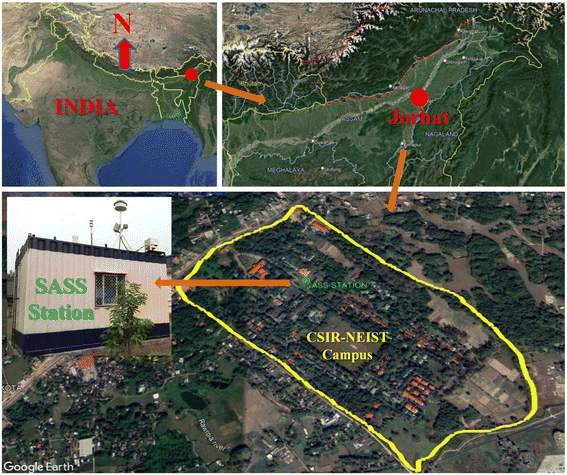
The sampling site (Jorhat) is located in the centre of the Brahmaputra Valley of Assam, Northeastern India, with 26.73 °N latitude and 94.15 °E longitude at 116 m above the mean sea level (see Fig. 1). The valley is in between the Northeastern and Eastern Himalayan ranges. In recent years, with the increase of inhabitants, various developmental activities, biomass burning, and vehicle traffic have increased the anthropogenic emissions in this area. There are many local anthropogenic emission sources in Northeast India, such as coal combustion in brick kilns and household biomass burning for cooking and heating.17,24,25PM2.5 samples were collected with multiple filter substrates (Teflon: Whatman 2 μm PTFE, Nylon: Whatman 1 μm white plain, and Quartz: Pallflex Tissuquartz membrane filter) from 1st January to 31st December 2019 on every alternate day for a 24-hour duration using a five-channel Speciation Air Sampling System (SASS, Met One Instruments Inc., USA) with an operating flow rate of 6.7 Lm−1 in each channel used to sample all three filters simultaneously. Fig. S1† shows the sampling flowchart and filter substrates with the collected samples. In addition, field blank (FB) and lab blank (LB) samples were collected every other week and once a month, respectively. For FB samples the filters were fitted in the sampler for a 24-hour duration without starting the pump and collected. The LB is the blank filter in the laboratory and was analyzed once a month. The PM2.5 mass measurements were performed using the gravimetric method on Teflon filters by determining the weight difference of the filter pre- and post-sampling. Teflon filters were placed in the conditioning environment (ISO 6, class1000 laminar hood), where during a 24-hour equilibration period, the mean temperature remained between 20 ± 2 °C and 23 ± 2 °C and relative humidity between 30 ± 5% and 40 ± 5%, respectively.
2.2. Meteorological data and HYSPLIT analysis
An automatic weather sensor (AIO2, Met One Instruments, USA) was installed at the sampling location to measure meteorological variables simultaneously along with the PM2.5 mass. AIO2 was installed at the same height as the SASS sampler at a distance of 3 meters to avoid any distractions in PM2.5 sampling and meteorological data. Meteorological data were collected continuously at a 1 minute resolution for 24 hours per day during the sampling period. The meteorological data were grouped into four seasons for seasonal variability analysis. Seasons were classified according to the Indian Meteorological Department (IMD) as winter (January and February), pre-monsoon (March, April, and May), monsoon (June, July, August and September), and post-monsoon (October, November, and December).Considering the atmospheric residence time of particulates and their long-range transport, five days back trajectories for each sampling event were computed using the HYSPLIT (Hybrid Single-Particle Lagrangian Integrated Trajectory) model of NOAA-Air Research Laboratory (ARL) GDAS meteorological files (1°, global) at arrival heights of 500, 1000 and 1500 m above the ground level (AGL).26 The arrival height was selected to represent the boundary layer winds and eliminate topographic effects and the local land cover. Cluster analysis was performed separately for each season using the HYSPLIT model (v5.1.0). Four main clusters were selected to represent airflow patterns for the sampling site. Aerosol optical depth (AOD) data were retrieved from the NASA Moderate Resolution Imaging Spectroradiometer (MODIS) Terra satellite. The cluster analysis and AOD data were plotted together using available Google Earth Pro software to correlate the movement of air mass to the sampling site through different AOD regions and the PM2.5 concentration.
2.3. Chemical analysis
The aqueous extracts of PM2.5 samples collected on nylon filters were prepared by using standard sonication and filtration protocol to determine PM2.5-associated water-soluble inorganic ions (WSIs) such as Cl−, SO42−, NO3−, Na+, NH4+, Mg2+, K+, and Ca2+. WSIs were analyzed using dual-channel ion chromatography (Cation unit-882 Compact IC plus and Anion unit-881 Compact IC pro, Metrohm, Switzerland). The uncertainty of the measurement was within ±5% based on duplicate analysis of five samples, and the expected concentrations of ions were always measured at less than 4% (p < 0.05) in standards. The recovery rate of the ions ranges from 95 to 121%, except for Cl− which was 60%. The analysis of WSIs was performed strictly following the quality assurance and quality control (QA&QC).The Teflon filters were subjected to analysis by an energy dispersive X-ray fluorescence spectrometer (ED-XRF, PANalytical, Netherlands) to determine inorganic metals/elements. The elemental measurement was calibrated by using National Institute of Standards and Technology (NIST)–certified standard reference materials (SRMs) and the accuracy range was found to be in between 75 and 98%. Blank filters were also routinely analyzed along with the samples for quality control of the data.
The carbonaceous matter, i.e., organic carbon (OC) and elemental carbon (EC), was analyzed by using a multi-wavelength thermo-optical carbon analyzer (Desert Research Institute, DRI 2015 model, Magee Scientific Corporation, USA). The OC and EC values were determined by the Interagency Monitoring of Protected Visual Environments (IMPROVE) method. The method uses step heating on a punch area (∼0.53 cm2) of quartz filter in a helium environment. For OC determination, the four-step heating consisting of OC1 (140 °C), OC2 (280 °C), OC3 (480 °C), and OC4 (580 °C) was applied. On the other hand, the EC was determined by using three-step heating consisting of EC1 (580 °C), EC2 (740 °C), and EC3 (840 °C). The OC and EC concentrations were further calculated using the following equations.27
| OC = OC1 + OC2 + OC3 + OC4 + OP | (1) |
| EC = EC1 + EC2 + EC3 − OP | (2) |
OP represents the pyrolyzed fraction of carbon. The soot-EC and char-EC were estimated from the carbon fraction data as soot-EC = EC2 + EC3 and char-EC = EC1 − OP.28 Secondary OC was estimated by subtracting primary OC from OC.29 While primary organic carbon (POC) was calculated using each season's minimum OC/EC ratio,30 SOC and POC were estimated by the EC-tracer method using the following equations.31,32
| SOC = OC − POC | (3) |
| POC = [OC/EC]min × EC + c | (4) |
It is to be mentioned that the positive or negative artefact can inflate OC concentration without a QBQ backup filter (quartz filter behind a front quartz filter) or blank filter subtraction. QBQ represents a dynamic blank which gives an inference of the evaporated or volatilized OC from the front filter deposits. The OC concentration of the backup filter was used for artefact correction of the OC concentration of the front filter. The OC artefact was corrected using the following equation33
| OCartifact corrected = OCQF + OCQBQ − 2OCbQF | (5) |
3. Results and discussion
3.1. PM2.5 concentrations and seasonality
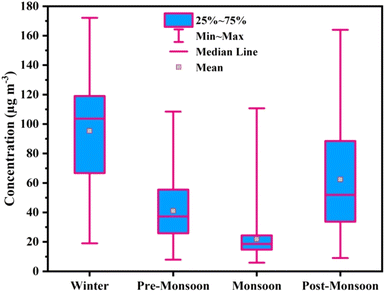
The measured annual mean PM2.5 concentration in the Jorhat urban area was 48.9 ± 37.7 μg m−3 during 2019, which exceeds the annual mean value given by WHO (5 μg m−3). The annual mean concentration of PM2.5 was also higher than the central pollution control board of India (CPCB) permissible limit (40 μg m−3). In other cities of the Brahmaputra Valley, the annual mean PM concentrations were reported earlier, for example, in Guwahati (PM2.5: 52 ± 37 μg m−3; PM10: 91 ± 37 μg m−3) and Tezpur (PM10: 52.5 ± 44 μg m−3).18,19 The PM2.5 concentration in Jorhat was less than that in Guwahati in the same valley due to greater extent of urbanization in Guwahati. The seasonal mean PM2.5 concentration was 95.3 ± 37.9 μg m−3 (172.1–19.1 μg m−3) in winter, 41.1 ± 21.8 μg m−3 (108.5–7.8 μg m−3) in pre-monsoon, 21.8 ± 14.5 μg m−3 (110.7–5.9 μg m−3) in monsoon, and 62.4 ± 37.4 μg m−3 (164.0–9.1 μg m−3) in post-monsoon (see Table S1†).Fig. 2 depicts the seasonal variations of PM2.5 mass concentration during 2019. It is seen that the 24-hour mean PM2.5 concentration in Jorhat continuously crosses the prescribed WHO limit of 15 μg m−3 (for a 24-hour mean) during the sampling period. The PM2.5 concentrations in the region may arise from local and regional emissions. Local sources such as brick kilns remain operational only during post-monsoon and pre-monsoon seasons, i.e., from November to April, in the region. Around 1679 brick kilns use coal as the primary fuel (see Fig. S2†). Dust, vehicular emissions, and residential biomass burning may also contribute to the high loading of PM2.5. Transport of regional air masses from the IGP into the Brahmaputra Valley, adding to the local emissions such as brick kilns, biomass burning, vehicles, and dust, contributes to the high winter loading of PM2.5 in Northeast India. It is also reported that the IGP has some of the most polluted megacities which transport pollutants at a regional scale.34
3.2. Chemical compositions
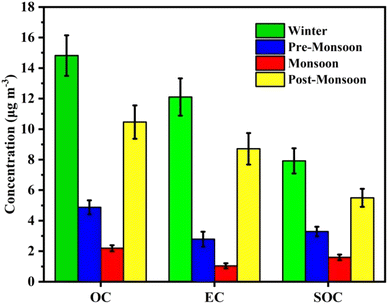
The PM2.5 chemical compositions including WSIs, major and trace elements, and carbonaceous matter (EC-OC) were evaluated. It was observed that out of the total PM2.5 mass, about 30% was contributed by the WSIs, about 21% was contributed by the carbonaceous matter, and about 9% by the inorganic elements. The annual mean of total WSIs (Cl−, SO42−, NO3−, Na+, NH4+, Mg2+, K+, and Ca2+) was 15.0 ± 8.6 μg m−3, which is ∼30% of the total PM2.5 mass concentrations. Among the ionic components, NH4+, SO42−, Cl−, and NO3− were predominant, accounting for about 29%, 27%, 21%, and 10% of total annual WSIs, respectively, during the study period (Table S2†). Anions and cations contribute about 17% and 13% to the total PM2.5 mass, respectively. The contribution of WSIs from the marine sources to the PM2.5 composition was estimated by sea salt ratios based on the assumption that all sodium (Na) was from marine origin.35 Table S3† demonstrates that the proportions of Cl−/Na+, K+/Na+, Mg2+/Na+, Ca2+/Na+, and SO42−/Na+ of PM2.5 were much higher than the seawater ratio indicating terrestrial natural or anthropogenic origin.20The annual mean concentration of major elements was 3.8 ± 3.4 μg m−3, and the concentration of trace elements was 0.4 ± 0.3 μg m−3, accounting for ∼8% and ∼1% of the total PM2.5 mass, respectively. Generally, crustal elements36 such as Si, Al, Na, Mg, Ca, K, and Fe show comparatively higher concentration than the elements such as Ti, V, Mn, Co, Ni, Zn, Br, Rb, Sr, Zr, Mo, Sb, I, Cs, Ba, and Pb. High S (1432.7 ± 951.9 ng m−3) and Cl (444.3 ± 775.1 ng m−3) concentrations were observed during the study period. The annual mean total carbonaceous matter (OC + EC) measured to be 10.4 ± 9.3 μg m−3, which was ∼21% of the total PM2.5 mass concentration. The annual mean OC, mean EC, and SOC concentrations were 6.1 ± 5.4 μg m−3, 4.3 ± 3.8 μg m−3 and 3.7 ± 1.6 μg m−3, respectively, during the study period.
3.3. Seasonal variation of WSIs
The seasonal variation of WSIs in PM2.5 is depicted in Fig. 3. The WSI concentrations were highest in the winter (22.8 ± 8.1 μg m−3), followed by the pre-monsoon (14.0 ± 5.6 μg m−3) and monsoon (11.6 ± 9.5 μg m−3) seasons, and lowest during the post-monsoon season (10.4 ± 5.6 μg m−3) (Table S4†). Increased anthropogenic activities, gas phase to the particle-phase conversion of ions due to lower temperature, and lower mixing height are the main reasons for the relatively high WSI concentrations during winter.9,37 The NH4+ concentration was highest during the monsoon season with 7.0 ± 9.8 μg m−3 which was about 60% of the total WSI concentration in monsoon. High relative humidity (RH) in air favours the transformation of NH3+ into NH4+; agricultural activities with the application of fertilizer and decomposition of organic materials due to wet conditions may be the main reasons for the high NH4+ concentration during the monsoon season.9,38 High ambient temperature during monsoon may also help in the volatilization of NH3+.39 The higher NH4+ concentration makes the aerosol alkaline during the monsoon season with an NH4+/(NO3− + SO42−) ratio of 7.8. The other ions such as Cl−, SO42−, NO3−, Na+, K+, and Ca2+, show higher concentrations during the winter season except for Mg2+ (Fig. 3). The high SO42− and NO3− concentrations during winter indicate emissions from local anthropogenic sources such as vehicular emissions and coal combustion.40,41 The lower wet deposition, poor dispersion, and the lower temperature in winter that favours the gas phase to the particle phase transformation of sulfur and nitrogen compounds may result in the high SO42− and NO3− concentrations in winter.42,43 The NH4+/(NO3− + SO42−) ratios during post-monsoon (0.6), winter (0.5), and pre-monsoon (0.5) seasons indicate the acidic nature of PM2.5.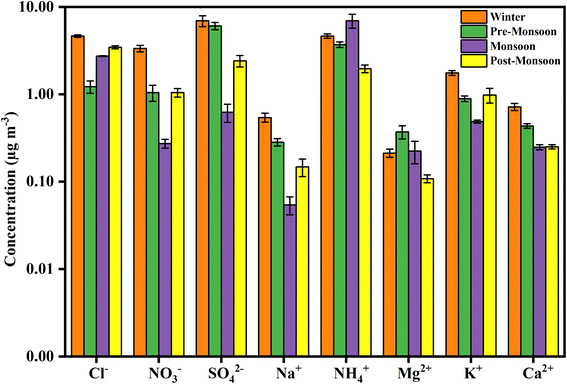 | ||
| Fig. 3 Seasonal variations of WSI concentrations during the year 2019 with maximum concentration in the winter season except for NH4+, whose concentration was maximum in the monsoon season. | ||
3.4. Seasonal variation of major and trace elements
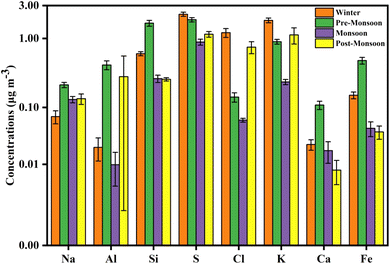
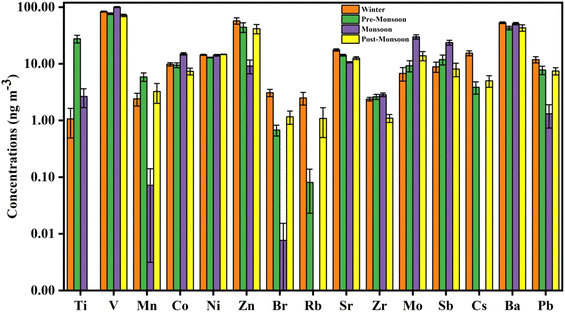
The seasonal distribution of major elements such as Na, Al, Si, S, Cl, K, Ca, and Fe, and trace elements such as Ti, V, Mn, Co, Ni, Zn, Br, Rb, Sr, Zr, Mo, Sb, I, Cs, Ba, and Pb in PM2.5 is shown in Fig. 4 and 5, respectively. The measured concentrations of major and trace elements of PM2.5 during the sampling period are shown in Tables S5 and S6,† respectively. Most of these elements are toxic and hazardous with non-carcinogenic (Ti, V, Mn, Co, Zn, Br, Rb, Sr, Zr, Mo, Sb, I, Cs, and Ba) and carcinogenic (Ni and Pb) properties.44,45The seasonal variation shows that the highest concentration of S, Cl, and K was in the winter season, followed by the pre-monsoon and post-monsoon seasons, indicating their sources of combustion of coal and biomass burning (Fig. 4).11,46,47 Concentrations of other major elements such as Si, Al, Na, Ca, and Fe were highest during the pre-monsoon season. The reason may be because of the more active local winds and low humidity in the pre-monsoon season aiding the emission of dust and crustal materials.
The trace elements show different seasonal variations. Elements such as Ni, Zn, Br, Rb, Sr, Cs, Ba, and Pb show the maximum concentration in the winter season, Ti and Mn during the pre-monsoon season, while V, Mo, and Sb were at their maximum during the monsoon season (Fig. 5). High Ni, Zn, Br, Rb, Sr, Cs, Ba, and Pb concentrations suggest that their source is mainly coal combustion.46,48–50 The high concentration of Ti and Mn during the pre-monsoon season can be attributed to local crustal emissions.51 High V, Mo, and Sb concentration during the monsoon season indicates that these elements may have originated from local road transport, petroleum refineries, and some local industrial sources such as steel fabrication, the tea processing industry, etc.52–54
3.5. Seasonal variation of carbon fractions
A distinct seasonal difference of carbonaceous matter was observed during the sampling period (Fig. 6). The winter season shows the highest carbonaceous matter (OC + EC) concentration (26.9 ± 13.9 μg m−3) followed by post-monsoon (19.2 ± 14.5 μg m−3), while the pre-monsoon (7.7 ± 4.3 μg m−3) and monsoon (3.2 ± 2.6 μg m−3) seasons have relatively low concentrations. The mean winter EC concentration (12.1 ± 6.7 μg m−3) shows similarity with most IGP sites.34,55,56A good correlation between EC and OC indicates that they might have originated from similar sources and maintained dynamic equilibrium with their precursor during long-range transport.57,58 The present study shows a good correlation between OC and EC during the post-monsoon (r = 0.9, p < 0.001), winter (r = 0.8, p < 0.001), and pre-monsoon (r = 0.7, p < 0.001) seasons (Fig. 7). Lack of correlation was observed during the monsoon season (r = 0.3, p < 0.001), indicating diverse sources of carbonaceous matter.
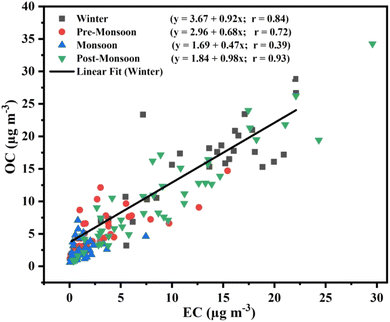 | ||
| Fig. 7 Scatter plot showing the relationships between EC and OC in four different seasons during 2019 (the black line shows a linear relationship during winter). | ||
The seasonal mean OC/EC ratio showed nearly similar values during the pre-monsoon (3.6 ± 3.0) and monsoon (3.6 ± 3.1) seasons, and post-monsoon (1.5 ± 0.7) and winter (1.7 ± 1.7) seasons. The limitation of the OC/EC ratio as a source indicator of carbonaceous aerosol is that it is strongly influenced by the formation of secondary organic carbonaceous aerosols and photochemical reactivity. The estimated annual mean SOC concentration was 3.7 ± 1.6 μg m−3 and about 60% of the annual mean OC concentration (Table S7†). Therefore, the char-EC and soot-EC were determined, which are considered more effective than the OC/EC ratio in understanding the primary carbonaceous sources. Distinct seasonal variations of the char-EC and soot-EC were observed in the present study with high soot-EC than char-EC. The soot-EC was highest during the winter (9.1 ± 4.6 μg m−3) followed by the post-monsoon (6.5 ± 4.4 μg m−3). Char-EC results from the incomplete combustion of wood biomass in a limited supply of air, while soot-EC results from high-temperature burning of fossil fuel by the gas-particle re-condensation process.59 Due to a relatively larger particle size, char-EC causes a higher deposition rate indicating local emissions and soot-EC favours long-range transport due to its smaller size.60 In the present study, char-EC (1.1 ± 2.4 μg m−3) has a lower concentration than soot-EC (4.3 ± 4.4 μg m−3), indicating contributions from coal combustion, vehicular sources, and long-range transport.
3.6. Back trajectory analysis
The seasonal HYSPLIT back-trajectory data are shown in Fig. 8. High AOD over the IGP region indicates that the transport of air mass through the region can significantly contribute to PM2.5 concentrations (see Fig. S3†). To analyze the regional transport of air masses and the transport of air masses from the highly polluted IGP region, we have performed the cluster analysis of back trajectory data in different seasons. The cluster analysis data show that during our study period, ∼70%, ∼67%, ∼10%, and ∼38% of air masses were transported from the IGP region in the winter, pre-monsoon, monsoon, and post-monsoon seasons, respectively (Table S8†). The cluster back-trajectory data are also compared with the seasonal PM2.5 mass concentrations. Transport of a large number of air masses from the IGP region during the winter season coincides with high PM2.5. In the post-monsoon season, the transport of air masses from the IGP region was lower than in the pre-monsoon season, however, the PM2.5 concentration was higher in the post-monsoon season. The air pollutants in the IGP remain at their peak during the post-monsoon season because of increased agricultural biomass burning and unfavourable environmental conditions.61 While during the pre-monsoon season, the IGP region contains relatively lower air pollutants transporting lower pollutants than in the winter and post-monsoon seasons.61,62 The relation between seasonal variations of PM2.5 mass and the air mass transport indicates that the Brahmaputra Valley is significantly influenced by the regional aerosol transport from the IGP region in the post-monsoon and winter seasons. Besides, increased local anthropogenic emissions from biomass burning and coal combustion during post-monsoon and winter may also result in high carbonaceous matter concentrations. However, frequent rainfall events in the Brahmaputra Valley cause wet deposition, and the cessation of coal combustion in brick kilns minimizes carbonaceous matter concentration during pre-monsoon and monsoon seasons.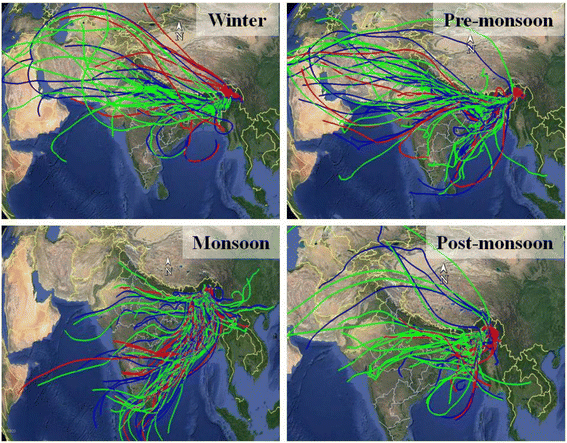 | ||
| Fig. 8 HYSPLIT back trajectory data analysis in four different seasons in the year 2019 in the Jorhat area. | ||
3.7. Role of meteorological factors
The meteorological factors can change not only the weather conditions (e.g., higher temperature increases the convective movement of air) but also the source emission (e.g., lower temperature increases indoor heating). The role of meteorological factors in dilution, dispersion, and accumulation of air pollutants has been widely recognized. However, it remains unpredictable when the exact effects of meteorology on PM2.5 concentration are considered.63 Studies on the relationships between meteorological factors and PM2.5 are common in various parts of the world.64–67 In the present study, the daily mean ambient temperature, relative humidity, and wind speed were correlated with daily mean PM2.5 concentrations for the whole year 2019. The graph between daily means of PM2.5 concentration, ambient temperature, and relative humidity shows that with the increase in ambient temperature and relative humidity, PM2.5 concentration decreases (Fig. S4†). A negative correlation (r = –0.7, p < 0.001) between ambient temperature and PM2.5 concentration was observed (Fig. S5†). A negative correlation of PM2.5 concentration was also found with relative humidity (r = –0.4, p < 0.001) and wind speed (r = –0.5, p < 0.001) (Fig. S6 and S7†). The reason for the negative correlations may be because higher temperature increases the convective movement of air, increasing the dilution and dispersion process; the higher wind speed increases the dispersion of PM2.5, while the increase in relative humidity increases the particle size leading to an increase in the deposition rate.21,68–71 Correlations between the seasonal PM2.5 concentrations and the meteorological factors were also performed (Fig. S8–S10†), and no significant relationship was observed except for ambient temperature during the post-monsoon season (Fig. S8†), which showed a strong negative correlation (r = –0.8, p < 0.001).4. Conclusion
The present analysis of ambient PM2.5 and its chemical compositions provides insight into the air pollution levels in the Jorhat urban area within the Brahmaputra Valley of Northeast India. The seasonal study shows that the PM2.5 pollution level even increases to almost twenty times the WHO safe limit during the winter season. This elevated PM2.5 concentration in this urban region arises from local emissions such as open combustion of coal in brick kilns, residential biomass burning, and vehicular emissions. In addition, regional aerosol transport from the IGP region also played a significant role in intensifying the PM2.5 pollution in such an urban area. Therefore, mitigation measures at local and also at regional levels are essential to improve air quality in such a new and growing urban area.Conflicts of interest
There are no conflicts to declare.Acknowledgements
The authors are thankful to the Director (CSIR-NEIST) for his permission to publish the paper. Furthermore, the authors are grateful for funding from the Ministry of Environment, Forest, and Climate Change, Govt. of India (NCAP-COALESCE project). Moreover, the authors thank the internal review committee of the NCAP-COALESCE project for their comments and suggestions on this paper. The authors gratefully acknowledge the NOAA-Air Resources Laboratory (ARL) for providing the HYSPLIT transport and dispersion model and READY website (https://www.ready.noaa.gov) used in this publication. The authors thank Dr Jim Hower for his English editing and comments. The constructive comments received from the esteemed reviewers are thankfully acknowledged.References
- I. Air, 2019 World Air Quality Report. Region & City PM2. 5 Ranking.Journal, 2020 Search PubMed.
- K. Balakrishnan, S. Dey, T. Gupta, R. S. Dhaliwal, M. Brauer, A. J. Cohen, J. D. Stanaway, G. Beig, T. K. Joshi, A. N. Aggarwal, Y. Sabde, H. Sadhu, J. Frostad, K. Causey, W. Godwin, D. K. Shukla, G. A. Kumar, C. M. Varghese, P. Muraleedharan, A. Agrawal, R. M. Anjana, A. Bhansali, D. Bhardwaj, K. Burkart, K. Cercy, J. K. Chakma, S. Chowdhury, D. J. Christopher, E. Dutta, M. Furtado, S. Ghosh, A. G. Ghoshal, S. D. Glenn, R. Guleria, R. Gupta, P. Jeemon, R. Kant, S. Kant, T. Kaur, P. A. Koul, V. Krish, B. Krishna, S. L. Larson, K. Madhipatla, P. A. Mahesh, V. Mohan, S. Mukhopadhyay, P. Mutreja, N. Naik, S. Nair, G. Nguyen, C. M. Odell, J. D. Pandian, D. Prabhakaran, P. Prabhakaran, A. Roy, S. Salvi, S. Sambandam, D. Saraf, M. Sharma, A. Shrivastava, V. Singh, N. Tandon, N. J. Thomas, A. Torre, D. Xavier, G. Yadav, S. Singh, C. Shekhar, T. Vos, R. Dandona, K. S. Reddy, S. S. Lim, C. J. L. Murray, S. Venkatesh and L. Dandona, The impact of air pollution on deaths, disease burden, and life expectancy across the states of India: the Global Burden of Disease Study 2017, Lancet Planet. Health, 2019, 3, e26–e39 CrossRef PubMed.
- S. Verma, S. Ghosh, O. Boucher, R. Wang and L. Menut, Black carbon health impacts in the Indo-Gangetic plain: exposures, risks, and mitigation, Sci. Adv., 2022, 8, eabo4093 CrossRef CAS PubMed.
- M. Kumar, K. S. Parmar, D. B. Kumar, A. Mhawish, D. M. Broday, R. K. Mall and T. Banerjee, Long-term aerosol climatology over Indo-Gangetic Plain: trend, prediction and potential source fields, Atmos. Environ., 2018, 180, 37–50 CrossRef CAS.
- T. O. Etchie, S. Sivanesan, A. T. Etchie, K. Krishnamurthi, G. O. Adewuyi and K. V. George, Can the Indian national ambient air quality standard protect against the hazardous constituents of PM2.5?, Chemosphere, 2022, 303, 135047 CrossRef CAS PubMed.
- S. K. Sharma and T. K. Mandal, Chemical composition of fine mode particulate matter (PM2.5) in an urban area of Delhi, India and its source apportionment, Urban Clim., 2017, 21, 106–122 CrossRef.
- R. Das, B. Khezri, B. Srivastava, S. Datta, P. K. Sikdar, R. D. Webster and X. Wang, Trace element composition of PM2.5 and PM10 from Kolkata – a heavily polluted Indian metropolis, Atmos. Pollut. Res., 2015, 6, 742–750 CrossRef CAS.
- N. L. Devi, A. Kumar and I. C. Yadav, PM10 and PM2.5 in Indo-Gangetic Plain (IGP) of India: chemical characterization, source analysis, and transport pathways, Urban Clim., 2020, 33, 100663 CrossRef.
- A. Kumar, I. C. Yadav, A. Shukla and N. L. Devi, Seasonal variation of PM2.5 in the central Indo-Gangetic Plain (Patna) of India: chemical characterization and source assessment, SN Appl. Sci., 2020, 2, 1366 CrossRef CAS.
- C.-S. Yuan, C.-G. Lee, S.-H. Liu, J.-c. Chang, C. Yuan and H.-Y. Yang, Correlation of atmospheric visibility with chemical composition of Kaohsiung aerosols, Atmos. Res., 2006, 82, 663–679 CrossRef CAS.
- K. Wang, W. Wang, L. Li, J. Li, L. Wei, W. Chi, L. Hong, Q. Zhao and J. Jiang, Seasonal concentration distribution of PM1.0 and PM2.5 and a risk assessment of bound trace metals in Harbin, China: effect of the species distribution of heavy metals and heat supply, Sci. Rep., 2020, 10, 8160 CrossRef CAS PubMed.
- A. Di, Y. Wu, M. Chen, D. Nie and X. Ge, Chemical Characterization of Seasonal PM(2.5) Samples and Their Cytotoxicity in Human Lung Epithelial Cells (A549), Int. J. Environ. Res. Public Health, 2020, 17, 4599 CrossRef CAS PubMed.
- S. R. Won, I.-K. Shim, J. Kim, H. A. Ji, Y. Lee, J. Lee and Y. S. Ghim, PM(2.5) and Trace Elements in Underground Shopping Districts in the Seoul Metropolitan Area, Korea, Int. J. Environ. Res. Public Health, 2021, 18, 297 CrossRef CAS PubMed.
- C. A. Pope 3rd, M. Ezzati and D. W. Dockery, Fine-particulate air pollution and life expectancy in the United States, N. Engl. J. Med., 2009, 360, 376–386 CrossRef PubMed.
- H.-J. Lim and B. J. Turpin, Origins of Primary and Secondary Organic Aerosol in Atlanta: Results of Time-Resolved Measurements during the Atlanta Supersite Experiment, Environ. Sci. Technol., 2002, 36, 4489–4496 CrossRef PubMed.
- T. C. Bond, S. J. Doherty, D. W. Fahey, P. M. Forster, T. Berntsen, B. J. DeAngelo, M. G. Flanner, S. Ghan, B. Kärcher, D. Koch, S. Kinne, Y. Kondo, P. K. Quinn, M. C. Sarofim, M. G. Schultz, M. Schulz, C. Venkataraman, H. Zhang, S. Zhang, N. Bellouin, S. K. Guttikunda, P. K. Hopke, M. Z. Jacobson, J. W. Kaiser, Z. Klimont, U. Lohmann, J. P. Schwarz, D. Shindell, T. Storelvmo, S. G. Warren and C. S. Zender, Bounding the role of black carbon in the climate system: a scientific assessment, J. Geophys. Res.: Atmos., 2013, 118, 5380–5552 CrossRef CAS.
- R. Garaga, S. Gokhale and S. H. Kota, Source apportionment of size-segregated atmospheric particles and the influence of particles deposition in the human respiratory tract in rural and urban locations of north-east India, Chemosphere, 2020, 255, 126980 CrossRef CAS.
- P. Bhuyan, P. Deka, A. Prakash, S. Balachandran and R. R. Hoque, Chemical characterization and source apportionment of aerosol over mid Brahmaputra Valley, India, Environ. Pollut., 2018, 234, 997–1010 CrossRef CAS PubMed.
- S. Tiwari, U. C. Dumka, A. S. Gautam, D. G. Kaskaoutis, A. K. Srivastava, D. S. Bisht, R. K. Chakrabarty, B. J. Sumlin and F. Solmon, Assessment of PM2.5 and PM10 over Guwahati in Brahmaputra River Valley: temporal evolution, source apportionment and meteorological dependence, Atmos. Pollut. Res., 2017, 8, 13–28 CrossRef.
- S. Rabha, B. K. Saikia, G. K. Singh and T. Gupta, Meteorological Influence and Chemical Compositions of Atmospheric Particulate Matters in an Indian Urban Area, ACS Earth Space Chem., 2021, 5, 1686–1694 CrossRef CAS.
- F. Huang, X. Li, C. Wang, Q. Xu, W. Wang, Y. Luo, L. Tao, Q. Gao, J. Guo, S. Chen, K. Cao, L. Liu, N. Gao, X. Liu, K. Yang, A. Yan and X. Guo, PM2.5 Spatiotemporal Variations and the Relationship with Meteorological Factors during 2013-2014 in Beijing, China, PLoS One, 2015, 10, e0141642 CrossRef PubMed.
- Y.-H. Mao, H. Liao, Y. Han and J. Cao, Impacts of meteorological parameters and emissions on decadal and interannual variations of black carbon in China for 1980–2010, J. Geophys. Res.: Atmos., 2016, 121, 1822–1843 CrossRef CAS.
- B. Pathak, T. Subba, P. Dahutia, P. K. Bhuyan, K. K. Moorthy, M. M. Gogoi, S. S. Babu, L. Chutia, P. Ajay, J. Biswas, C. Bharali, A. Borgohain, P. Dhar, A. Guha, B. K. De, T. Banik, M. Chakraborty, S. S. Kundu, S. Sudhakar and S. B. Singh, Aerosol characteristics in north-east India using ARFINET spectral optical depth measurements, Atmos. Environ., 2016, 125, 461–473 CrossRef CAS.
- J. Saikia, B. Narzary, S. Roy, M. Bordoloi, P. Saikia and B. K. Saikia, Nanominerals, fullerene aggregates, and hazardous elements in coal and coal combustion-generated aerosols: an environmental and toxicological assessment, Chemosphere, 2016, 164, 84–91 CrossRef CAS.
- S. Rabha, J. Saikia, K. S. V. Subramanyam, J. C. Hower, M. M. Hood, P. Khare and B. K. Saikia, Geochemistry and Nanomineralogy of Feed Coals and Their Coal Combustion Residues from Two Different Coal-Based Industries in Northeast India, Energy Fuels, 2018, 32, 3697–3708 CrossRef CAS.
- R. Draxler and G. Rolph, HYSPLIT (HYbrid Single-Particle Lagrangian Integrated Trajectory) model access via NOAA ARL READY, NOAA Air Resources Laboratory, Silver Spring, MD, 2010, vol. 25, http://ready.arl.noaa.gov/HYSPLIT.php Search PubMed.
- J. C. Chow, J. G. Watson, L. W. A. Chen, M. C. O. Chang, N. F. Robinson, D. Trimble and S. Kohl, The IMPROVE_A Temperature Protocol for Thermal/Optical Carbon Analysis: Maintaining Consistency with a Long-Term Database, J. Air Waste Manage. Assoc., 2007, 57, 1014–1023 CrossRef CAS PubMed.
- Y. Han, J. Cao, J. C. Chow, J. G. Watson, Z. An, Z. Jin, K. Fung and S. Liu, Evaluation of the thermal/optical reflectance method for discrimination between char- and soot-EC, Chemosphere, 2007, 69, 569–574 CrossRef CAS.
- L. M. Castro, C. A. Pio, R. M. Harrison and D. J. T. Smith, Carbonaceous aerosol in urban and rural European atmospheres: estimation of secondary organic carbon concentrations, Atmos. Environ., 1999, 33, 2771–2781 CrossRef CAS.
- S. K. Sharma, S. Mukherjee, N. Choudhary, A. Rai, A. Ghosh, A. Chatterjee, N. Vijayan and T. K. Mandal, Seasonal variation and sources of carbonaceous species and elements in PM2.5 and PM10 over the eastern Himalaya, Environ. Sci. Pollut. Res., 2021, 28, 51642–51656 CrossRef CAS.
- B. J. Turpin and J. J. Huntzicker, Identification of secondary organic aerosol episodes and quantitation of primary and secondary organic aerosol concentrations during SCAQS, Atmos. Environ., 1995, 29, 3527–3544 CrossRef CAS.
- H. Xu, B. Guinot, Z. Shen, K. F. Ho, X. Niu, S. Xiao, R.-J. Huang, J. Cao, G. Li and R. Talbot, Characteristics of Organic and Elemental Carbon in PM 2.5 and PM 0.25 in Indoor and Outdoor Environments of a Middle School: Secondary Formation of Organic Carbon and Sources Identification, Atmosphere, 2015, 6, 361–379 CrossRef.
- J. C. Chow, J. G. Watson, L. W. A. Chen, J. Rice and N. H. Frank, Quantification of PM2.5 organic carbon sampling artifacts in US networks, Atmos. Chem. Phys., 2010, 10, 5223–5239 CrossRef CAS.
- A. Salam, A. Andersson, F. Jeba, M. I. Haque, M. D. Hossain Khan and Ö. Gustafsson, Wintertime Air Quality in Megacity Dhaka, Bangladesh Strongly Affected by Influx of Black Carbon Aerosols from Regional Biomass Burning, Environ. Sci. Technol., 2021, 55, 12243–12249 CrossRef CAS PubMed.
- P. Chandra Mouli, S. Venkata Mohan and S. Jayarama Reddy, A study on major inorganic ion composition of atmospheric aerosols at Tirupati, J. Hazard. Mater., 2003, 96, 217–228 CrossRef CAS PubMed.
- G. C. Lough, J. J. Schauer, J.-S. Park, M. M. Shafer, J. T. DeMinter and J. P. Weinstein, Emissions of Metals Associated with Motor Vehicle Roadways, Environ. Sci. Technol., 2005, 39, 826–836 CrossRef CAS.
- Y. Wang, G. Zhuang, X. Zhang, K. Huang, C. Xu, A. Tang, J. Chen and Z. An, The ion chemistry, seasonal cycle, and sources of PM2.5 and TSP aerosol in Shanghai, Atmos. Environ., 2006, 40, 2935–2952 CrossRef CAS.
- S. Singh and U. C. Kulshrestha, Abundance and distribution of gaseous ammonia and particulate ammonium at Delhi, India, Biogeosciences, 2012, 9, 5023–5029 CrossRef CAS.
- M. D. Goebes, R. Strader and C. Davidson, An ammonia emission inventory for fertilizer application in the United States, Atmos. Environ., 2003, 37, 2539–2550 CrossRef CAS.
- X. Huang, Z. Liu, J. Liu, B. Hu, T. Wen, G. Tang, J. Zhang, F. Wu, D. Ji, L. Wang and Y. Wang, Chemical characterization and source identification of PM2.5 at multiple sites in the Beijing–Tianjin–Hebei region, China, Atmos. Chem. Phys., 2017, 17, 12941–12962 CrossRef CAS.
- H. Xu, J. Cao, J. C. Chow, R. J. Huang, Z. Shen, L. W. A. Chen, K. F. Ho and J. G. Watson, Inter-annual variability of wintertime PM2.5 chemical composition in Xi'an, China: evidences of changing source emissions, Sci. Total Environ., 2016, 545–546, 546–555 CrossRef CAS PubMed.
- S. K. Hassan, A. A. El–Abssawy and M. I. Khoder, Characteristics of gas–phase nitric acid and ammonium–nitrate– sulfate aerosol, and their gas–phase precursors in a suburban area in Cairo, Egypt, Atmos. Pollut. Res., 2013, 4, 117–129 CrossRef CAS.
- F. Jiang, F. Liu, Q. Lin, Y. Fu, Y. Yang, L. Peng, X. Lian, G. Zhang, X. Bi, X. Wang and G. Sheng, Characteristics and Formation Mechanisms of Sulfate and Nitrate in Size-segregated Atmospheric Particles from Urban Guangzhou, China, Aerosol Air Qual. Res., 2019, 19, 1284–1293 CrossRef CAS.
- O. M. Morakinyo, M. S. Mukhola and M. I. Mokgobu, Health Risk Analysis of Elemental Components of an Industrially Emitted Respirable Particulate Matter in an Urban Area, Int. J. Environ. Res. Public Health, 2021, 18 Search PubMed.
- K. Yadav and R. Sunder Raman, Size-segregated chemical source profiles and potential health impacts of multiple sources of fugitive dust in and around Bhopal, central India, Environ. Pollut., 2021, 284, 117385 CrossRef CAS PubMed.
- P. Rai, M. Furger, I. El Haddad, V. Kumar, L. Wang, A. Singh, K. Dixit, D. Bhattu, J.-E. Petit, D. Ganguly, N. Rastogi, U. Baltensperger, S. N. Tripathi, J. G. Slowik and A. S. H. Prévôt, Real-time measurement and source apportionment of elements in Delhi's atmosphere, Sci. Total Environ., 2020, 742, 140332 CrossRef CAS PubMed.
- V. Bangar, A. K. Mishra, M. Jangid and P. Rajput, Elemental Characteristics and Source-Apportionment of PM2.5 During the Post-monsoon Season in Delhi, India, Front. sustain. cities, 2021, 3, 648551 CrossRef.
- G. Balakrishna, S. Pervez and D. S. Bisht, Source apportionment of arsenic in atmospheric dust fall out in an urban residential area, Raipur, Central India, Atmos. Chem. Phys., 2011, 11, 5141–5151 CrossRef CAS.
- Y. Chang, K. Huang, M. Xie, C. Deng, Z. Zou, S. Liu and Y. Zhang, First long-term and near real-time measurement of trace elements in China's urban atmosphere: temporal variability, source apportionment and precipitation effect, Atmos. Chem. Phys., 2018, 18, 11793–11812 CrossRef CAS.
- Jaiprakash, A. Singhai, G. Habib, R. S. Raman and T. Gupta, Chemical characterization of PM1.0 aerosol in Delhi and source apportionment using positive matrix factorization, Environ. Sci. Pollut. Res., 2017, 24, 445–462 CrossRef CAS PubMed.
- X. Wang, X. Bi, G. Sheng and J. Fu, Chemical Composition and Sources of PM10 and PM2.5 Aerosols in Guangzhou, China, Environ. Monit. Assess., 2006, 119, 425–439 CrossRef CAS PubMed.
- A. M. Sánchez de la Campa, T. Moreno, J. de la Rosa, A. Alastuey and X. Querol, Size distribution and chemical composition of metalliferous stack emissions in the San Roque petroleum refinery complex, southern Spain, J. Hazard. Mater., 2011, 190, 713–722 CrossRef.
- M. Kara, P. K. Hopke, Y. Dumanoglu, H. Altiok, T. Elbir, M. Odabasi and A. Bayram, Characterization of PM Using Multiple Site Data in a Heavily Industrialized Region of Turkey, Aerosol Air Qual. Res., 2015, 15, 11–27 CrossRef CAS.
- V. Celo, M. M. Yassine and E. Dabek-Zlotorzynska, Insights into Elemental Composition and Sources of Fine and Coarse Particulate Matter in Dense Traffic Areas in Toronto and Vancouver, Canada, Toxics, 2021, 9, 264 CrossRef CAS.
- A. Arola, G. L. Schuster, M. R. A. Pitkänen, O. Dubovik, H. Kokkola, A. V. Lindfors, T. Mielonen, T. Raatikainen, S. Romakkaniemi, S. N. Tripathi and H. Lihavainen, Direct radiative effect by brown carbon over the Indo-Gangetic Plain, Atmos. Chem. Phys., 2015, 15, 12731–12740 CrossRef CAS.
- G. K. Singh, V. Choudhary, P. Rajeev, D. Paul and T. Gupta, Understanding the origin of carbonaceous aerosols during periods of extensive biomass burning in northern India, Environ. Pollut., 2021, 270, 116082 CrossRef CAS PubMed.
- D. Ji, W. Gao, W. Maenhaut, J. He, Z. Wang, J. Li, W. Du, L. Wang, Y. Sun, J. Xin, B. Hu and Y. Wang, Impact of air pollution control measures and regional transport on carbonaceous aerosols in fine particulate matter in urban Beijing, China: insights gained from long-term measurement, Atmos. Chem. Phys., 2019, 19, 8569–8590 CrossRef CAS.
- J. D. Blando and B. J. Turpin, Secondary organic aerosol formation in cloud and fog droplets: a literature evaluation of plausibility, Atmos. Environ., 2000, 34, 1623–1632 CrossRef CAS.
- Y. Guo, Size distribution characteristics of carbonaceous aerosol in a rural location in northwestern China, Air Qual., Atmos. Health, 2016, 9, 193–200 CrossRef CAS.
- G. Shi, X. Peng, J. Liu, Y. Tian, D. Song, H. Yu, Y. Feng and A. G. Russell, Quantification of long-term primary and secondary source contributions to carbonaceous aerosols, Environ. Pollut., 2016, 219, 897–905 CrossRef CAS PubMed.
- S. Mor, T. Singh, N. R. Bishnoi, S. Bhukal and K. Ravindra, Understanding seasonal variation in ambient air quality and its relationship with crop residue burning activities in an agrarian state of India, Environ. Sci. Pollut. Res., 2022, 29, 4145–4158 CrossRef CAS PubMed.
- C. Mogno, P. I. Palmer, C. Knote, F. Yao and T. J. Wallington, Seasonal distribution and drivers of surface fine particulate matter and organic aerosol over the Indo-Gangetic Plain, Atmos. Chem. Phys., 2021, 21, 10881–10909 CrossRef CAS.
- C. Meng, T. Cheng, F. Bao, X. Gu, J. Wang, X. Zuo and S. Shi, The Impact of Meteorological Factors on Fine Particulate Pollution in Northeast China, Aerosol Air Qual. Res., 2020, 20(7), 1618 Search PubMed.
- Z. Chen, D. Chen, C. Zhao, M.-p. Kwan, J. Cai, Y. Zhuang, B. Zhao, X. Wang, B. Chen, J. Yang, R. Li, B. He, B. Gao, K. Wang and B. Xu, Influence of meteorological conditions on PM2.5 concentrations across China: a review of methodology and mechanism, Environ. Int., 2020, 139, 105558 CrossRef CAS PubMed.
- K. R. Krishna and G. Beig, Influence of meteorology on particulate matter (PM) and vice-versa over two Indian metropolitan cities, Open J. Air Pollut., 2018, 7, 244–262 CrossRef CAS.
- X. Li, Y. J. Feng and H. Y. Liang, The Impact of Meteorological Factors on PM2.5 Variations in Hong Kong, IOP Conf. Ser.: Earth Environ. Sci., 2017, 78, 012003 CrossRef.
- J. L. Schnell, V. Naik, L. W. Horowitz, F. Paulot, J. Mao, P. Ginoux, M. Zhao and K. Ram, Exploring the relationship between surface PM2.5 and meteorology in Northern India, Atmos. Chem. Phys., 2018, 18, 10157–10175 CrossRef CAS.
- A. Tsuda, F. S. Henry and J. P. Butler, Particle transport and deposition: basic physics of particle kinetics, Compr. Physiol., 2013, 3, 1437–1471 CrossRef.
- H. Fu, Y. Zhang, C. Liao, L. Mao, Z. Wang and N. Hong, Investigating PM2.5 responses to other air pollutants and meteorological factors across multiple temporal scales, Sci. Rep., 2020, 10, 15639 CrossRef CAS PubMed.
- A. P. K. Tai, L. J. Mickley and D. J. Jacob, Correlations between fine particulate matter (PM2.5) and meteorological variables in the United States: Implications for the sensitivity of PM2.5 to climate change, Atmos. Environ., 2010, 44, 3976–3984 CrossRef CAS.
- Q. Yang, Q. Yuan, T. Li, H. Shen and L. Zhang, The Relationships between PM2.5 and Meteorological Factors in China: Seasonal and Regional Variations, Int. J. Environ. Res. Public Health, 2017, 14, 1510 CrossRef PubMed.
Footnote |
| † Electronic supplementary information (ESI) available. See DOI: https://doi.org/10.1039/d2ea00120a |
| This journal is © The Royal Society of Chemistry 2023 |

