
 Open Access Article
 This Open Access Article is licensed under a
 Creative Commons Attribution 3.0 Unported Licence
Relationships between supermicrometer particle concentrations and cloud water sea salt and dust concentrations: analysis of MONARC and ACTIVATE data†
Marisa E.
Gonzalez
 a,
Andrea F.
Corral
a,
Ewan
Crosbie
bc,
Hossein
Dadashazar
a,
Glenn S.
Diskin
b,
Eva-Lou
Edwards
a,
Simon
Kirschler
de,
Richard H.
Moore
b,
Claire E.
Robinson
bc,
Joseph S.
Schlosser
a,
Michael
Shook
b,
Connor
Stahl
a,
Kenneth L.
Thornhill
bc,
Christiane
Voigt
de,
Edward
Winstead
bc,
Luke D.
Ziemba
b and
Armin
Sorooshian
*af
a,
Andrea F.
Corral
a,
Ewan
Crosbie
bc,
Hossein
Dadashazar
a,
Glenn S.
Diskin
b,
Eva-Lou
Edwards
a,
Simon
Kirschler
de,
Richard H.
Moore
b,
Claire E.
Robinson
bc,
Joseph S.
Schlosser
a,
Michael
Shook
b,
Connor
Stahl
a,
Kenneth L.
Thornhill
bc,
Christiane
Voigt
de,
Edward
Winstead
bc,
Luke D.
Ziemba
b and
Armin
Sorooshian
*af
aDepartment of Chemical and Environmental Engineering, University of Arizona, Tucson, AZ, USA. E-mail: armin@arizona.edu
bNASA Langley Research Center, Hampton, VA, USA
cScience Systems and Applications, Inc., Hampton, VA, USA
dInstitute for Atmospheric Physics, DLR, German Aerospace Center, Oberpfaffenhofen, Germany
eInstitute for Atmospheric Physics, University of Mainz, Mainz, Germany
fDepartment of Hydrology and Atmospheric Sciences, University of Arizona, Tucson, AZ, USA
First published on 7th June 2022
Abstract
This study uses airborne field data from the MONterey Aerosol Research Campaign (MONARC: northeast Pacific – summer 2019) and Aerosol Cloud meTeorology Interactions oVer the western ATlantic Experiment (ACTIVATE: northwest Atlantic – winter and summer 2020) to examine relationships between giant cloud condensation nuclei (GCCN) and cloud composition to advance knowledge of poorly characterized GCCN–cloud interactions. The analysis compares cloud water composition data to particle concentration data with different minimum dry diameters between 1 and 10 μm (hereafter referred to as GCCN) collected below and above clouds adjacent to where cloud water samples were collected. The northeast Pacific exhibited higher GCCN number concentrations above 1 μm, but with a sharper decline to negligible values at higher minimum diameters (5–10 μm) as compared to the northwest Atlantic. Vertical profiles of GCCN data revealed the larger influence of sea salt with major reductions above typical boundary layer heights for the two regions. Interrelationships between GCCN and cloud water composition revealed the following major conclusions: (i) sub-cloud GCCN data are better related to cloud water species concentrations in contrast to above-cloud GCCN data owing to overwhelming influence of sea salt relative to dust; (ii) GCCN number concentrations at the lowest (highest) minimum dry diameters were best related to cloud water sea salt concentrations for the northeast Pacific (northwest Atlantic) in part due to hardly any GCCN above 5 μm for the northeast Pacific; (iii) the northwest Atlantic exhibited stronger near-surface winds and turbulence linked to the enhanced levels of larger GCCN and the stronger relationship with cloud water sea salt levels; and (iv) linear regression models have marginal success in predicting cloud water sea salt levels. This study demonstrates feasibility in relating cloud water chemical data with supermicrometer particle data to tease out insights about GCCN–cloud interactions, with results relevant to designing future lab, modeling, and field studies.
Environmental significanceAerosol–cloud interactions represent one of the largest uncertainties in our understanding of climate change and a specific aspect of these interactions that is especially poorly characterized is how particles with dry diameters exceeding 1 micrometer (e.g., dust and sea salt) interact with clouds. This work explores using two airborne instrument datasets that are not commonly used together to gain insights into potential interactions between giant cloud condensation nuclei (GCCN) and boundary layer clouds. These include wing-mounted optical probes for supermicrometer particle data and cloud water composition. The results of this work point to significant relationships between GCCN concentrations and sea salt levels (and not dust) in cloud water, with these relationships sensitive to factors such as region, minimum diameter threshold for GCCN, and other environmental factors such as sub-cloud turbulence. This study motivates continued research into GCCN–cloud interactions by leveraging composition data. |
1. Introduction
The first and second indirect aerosol effects on climate hypothesize that clouds influenced by more particles result in smaller droplets and higher cloud albedo (all else held fixed), slower collision–coalescence, and suppressed precipitation.1–4 In contrast, giant cloud condensation nuclei (GCCN) have been shown to lead to larger droplets, quicker collision–coalescence, faster onset of rain, and potentially increased precipitation.4,5 Since the early work of Houghton,6 numerous studies have sought to explain the nature of GCCN in warm clouds,5,7–14 although differences exist in research studies as summarized here briefly.Giant salt particles produce large cloud droplets that initiate coalescence above cloud base,15 particularly in warm convective clouds.16 Seeding continental and stratocumulus clouds with GCCN initiates precipitation,17–19 which can be rapid such as with warm cumulus clouds.20 Another study showed that GCCN enhanced rain amount in warm continental clouds but did not have the same effect in maritime clouds.21 Enhanced sea salt GCCN levels have been shown to coincide with an increase in marine stratocumulus precipitation rate.18,22 Dror et al.23 used marine size distributions to observe the impact of GCCN on rain yield and found increased precipitation only above a dry diameter of 5 μm. For stratocumulus clouds, GCCN effects are thought to be most evident under conditions of either high cloud condensation nuclei (CCN) concentration and liquid water content (LWC) or low CCN concentrations and LWC.24 In convective clouds and trade wind cumuli, GCCN is most effective as the concentration of smaller CCN increases.25–29 This is generally consistent with the conclusion reached that GCCN can override precipitation suppression in polluted clouds.11,30 In contrast to these findings, Hindman et al.,31 found that GCCN are more effective when CCN levels are low in non-raining warm cumulus clouds. It is problematic that major uncertainties remain in understanding effects of GCCN because these particles are abundant globally (e.g., sea salt and dust) and are not treated well in climate models.32 A reason leading to conflicting results and limiting advancement of knowledge into GCCN is the challenge of characterizing their properties and abundance in the atmosphere.
Some of the earliest airborne collection methods targeting GCCN involved using silver rods outside the aircraft and coated glass microscope slides, which were analyzed under a microscope upon landing.14,33 GCCN have been measured using wing-mounted optical probes on airborne platforms including the Cloud Aerosol and Precipitation Spectrometer (CAPS) and Forward Scattering Spectrometer Probe (FSSP), differences of which relate primarily to the size range and number of size bins; these methods have documented limitations such as overestimating size.34–37 Another method of studying GCCN is via post-flight analysis of collected particles with Scanning Electron Microscopy (SEM).21,31 Although much more challenging, remote sensing methods have also been used to examine relationships between presumed GCCN and clouds.11,29,38 The use of many techniques lends itself to varying results linked in part to differences in how GCCN are quantified and defined (Section S1 and Table S1†), which complicates intercomparisons between studies.
Reid et al.34 noted how studies of coarse mode particles would greatly benefit from the use of ion chromatography chemistry data for species such as sea salt's chloride and sodium. Building on that recommendation, recent studies have employed cloud and rainwater collection coupled to ion chromatography as a way to deduce potential relationships between GCCN (e.g., dust, sea salt) and clouds.39,40 Although wing-mounted optical probes have limitations, they are arguably the central instruments the research community has to rely on for rapid supermicrometer measurements and thus researchers need to make use of them.34 This study aims to use wing-mounted probe data in relation with cloud composition to explore GCCN–cloud relationships to motivate continued research in this regard to learn more about aerosol–cloud interactions until more advanced instrumentation is developed for rapid and accurate size-resolved GCCN measurements; in this work GCCN are used interchangeably with particles having dry diameters ≥1 μm. This effort is important since the other method of trying to use composition data to learn about GCCN–cloud interactions is exclusively based on surface data from monitoring networks measurement aerosol and precipitation data.41–43 Those studies have the obvious disadvantage of not knowing if the sampled aerosol had any connection to the clouds that formed the precipitation sampled at the surface.
This work focuses on two objectives: (i) compare and contrast number concentration in different regions for GCCN based on using optical probe measurements that are converted to dry diameter; and (ii) quantify relationships between below and above cloud GCCN measurements versus cloud water concentrations of key chemical tracers linked to sea salt (Na+, Cl−) and dust (non-sea salt [nss] Ca2+). Related to the second objective, this work explores sensitivity of cloud composition–GCCN relationships to differences between (i) marine regions (northeast Pacific versus northwest Atlantic), (ii) below versus above cloud GCCN data, (iii) different minimum dry diameter thresholds for GCCN data, and (iv) seasonal factors. The results of this study are important with regard to how to use commonly available airborne measurements to better understand GCCN characteristics and relationships with clouds, even in the face of uncertainties with the measurements (e.g.,34). Ultimately, a better understanding of GCCN has important implications for their treatment in models and for general understanding of their sources, vertically resolved size distribution characteristics, and relationships with cloud microphysics.
2. Methods
2.1. Monterey aerosol research campaign (MONARC)
MONARC was based in Marina, California and occurred between 28 May and 14 June 2019. The Center Interdisciplinary Remotely Piloted Aircraft Studies (CIRPAS) Twin Otter aircraft was used to perform 14 research flights over the northeastern Pacific Ocean (Fig. 1). A detailed description of the entire instrument payload is described elsewhere.44 The instruments used in MONARC for this study are summarized in Table 1 and include the following: cloud and aerosol spectrometer – forward scattering (CASF; particle diameter (Dp) ∼ 0.6–60 μm) measured aerosol and droplet size distributions; cloud imaging probe (CIP; Dp ∼ 16–1563 μm) measured droplet size distributions; particle volume monitor (PVM-100A; Dp ∼ 3–50 μm) measured cloud liquid water content (LWC); global positioning system and inertial navigation system (GPS/INS) measured velocity and altitude of the aircraft; EdgeTech Vigilant chilled mirror hygrometer (EdgeTech Instruments, Inc.) measured water vapor mixing ratio; Rosemount Model 102 sensor measured temperature; a nadir-facing infrared radiation pyrometer (Heitronics KT 19.85) measured skin surface temperature; Mohnen slotted-rod collector was used for cloud water collection.45 For the latter collector, past work45 characterized collection performance for droplets with mass mean diameters between 5 and 35 μm, but that is not restrictive in terms of other collection sizes. A total of 101 cloud water samples were collected using the modified Mohnen slotted-rod that manually is protruded above the roof of the aircraft during cloud penetrations. Samples in both campaigns were collected in polyethylene vials and stored at ∼ 5 °C for post-flight chemical analysis using the same laboratory and associated instruments and techniques summarized in Section 2.3.46,47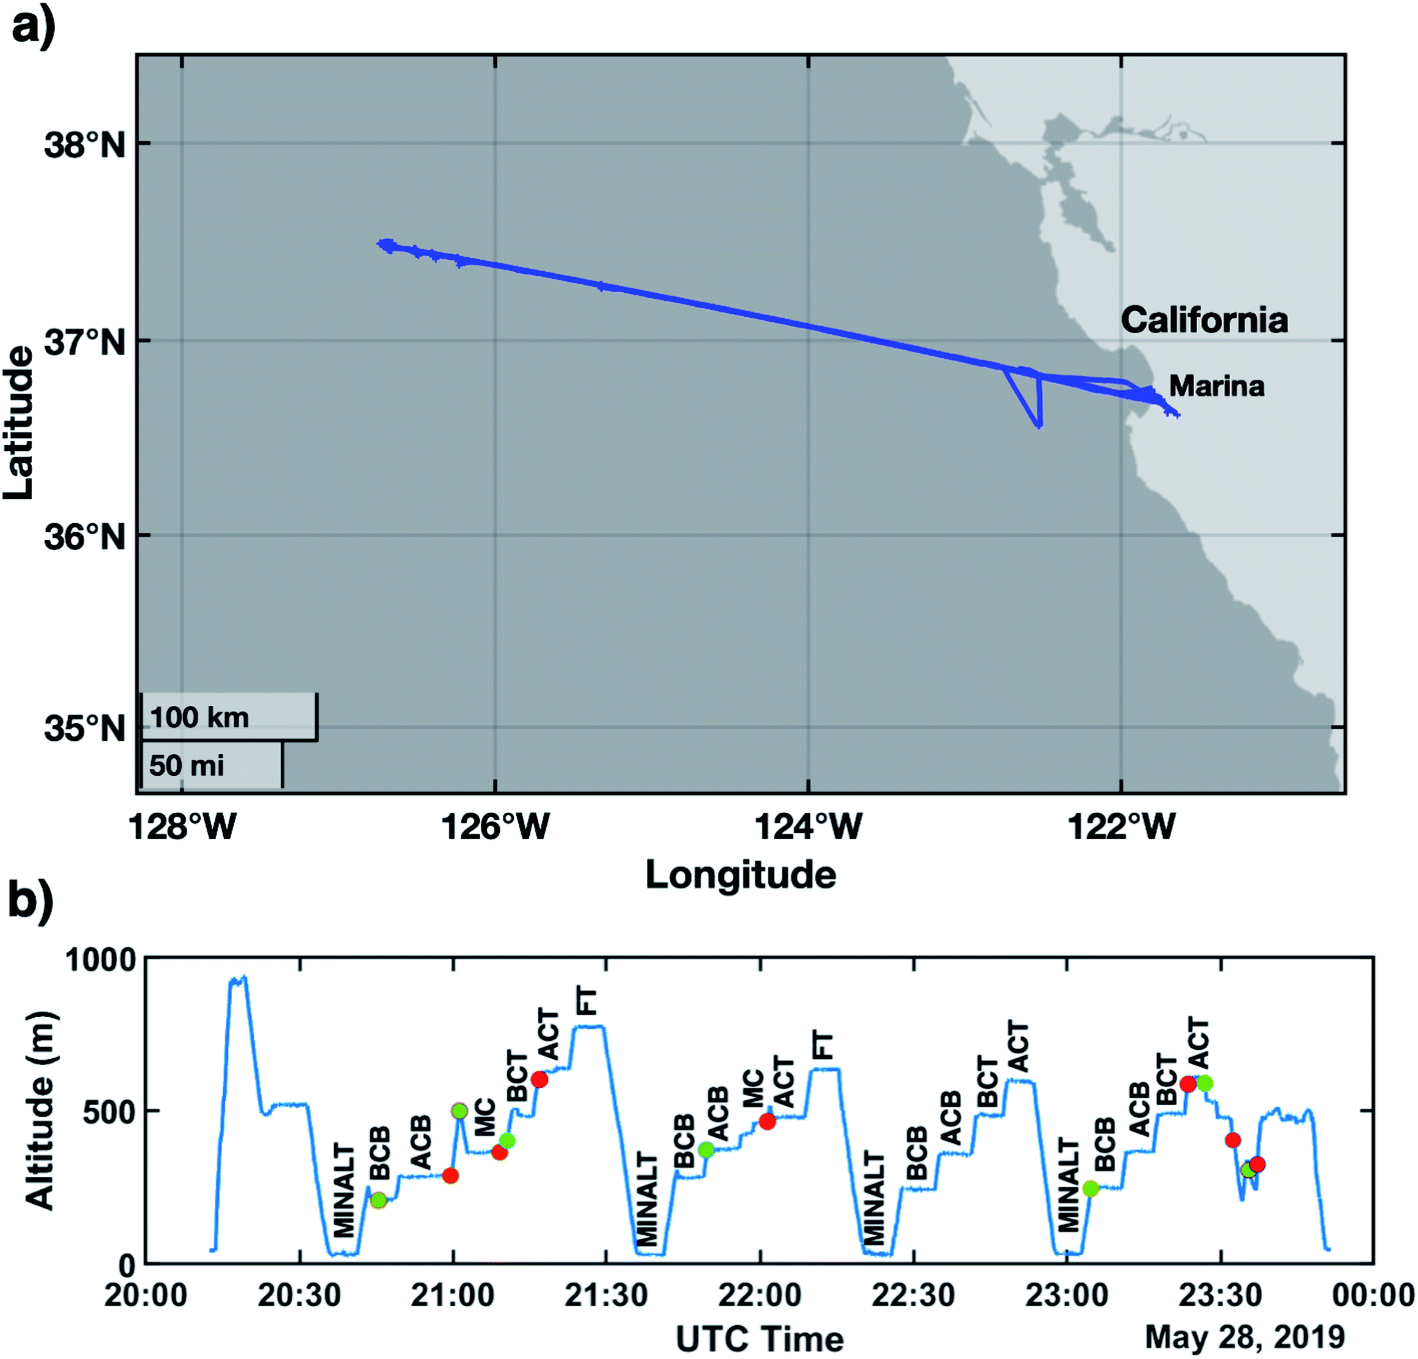 | ||
| Fig. 1 (a) Flight tracks for MONARC. (b) Typical sampling strategy for the Twin Otter during cloudy ensembles during MONARC. The green and red circles show collection start and end times of individual cloud water samples, respectively. | ||
| Campaign | Base | Date | Campaign | Base | Date | ||
|---|---|---|---|---|---|---|---|
| MONARC | Marina, CA | 5/28/19–6/14/19 | ACTIVATE | Hampton, VA | 2/14/20–3/12/20, 8/13/20–9/30/20 | ||
| Instruments | Size (μm) | Measurements | Instruments | Size (μm) | Measurements | ||
| Cloud and aerosol spectrometer (CAS) | D p: 0.6–60 | Aerosol size distributions | Fast cloud droplet probe (FCDP) | D p: 3–50 | Aerosol size distributions & liquid water content | ||
| Cloud imaging probe (CIP) | D p: 16–1563 | Droplet size distributions | Two-dimensional stereo probe vertical direction (2DS-V) | D p: 29–1465 | Droplet size distributions | ||
| Particle volume monitor (PVM-100A) | D p: 3–50 | Liquid water content | Axial cyclone cloud water collector (AC3) | See Section 2 | Cloud water composition | ||
| Mohnen slotted rod collector | See Section 2 | Cloud water composition | Turbulent air motion measurement system (TAMMS) | — | 3D winds | ||
| Global positioning system and inertial navigation system (GPS/INS) | — | Latitude, longitude, altitude | Applanix POS system (POS AV) | — | Latitude, longitude, altitude | ||
| EdgeTech vigilant chilled mirror hygrometer | — | Dew point temperature & water vapor mixing ratio | Diode laser hygrometer (DLH) | — | Dew point temperature & water vapor mixing ratio | ||
| Rosemount model 102 sensor | — | Temperature | Rosemount model 102 sensor | — | Temperature | ||
| Nadir-facing infrared thermometer (Heitronics KT 19.85) | — | Surface temperature | Nadir-facing infrared thermometer (Heitronics KT 15) | — | Surface temperature | ||
2.2. Aerosol cloud meteorology interactions over the western atlantic experiment (ACTIVATE)
ACTIVATE is based out of NASA Langley Research Center (Hampton, Virginia) with the first year of flights in 2020 having already taken place between February–March (deployment 1) and August–September (deployment 2). More flights were conducted in 2021 and 2022 but those are not the focus of this work owing partly to data still being collected and/or not fully having undergone quality control for public use at the time of developing this study. ACTIVATE uses a two-plane approach with one plane focused on in situ aerosol data collection in the marine boundary layer (HU-25 Falcon) and the other flying at higher altitudes (∼9 km) conducting remote sensing and launching dropsondes (King Air). Recent ACTIVATE studies summarize instrument details relevant to this work.48–51 This study focuses exclusively on HU-25 Falcon data during the winter and summer campaigns in 2020, which included 40 flights over the northwest Atlantic Ocean (Fig. 2). Relevant measurements were taken with instruments summarized in Table 1 including the following: fast cloud droplet probe (FCDP; Dp ∼ 3–50 μm) measured aerosol, droplet size distributions, and LWC; two-dimensional stereo probe vertical direction (2DS-V; Dp ∼ 29–1465 μm) measured droplet size distributions; turbulent air motion measurement system (TAMMS) measured 3-D winds; diode laser hygrometer (DLH) measured water vapor mixing ratio (WVMR); Rosemount Model 102 sensor measured temperature; axial cyclone cloud water collector (AC3) was used to collect cloud water samples analyzed offline for speciation. The AC3 can collect droplets with effective diameter >20 μm with over 60% collection efficiency39 but it can still collect smaller droplets too. A total of 98 cloud water samples were collected using an AC3 during the 2020 ACTIVATE flights.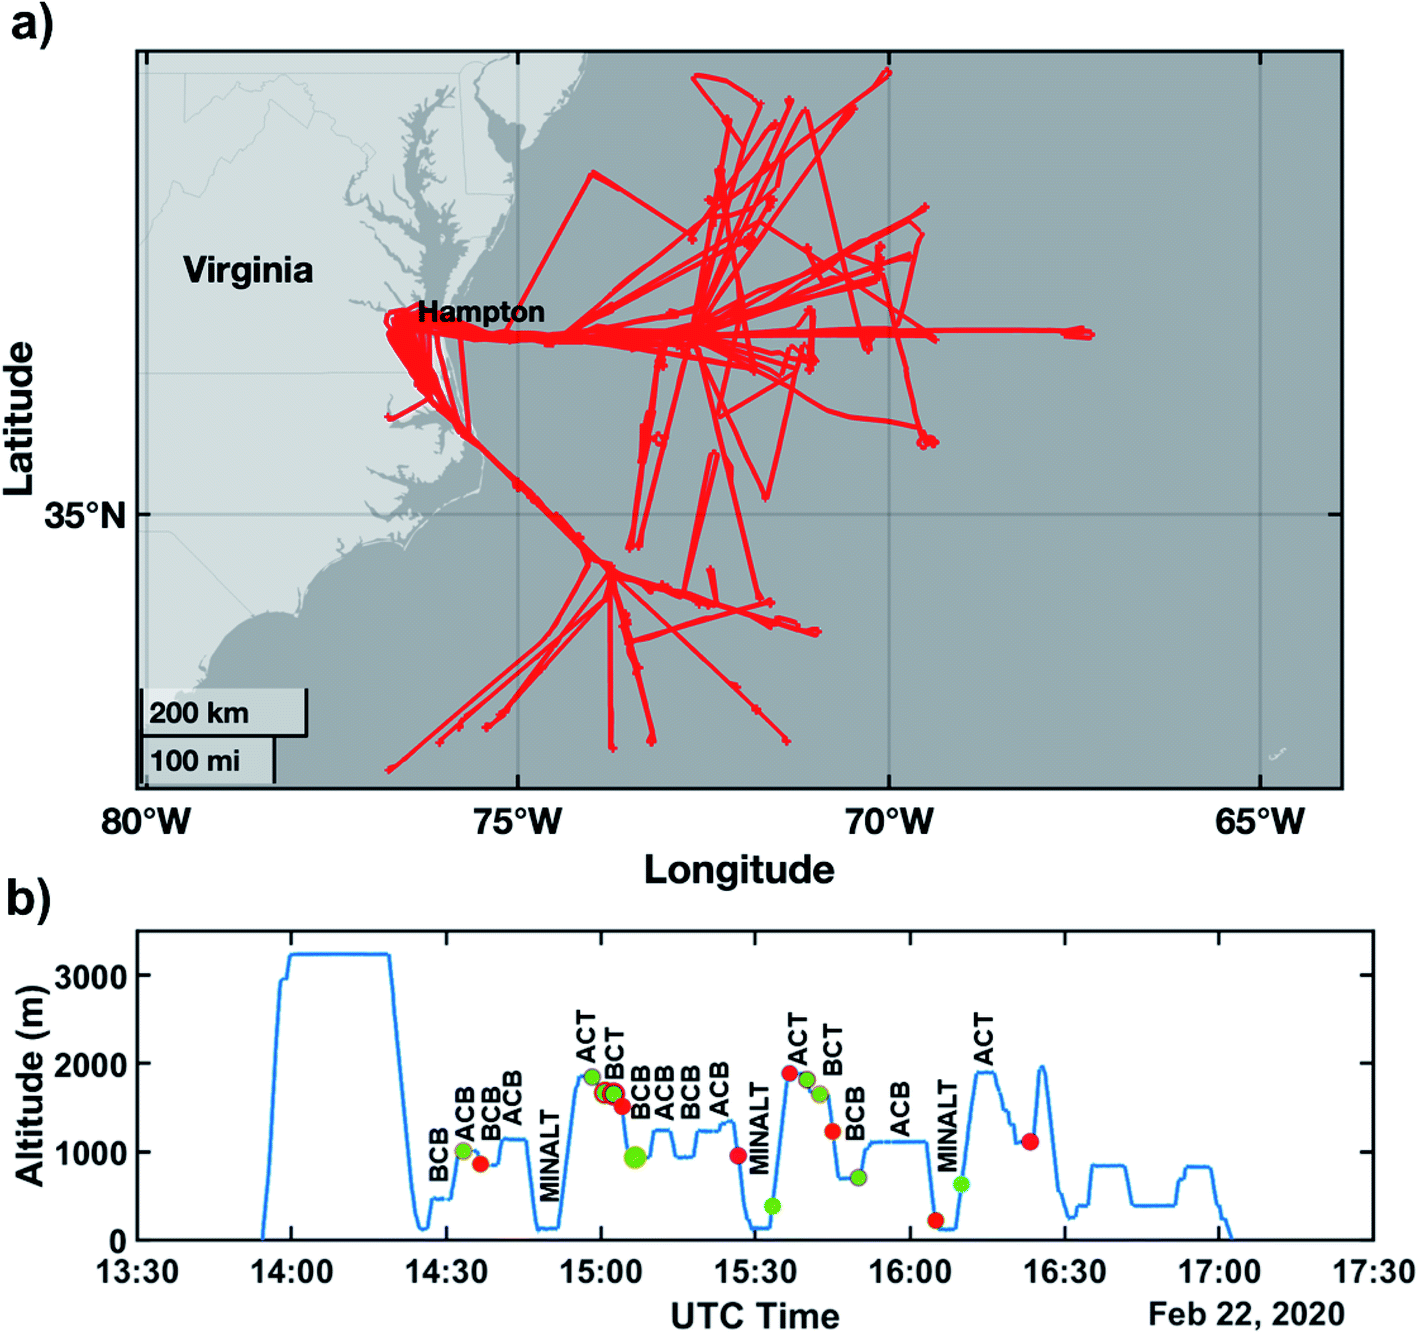 | ||
| Fig. 2 (a) Flight tracks for ACTIVATE deployments 1–2 in 2020. (b) Typical sampling strategy for the HU-25 Falcon during cloudy ensembles during ACTIVATE. The green and red circles show collection start and end times of individual cloud water samples, respectively. | ||
2.3. Cloud water chemical analysis
For both MONARC and ACTIVATE, cloud water samples were analyzed for 21 different species using ion chromatography (IC; Dionex ICS-2100). The flow rate of the instrument was set at 0.4 mL min−1. The anions were measured with a multistep gradient method using potassium hydroxide (KOH) as an eluent, a Dionex IonPac ASH11-HC 2 mm by 250 mm column, and an AERS 500e suppressor. The cations were measured with an isocratic method using methanesulfonic acid (MSA) eluent, a Dionex IonPac CS12A 2 mm by 250 mm column, and a Dionex CERS 500e suppressor. Both columns had a 25 minute sampling period. The species that are most relevant to this study are tracer species for sea salt (Na+, Cl−) and nss Ca2+, which is a tracer for dust.43,52 Methods from Azadi Aghdam et al.53 were used for the nss Ca2+ calculation relying on previously established mass ratios between calcium and pure sea salt. Cloud water samples measured using IC were reported in aqueous concentration (mg L−1) and converted to air equivalent concentrations via multiplying concentrations by the LWC (g m−3) during the sample collection time that was in cloud (criteria: LWC ≥ 0.02 g m−3) and dividing by the density of liquid water. The LWC criteria for in-cloud sampling is based on past work using the same value to discriminate between cloud and cloud-free air.54–56 This criteria was also used to define cloud base and top heights during vertical slant profiles. The few cases of rain or ice (i.e., wintertime ACTIVATE flights) did not impact the conclusions of this work and thus LWC (Dp ∼ 3–50 μm) was deemed to be sufficient for calculations of air equivalent concentrations rather than inclusion of rain or ice water content.As data from two separate cloud water collectors are used in this study, it is important to note that the Mohnen slotted-rod collector was directly compared to the AC3 on the CIRPAS Twin Otter during the Fog and Stratocumulus Evolution (FASE) campaign over the same study region as MONARC.39 Results indicated that campaign-mean cloud water constituent levels exhibited good agreement for the majority of the trace species between the two collectors on the same aircraft. The ratio of the median aerosol equivalent mass concentration for Na+ and Cl− between the AC3 and slotted rod collector was 1.27 and 1.31, respectively. Speculation of the offset with higher absolute levels measured via the AC3 was linked to differences in the collection of small droplets between the two collectors.
2.4. Flight approach
Both campaigns generally exercised the same flight pattern including repeated level legs at different altitudes below, in, and above clouds, referred to as ensembles (e.g.,49). Representative ensembles and associated sampling strategies during cloud scenes for MONARC and ACTIVATE are shown in Fig. 1 and 2, respectively: MINALT = minimum flight altitude, BCB = below cloud base, ACB = above cloud base, BCT = below cloud top, ACT = above cloud top. MONARC had additional legs including a mid-cloud leg (MC) and free troposphere (FT) leg (Fig. 1) that are not relevant to this work.2.5. Calculations
The focus of the GCCN data is largely on number concentrations to reduce sensitivity of results to sizing uncertainties34–37 that are compounded when converting number to volume concentrations; however, volume concentration results are also shown to an extent to demonstrate that qualitative trends evident from the number concentration data are preserved when using volume. Volume concentration is more relatable to the mass concentration units of species analyzed from the cloud water samples.
| M = a0 + a1x1 +… + anxn | (1) |
3. Results and discussion
3.1. Number concentration statistics and vertical profiles
Table 2 summarizes the aerosol number concentration statistics at five different minimum dry diameters for each campaign, including separation of results for winter and summer deployments for ACTIVATE. Table 2 focuses on MINALT data adjacent to where cloud water samples were obtained. This level is chosen as it is closest to the ocean surface, which is the source of sea salt. Both campaigns expectedly show a reduction in number concentration as the minimum dry diameter increases from 1 to 10 μm, with a key difference being that there were negligible values during MONARC for minimum dry diameters ≥5 μm. Regarding MINALT data, MONARC exhibited higher N>1 concentrations with a mean of 1.33 ± 0.91 cm−3, which dropped off to 0.11 cm−3 (≥2 μm), 0.02 cm−3 (≥3 μm), and 0.0013 cm−3 (≥5 μm). Past work based on size-resolved aerosol filter measurements by the MONARC study region showed that the overwhelming majority of sea salt mass is between aerodynamic diameters of 1.8 and 5.6 μm,55,68 consistent with the reduction in GCCN number concentrations starting around 5 μm.| MONARC | ACTIVATE: all | ACTIVATE: winter | ACTIVATE: summer | |
|---|---|---|---|---|
| N >1 | 1.33 ± 0.91 (1.02) | 0.38 ± 0.27 (0.30) | 0.23 ± 0.12 (0.23) | 0.61 ± 0.28 (0.68) |
| N >2 | 0.11 ± 0.17 (0.40) | 0.25 ± 0.17 (0.22) | 0.16 ± 0.09 (0.17) | 0.40 ± 0.18 (0.39) |
| N >3 | 0.02 ± 0.02 (0.01) | 0.11 ± 0.07 (0.11) | 0.09 ± 0.05 (0.09) | 0.13 ± 0.09 (0.14) |
| N >5 | 0.0013 ± 0.0025 (0.00) | 0.01 ± 0.01 (0.01) | 0.01 ± 0.01 (0.01) | 0.01 ± 0.01 (0.00) |
| N >10 | 0.00 ± 0.00 (0.00) | 0.001 ± 0.001 (0.001) | 0.001 ± 0.001 (0.001) | 0.001 ± 0.002 (0.0002) |
In contrast to MONARC, ACTIVATE had measurable GCCN reaching up to a minimum dry diameter of 10 μm regardless of season, with the cumulative concentrations above 1 μm being 0.38 cm−3, which dropped off to 0.25 cm−3 (≥2 μm), 0.11 cm−3 (≥3 μm), 0.01 cm−3 (≥5 μm), and 0.001 cm−3 (≥10 μm). In general, the summer deployment had higher mean and median concentrations up to a minimum diameter of 3 μm, in contrast to winter having comparable concentrations for minimum diameters between 5 and 10 μm.
Contextual number concentration vertical profiles are shown for particles with dry diameter exceeding 1 μm (Fig. 3), where CAS (MONARC) and FCDP (ACTIVATE) data were binned in 50 m vertical increments. Section S1 and Table S1† show that GCCN are often defined using 1 μm dry diameter, which is used for the vertical profiles here to not be restrictive with larger minimum size thresholds. Subsequent sections explore different minimum size thresholds to determine how well they correlate to cloud water sea salt and dust tracer species.
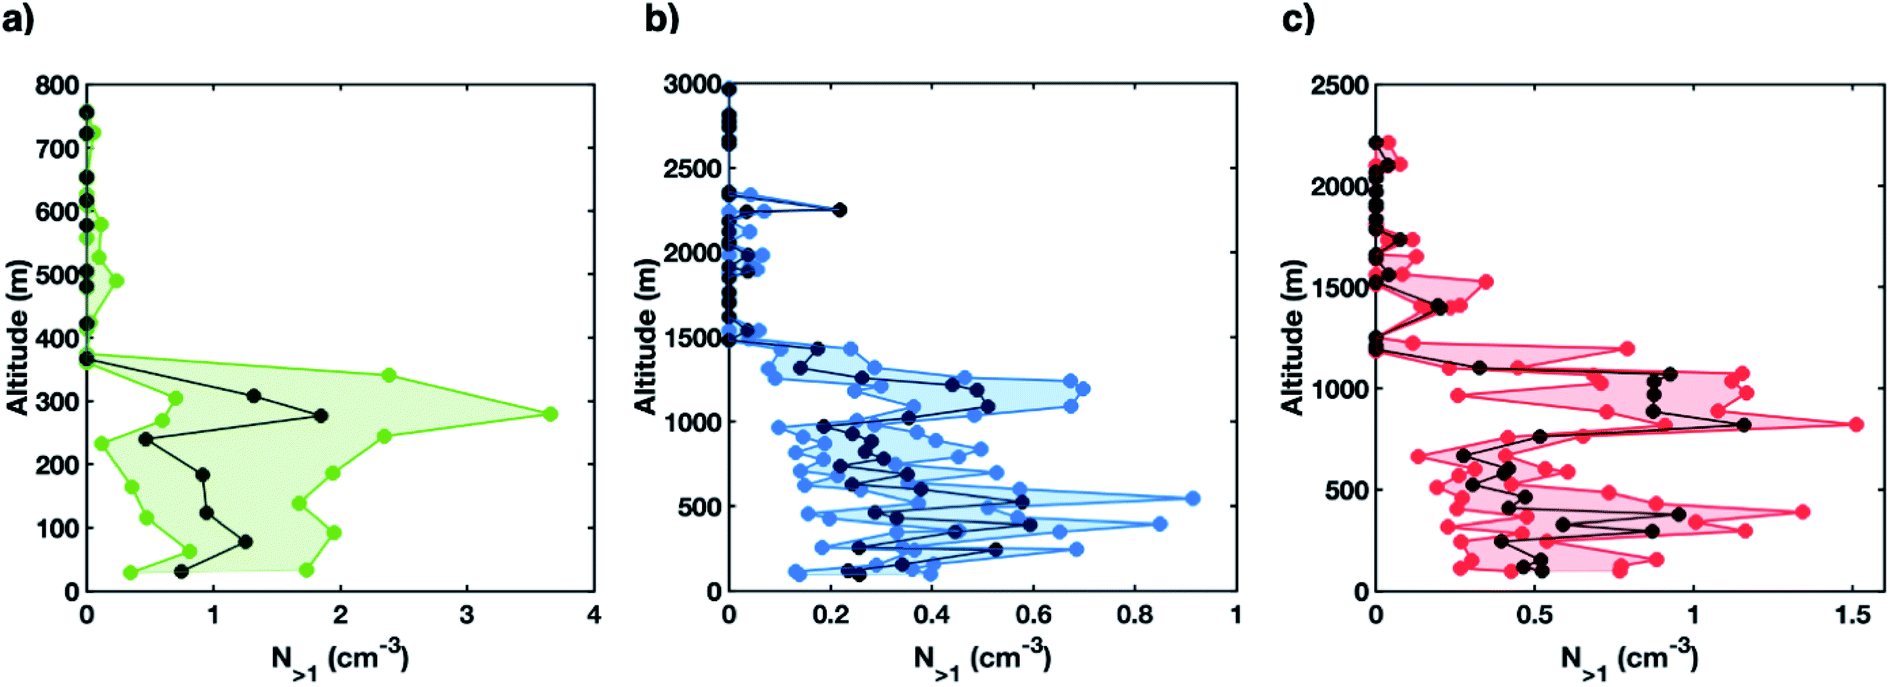 | ||
| Fig. 3 Vertical distribution of particle number concentration with dry diameter above 1 μm (N>1) based on cumulative data from (a) MONARC, (b) ACTIVATE winter, and (c) ACTIVATE summer. The shaded area is between the 25th and 75th percentile and the black line represents the median. | ||
The northeastern Pacific in summertime is characterized by a shallower boundary layer69 explaining the marked drop-off in concentrations above ∼400 m, explained by the significant reduction of sea salt particles in the free troposphere.60 In the MBL, median levels within specific vertical bins are approximately 1 cm−3. In contrast, ACTIVATE data reveal a drop-off in particle concentration above 1 km owing to the deeper MBL, especially in the wintertime when MBL heights typically exceed those of summertime by a few hundred meters.49,70,71 Median concentrations were below 1 cm−3 within the MBL regardless of season. Fig. 3 supports the assumption of GCCN being largely sea salt as dust would most likely be present in the free troposphere.
To put concentrations from Fig. 3 in context, Jung et al.18 noted that just 10−2 to 10−4 cm−3 of salt particles above 1 μm diameter have the potential to enhance cloud base rain rate by four times leading to depletion of cloud water via rainout. Thus, these levels are appreciable and motivate the subsequent discussion of relationships between GCCN concentrations and cloud water composition.
3.2. Analysis of species
We next address which cloud water species relevant to GCCN (Na+, Cl−, nss Ca2+) were best related to GCCN concentrations (Table 3). Regardless of dry diameter threshold or region, GCCN number concentration was best correlated with cloud water Na+ and Cl− in contrast to nss Ca2+, which suggests that sea salt particles are the main source of GCCN in both regions. This is consistent with Fig. 3 showing how the predominant source of GCCN is likely sea salt in the MBL rather than dust plumes that are expected in the free troposphere owing to long-range transport. R2 values are slightly higher for Na+ in contrast to Cl−, potentially due to chloride depletion reactions reducing Cl− levels.72,73 The statistically significant relationships demonstrate there is value in using cloud water chemical data for GCCN studies, as also concluded from recent studies based on data for the northeast Pacific.22,60 It is important to distinguish between differences in those two studies and this one. Schlosser et al.60 examined the relationship between aerosol volume concentration above a dry diameter of 1 μm in the sub-cloud region with cloud water Na+, and showed a positive correlation (n = 17 points, R2 = 0.50); our study focuses more on number concentration and not volume concentration to reduce dependence on sizing issues with wing-mounted optical probes (e.g.,34). The other study by Dadashazar et al.22 examined relationships of particle number concentration at ambient RH above 5 μm in the sub-cloud region relative to cloud water Cl− data and also found a positive relationship. We additionally examine how relationships between GCCN concentrations and cloud water composition depend on the (i) altitude level of the GCCN data, (ii) minimum GCCN dry diameter, (iii) region, and (iv) season.| Number | Na+ MINALT | Na+ ACT | Cl− MINALT | Cl− ACT | nss Ca2+ MINALT | nss Ca2+ ACT |
|---|---|---|---|---|---|---|
| MONARC | ||||||
| N >1 | 0.43 (30) | 0.30 (30) | 0.38 (30) | 0.16 (30) | 0.33 (27) | 0.07 (27) |
| N >2 | 0.37 (27) | 0.27 (22) | 0.27 (27) | 0.12 (22) | 0.13 (24) | 0.05 (20) |
| N >3 | 0.11 (24) | 0.18 (13) | 0.12 (24) | 0.05 (13) | 0.11 (21) | 0.02 (12) |
| N >5 | 0.05 (12) | 0.00 (8) | 0.03 (12) | 0.01 (8) | 0.00 (11) | 0.02 (7) |
| N >10 | 0.00 (0) | 0.02 (1) | 0.00 (0) | 0.02 (1) | 0.00 (0) | 0.05 (1) |
![[thin space (1/6-em)]](https://www.rsc.org/images/entities/char_2009.gif) |
||||||
| ACTIVATE: all | ||||||
| N >1 | 0.19 (53) | 0.03 (51) | 0.17 (53) | 0.03 (51) | 0.09 (15) | 0.00 (15) |
| N >2 | 0.26 (53) | 0.03 (51) | 0.24 (53) | 0.03 (51) | 0.06 (15) | 0.00 (15) |
| N >3 | 0.32 (53) | 0.01 (51) | 0.30 (53) | 0.01 (51) | 0.23 (15) | 0.01 (15) |
| N >5 | 0.36 (53) | 0.06 (46) | 0.34 (53) | 0.06 (46) | 0.03 (15) | 0.02 (13) |
| N >10 | 0.58 (44) | 0.00 (24) | 0.57 (44) | 0.00 (24) | 0.13 (14) | 0.03 (4) |
|
||||||
| ACTIVATE: winter | ||||||
| N >1 | 0.06 (32) | 0.03 (32) | 0.05 (32) | 0.03 (32) | 0.48 (5) | 0.35 (5) |
| N >2 | 0.07 (32) | 0.02 (32) | 0.06 (32) | 0.02 (32) | 0.61 (5) | 0.34 (5) |
| N >3 | 0.08 (32) | 0.02 (32) | 0.07 (32) | 0.02 (32) | 0.59 (5) | 0.25 (5) |
| N >5 | 0.08 (32) | 0.01 (31) | 0.07 (32) | 0.01 (31) | 0.04 (5) | 0.21 (5) |
| N >10 | 0.19 (28) | 0.07 (20) | 0.19 (28) | 0.06 (20) | 0.54 (5) | 0.07 (2) |
|
||||||
| ACTIVATE: summer | ||||||
| N >1 | 0.11 (21) | 0.14 (19) | 0.09 (21) | 0.14 (19) | 0.02 (10) | 0.02 (10) |
| N >2 | 0.20 (21) | 0.12 (19) | 0.18 (21) | 0.12 (19) | 0.00 (10) | 0.02 (10) |
| N >3 | 0.41 (21) | 0.02 (19) | 0.39 (21) | 0.02 (19) | 0.19 (10) | 0.04 (10) |
| N >5 | 0.60 (21) | 0.11 (15) | 0.58 (21) | 0.12 (15) | 0.03 (10) | 0.02 (8) |
| N >10 | 0.76 (16) | 0.00 (4) | 0.74 (16) | 0.00 (4) | 0.13 (9) | 0.04 (2) |
3.3. Analysis of altitude level
Cloud water concentrations of sea salt species exhibited higher R2 values with MINALT GCCN concentrations in contrast to ACT concentrations (Table 3). While in ACTIVATE the only statistically significant R2 values were for MINALT GCCN data, MONARC revealed significant relationships for sea salt species both for MINALT and ACT. The R2 values for nss Ca2+ largely showed insignificant results regardless of whether the data were from MINALT or ACT levels. Note that BCB levels of GCCN are not used in this work as MINALT is deemed to be sufficient to represent the sub-cloud environment (for simplicity) and avoids any potential cloud artifact issues; the correlations between cloud water species were stronger for GCCN data at the MINALT level relative to the BCB level. For the subsequent discussion, MINALT GCCN data are exclusively relied on while ACT data are not considered from this point on.3.4. Determination of dry diameter threshold
We next examine how relationships varied between cloud water composition and GCCN concentrations using five different minimum dry diameter thresholds between 1 and 10 μm. For MONARC, 1 μm yielded the highest R2 values between GCCN concentration and Na+ (0.43) and Cl− (0.38) for the MINALT level. In contrast for ACTIVATE, 10 μm yielded the highest R2 values between GCCN particle number with Na+ (0.58) and Cl− (0.57) for MINALT. Fig. 4 shows representative scatterplots between GCCN number concentrations and cloud water Na+ levels for both campaigns, whereas Fig. S1† shows similar results when basing the analysis on GCCN volume concentrations. We do not believe differences between MONARC and ACTIVATE instrumentation are sufficiently large to explain the different minimum dry diameters for the two regions and presume differences stem largely from regional differences in environmental conditions. Furthermore, there were hardly any measured values for N>5 and N>10 in MONARC. It is expected that if there are measurable amounts of the largest particles (≥10 μm), that those N concentrations would be better linked to cloud water sea salt levels as the latter is a mass-based measurement depending on diameter to the third power.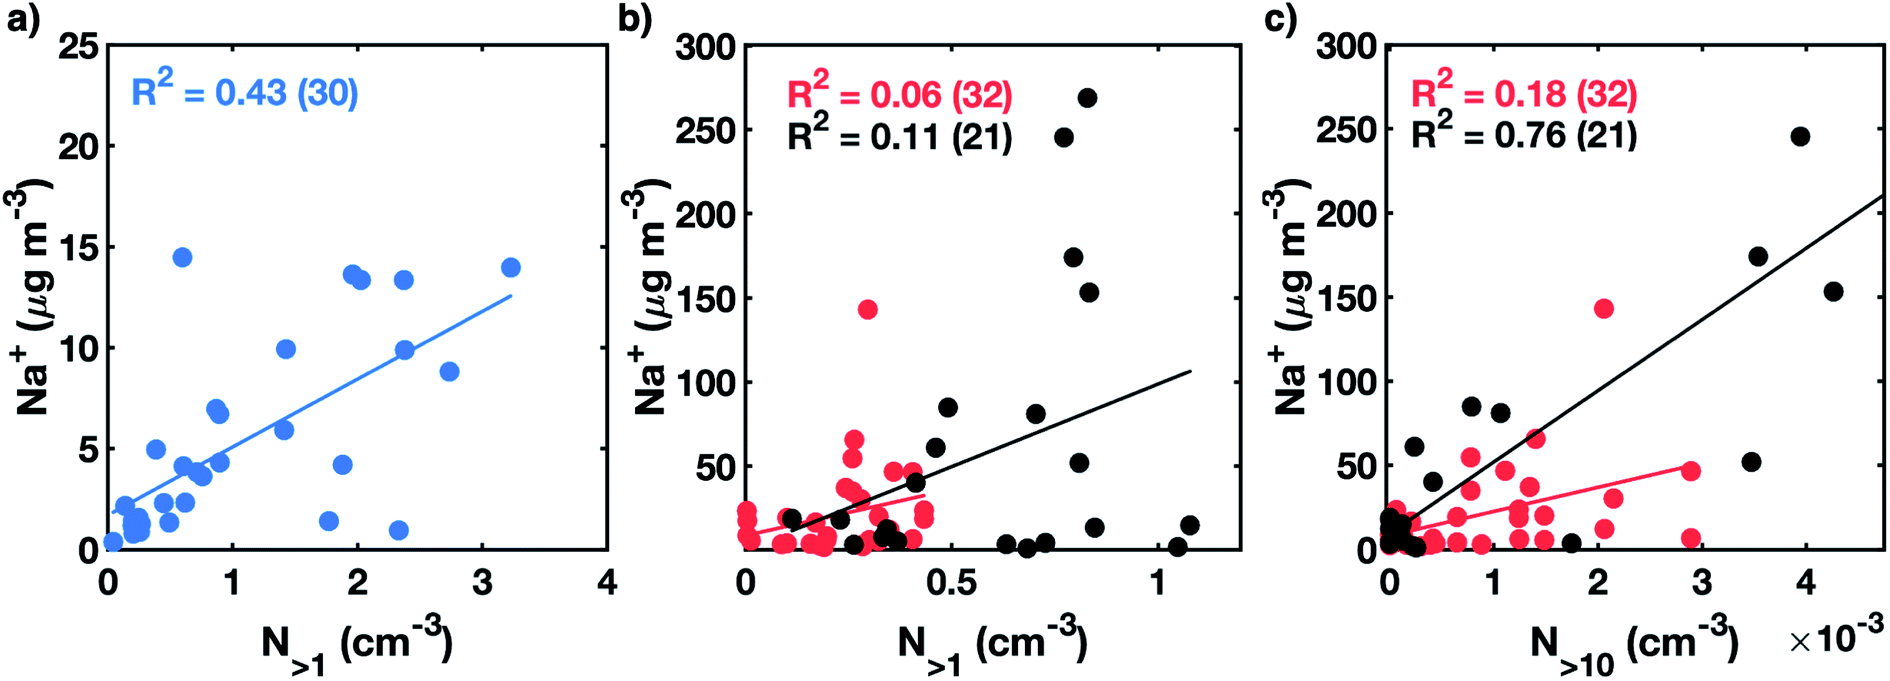 | ||
| Fig. 4 Cloud water sodium versus MINALT particle number concentration above a dry diameter of (a) 1 μm for MONARC, (b) 1 μm for ACTIVATE separated by winter and summer, and (c) 10 μm for ACTIVATE separated by winter and summer. (b and c) Red = winter, black = summer. Number of data points are in parenthesis. The R2 value of the cumulative data points for panels (b) and (c) are 0.06 and 0.58, respectively. | ||
Table S2† shows analogous results to Table 3 but when using GCCN volume concentration rather than number concentration. The qualitative trends remain the same in terms of the best performing minimum dry diameters per campaign; furthermore, only sea salt species exhibited significant relationships with GCCN volume concentrations. The overall GCCN volume concentrations in ACTIVATE were better correlated to Na+ as compared to MONARC regardless of minimum dry diameter. This is likely due to how ACTIVATE in general had more particles at the largest sizes that drive up volume concentrations, which better relate to cloud water mass concentrations as compared to smaller sizes.
Environmental factors noted in the literature to impact sea salt production and concentrations include sea surface temperature,74,75 wave kinematics,76,77 boundary layer stability78,79 and depth,57,60 precipitation,80,81 fetch,82 and ocean salinity.83,84Table 4 shows that there are notable differences in some environmental parameters between the two regions based on mean and median values. Notable is that the turbulence parameter αw was especially pronounced in ACTIVATE being more than threefold larger on average, which presumably could aid in the ascent of larger (≥5 μm) sea salt particles; there is ample evidence linking high winds to sea spray production (e.g.,57,85) include spume droplets with diameters exceeding 40 μm.86 Sea surface temperature was also considerably higher in ACTIVATE, although it is suspected that wind speed and turbulence differences played a greater role in ACTIVATE exhibiting both higher N>10 concentrations and a stronger relationship between concentrations at larger sizes and cloud water sea salt levels. Fig. S2† shows scatterplots for N>1 (MONARC and ACTIVATE) and N>10 (ACTIVATE) versus five relevant environmental parameters with the key result being that the highest linear regression coefficients of determination are for αw and wind speed. The correlations between GCCN and these two latter environmental parameters were especially high for N>10 in ACTIVATE. We caution that factors governing the size distribution of sea salt particles in the marine boundary layer are complex (e.g.,57) and more work is warranted to better characterize what governs regional and vertical differences in the size distribution of large particles in the marine atmosphere.
| Parameters | MONARC | ACTIVATE: all | ACTIVATE: winter | ACTIVATE: summer |
|---|---|---|---|---|
| Temperature (K) | 286 (286) | 287 (285) | 282 (285) | 294 (294) |
| Surface temperature (K) | 287 (287) | 295 (295) | 293 (295) | 298 (298) |
| Pressure (mb) | 1013 (1014) | 989 (1001) | 982 (1000) | 1000 (1002) |
| Relative humidity (%) | 91.33 (90.83) | 59.21 (60.53) | 51.36 (60.59) | 71.16 (72.47) |
| Water vapor mixing ratio (ppmv) | 8.68 (8.59) | 7.30 (5.13) | 3.94 (4.04) | 12.43 (13.01) |
| Horizontal wind speed (m s−1) | 10.97 (11.35) | 10.40 (9.13) | 10.26 (9.45) | 10.61 (9.45) |
| σ w (m s−1) | 0.27 (0.27) | 0.95 (1.04) | 1.04 (1.07) | 0.84 (0.78) |
| Rain water content (g m−3) | 0.04 (0.01) | 0.003 (0.0002) | 0.002 (0.0002) | 0.006 (0.0002) |
| Cloud top height (m) | 449 (420) | 1940 (1803) | 2053 (1907) | 1721 (1789) |
3.5. ACTIVATE seasonal analysis
ACTIVATE's mission design to fly in different seasons allows for analysis to isolate potential factors altering GCCN–cloud relationships between winter and summer. There were marked differences in water vapor mixing ratio and temperature with higher levels of both in the summer as compared to winter (Table 4), in contrast to higher αw and cloud top height in the winter. While results from previous sections (3.2–3.4) are preserved when examining each season alone, the key difference is that the summer exhibited higher correlations between N and V (regardless of minimum diameter threshold) and sea salt concentrations in cloud water (Tables 2 and S2†). The summer had a cluster of four points from Research Flight 36 (21 September 2020) with Na+ levels exceeding 150 μg m−3 driving up the R2 value (Fig. 4), which would otherwise have been 0.16 when omitting those samples, which is similar to the winter. Furthermore, the R2 of the cumulative ACTIVATE dataset without those four points in Fig. 4 is 0.15. We caution though that removal of those points still does not alter the findings of Section 3.4 that concentrations of increasingly larger minimum dry diameters for GCCN were better correlated with cloud water sea salt levels. Research flight 36 was notable for having enhanced boundary layer wind speeds and αw with values associated with the MINALT legs of the cloud water samples being 16.1–17.5 m s−1 and 1.20–1.49 m s−1, respectively, which are on the high end of ACTIVATE data (Table 4). Two conclusions can be reached: (i) the gap in R2 improvement in summer (relative to winter) when retaining the four high Na+ points increases as a function of minimum dry diameter suggestive of greater ease of lofting up larger salt particles with stronger winds and turbulence; and (ii) when omitting the four high Na+ samples, there was insignificant seasonal difference in the GCCN–Na+ relationship.3.6. Cloud water sea salt concentration predictor variables
Regression modeling was used to examine what variables are most successful for predicting cloud water sea salt tracer species concentrations. Table 5 reports results for each campaign separately when using 1, 2, and 3 parameter models. Here we rely mainly on Na+ as it is insensitive to sea salt reactions with acids in contrast to Cl−. Predictor variables included N concentrations (N>1 for MONARC and N>10 for ACTIVATE), horizontal wind speed, water vapor mixing ratio, cloud top height, RWC, and αw. Previous work focusing on predictions of N>1 (rather than Na+ in this study) in the northeastern Pacific with a more limited dataset revealed that the strongest predictors were MBL depth and cloud base rain rate with turbulent kinetic energy more influential for volume concentrations of particles larger than a dry diameter of 1 μm.60 For the same region Dadashazar et al.22 showed stronger GCCN relationships with cloud water Cl− at reduced values of rain rate and enhanced values of αw.| MONARC | Predictors | Sign | R 2 | p | n |
|---|---|---|---|---|---|
| 1 parameter | N >1 | + | 0.43 | 8.72 × 10⁻⁵ | 30 |
| α w | + | 0.20 | 1.36 × 10⁻² | 30 | |
| WVMR | − | 0.18 | 1.79 × 10⁻² | 30 | |
| Wind speed | + | 0.11 | 8.00 × 10⁻² | 30 | |
| RWC | − | 0.03 | 3.42 × 10⁻¹ | 30 | |
| CTH | − | 0.00 | 8.49 × 10⁻¹ | 30 | |
| 2 parameter | WVMR | − | 0.63 | 1.52 × 10⁻⁶ | 30 |
| α w | + | 0.46 | 2.61 × 10⁻⁴ | 30 | |
| Wind speed | + | 0.43 | 5.02 × 10⁻⁴ | 30 | |
| CTH | + | 0.43 | 5.09 × 10⁻⁴ | 30 | |
| RWC | − | 0.43 | 5.22 × 10⁻⁴ | 30 | |
| 3 parameter | WVMR/RWC | −/− | 0.66 | 2.64 × 10⁻⁶ | 30 |
| Wind speed/WVMR | −/− | 0.64 | 5.73 × 10⁻⁶ | 30 | |
| WVMR/CTH | −/− | 0.64 | 6.57 × 10⁻⁶ | 30 | |
| WVMR/αw | −/− | 0.63 | 7.56 × 10⁻⁶ | 30 | |
| Wind speed/αw | −/+ | 0.52 | 2.36 × 10⁻⁴ | 30 | |
| RWC/αw | −/+ | 0.46 | 1.00 × 10⁻³ | 30 |
| ACTIVATE | Predictors | Sign | R 2 | p | n |
|---|---|---|---|---|---|
| 1 parameter | N >10 | + | 0.58 | 3.31 × 10⁻¹¹ | 44 |
| Wind speed | + | 0.33 | 7.64 × 10⁻⁶ | 52 | |
| α w | + | 0.21 | 1.30 × 10⁻³ | 46 | |
| RWC | − | 0.02 | 4.39 × 10⁻¹ | 35 | |
| WVMR | − | 0.02 | 3.69 × 10⁻¹ | 53 | |
| CTH | − | 0.01 | 5.42 × 10⁻¹ | 44 | |
| 2 parameter | CTH | − | 0.61 | 3.52 × 10⁻⁹ | 40 |
| WVMR | + | 0.59 | 2.43× 10⁻¹⁰ | 44 | |
| Wind speed | − | 0.58 | 5.57 × 10⁻¹⁰ | 43 | |
| α w | − | 0.57 | 1.08 × 10⁻⁸ | 37 | |
| RWC | + | 0.51 | 1.19 × 10⁻⁵ | 31 | |
| 3 parameter | WVMR/CTH | ± | 0.62 | 2.06 × 10⁻⁸ | 40 |
| Wind speed/CTH | −/− | 0.61 | 3.61 × 10⁻⁸ | 39 | |
| α w/CTH | −/− | 0.60 | 9.68 × 10⁻⁷ | 33 | |
| Wind speed/WVMR | −/+ | 0.59 | 2.74 × 10⁻⁹ | 43 | |
| WVMR/αw | ± | 0.58 | 6.05 × 10⁻⁸ | 37 | |
| Wind speed/αw | −/− | 0.57 | 6.59 × 10⁻⁸ | 37 |
In terms of 1-parameter models, the parameter best correlated with Na+ for MONARC (coefficient sign in parenthesis) was N>1 (+), followed by αw (+), water vapor mixing ratio (−), wind speed (+), RWC (−), and cloud top height (−). The signs of the coefficients are consistent with more vigorous winds and turbulence promoting more cloud water sea salt levels via sea salt transport to clouds. Furthermore, reduced RWC is consistent with less scavenging of GCCN which would interfere with the intended GCCN–Na+ relationships22 sought after in this work. The R2 value of the 1 parameter models peaked at 0.43 for N>1 with a significant reduction for the other 1 parameter models; p values for only the top four models were below 0.05. MONARC's 2 and 3 parameter models revealed slight improvement beyond the peak R2 values of 0.43 for the N>1 single parameter model, with values reaching only as high as 0.66 for the best 3 parameter model. When excluding consideration of N>1, the ranking and combination of best predictors did not follow the order of parameters from the 1 parameter models due to co-variance of these parameters with each other and other potentially influential factors. Similarly, the sign of the coefficients in front of the 2nd or 3rd parameters is inconsistent with what ideally is expected from the 1 parameter models.
ACTIVATE's 1 parameter models showed that after N>10, the top predictors were wind speed (+), αw (+), RWC (−), water vapor mixing ratio (−), and cloud top height (−). The sign of all the parameters matched those of MONARC's 1 parameter models, but with the order of most influential parameters varying slightly. It can be concluded that the best related environmental parameter after N>1/N>10 is either wind speed or αw, both of which are related to the general dynamics influential for emissions and mixing of GCCN in the boundary layer. The 1 parameter models had slightly higher R2 values for ACTIVATE, but interestingly (unlike MONARC) there was hardly any improvement in the 2 and 3 parameter models (peak R2 = 0.62) for ACTIVATE versus the R2 of 0.58 for the best single parameter model relying on just N>10. This emphasizes the non-linear nature of factors impacting Na+ levels in cloud water, and that the 1 parameter models provide the most value in Table 5 in terms of knowing regionally what factors to first order are most important.
4. Limitations of this study
Aerosol–cloud interactions are difficult to study, which is why methods are employed with currently available datasets that, while imperfect, still can afford useful insights to advance knowledge. An avenue to pursue in this regard is to leverage composition data providing information about the CCN activating into droplets, which can be useful for studies of GCCN–cloud interactions. This work extends the use of airborne data linking cloud-free supermicrometer particle data with cloud water composition showing significant relationships between the two pointing to GCCN–cloud interactions.The two key datasets used in this study have limitations, including notably the sizing uncertainties of wing-mounted optical probes.34 A comparison between the performance of the two wing-mounted probes is outside the scope of this work but warrants a deeper look for studies aiming to use such data in more quantitative ways. Parameterizations used to convert from ambient to dry conditions are also imperfect and a source of uncertainty, especially as ambient inorganic sea salt may exhibit lower hygroscopicities as compared to pure sodium chloride.59 The cloud water collectors also sample droplets resulting from activated particles with initial size distributions that are unknown but presumably skewed to larger particles since mass concentrations scale with diameter to the third power. Comparisons between MONARC and ACTIVATE are imperfect owing to different instruments used for the particle and cloud water measurements. Therefore, results of this study and past ones of this nature22,60 cannot be used in a fully quantitative way owing to aforementioned issues, but their main purpose is served here to provide qualitative ‘clues’ into a very poorly understood topic with field data: GCCN–cloud interactions. The results are promising to motivate more research utilizing these types of measurement capabilities since they represent what the community currently has to use for airborne research. Areas requiring deeper analysis for both regions is the importance of air mass history and fetch82,87 as some of the analysis in this work relied on relating MINALT level data to cloud data, with the issue being that the cloud data may have been impacted by conditions farther upwind as compared to the adjacent MINALT legs relative to when a cloud water sample was obtained.
5. Conclusions
This work used airborne data from MONARC and ACTIVATE campaigns to examine statistics associated by supermicrometer (dry Dp ≥ 1 μm) particle concentrations in the northeast Pacific and northwest Atlantic, in addition to relationships between such concentrations and cloud water concentrations for sea salt (Na+, Cl−) and dust (nss Ca2+) species. The following are notable findings from this work:• Supermicrometer particle number concentrations are highest in the boundary layer of both regions with a sharp drop off in the free troposphere owing to the overwhelming influence of sea salt (rather than dust) on GCCN levels. Supermicrometer particle concentrations were higher in the northeast Pacific than the northwest Atlantic, but the former also had a much sharper reduction in N concentrations at larger minimum dry diameters (5–10 μm).
• Sea salt is much more abundant than dust in the cloud water of both regions, which is consistent with sub-cloud GCCN levels (rather than above-cloud levels) exhibiting stronger relationships with cloud water sea salt levels.
• GCCN number concentrations were better related to cloud water sea salt at the lowest minimum dry Dp of 1 μm in the northeast Pacific in contrast to N concentrations at the highest minimum dry Dp of 10 μm in the northwest Atlantic. It is presumed that enhanced winds and turbulence in the latter region could be linked to higher N>10 levels and stronger relationships with cloud water sea salt, which is arguably best related to the largest GCCN sizes owing to mass's dependence on diameter to the third power.
• There was no major difference between GCCN and cloud water sea salt interrelationships between ACTIVATE's winter and summer data after excluding a few data points from one flight with unusually high near-surface winds and turbulence, which drove up the strength of N>10 relationships with cloud water sea salt levels. This points to how the combination of datasets used here to study GCCN–cloud relationships are clearer at higher winds and when GCCN concentrations are enhanced.
• Linear regression models with up to 3 predictor parameters exhibit limited success in predicting cloud water Na+ levels, with the best predictors after N levels in both regions being either near-surface values of αw and wind speed for MONARC and ACTIVATE, respectively.
This study has implications for modeling studies exploring the use of different size definitions for GCCN in studies of aerosol–cloud interactions (e.g.,23). The results of these types of studies are important in light of growing attention towards marine cloud brightening efforts that need to account for GCCN, which would offset the intended brightening desired from smaller CCN according to the Twomey effect.88 Analysis of data analogous to this study for mixed-phase clouds will be helpful to advance this type of analysis for another category of clouds impacted in ways that may differ with warm clouds.
Data availability
MONARC data can be accessed at: https://doi.org/10.6084/m9.figshare.5099983.v10. ACTIVATE Falcon data can be accessed at: http://doi.org/10.5067/ASDC/ACTIVATE_Aerosol_AircraftInSitu_Falcon_Data_1.Author contributions
MONARC field data were collected and processed by JS, EE, CS, and AS. ACTIVATE field data were collected by EC, GD, RM, JN, SK, KT, CV, LZ, CR, EW, and MS. Data analysis was conducted by MG under supervision by AS. Writing the original draft was performed by MG and AS. All authors contributed in part to the discussion, review, and editing of the manuscript. All authors have given approval to the final version of the manuscript.Conflicts of interest
There are no conflicts to declare.Acknowledgements
This work was funded by Office of Naval research grant N00014-21-1-2115 and the National Aeronautics and Space Administration grant 80NSSC19K0442 in support of the ACTIVATE Earth Venture Suborbital-3 (EVS-3) investigation, which is funded by NASA's Earth Science Division and managed through the Earth System Science Pathfinder Program Office.References
- B. A. Albrecht, Aerosols, Cloud Microphysics, and Fractional Cloudiness, Science, 1989, 245, 1227–1230 CrossRef CAS PubMed.
- S. Twomey, Pollution and the planetary albedo, Atmos. Environ., 1974, 8, 1251–1256 CrossRef.
- S. Twomey, The Influence of Pollution on the Shortwave Albedo of Clouds, J. Atmos. Sci., 1977, 34, 1149–1152 CrossRef.
- J. Warner, A Reduction in Rainfall Associated with Smoke from Sugar-Cane Fires—An Inadvertent Weather Modification?, J. Appl. Meteorol. Climatol., 1968, 7, 247–251 CrossRef.
- T. S. L’Ecuyer, W. Berg, J. Haynes, M. Lebsock and T. Takemura, Global observations of aerosol impacts on precipitation occurrence in warm maritime clouds, J. Geophys. Res.: Atmos., 2009, 114, D09211 Search PubMed.
- H. G. Houghton, Problems connected with the condensation and precipitation processes in the atmosphere, Bull. Am. Meteorol. Soc., 1938, 19, 152–159 CrossRef.
- D. B. Johnson, The onset of effective coalescence growth in convective clouds, Q. J. R. Metereol. Soc., 1993, 119, 925–933 CrossRef.
- C. A. Knight, J. Vivekanandan and S. G. Lasher-Trapp, First radar echoes and the early ZDR history of Florida cumulus, J. Atmos. Sci., 2002, 59, 1454–1472 CrossRef.
- G. K. Mather, Coalescence enhancement in large multicell storms caused by the emissions from a Kraft paper mill, J. Appl. Meteorol., 1991, 30, 1134–1146 CrossRef.
- T. Reisin, Z. Levin and S. Tzivion, Rain production in convective clouds as simulated in an axisymmetric model with detailed microphysics. Part II: Effects of varying drops and ice initiation, J. Atmos. Sci., 1996, 53, 1815–1837 CrossRef.
- D. Rosenfeld, R. Lahav, A. Khain and M. Pinsky, The Role of Sea Spray in Cleansing Air Pollution over Ocean via Cloud Processes, Science, 2002, 297, 1667 CrossRef CAS PubMed.
- T. Takahashi, Warm rain, giant nuclei and chemical balance—A numerical model, J. Atmos. Sci., 1976, 33, 269–286 CrossRef.
- A. H. Woodcock, R. A. Duce and J. L. Moyers, Salt particles and raindrops in Hawaii, J. Atmos. Sci., 1971, 28, 1252–1257 CrossRef CAS.
- A. H. Woodcock and M. M. Gifford, Sampling Atmospheric Sea-Salt Nuclei over the Ocean, and Efficiency of Deposition of Nuclei on 'ribbons' One Millimeter Wide, Woods Hole Oceanographic Institution, 1949 Search PubMed.
- K. V. Beard and H. T. Ochs III, Warm-rain initiation: An overview of microphysical mechanisms, Journal of Applied Meteorology, 1993, 32, 608–625 CrossRef.
- M. J. Szumowski, R. M. Rauber and H. T. Ochs III, The Microphysical Structure and Evolution of Hawaiian Rainband Clouds. Part III: A Test of the Ultragiant Nuclei Hypothesis, J. Atmos. Sci., 1999, 56, 1980–2003 CrossRef.
- J. B. Jensen and S. Lee, Giant sea-salt aerosols and warm rain formation in marine stratocumulus, J. Atmos. Sci., 2008, 65, 3678–3694 CrossRef.
- E. Jung, B. A. Albrecht, H. H. Jonsson, Y.-C. Chen, J. H. Seinfeld, A. Sorooshian, A. R. Metcalf, S. Song, M. Fang and L. M. Russell, Precipitation effects of giant cloud condensation nuclei artificially introduced into stratocumulus clouds, Atmos. Chem. Phys., 2015, 15, 5645–5658 CrossRef CAS.
- L. Zhang, D. V. Michelangeli and P. A. Taylor, Influence of aerosol concentration on precipitation formation in low-level, warm stratiform clouds, J. Aerosol Sci., 2006, 37, 203–217 CrossRef CAS.
- N. F. Laird, H. T. Ochs III, R. M. Rauber and L. J. Miller, Initial Precipitation Formation in Warm Florida Cumulus, J. Atmos. Sci., 2000, 57, 3740–3751 CrossRef.
- Z. Levin, A. Teller, E. Ganor and Y. Yin, On the interactions of mineral dust, sea-salt particles, and clouds: A measurement and modeling study from the Mediterranean Israeli Dust Experiment campaign, J. Geophys. Res.: Atmos., 2005, 110, D20202 CrossRef.
- H. Dadashazar, Z. Wang, E. Crosbie, M. Brunke, X. Zeng, H. Jonsson, R. K. Woods, R. C. Flagan, J. H. Seinfeld and A. Sorooshian, Relationships between giant sea salt particles and clouds inferred from aircraft physicochemical data, J. Geophys. Res.: Atmos., 2017, 122, 3421–3434 CrossRef CAS.
- T. Dror, J. M. Flores, O. Altaratz, G. Dagan, Z. Levin, A. Vardi and I. Koren, Sensitivity of warm clouds to large particles in measured marine aerosol size distributions–a theoretical study, Atmos. Chem. Phys., 2020, 20, 15297–15306 CrossRef CAS.
- G. Feingold, W. R. Cotton, S. M. Kreidenweis and J. T. Davis, The impact of giant cloud condensation nuclei on drizzle formation in stratocumulus: Implications for cloud radiative properties, J. Atmos. Sci., 1999, 56, 4100–4117 CrossRef.
- W. Y. Cheng, G. G. Carrió, W. R. Cotton and S. M. Saleeby, Influence of cloud condensation and giant cloud condensation nuclei on the development of precipitating trade wind cumuli in a large eddy simulation, J. Geophys. Res.: Atmos., 2009, 114, D08201 CrossRef.
- G. Dagan, I. Koren and O. Altaratz, Aerosol effects on the timing of warm rain processes, Geophys. Res. Lett., 2015, 42, 4590–4598 CrossRef.
- A. Teller and Z. Levin, The effects of aerosols on precipitation and dimensions of subtropical clouds: a sensitivity study using a numerical cloud model, Atmos. Chem. Phys., 2006, 6, 67–80 CrossRef CAS.
- Y. Yin, Z. Levin, T. G. Reisin and S. Tzivion, The effects of giant cloud condensation nuclei on the development of precipitation in convective clouds—A numerical study, Atmos. Res., 2000, 53, 91–116 CrossRef.
- Y. Rudich, A. Sagi and D. Rosenfeld, Influence of the Kuwait oil fires plume (1991) on the microphysical development of clouds, J. Geophys. Res.: Atmos., 2003, 108(D15), 4478 CrossRef.
- D. Rosenfeld, U. Lohmann, G. B. Raga, C. D. O'Dowd, M. Kulmala, S. Fuzzi, A. Reissell and M. O. Andreae, Flood or drought: How do aerosols affect precipitation?, Science, 2008, 321, 1309–1313 CrossRef CAS PubMed.
- E. E. Hindman, P. V. Hobbs and L. F. Radke, Cloud condensation nucleus size distributions and their effects on cloud droplet size distributions, J. Atmos. Sci., 1977, 34, 951–956 CrossRef.
- J. B. Jensen and A. D. Nugent, Condensational growth of drops formed on giant sea-salt aerosol particles, J. Atmos. Sci., 2017, 74, 679–697 CrossRef.
- A. H. Woodcock, Salt nuclei in marine air as a function of altitude and wind force, J. Meteorol., 1953, 10, 362–371 CrossRef.
- J. S. Reid, B. Brooks, K. K. Crahan, D. A. Hegg, T. F. Eck, N. O’Neill, G. de Leeuw, E. A. Reid and K. D. Anderson, Reconciliation of coarse mode sea-salt aerosol particle size measurements and parameterizations at a subtropical ocean receptor site, J. Geophys. Res.: Atmos., 2006, 111, D02202 Search PubMed.
- J. N. Porter and A. D. Clarke, Aerosol size distribution models based on in situ measurements, J. Geophys. Res.: Atmos., 1997, 102, 6035–6045 CrossRef CAS.
- J. S. Reid, H. H. Jonsson, M. H. Smith and A. Smirnov, Evolution of the vertical profile and flux of large sea-salt particles in a coastal zone, J. Geophys. Res.: Atmos., 2001, 106, 12039–12053 CrossRef.
- A. Smirnov, B. N. Holben, T. F. Eck, O. Dubovik and I. Slutsker, Effect of wind speed on columnar aerosol optical properties at Midway Island, J. Geophys. Res.: Atmos., 2003, 108(D24), 4802 CrossRef.
- A. Sorooshian, Z. Wang, G. Feingold and T. S. L'Ecuyer, A satellite perspective on cloud water to rain water conversion rates and relationships with environmental conditions, J. Geophys. Res.: Atmos., 2013, 118, 6643–6650 CrossRef CAS.
- E. Crosbie, M. D. Brown, M. Shook, L. Ziemba, R. H. Moore, T. Shingler, E. Winstead, K. L. Thornhill, C. Robinson, A. B. MacDonald, H. Dadashazar, A. Sorooshian, A. Beyersdorf, A. Eugene, J. Collett Jr, D. Straub and B. Anderson, Development and characterization of a high-efficiency, aircraft-based axial cyclone cloud water collector, Atmos. Meas. Tech., 2018, 11, 5025–5048 CrossRef CAS PubMed.
- A. Hossein Mardi, H. Dadashazar, A. B. MacDonald, E. Crosbie, M. M. Coggon, M. Azadi Aghdam, R. K. Woods, H. H. Jonsson, R. C. Flagan and J. H. Seinfeld, Effects of Biomass Burning on Stratocumulus Droplet Characteristics, Drizzle Rate, and Composition, J. Geophys. Res.: Atmos., 2019, 124, 12301–12318 CrossRef CAS PubMed.
- H. Dadashazar, L. Ma and A. Sorooshian, Sources of pollution and interrelationships between aerosol and precipitation chemistry at a central California site, Sci. Total Environ., 2019, 651, 1776–1787 CrossRef CAS PubMed.
- A. Sorooshian, T. Shingler, A. Harpold, C. W. Feagles, T. Meixner and P. D. Brooks, Aerosol and precipitation chemistry in the southwestern United States: spatiotemporal trends and interrelationships, Atmos. Chem. Phys., 2013, 13, 7361–7379 CrossRef CAS PubMed.
- A. F. Corral, H. Dadashazar, C. Stahl, E.-L. Edwards, P. Zuidema and A. Sorooshian, Source Apportionment of Aerosol at a Coastal Site and Relationships with Precipitation Chemistry: A Case Study over the Southeast United States, Atmosphere, 2020, 11, 1212 CrossRef CAS PubMed.
- A. Sorooshian, A. B. MacDonald, H. Dadashazar, K. H. Bates, M. M. Coggon, J. S. Craven, E. Crosbie, S. P. Hersey, N. Hodas, J. J. Lin, A. N. Marty, L. C. Maudlin, A. R. Metcalf, S. M. Murphy, L. T. Padró, G. Prabhakar, T. A. Rissman, T. Shingler, V. Varutbangkul, Z. Wang, R. K. Woods, P. Y. Chuang, A. Nenes, H. Jonsson, R. C. Flagan and J. H. Seinfeld, A multi-year data set on aerosol-cloud-precipitation-meteorology interactions for marine stratocumulus clouds, Sci. Data, 2018, 5(1), 180026 CrossRef PubMed.
- D. Hegg and P. Hobbs, Studies of the mechanisms and rate with which nitrogen species are incorporated into cloud water and precipitation, Second Annual Report on Project CAPA-21-80 to the Coordinating Research Council, 1986, last accessed 15 November 2021, http://carg.atmos.washington.edu/sys/research/archive/nitrogen_spec_final.pdf Search PubMed.
- C. Stahl, M. T. Cruz, P. A. Bañaga, G. Betito, R. A. Braun, M. A. Aghdam, M. O. Cambaliza, G. R. Lorenzo, A. B. MacDonald and P. C. Pabroa, An annual time series of weekly size-resolved aerosol properties in the megacity of Metro Manila, Philippines, Sci. Data, 2020, 7, 1–13 CrossRef PubMed.
- C. Stahl, E. Crosbie, P. A. Bañaga, G. Betito, R. A. Braun, Z. M. Cainglet, M. O. Cambaliza, M. T. Cruz, J. M. Dado, M. R. A. Hilario, G. F. Leung, A. B. MacDonald, A. M. Magnaye, J. Reid, C. Robinson, M. A. Shook, J. B. Simpas, S. M. Visaga, E. Winstead, L. Ziemba and A. Sorooshian, Total organic carbon and the contribution from speciated organics in cloud water: airborne data analysis from the CAMP2Ex field campaign, Atmos. Chem. Phys., 2021, 21, 14109–14129 CrossRef CAS.
- S. Kirschler, C. Voigt, B. Anderson, R. Campos Braga, G. Chen, A. F. Corral, E. Crosbie, H. Dadashazar, R. F. Ferrare, V. Hahn, J. Hendricks, S. Kaufmann, R. Moore, M. L. Pöhlker, C. Robinson, A. J. Scarino, D. Schollmayer, M. A. Shook, K. L. Thornhill, E. Winstead, L. D. Ziemba and A. Sorooshian, Seasonal updraft speeds change cloud droplet number concentrations in low level clouds over the Western North Atlantic, Atmospheric Chemistry and Physics Discussions, 2022, 1–32, DOI:10.5194/acp-2022-171.
- A. F. Corral, Y. Choi, E. Crosbie, H. Dadashazar, J. P. DiGangi, G. S. Diskin, M. Fenn, D. B. Harper, S. Kirschler, H. Liu, R. H. Moore, J. B. Nowak, A. J. Scarino, S. Seaman, T. Shingler, M. A. Shook, K. L. Thornhill, C. Voigt, B. Zhang, L. D. Ziemba and A. Sorooshian, Cold Air Outbreaks Promote New Particle Formation Off the U.S. East Coast, Geophys. Res. Lett., 2022, 49, e2021GL096073 CrossRef.
- H. Dadashazar, M. Alipanah, M. R. A. Hilario, E. Crosbie, S. Kirschler, H. Liu, R. H. Moore, A. J. Peters, A. J. Scarino, M. Shook, K. L. Thornhill, C. Voigt, H. Wang, E. Winstead, B. Zhang, L. Ziemba and A. Sorooshian, Aerosol responses to precipitation along North American air trajectories arriving at Bermuda, Atmos. Chem. Phys., 2021, 21, 16121–16141 CrossRef CAS PubMed.
- A. H. Mardi, H. Dadashazar, D. Painemal, T. Shingler, S. T. Seaman, M. A. Fenn, C. A. Hostetler and A. Sorooshian, Biomass Burning Over the United States East Coast and Western North Atlantic Ocean: Implications for Clouds and Air Quality, J. Geophys. Res.: Atmos., 2021, 126, e2021JD034916 Search PubMed.
- L. Ma, H. Dadashazar, M. R. A. Hilario, M. O. Cambaliza, G. R. Lorenzo, J. B. Simpas, P. Nguyen and A. Sorooshian, Contrasting wet deposition composition between three diverse islands and coastal North American sites, Atmos. Environ., 2021, 244, 117919 CrossRef CAS PubMed.
- M. AzadiAghdam, R. A. Braun, E.-L. Edwards, P. A. Bañaga, M. T. Cruz, G. Betito, M. O. Cambaliza, H. Dadashazar, G. R. Lorenzo and L. Ma, On the nature of sea salt aerosol at a coastal megacity: Insights from Manila, Philippines in Southeast Asia, Atmos. Environ., 2019, 216, 116922 CrossRef CAS.
- R. A. Braun, H. Dadashazar, A. B. MacDonald, E. Crosbie, H. H. Jonsson, R. K. Woods, R. C. Flagan, J. H. Seinfeld and A. Sorooshian, Cloud Adiabaticity and Its Relationship to Marine Stratocumulus Characteristics Over the Northeast Pacific Ocean, J. Geophys. Res.: Atmos., 2018, 123(13), 13790–13806 Search PubMed.
- G. Prabhakar, B. Ervens, Z. Wang, L. C. Maudlin, M. M. Coggon, H. H. Jonsson, J. H. Seinfeld and A. Sorooshian, Sources of nitrate in stratocumulus cloud water: Airborne measurements during the 2011 E-PEACE and 2013 NiCE studies, Atmos. Environ., 2014, 97, 166–173 CrossRef CAS.
- H. Dadashazar, R. A. Braun, E. Crosbie, P. Y. Chuang, R. K. Woods, H. H. Jonsson and A. Sorooshian, Aerosol characteristics in the entrainment interface layer in relation to the marine boundary layer and free troposphere, Atmos. Chem. Phys., 2018, 18, 1495–1506 CrossRef CAS.
- E. R. Lewis and S. E. Schwartz, Sea Salt Aerosol Production: Mechanisms, Methods, Measurements and Models, American Geophysical Union, Washington, DC, 2004 Search PubMed.
- L. Jaeglé, P. K. Quinn, T. S. Bates, B. Alexander and J. T. Lin, Global distribution of sea salt aerosols: new constraints from in situ and remote sensing observations, Atmos. Chem. Phys., 2011, 11, 3137–3157 CrossRef.
- P. Zieger, O. Väisänen, J. C. Corbin, D. G. Partridge, S. Bastelberger, M. Mousavi-Fard, B. Rosati, M. Gysel, U. K. Krieger and C. Leck, Revising the hygroscopicity of inorganic sea salt particles, Nat. Commun., 2017, 8, 1–10 CrossRef PubMed.
- J. S. Schlosser, H. Dadashazar, E. L. Edwards, A. Hossein Mardi, G. Prabhakar, C. Stahl, H. H. Jonsson and A. Sorooshian, Relationships between supermicrometer sea salt aerosol and marine boundary layer conditions: insights from repeated identical flight patterns, J. Geophys. Res.: Atmos., 2020, 125, e2019JD032346 Search PubMed.
- A. B. MacDonald, H. Dadashazar, P. Y. Chuang, E. Crosbie, H. Wang, Z. Wang, H. H. Jonsson, R. C. Flagan, J. H. Seinfeld and A. Sorooshian, Characteristic vertical profiles of cloud water composition in marine stratocumulus clouds and relationships with precipitation, J. Geophys. Res.: Atmos., 2018, 123, 3704–3723 CrossRef PubMed.
- R. L. Modini, A. A. Frossard, L. Ahlm, L. M. Russell, C. E. Corrigan, G. C. Roberts, L. N. Hawkins, J. C. Schroder, A. K. Bertram, R. Zhao, A. K. Y. Lee, J. P. D. Abbatt, J. Lin, A. Nenes, Z. Wang, A. Wonaschütz, A. Sorooshian, K. J. Noone, H. Jonsson, J. H. Seinfeld, D. Toom-Sauntry, A. M. Macdonald and W. R. Leaitch, Primary marine aerosol-cloud interactions off the coast of California, J. Geophys. Res.: Atmos., 2015, 120, 4282–4303 CrossRef.
- A. M. Aldhaif, D. H. Lopez, H. Dadashazar, D. Painemal, A. J. Peters and A. Sorooshian, An aerosol climatology and implications for clouds at a remote marine site: Case study over Bermuda, J. Geophys. Res.: Atmos., 2021, 126, e2020JD034038 Search PubMed.
- A. F. Corral, R. A. Braun, B. Cairns, V. A. Gorooh, H. Liu, L. Ma, A. H. Mardi, D. Painemal, S. Stamnes, B. van Diedenhoven, H. Wang, Y. Yang, B. Zhang and A. Sorooshian, An overview of atmospheric features over the western North Atlantic Ocean and North American East Coast – Part 1: Analysis of aerosols, gases, and wet deposition chemistry, J. Geophys. Res.: Atmos., 2021, 126, e2020JD032592 Search PubMed.
- S. M. Kreidenweis and A. Asa-Awuku, in Treatise on Geochemistry, ed. H. D. Holland and K. K. Turekian, Elsevier, Oxford, 2nd edn, 2014, pp. 331–361 Search PubMed.
- G. Feingold, A. McComiskey, D. Rosenfeld and A. Sorooshian, On the relationship between cloud contact time and precipitation susceptibility to aerosol, J. Geophys. Res.: Atmos., 2013, 118(10), 10544–10554 CrossRef.
- Y. C. Chen, M. W. Christensen, L. Xue, A. Sorooshian, G. L. Stephens, R. M. Rasmussen and J. H. Seinfeld, Occurrence of lower cloud albedo in ship tracks, Atmos. Chem. Phys., 2012, 12, 8223–8235 CrossRef CAS.
- L. Maudlin, Z. Wang, H. Jonsson and A. Sorooshian, Impact of wildfires on size-resolved aerosol composition at a coastal California site, Atmos. Environ., 2015, 119, 59–68 CrossRef CAS.
- A. Sorooshian, B. Anderson, S. E. Bauer, R. A. Braun, B. Cairns, E. Crosbie, H. Dadashazar, G. Diskin, R. Ferrare and R. C. Flagan, Aerosol–cloud–meteorology interaction airborne field investigations: Using lessons learned from the US West coast in the design of ACTIVATE off the US East Coast, Bull. Am. Meteorol. Soc., 2019, 100, 1511–1528 Search PubMed.
- D. Painemal, A. F. Corral, A. Sorooshian, M. A. Brunke, S. Chellappan, V. Afzali Gorooh, S.-H. Ham, L. O'Neill, W. L. Smith Jr, G. Tselioudis, H. Wang, X. Zeng and P. Zuidema, An Overview of Atmospheric Features Over the Western North Atlantic Ocean and North American East Coast—Part 2: Circulation, Boundary Layer, and Clouds, J. Geophys. Res.: Atmos., 2021, 126, e2020JD033423 Search PubMed.
- H. Dadashazar, D. Painemal, M. Alipanah, M. Brunke, S. Chellappan, A. F. Corral, E. Crosbie, S. Kirschler, H. Liu, R. H. Moore, C. Robinson, A. J. Scarino, M. Shook, K. Sinclair, K. L. Thornhill, C. Voigt, H. Wang, E. Winstead, X. Zeng, L. Ziemba, P. Zuidema and A. Sorooshian, Cloud drop number concentrations over the western North Atlantic Ocean: seasonal cycle, aerosol interrelationships, and other influential factors, Atmos. Chem. Phys., 2021, 21, 10499–10526 CrossRef CAS PubMed.
- R. A. Braun, H. Dadashazar, A. B. MacDonald, A. M. Aldhaif, L. C. Maudlin, E. Crosbie, M. A. Aghdam, A. Hossein Mardi and A. Sorooshian, Impact of wildfire emissions on chloride and bromide depletion in marine aerosol particles, Environ. Sci. Technol., 2017, 51, 9013–9021 CrossRef CAS PubMed.
- M. Mozurkewich, Mechanisms for the release of halogens from sea-salt particles by free radical reactions, J. Geophys. Res.: Atmos., 1995, 100, 14199–14207 CrossRef.
- L. Jaeglé, P. Quinn, T. Bates, B. Alexander and J.-T. Lin, Global distribution of sea salt aerosols: new constraints from in situ and remote sensing observations, Atmos. Chem. Phys., 2011, 11, 3137 CrossRef.
- M. E. Salter, P. Zieger, J. C. Acosta Navarro, H. Grythe, A. Kirkevåg, B. Rosati, I. Riipinen and E. D. Nilsson, An empirically derived inorganic sea spray source function incorporating sea surface temperature, Atmos. Chem. Phys., 2015, 15, 11047–11066 CrossRef CAS.
- L. Lenain and W. K. Melville, Evidence of Sea-State Dependence of Aerosol Concentration in the Marine Atmospheric Boundary Layer, J. Phys. Oceanogr., 2017, 47, 69–84 Search PubMed.
- D. Zhao and Y. Toba, Dependence of Whitecap Coverage on Wind and Wind-Wave Properties, J. Oceanogr., 2001, 57, 603–616 CrossRef.
- E. C. Monahan, D. E. Spiel and K. L. Davidson, in Oceanic Whitecaps: and Their Role in Air-Sea Exchange Processes, ed. E. C. Monahan and G. M. Niocaill, Springer Netherlands, Dordrecht, 1986, pp. 167–174, DOI:10.1007/978-94-009-4668-2_16.
- M. Stramska and T. Petelski, Observations of oceanic whitecaps in the north polar waters of the Atlantic, J. Geophys. Res.: Oceans, 2003, 108, 3086 CrossRef.
- M. T. Dana and J. M. Hales, Statistical aspects of the washout of polydisperse aerosols, Atmos. Environ., 1976, 10, 45–50 CrossRef.
- A. Skartveit, Wet scavenging of sea-salts and acid compounds in a rainy, coastal area, Atmos. Environ., 1982, 16, 2715–2724 CrossRef CAS.
- J. Wu, Wind-induced drift currents, J. Fluid Mech., 1975, 68, 49–70 CrossRef.
- M. Sofiev, J. Soares, M. Prank, G. de Leeuw and J. Kukkonen, A regional-to-global model of emission and transport of sea salt particles in the atmosphere, J. Geophys. Res.: Atmos., 2011, 116, D21302 CrossRef.
- J. Zábori, M. Matisāns, R. Krejci, E. D. Nilsson and J. Ström, Artificial primary marine aerosol production: a laboratory study with varying water temperature, salinity, and succinic acid concentration, Atmos. Chem. Phys., 2012, 12, 10709–10724 CrossRef.
- E. L. Andreas, A New Sea Spray Generation Function for Wind Speeds up to 32 m s−1, J. Phys. Oceanogr., 1998, 28, 2175–2184 CrossRef.
- F. Veron, C. Hopkins, E. L. Harrison and J. A. Mueller, Sea spray spume droplet production in high wind speeds, Geophys. Res. Lett., 2012, 39, L16602 CrossRef.
- F. Veron, Ocean Spray, Annu. Rev. Fluid Mech., 2015, 47, 507–538 CrossRef.
- F. Hoffmann and G. Feingold, Cloud Microphysical Implications for Marine Cloud Brightening: The Importance of the Seeded Particle Size Distribution, J. Atmos. Sci., 2021, 78, 3247–3262 Search PubMed.
Footnote |
| † Electronic supplementary information (ESI) available. See https://doi.org/10.1039/d2ea00049k |
| This journal is © The Royal Society of Chemistry 2022 |