 Open Access Article
Creative Commons Attribution 3.0 Unported Licence
Single particle measurements of mixing between mimics for biomass burning and aged secondary organic aerosols†
Luke
Habib
 and
Neil
Donahue
 *
*
Chemical Engineering Department, Carnegie Mellon University, 5000 Forbes Avenue, Pittsburgh, Pennsylvania 15213, USA. E-mail: nmd@andrew.cmu.edu
First published on 30th May 2022
Abstract
Gas-phase exchange between aerosol populations via evaporation and condensation of semi-volatile organics can be a major mechanism of mixing between accumulation-mode particles with slow coagulation. This exchange may be impeded in highly viscous, semi-solid, or glassy particles due to diffusion limitations. Here we describe experiments on carefully prepared particle populations representing highly viscous or potentially “glassy” aged organic particles (non-volatile sugars 13C-glucose, sucrose, and raffinose with ammonium sulfate seeds) and fresh biomass burning particles (erythritol with black carbon seeds) to develop a model phase space for organic aerosol systems and better understand when particle phase state impedes mixing. Our hypothesis is that these limitations are alleviated at some relative humidity threshold, which increases with decreasing ambient temperatures. We quantify the mixing state of these particle populations from 10–25 °C and 5–90% RH using an Aerosol Mass Spectrometer (AMS) combining Event Trigger (ET) and Soot Particle (SP) modes. The observed single particle mass spectra are aggregated in short time slices and used to perform a linear combination of relevant reference spectra to determine the contributions each constituent has on the resulting particle signal. Our results suggest that the non-volatile sugar particles have little to no diffusive limitations to mixing at the conditions tested.
Environmental significanceDiffusion of compounds into or within atmospheric particles can be important for several reasons. It can control oxidation rates and the replenishment of aged surfaces. It can also control the rates with which semi-volatile aerosols interact with each other to evolve from external mixtures of distinct particles into internal mixtures of indistinguishable particles. Studies have rarely assessed diffusion into sub-micron aerosol particles directly, however. The experiments we describe here accomplish this via single-particle aerosol mass spectroscopy on well controlled particles that are models for fresh biomass smoke (erythritol coating black carbon) and aged background particles (glucose, sucrose, and raffinose coating ammonium sulfate). Directly observing whether or not particle populations mix at certain conditions enables us to confidently describe conditions where internal mixtures will or will not be able to form rapidly in the real atmosphere. |
Introduction
Aerosol mixing state influences important properties such as the number of cloud condensation nuclei in an airmass,1 and many transport models assume either that all aerosols of a given size form a so-called internal mixture, with identical composition and properties, or that aerosols remain in one of several different populations or modes, forming a quasi-static external mixture. However, there is considerable evidence that mixing state will evolve from a high degree of external mixing near sources to a much more homogeneous internal mixture downwind of sources.1,2 This can be driven by a uniform coating of secondary compounds (i.e. ammonium sulfate, ammonium nitrate, and secondary organic aerosol) but also by exchange of semi-volatile organics via so-called Marcolli mixing.3–8 This may lead to a situation where aerosols consist of externally mixed cores with unique sources coated by internally mixed shells with numerous, homogenized sources.In order to completely understand how aerosols affect climate forcing and human health, it is necessary to understand their composition and, therefore, their mixing state; uncertainty in particle composition directly contributes to uncertainty in their effects on health and the environment. Despite the importance of understanding their composition and effects, aerosols remain a highly uncertain and poorly understood aspect of anthropogenic climate forcing and much of our focus on their human health effects centers around particle size rather than composition.9–18 Here we shall explore one aspect of this – mixing and potential diffusive limitations of distinct aerosol populations – using model systems to represent the interaction of fresh biomass burning emissions with aged background aerosols.
Wildfires occur in many countries across the globe every year, contributing biomass burning particles to local aerosol populations. Further, since the start of the century, the frequency of large highly destructive fires has increased. Wildfires may constitute a positive feedback loop with climate change; the soot particles released in the smoke from these fires exert a positive climate forcing, exacerbating the warmer and drier climate in arid, fire-prone regions, resulting in more destructive and more frequent wildfires.19 In California in the western United States, nine of the top ten most destructive fires, as well as the top ten largest fires, in the state's history have happened in the last 20 years; five of the top ten largest fires in California's history took place in 2020. The 2018 California wildfire season was the most destructive season on record, with the Camp Fire becoming the most destructive Californian fire in history and the most expensive natural disaster worldwide in 2018.20 Australian wildfires have been comparably severe over the past several years.21–23
Particles released in these wildfires are primarily composed of black carbon soot and a complex mix of organic compounds. They eventually combine with the ambient aerosol population. Aged ambient aerosol populations typically include a complex mixture of organic compounds24–27 called “Low-Volatility Organic Aerosol”, LVOOA;28 this can become highly viscous, even semi-solid or glassy, under ambient conditions.25,29,30 After these populations interact, the evolving mixing state of the fresh biomass burning and the aged glassy aerosol populations has implications for climate change, human health, and how scientists model the atmosphere and make predictions relevant to those effects.25,29–45
It has often been assumed that the organic material in secondary organic aerosol is relatively easy to diffuse through. However, studies have shown that organic aerosol particles can become highly viscous and glassy even at room temperature and over a wide relative humidity range. Diffusion limitations at the surface of atmospheric particles could inhibit particle oxidation and aging, condensational growth, and exchange of semi-volatile organics. However, these possible diffusion limitations are often inferred based on indirect measures (bounce, viscosity, etc.), relying on estimated diffusivity, often via the Stokes–Einstein relation.29–45
If important processes are inhibited or diffusion limited under ambient conditions, many of the commonly held assumptions that simplify how we model aerosol effects on climate and health could be challenged.29–45 If internal mixtures do tend to form, gas-phase exchange of their semi-volatile organic compounds must occur on the timescale of hours;27 thus, those molecules need to diffuse into the particle phase in the same timescale. For 100 nm particles, this corresponds to a diffusion coefficient 10−15 < D < 10−14 cm2 s−1.38 Rather than calculating diffusivity, as in previous studies,31–45 we observe mixing between particle populations directly. This choice makes it possible to observe conditions where the phase state or viscosity of our organic fractions inhibit mixing between the particle populations, if those conditions exist within our experimental ranges.
Experimental
Experimental design
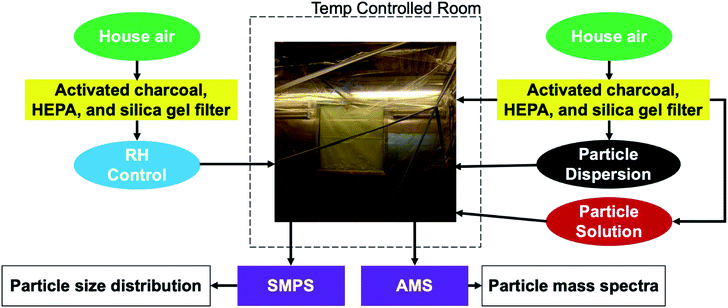
We conduct experiments in a 10 m3 Teflon smog chamber with temperature and relative humidity control, depicted in Fig. 1.46,47 The chamber temperature is controlled by an isolated HVAC system with temperatures ranging from 10 °C to 40 °C. The chamber can also be humidified by passing air through a three necked flask filled partially with filtered, deionized water, heated to 70 °C by a hot water bath, and ultimately into the chamber. The chamber can be humidified to 80 to 90% RH in a few hours. Here we established all chamber conditions (i.e. temperature and relative humidity) before injecting any particles. Temperature was either 20 °C or 10 °C. RH within the chamber was either very low (2–5%) or high (∼90%).Particles consisting of black carbon cores coated with erythritol (Sigma-Aldrich, ≥99%) are generated by diluting a concentrated liquid dispersion of Aquadag (graphene) (SEMicro; Conductive Graphene Carbon Paint, 5–15% graphite content), to obtain an approximate graphene-to-water ratio of 2 g L; in our case 6 grams of Aquadag diluted into 300 mL of water. Then, we add 0.6 grams of erythritol to the dispersion so that concentration is also 2 g L−1. Similarly, particles consisting of ammonium sulfate (Sigma-Aldrich, ≥99%) and various non-volatile sugars (D-glucose-13C6: Sigma-Aldrich, ≥99 atom % 13C, ≥99%; sucrose: Sigma-Aldrich ≥99.5%; D-(+)raffinose pentahydrate: Sigma-Aldrich ≥98%) are generated by mixing 0.6 grams of ammonium sulfate as well as the desired sugar into 300 mL of water to achieve a 2 g L−1 aqueous solution (for both components). We assume that during the drying phase these assume a core–shell morphology, but as O![[thin space (1/6-em)]](https://www.rsc.org/images/entities/char_2009.gif) :
:![[thin space (1/6-em)]](https://www.rsc.org/images/entities/char_2009.gif) C > 0.8, at high RH they likely form a single liquid phase.48 We inject the particle populations into the chamber using a TSI Aerosol Generator 3076 atomizer, connected to an airline from a clean air generator (aadco Instruments, 737 series) at 20 psi. The particles pass through a diffusion drier to remove most of the water and then flow into the chamber.
C > 0.8, at high RH they likely form a single liquid phase.48 We inject the particle populations into the chamber using a TSI Aerosol Generator 3076 atomizer, connected to an airline from a clean air generator (aadco Instruments, 737 series) at 20 psi. The particles pass through a diffusion drier to remove most of the water and then flow into the chamber.
After we generate and inject particles, a Scanning Mobility Particle Sizer (SMPS) (TSI) evaluates the size distribution of the chamber particle population(s) and a Soot Particle Aerosol Mass Spectrometer (SP-AMS) (Aerodyne) captures the particle mass spectra. The TSI SMPS is a combination of the TSI Electrostatic Classifier 3082 and TSI Condensational Particle Counter 3775. The SP-AMS is a combination of the Aerodyne Aerosol Mass Spectrometer (AMS) and the Droplet Measurement Technologies Single Particle Soot Photometer (SP2). We use the Event Trigger (ET) mode of the AMS to observe individual particles. This enables us to track composition changes of the two particle populations over the course of the experiment. The AMS vaporizes particles with both a high-intensity IR soot-particle laser and a tungsten vaporizer heated to 600 °C. The Soot Particle (SP) mode makes it possible to observe refractory light-absorbing species such as black carbon. Whenever we collected data in the ET mode, the SP laser and tungsten filament were used simultaneously.
Employing the ET and SP modes, we analyze sugar particles with distinct non-volatile cores to mimic two major classes of atmospheric aerosol populations: particles with erythritol coating black carbon cores represent fresh biomass burning aerosol,49–51 and particles with various effectively non-volatile sugars coating ammonium sulfate represent aged, ambient, highly viscous and potentially glassy, SOA (LV-OOA).28 We are thus modeling the interaction of fresh smoke plumes with aged background airmasses, to test the speed with which the coatings can evolve from a fully external mixture towards an internal mixture.
Because of the ambiguity associated with the term “mixing”, we shall use “combination” to describe dispersing two distinct particle populations within a single volume (in this case our chamber) to form an “external mixture” and reserve “mixing” to refer to the exchange of constituents among populations and so within individual particles, and thus the evolution toward an “internal mixture”. Note that the degree of mixing will depend on the constituents in question. In our case (because of negligible coagulation) the non-volatile particle cores will never mix, but the organic shells will at least have the potential to mix. This also means that the definition of “mixing state” can depend strongly on the constituents under study and the instrumentation employed. We are using the non-volatile and distinct nature of our chosen core materials as a tag, and then investigating the mixing of the coatings.
Model particle selection
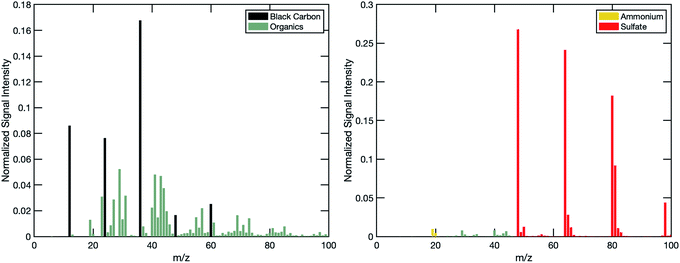
By using distinct particle cores, including black carbon, we take full advantage of the ET and SP modes of the AMS. The ET mode of the AMS collects single-particle data only when the signal from an individual particle event is above a selected ion trigger threshold in one or more user-selected m/z regions of interest. Thus, because we know which core each sugar is on when it is injected into the chamber, and because we keep particle concentrations low enough to avoid coagulation as a major mechanism of particle mixing, we can track composition changes in each of the particle populations by triggering at m/z values that are selective of and specific to the distinct particle cores. For the black carbon cores, we chose two regions of interest at m/z = 12 or 24 (C+ and C2+), meaning any event with cumulative signal at m/z = 12 and 24 above the ion threshold will trigger the AMS to save a single-particle mass spectrum. For the ammonium sulfate cores we chose m/z = 64 (SO2+). The spectra shown in Fig. 2 demonstrate the specificity and selectivity of the m/z ratios we chose.Additionally, we designed the experiment with one population (an aged mimic) including a non-volatile sugar fraction and the other (a fresh mimic) including a semi-volatile sugar fraction. We can specifically track mixing into one population from the other, without expecting any mixing in the opposite direction. Thus, we are only tracking mixing, and any potential mixing limitations, into the non-volatile sugar populations. Using two distinct sugars, we can also be quite sure that if we encounter any mixing limitations between the particle populations, they would be due to diffusion and not miscibility.
Data analysis
Once we have collected single-particle data, the mass spectra are further processed, filtered (for false positive or non-particle events), and sorted into categories based on their composition, notably their core composition. We first filter out obvious false positive and/or non-particle events by plotting the total event ion signal against the particle time-of-flight in the AMS. We then split the remaining event signals into three categories based on the seed type: one of the two known cores, or indeterminate. The indeterminate category includes any coagulated particles as well as any other “junk” signals and typically comprises less than 1% of the total filtered events. We then co-add signals from individual particles in the two core categories over a pre-determined time range (typically 10 minutes) to obtain an aggregated spectrum with sufficient signal-to-noise to analyze for composition. Using reference bulk mass spectra of the individual components constituting the particle population, we calculate a linear combination of those components to determine the fractional composition for the two populations over the course of the experiment. We do this by conducting a regression on the observed particle spectra and the reference spectra of the components as in eqn (1):| A1 × Mnv sugar + A2 × Mammounium sulfate + A3 × Merythritol + A4 × Mblack carbon = Mobserved | (1) |
Results and discussion
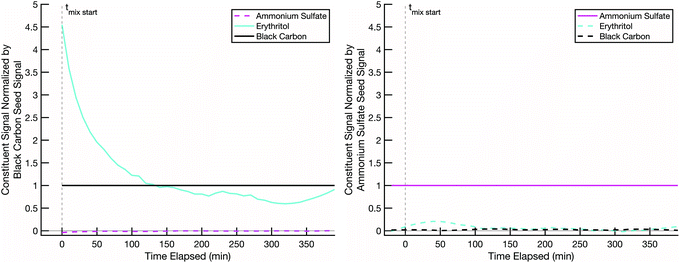
Our hypothesis is that when we combine two particle populations containing sugars coating non-volatile cores, and at least one sugar is volatile enough to sustain an appreciable vapor pressure, that sugar will mix into the opposite population unless diffusion into that opposite population is prohibitively slow. In thermodynamic terms we assume that the activity coefficients of the two sugars are near 1 in each other, that they start with an activity of 0 in the opposing populations, and that the gas-phase activity will also rise toward 1 with sufficient total burden to drive significant absorption into the opposing particle types. However, adsorption onto opposing particles (rather than adsorption into the coatings) is a potentially confounding effect.In order to ensure that mixing, or its absence, is due to diffusion limitations in the non-volatile sugar fraction of the “SOA” particles, it is important to confirm that our semi-volatile sugar, erythritol, will not readily adsorb onto bare ammonium sulfate particles. To test this, we conducted a mixing experiment with an erythritol/black-carbon particle population and a bare ammonium sulfate particle population at room temperature (∼20 °C) and low relative humidity (∼1–5%). The results in Fig. 4 show that erythritol evaporates from the black carbon particles, resulting in a dramatic drop in its signal relative to the black carbon signal over the course of the experiment, but without any significant increase in erythritol signal on the ammonium sulfate particles. There is a small increase in erythritol that reaches a maximum near 20% of the ammonium sulfate signal some 50 minutes after mixing; however, this small and short-lived signal is likely due either to experimental noise or a small amount of erythritol briefly condensing onto the ammonium sulfate. This confirms that erythritol is semi-volatile but also that it does not diffuse into ammonium sulfate readily, and therefore if erythritol signal appears significantly in the mass spectra of a non-volatile sugar/ammonium sulfate particle population, it must be due to erythritol absorption into the non-volatile sugar fraction of those particles.
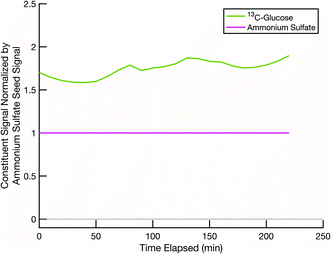
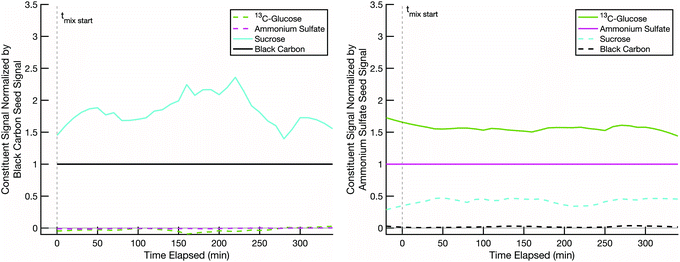
A second test is to confirm that, in a scenario where mixing is not expected, such as two cores coated by two effectively non-volatile sugars rather than semi-volatile erythritol, the resulting particle compositions remain distinct (with no mixing) and constant over the course of an experiment. This tests our ability to deconvolve potentially similar mass spectra from two sugars. Even when we use isotopically labelled sugars, but especially when we do not, there could be overlap between the sugar mass spectra on the distinct seeds. Thus, it is important to confirm that our data analysis method can sufficiently distinguish between two organic fractions of the particle populations, not just the seeds. In Fig. 5 we show data from an experiment conducted at room temperature and low relative humidity with sucrose coating black carbon cores and 13C-glucose coating ammonium sulfate cores. Over the course of a few hours, the signals of the original coating sugars on the two seeds remain relatively constant, and there are no signs of mixing between these two non-volatile sugar populations. However, there is some crosstalk, with a spurious but constant sucrose signal detected in the ammonium sulfate population.
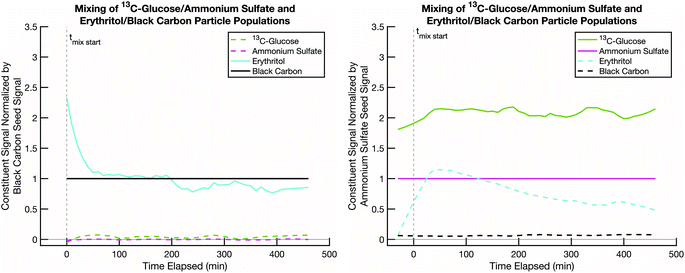
We next present a mixing experiment between semi-volatile erythritol and effectively non-volatile 13C-glucose. This is a proxy for “fresh” biomass burning smoke (erythritol on black carbon) and “aged” background SOA (LV-OOA; glucose on ammonium sulfate). Various estimates of the glass transition behavior of glucose suggest that its glass transition temperature, Tg, is typically at or below room temperature, depending on the water content in the sugar and relative humidity of the environment.52Tg is often used as a proxy for viscosity, which is related to diffusivity via relations such as Stokes–Einstein, and it is argued that for T < Tg, diffusive mixing can be extremely slow even in 100 nm diameter particles.29–45Fig. 6 shows rapid uptake of erythritol into glucose at room temperature and low relative humidity. Very shortly after the erythritol/black-carbon particles are injected (t = 0), the erythritol signal begins to decline on that particle population and increase on the 13C-glucose/ammonium-sulfate population. Less than 100 minutes after combination, the erythritol signal stabilizes in the 13C-glucose/ammonium-sulfate particles at a higher fractional composition than the ammonium sulfate. From this we conclude that diffusive mixing of erythritol into glucose is uninhibited under these conditions.
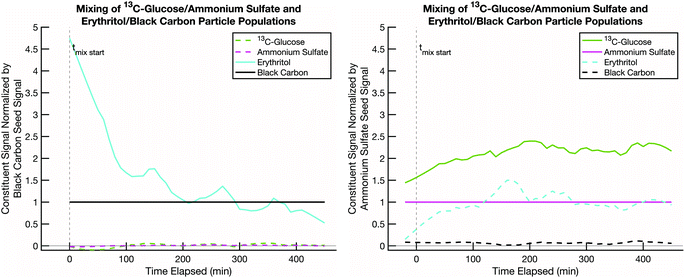
The next step is to lower the temperature, which could vitrify the glucose. In Fig. 7 we show data from an erythritol – glucose mixing experiment at low RH and ∼10 °C, where we expect T < Tg. Erythritol still evaporates from the black-carbon cores (at roughly half the rate, taking 200–300 min), and even though we expect the particles to be highly viscous, and potentially glassy, erythritol evaporation is followed by absorption into the glucose coating. This suggests that mixing was not greatly inhibited, if at all. There are a few possible explanations. First, 13C-glucose coatings in our smog chamber may not be dry enough to result in vitrification even at these temperatures; though the chamber was at low RH, the particles were created by nebulizing droplets and then passing them through a diffusion drier. Second, because erythritol and glucose are miscible, erythritol might condense onto the surface of the glucose and act as a plasticizer (as water does)53 and locally decrease Tg sufficiently to allow more erythritol to diffuse into the evolving mixture. There are a number of studies demonstrating how smaller organic molecules can diffuse into highly viscous organic material more rapidly than diffusion models estimate (i.e., Stokes–Einstein relation) and reduce the local viscosity.54–56 Third, it is possible that the ammonium sulfate prevents vitrification; because sulfuric acid and organics condense together to ambient particles, this would likely occur in the atmosphere as well. There is evidence in existing literature that organic–inorganic particle material mixtures can reduce viscosity of the particles compared to pure organic particles by 2 or more orders of magnitude.57
The mixing at 10 °C and low RH is slower than at 20 °C. This could be due to slower evaporation, or it could be a sign of emerging diffusion limitations. Fig. 8 thus shows the mixing behavior of this sugar system is at 10 °C and high RH, where the glucose should be less viscous. In this experiment, we mixed the 13C-glucose and erythritol particle populations at ∼10 °C and 90% RH. If there were any mixing limitations before, we would see enhanced mixing in this case, which could be represented by faster uptake into the 13C-glucose coatings or higher steady state erythritol signal in the 13C-glucose coatings at the end of the experiment. However, there are no striking differences between the low RH and high RH experiments. This suggests that there truly are no barriers to mixing at any relative humidity at the temperatures we studied for the erythritol – glucose system.
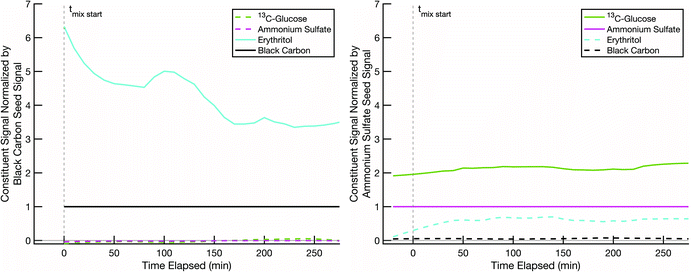
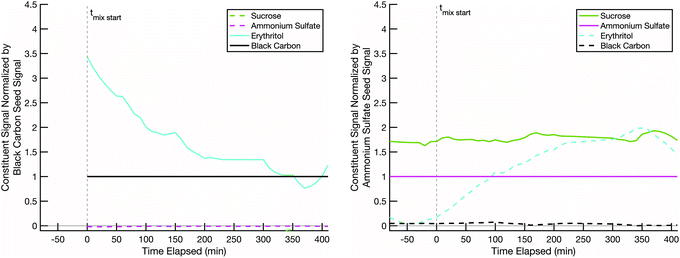
In pursuit of vitrification, we thus expanded our non-volatile sugar coating to di- and tri-saccharides. In Fig. 9 we show a mixing experiment for erythritol and sucrose, a C12 disaccharide consisting of glucose and fructose units. Pure sucrose has well described glass transition behavior showing a glass transition significantly above room temperature, somewhere between 50–80 °C, depending on the conditions of the test.52,58 We did not use isotopically labelled sucrose, but we were still able to distinguish between the sugar fractions in the two particle populations. This experiment was conducted again at low RH and ∼10 °C. The erythritol evaporation rate was again consistent with the rate in the colder temperature glucose – erythritol experiments, but those erythritol vapors were still able to condense readily onto and diffuse into the sucrose coatings, comprising roughly half of the sugar signal after 240 min or so. The glass transition temperature for sucrose is higher than for glucose. Existing data suggest that at this temperature and in dry conditions, sucrose would normally exist as a solid glass.52,58 In spite of this, we still observe rapid, relatively uninhibited diffusion of erythritol into sucrose at 10 °C and low RH.
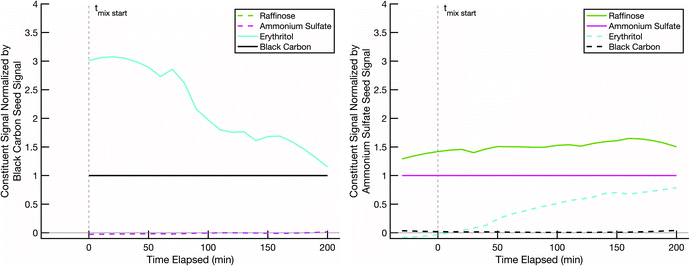
The final non-volatile sugar we tested was raffinose, a C18 trisaccharide consisting of glucose, galactose, and fructose units, also not isotopically labelled. Pure raffinose has an even higher glass transition temperature than sucrose, around 100 °C.59 The experiment shown in Fig. 10 was conducted at 10 °C and low RH. The erythritol evaporated from the black-carbon population at a rate consistent with the other experiments conducted at 10 °C. Erythritol uptake into the raffinose may be slightly slower than into sucrose or glucose under the same conditions, but it is by no means halted; after 200 min the coating over the ammonium sulfate cores is roughly 1/3 erythritol and 2/3 raffinose, which strongly suggests that the erythritol is able to diffuse into the pre-existing raffinose coating without prohibitive diffusion limitations.
The initial rapid evaporation of erythritol from the black carbon seeds, subsequent uptake and stabilization into the non-volatile sugar/ammonium sulfate particles, which was sometimes followed by the slow steady decline in the signal for the rest of the experiment is consistent with other modelled and measured mixing behavior between organic particle fractions published in relevant literature.60–62 Based on the particle surface area condensation sinks (available in the ESI†) compared to the collision frequency of vapors to the chamber walls (approximately 15–20 minutes for our system), our results indicate that we are observing evolution towards an internal mixtures in each of the experiments discussed here.
Conclusions
We examined the mixing behavior of various non-volatile sugars in the particle phase when combined with a population coated by a semi-volatile sugar, erythritol. Despite glass transition data for the non-volatile sugars suggesting that they would behave like a glass for some of the conditions we tested, we never observed substantial limitations to mixing within our defined mixing timeline on the order of hours. These results demonstrate the importance of probing particle behavior directly wherever possible, rather than relying solely on proxy properties, such as viscosity or an estimated diffusivity, to draw conclusions about particle behavior. Our observations indicate that these sugars either do not actually exist as glasses or highly viscous at the expected conditions in the particle phase or that they were plasticized by the erythritol, ammonium sulfate, and/or water vapor in the chamber. Directly comparing these results to diffusivity and viscosity measurements of the same components under the same conditions could further illuminate the mixing pathway for this system.Our methodology of ET-SP-AMS analysis allows us to identify characteristic black-carbon cores for biomass burning particles, and aged inorganic salt cores for background particles. If the model systems represent real-world wildfire smoke, these experiments suggest that when smoke plumes from wildfires encounter background aerosols, any semi-volatile constituents in those two populations are likely to interchange relatively quickly, without obvious inhibitions due to high viscosity or potentially glassy behavior. Real world biomass burning particles likely have a more complex mixture of organic material with a wide range of volatility and viscosity, which would certainly affect the progress towards an internal mixture between those particles and an ambient, aged particle population. Increasingly complex model systems will more closely approximate the behavior of real-world systems.
Author contributions
The manuscript was written through contributions of all authors. All authors have given approval to the final version of the manuscript.Conflicts of interest
There are no conflicts to declare.Acknowledgements
This research was funded by grant CHE-1807530 from the National Science Foundation. We are grateful to Kerrigan Cain, Brandon Lopez, Katia Liangou, and Lydia Jahl for help with the Aerosol Mass Spectrometer.Notes and references
- N. Riemer, A. P. Ault, M. West, R. L. Craig and J. H. Curtis, Rev. Geophys., 2019, 57, 187–249 CrossRef.
- Q. Ye, H. Z. Li, P. Gu, E. S. Robinson, J. S. Apte, R. C. Sullivan, A. L. Robinson, N. M. Donahue and A. A. Presto, Environ. Health Perspect., 2020, 128, 017009 CrossRef PubMed.
- C. Marcolli, B. P. Luo, T. Peter and F. G. Wienhold, Atmos. Chem. Phys., 2004, 4, 2593–2599 CrossRef CAS.
- E. S. Robinson, R. Saleh and N. M. Donahue, J. Phys. Chem. A, 2013, 117, 13935–13945 CrossRef CAS PubMed.
- E. S. Robinson, R. Saleh and N. M. Donahue, Environ. Sci. Technol., 2015, 49, 9724–9732 CrossRef CAS PubMed.
- E. S. Robinson, N. M. Donahue, A. T. Ahern, Q. Ye and E. Lipsky, Faraday Discuss., 2016, 189, 31–49 RSC.
- Q. Ye, E. S. Robinson, X. Ding, P. Ye, R. C. Sullivan and N. M. Donahue, Proc. Natl. Acad. Sci. U. S. A., 2016, 113, 12649–12654 CrossRef CAS PubMed.
- Q. Ye, M. A. Upshur, E. S. Robinson, F. M. Geiger, R. C. Sullivan, R. J. Thomson and N. M. Donahue, Chem, 2018, 4, 318–333 CAS.
- S. Solomon, Intergovernmental Panel on Climate Change. And Intergovernmental Panel on Climate Change. Working Group I., 2007 Search PubMed.
- F. R. Cassee, M. E. Héroux, M. E. Gerlofs-Nijland and F. J. Kelly, Inhalation Toxicol., 2013, 25, 802–812 CrossRef CAS PubMed.
- M. Lippmann, Crit. Rev. Toxicol., 2014, 44, 299–347 CrossRef CAS PubMed.
- F. J. Kelly and J. C. Fussell, Atmos. Environ., 2012, 60, 504–526 CrossRef CAS.
- Y. F. Xing, Y. H. Xu, M. H. Shi and Y. X. Lian, J. Thorac. Dis., 2016, 8, E69–E74 Search PubMed.
- R. Lozano, M. Naghavi, S. S. Lim, S. Y. Ahn MPH, M. B. Alvarado, K. G. Andrews MPH, C. B. Atkinson, I. A. Bolliger, D. B. Chou, K. E. Colson BA, A. B. Delossantos, S. D. Dharmaratne MBBS, A. D. Flaxman, R. Lozano, M. Naghavi, K. Foreman, S. Lim, K. Shibuya, V. Aboyans, J. Abraham, T. Adair, R. Aggarwal, S. Y. Ahn, M. A. AlMazroa, M. Alvarado, H. Ross Anderson, L. M. Anderson, K. G. Andrews, C. Atkinson, L. M. Baddour, S. Barker-Collo, D. H. Bartels, M. L. Bell, E. J. Benjamin, D. Bennett, K. Bhalla, B. Bikbov, A. bin Abdulhak, G. Birbeck, F. Blyth, I. Bolliger, S. ane Boufous, C. Bucello, M. Burch, P. Burney, J. Carapetis, H. Chen, D. Chou, S. S. Chugh, L. E. Coff eng, S. D. Colan, S. Colquhoun, K. Ellicott Colson, J. Condon, M. D. Connor, L. T. Cooper, M. Corriere, M. Cortinovis, K. Courville de Vaccaro, W. Couser, B. C. Cowie, M. H. Criqui, M. Cross, K. C. Dabhadkar, N. Dahodwala, D. de Leo, L. Degenhardt, A. Delossantos, J. Denenberg, D. C. des Jarlais, S. D. Dharmaratne, E. Ray Dorsey, T. Driscoll, H. Duber, B. Ebel, P. J. Erwin, P. Espindola, M. Ezzati, V. Feigin, A. D. Flaxman, M. H. Forouzanfar, F. R. Gerry Fowkes, R. Franklin, M. Fransen, M. K. Freeman, S. E. Gabriel, E. Gakidou, F. Gaspari, R. F. Gillum, D. Gonzalez-Medina, Y. A. Halasa, D. Haring, J. E. Harrison, R. Havmoeller, R. J. Hay, B. Hoen, P. J. Hotez, D. Hoy, K. H. Jacobsen, S. L. James, R. Jasrasaria, S. Jayaraman, N. Johns, G. Karthikeyan, N. Kassebaum, A. Keren, J.-P. Khoo, L. Marie Knowlton, O. Kobusingye, A. Koranteng, R. Krishnamurthi, M. Lipnick, S. E. Lipshultz, S. Lockett Ohno, J. Mabweijano, M. F. MacIntyre, L. Mallinger, L. March, G. B. Marks, R. Marks, A. Matsumori, R. Matzopoulos, B. M. Mayosi, J. H. McAnulty, M. M. McDermott, J. McGrath, Z. A. Memish, G. A. Mensah, T. R. Merriman, C. Michaud, M. Miller, T. R. Miller, C. Mock, A. Olga Mocumbi, A. A. Mokdad, A. Moran, K. Mulholland, M. Nathan Nair, L. Naldi, K. M. Venkat Narayan, K. Nasseri, P. Norman, S. B. Omer, K. Ortblad, R. Osborne, D. Ozgediz, B. Pahari, J. Durai Pandian, A. Panozo Rivero, R. Perez Padilla, F. Perez-Ruiz, N. Perico, D. Phillips, K. Pierce, C. Arden Pope III, E. Porrini, F. Pourmalek, M. Raju, D. Ranganathan, J. T. Rehm, D. B. Rein, G. Remuzzi, F. P. Rivara, T. Roberts, F. Rodriguez De León, L. C. Rosenfeld, L. Rushton, R. L. Sacco, J. A. Salomon, U. Sampson, E. Sanman, D. C. Schwebel, M. Segui-Gomez, D. S. Shepard, D. Singh, J. Singleton, K. Sliwa, E. Smith, A. Steer, J. A. Taylor, B. Thomas, I. M. Tleyjeh, J. A. rey Towbin, T. Truelsen, E. A. Undurraga, N. Venketasubramanian, L. Vijayakumar, T. Vos, G. R. Wagner, M. Wang, W. Wang, K. Watt, M. A. Weinstock, R. Weintraub, J. D. Wilkinson, A. D. Woolf, S. Wulf, P.-H. Yeh, P. Yip, A. Zabetian, Z.-J. Zheng, A. D. Lopez and C. J. L Murray, The Lancet, 2012, 380, 2095–2128 CrossRef.
- C. A. Pope, M. Ezzati and D. W. Dockery, N. Engl. J. Med., 2009, 360, 376–386 CrossRef CAS PubMed.
- K. S. Carslaw, H. Gordon, D. S. Hamilton, J. S. Johnson, L. A. Regayre, M. Yoshioka and K. J. Pringle, Curr. Clim. Change Rep., 2017, 3, 1–15 CrossRef PubMed.
- J. Haywood and O. Boucher, Rev. Geophys., 2000, 38, 513–543 CrossRef CAS.
- U. Lohmann and J. Feichter, Atmos. Chem. Phys., 2005, 5, 715–737 CrossRef CAS.
- K. S. Carslaw, O. Boucher, D. v Spracklen, G. W. Mann, J. G. L. Rae, S. Woodward and M. Kulmala, Atmos. Chem. Phys., 2010, 10, 1701–1737 CrossRef CAS.
- California Department of Forestry & Fire Protection – Stats and Events, https://www.fire.ca.gov/stats-events/, accessed June 2021.
- Y. Liu, J. Stanturf and S. Goodrick, For. Ecol. Manag., 2010, 259, 685–697 CrossRef.
- G. Shi, H. Yan, W. Zhang, J. Dodson, H. Heijnis and M. Burrows, Sci. Total Environ., 2021, 771, 144888 CrossRef CAS PubMed.
- G. di Virgilio, J. P. Evans, S. A. P. Blake, M. Armstrong, A. J. Dowdy, J. Sharples and R. McRae, Geophys. Res. Lett., 2019, 46, 8517–8526 CrossRef.
- A. H. Goldstein and I. E. Galbally, Environ. Sci. Technol., 2007, 41, 1514–1521 CrossRef CAS PubMed.
- M. Hallquist, J. C. Wenger, U. Baltensperger, Y. Rudich, D. Simpson, M. Claeys, J. Dommen, N. M. Donahue, C. George, A. H. Goldstein, J. F. Hamilton, H. Herrmann, T. Hoffmann, Y. Iinuma, M. Jang, M. E. Jenkin, J. L. Jimenez, A. Kiendler-Scharr, W. Maenhaut, G. Mcfiggans, T. F. Mentel, A. Monod, A. S. H. Prévôt, J. H. Seinfeld, J. D. Surratt, R. Szmigielski and J. Wildt, Atmos. Chem. Phys., 2009, 9, 5155–5236 CrossRef CAS.
- J. H. Kroll, N. M. Donahue, J. L. Jimenez, S. H. Kessler, M. R. Canagaratna, K. R. Wilson, K. E. Altieri, L. R. Mazzoleni, A. S. Wozniak, H. Bluhm, E. R. Mysak, J. D. Smith, C. E. Kolb and D. R. Worsnop, Nat. Chem., 2011, 3, 133–139 CrossRef CAS PubMed.
- J. H. Seinfeld and S. N. Pandis, Atmospheric Chemistry and Physics: from Air Pollution to Climate Change, Wiley-Interscience, Hoboken, 2nd edn, 2006 Search PubMed.
- J. L. Jimenez, M. R. Canagaratna, N. M. Donahue, A. S. H. Prevot, Q. Zhang, J. H. Kroll, P. F. DeCarlo, J. D. Allan, H. Coe, N. L. Ng, A. C. Aiken, K. S. Docherty, I. M. Ulbrich, A. P. Grieshop, A. L. Robinson, J. Duplissy, J. D. Smith, K. R. Wilson, V. A. Lanz, C. Hueglin, Y. L. Sun, J. Tian, A. Laaksonen, T. Raatikainen, J. Rautiainen, P. Vaattovaara, M. Ehn, M. Kulmala, J. M. Tomlinson, D. R. Collins, M. J. Cubison, J. Dunlea, J. A. Huffman, T. B. Onasch, M. R. Alfarra, P. I. Williams, K. Bower, Y. Kondo, J. Schneider, F. Drewnick, S. Borrmann, S. Weimer, K. Demerjian, D. Salcedo, L. Cottrell, R. Griffin, A. Takami, T. Miyoshi, S. Hatakeyama, A. Shimono, J. Y. Sun, Y. M. Zhang, K. Dzepina, J. R. Kimmel, D. Sueper, J. T. Jayne, S. C. Herndon, A. M. Trimborn, L. R. Williams, E. C. Wood, A. M. Middlebrook, C. E. Kolb, U. Baltensperger and D. R. Worsnop, Science, 2009, 326, 1525–1529 CrossRef CAS PubMed.
- B. Zobrist, C. Marcolli, D. A. Pedernera and T. Koop, Atmos. Chem. Phys., 2008, 8, 5221–5244 CrossRef CAS.
- B. J. Murray, Atmos. Chem. Phys., 2008, 8, 5423–5433 CrossRef CAS.
- T. Koop, J. Bookhold, M. Shiraiwa and U. Pöschl, Phys. Chem. Chem. Phys., 2011, 13, 19238–19255 RSC.
- M. Shiraiwa, Y. Li, A. P. Tsimpidi, V. A. Karydis, T. Berkemeier, S. N. Pandis, J. Lelieveld, T. Koop and U. Pöschl, Nat. Commun., 2017, 8, 15002 CrossRef PubMed.
- A. P. Bateman, A. K. Bertram and S. T. Martin, J. Phys. Chem. A, 2015, 119, 4386–4395 CrossRef CAS PubMed.
- W. S. W. DeRieux, Y. Li, P. Lin, J. Laskin, A. Laskin, A. K. Bertram, S. A. Nizkorodov and M. Shiraiwa, Atmos. Chem. Phys., 2018, 18, 6331–6351 CrossRef.
- E. Järvinen, K. Ignatius, L. Nichman, T. B. Kristensen, C. Fuchs, C. R. Hoyle, N. Höppel, J. C. Corbin, J. Craven, J. Duplissy, S. Ehrhart, I. el Haddad, C. Frege, H. Gordon, T. Jokinen, P. Kallinger, J. Kirkby, A. Kiselev, K. H. Naumann, T. Petäjä, T. Pinterich, A. S. H. Prevot, H. Saathoff, T. Schiebel, K. Sengupta, M. Simon, J. G. Slowik, J. Tröstl, A. Virtanen, P. Vochezer, S. Vogt, A. C. Wagner, R. Wagner, C. Williamson, P. M. Winkler, C. Yan, U. Baltensperger, N. M. Donahue, R. C. Flagan, M. Gallagher, A. Hansel, M. Kulmala, F. Stratmann, D. R. Worsnop, O. Möhler, T. Leisner and M. Schnaiter, Atmos. Chem. Phys., 2016, 16, 4423–4438 CrossRef.
- A. Pajunoja, A. T. Lambe, J. Hakala, N. Rastak, M. J. Cummings, J. F. Brogan, L. Hao, M. Paramonov, J. Hong, N. L. Prisle, J. Malila, S. Romakkaniemi, K. E. J. Lehtinen, A. Laaksonen, M. Kulmala, P. Massoli, T. B. Onasch, N. M. Donahue, I. Riipinen, P. Davidovits, D. R. Worsnop, T. Petäjä and A. Virtanen, Geophys. Res. Lett., 2015, 42, 3063–3068 CrossRef CAS.
- J. P. Reid, A. K. Bertram, D. O. Topping, A. Laskin, S. T. Martin, M. D. Petters, F. D. Pope and G. Rovelli, Nat. Commun., 2018, 9, 956 CrossRef PubMed.
- L. Renbaum-Wolff, J. W. Grayson, A. P. Bateman, M. Kuwata, M. Sellier, B. J. Murray, J. E. Shilling, S. T. Martin and A. K. Bertram, Proc. Natl. Acad. Sci. U. S. A., 2013, 110, 8014–8019 CrossRef CAS PubMed.
- N. E. Rothfuss and M. D. Petters, Environ. Sci. Technol., 2017, 51, 271–279 CrossRef CAS PubMed.
- M. Song, P. F. Liu, S. J. Hanna, R. A. Zaveri, K. Potter, Y. You, S. T. Martin and A. K. Bertram, Atmos. Chem. Phys., 2016, 16, 8817–8830 CrossRef CAS.
- Y. C. Song, A. E. Haddrell, B. R. Bzdek, J. P. Reid, T. Bannan, D. O. Topping, C. Percival and C. Cai, J. Phys. Chem. A, 2016, 120, 8123–8137 CrossRef CAS PubMed.
- T. D. Vaden, C. Song, R. A. Zaveri, D. Imre and A. Zelenyuk, Proc. Natl. Acad. Sci. U. S. A., 2010, 107, 6658–6663 CrossRef CAS PubMed.
- T. D. Vaden, D. Imre, J. Beranek, M. Shrivastava and A. Zelenyuk, Proc. Natl. Acad. Sci. U. S. A., 2011, 108, 2190–2195 CrossRef CAS PubMed.
- A. Virtanen, J. Joutsensaari, T. Koop, J. Kannosto, P. Yli-Pirilä, J. Leskinen, J. M. Mäkelä, J. K. Holopainen, U. Pöschl, M. Kulmala, D. R. Worsnop and A. Laaksonen, Nature, 2010, 467, 824–827 CrossRef CAS PubMed.
- Y. Zhang, M. S. Sanchez, C. Douet, Y. Wang, A. P. Bateman, Z. Gong, M. Kuwata, L. Renbaum-Wolff, B. B. Sato, P. F. Liu, A. K. Bertram, F. M. Geiger and S. T. Martin, Atmos. Chem. Phys., 2015, 15, 7819–7829 CrossRef CAS.
- K. E. Huff Hartz, T. Rosenørn, S. R. Ferchak, T. M. Raymond, M. Bilde, N. M. Donahue and S. N. Pandis, J. Geophys. Res.: Atmos., 2005, 110, 1–8 CrossRef.
- C. O. Stanier, R. K. Pathak and S. N. Pandis, Environ. Sci. Technol., 2007, 41, 2756–2763 CrossRef CAS PubMed.
- A. K. Bertram, S. T. Martin, S. J. Hanna, M. L. Smith, A. Bodsworth, Q. Chen, M. Kuwata, A. Liu, Y. You and S. R. Zorn, Atmos. Chem. Phys., 2011, 11, 10995–11006 CrossRef CAS.
- R. Zangrando, E. Barbaro, T. Kirchgeorg, M. Vecchiato, E. Scalabrin, M. Radaelli, D. Đorđević, C. Barbante and A. Gambaro, Sci. Total Environ., 2016, 571, 1441–1453 CrossRef CAS PubMed.
- X. Li, L. Jiang, L. P. Hoa, Y. Lyu, T. Xu, X. Yang, Y. Iinuma, J. Chen and H. Herrmann, Atmos. Environ., 2016, 145, 115–127 CrossRef CAS.
- J. Nirmalkar, D. K. Deshmukh, M. K. Deb, Y. I. Tsai and S. Pervez, Atmos. Pollut. Res., 2019, 10, 817–826 CrossRef CAS.
- A. Simperler, A. Kornherr, R. Chopra, P. A. Bonnet, W. Jones, W. D. S. Motherwell and G. Zifferer, J. Phys. Chem. B, 2006, 110, 19678–19684 CrossRef CAS PubMed.
- H. C. Price, J. Mattsson, Y. Zhang, A. K. Bertram, J. F. Davies, J. W. Grayson, S. T. Martin, D. O'Sullivan, J. P. Reid, A. M. J. Rickards and B. J. Murray, Chem. Sci., 2015, 6, 4876–4883 RSC.
- H. C. Price, B. J. Murray, J. Mattsson, D. O'Sullivan, T. W. Wilson, K. J. Baustian and L. G. Benning, Atmos. Chem. Phys., 2014, 14, 3817–3830 CrossRef.
- E. Evoy, S. Kamal, G. N. Patey, S. T. Martin and A. K. Bertram, J. Phys. Chem. A, 2020, 124, 2301–2308 CrossRef CAS PubMed.
- F. H. Marshall, R. E. H. Miles, Y. C. Song, P. B. Ohm, R. M. Power, J. P. Reid and C. S. Dutcher, Chem. Sci., 2016, 7, 1298–1308 RSC.
- Y. C. Song, J. Lilek, J. B. Lee, M. N. Chan, Z. Wu, A. Zuend and M. Song, Atmos. Chem. Phys., 2021, 21, 10215–10228 CrossRef CAS.
- K. D. Roe and T. P. Labuza, Int. J. Food Prop., 2005, 8, 559–574 CrossRef CAS.
- K. Kajiwara and F. Franks, J. Chem. Soc., Faraday Trans., 1997, 93, 1779–1783 RSC.
- P. Ye, X. Ding, J. Hakala, V. Hofbauer, E. S. Robinson and N. M. Donahue, Aerosol Sci. Technol., 2016, 50, 822–834 CrossRef CAS.
- R. Saleh, N. M. Donahue and A. L. Robinson, Environ. Sci. Technol., 2013, 47, 5588–5594 CrossRef CAS PubMed.
- N. M. Donahue, W. Chuang and M. Schervish, in Advances in Atmospheric Chemistry, ed. J. R. Barker, A. L. Steiner, and T. J. Wallington, World Scientific, Hackensack, 2nd edn, 2019, pp. 199–317 Search PubMed.
Footnote |
| † Electronic supplementary information (ESI) available: Additional experimental details including m/z stick diagrams and SMPS data describing particle loss rates during the experiments. See https://doi.org/10.1039/d2ea00017b |
| This journal is © The Royal Society of Chemistry 2022 |

