 Open Access Article
Creative Commons Attribution 3.0 Unported Licence
Diurnal variations of gaseous and particulate nitrophenol isomers in the atmosphere monitored by using wet scrubbing online preconcentration†
Kunio
Sakakibara
 ,
Misaki
Taira
,
Kanako
Nagatomi
,
Genki
Kuriyama
,
Shin-Ichi
Ohira
,
Misaki
Taira
,
Kanako
Nagatomi
,
Genki
Kuriyama
,
Shin-Ichi
Ohira
 and
Kei
Toda
 *
*
Department of Chemistry, Kumamoto University, 2-39-1 Kurokami, Kumamoto 860-8555, Japan. E-mail: todakei@kumamoto-u.ac.jp
First published on 18th July 2022
Abstract
Nitrophenols (NPs) are present in the atmosphere in both gas and particle phases. NP isomers differ in their arrangement of hydroxy and nitro groups and additional functional groups. The positively charged hydroxy groups and negatively charged nitro groups affect the characteristics and behaviors of NPs in the atmosphere. In this study, an automated sampler/preconcentrator was developed to monitor variations in ortho- and para-NPs over time in the gas and particle phases separately. A parallel plate wet denuder containing a pair of glass plates and spraying particle extractor were used for collecting gaseous and particulate NPs, respectively. Automated solid-phase extraction preconcentration was performed simultaneously with air sampling. The obtained extracts were analyzed by high-performance liquid chromatography coupled with atmospheric pressure chemical ionization-tandem mass spectrometry (HPLC-APCI-MS/MS). The sampling, preconcentration, and HPLC-APCI-MS/MS methods were optimized. Atmospheric monitoring was performed in winter and evaluation of diurnal variations of NP concentrations showed that they increased at night. NPs were present mostly in the gas phase and concentrations of ortho-NPs were higher than those of para-NPs in the atmosphere. Gaseous 2-nitro-o-cresol was detected for the first time as one of the major NPs in winter. The particulate fractions of NPs increased at night and the maximum fractions were observed in the morning. Para-NPs were more located in the particulate fraction, and the fraction of 4-nitrophenol (a para-NP) was about double that of 2-nitrophenol (an ortho-NP).
Environmental significanceSeveral kinds of nitrophenols (NPs) are present in the atmosphere, where they contribute to production of secondary organic aerosols and have negative effects on human health. Because the chemical and physical properties of NPs differ with the arrangement of hydroxy and nitro groups on the benzene ring, ortho- and para-NPs can behave differently in the atmosphere. In this study, a real time collection/preconcentration system was developed to measure the concentrations of ortho- and para-NPs in the gas and particle phases separately. Gaseous ortho-NPs were dominant. Concentrations and partitioning into the particulate phase varied diurnally with changes in NO2 concentration and ambient conditions. Para-NPs partitioned into the particulate phase more than ortho-NPs and the particulate fraction reached maximum in the morning. |
1. Introduction
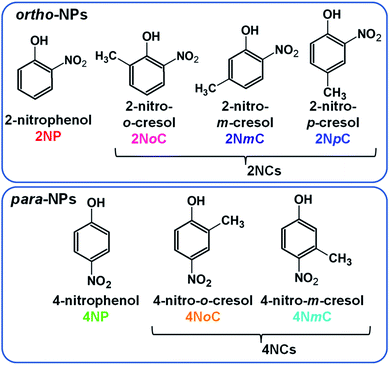
Nitrophenols (NPs) are aromatic compounds with both hydroxy and nitro groups on a benzene ring. NPs are hazardous chemicals1 and contribute to production of secondary organic aerosols.2–4 NPs in dew water produce HONO in accordance with water evaporation, which enhances OH radical formation.5 There are several NP structural isomers that differ in the positions of the functional groups and other substituents (Fig. 1). The polarity and related properties vary with changes in the positions of the positively charged hydroxyl groups and negatively charged nitro groups. The NPs present in the atmosphere include para- and ortho-NPs and dinitrophenols (DNPs). Few meta-NPs are present because activation of the meta-position carbon of the hydroxy group does not occur.6 Because the para isomers, such as 4-nitrophenol (4NP) and 4-nitrocresols (4NCs), are highly polar and highly water-soluble, they can easily penetrate living tissue and affect human health7,8 and inhibit plant growth.9,10 By contrast, ortho isomers, such as 2-nitrophenol (2NP) and 2-nitrocresols (2NCs), are less polar. The para- and ortho-NPs may behave differently in the atmosphere and could show different diurnal variations and partitioning between gas and particle phases.The behaviors of ortho- and para-NPs in the atmosphere have not been thoroughly investigated for several reasons. First, until recently, atmospheric NPs were collected onto filters for subsequent analysis by high-performance liquid chromatography coupled with electrospray ionization mass spectrometry (HPLC-ESI-MS).4,11–15 However, ESI does not ionize all NPs, and the ionization efficiency is particularly poor for ortho-NPs. Therefore, this method is only useful for para-NPs. Second, separation of gas phase and particle phase NPs is difficult because they are volatile and partitioning between the phases may change during long sampling periods. The first attempt at analysis of NPs in two phases was performed for liquid and gas phase samples from rain by Leuenberger et al. using adsorption/thermal desorption followed by gas chromatography mass spectrometry (GC-MS).16,17 Lüttke et al. measured NPs in cloud water and gas collected by an impactor and spraying scrubber, respectively, connected in series. NPs in the cloud water and scrubber solution were extracted using a solid-phase extraction (SPE) cartridge and eluted with ethyl acetate for analysis by GC-MS.18,19 Rain, snow,20 and cloud samples can be obtained in large amounts, whereas the amount of aerosols in the atmosphere is very small, which means that a long sampling period is required to collect aerosols on a filter. This long period for collection of aerosols on a filter or silica gel sampler can lead to production, vaporization, and secondary reactions of NPs.21 There have been multiple reports on the formation, evolution, and loss of NPs in the atmosphere.22–25 Chemical transformations can occur on filters, where oxidants and reactants in air are continuously supplied during the air sampling. Therefore, an alternative method is necessary to investigate atmospheric NPs. Salvador et al. used a filter inlet for gas and aerosol collection and chemical ionization-time of flight mass spectrometry (CI-ToFMS) to obtain fractions of NPs in the particles (Fp).26 For aerosol analysis, NPs collected on a filter for 30 min were desorbed and submitted to CI-ToFMS. During aerosol collection, gaseous NPs were analyzed by CI-ToFMS. Although the aerosol was collected on a filter, secondary production and loss during sampling were probably negligible because of the short sampling period for each measurement.
As an alternative to filters, gas and aerosol species can be separated by a denuder. Cecinato et al. used a solid cylindrical denuder and filter in series to collect gas and particle NPs, respectively, with a 6 h sampling period in the daytime.27 The NPs were extracted into an organic solvent, concentrated, silylated, and analyzed by GC-MS. The Fp values were obtained for 12 samples collected from February to April. Sampling with a solid denuder is intermittent, whereas a wet denuder allows for continuous monitoring. A parallel plate wet denuder (PPWD) made of plastic and a spray-type particle collector (PC) was developed to measure water-soluble inorganic acidic gases and anions in particles.28–31 The PPWD/PC collection system was successfully applied even to polar organic compounds (carbonyls) to study their partitioning and diurnal variations.32,33 Because NPs are polar and water-soluble like carbonyls, we tried to monitor gas and particle phase NPs using a PPWD/PC collection system. However, the atmospheric concentrations of NPs are less than those of inorganic species and carbonyl compounds.
In the present study, to overcome issues with contamination in the PPWD and a lack of measurement sensitivity, we prepared a glass-made PPWD and a sequential SPE system for simultaneous preconcentration. For HPLC-MS analysis, atmospheric pressure chemical ionization (APCI) was adopted to ionize all NP compounds. The performance of this device was evaluated, and the system was applied to atmospheric monitoring in winter. Changes in the compounds present, partitioning between gas and particle phases, and diurnal variations were studied.
2. Methods
2.1. Chemicals
2NP (purity > 98.0%), 3-NP (3NP) (>98.0%), 4NP (>99.0%), 4-methyl-2-nitrophenol (2-nitro-p-cresol: 2NpC) (>99.0%), 2-methyl-4-nitrophenol (4-nitro-o-cresol: 4NoC) (>97%), 3-methyl-4-nitrophenol (4-nitro-m-cresol: 4NmC) (>98.0%), 2,4-dinitrophenol (2,4DNP) (>98.0%), 1-ethoxy-2,4-dinitrobenzene (2,4-dinitrophenetole: 2,4DNPt) (>98.0%), 4-methyl-2,6-dinitrophenol (2,6-dinitro-p-cresol: 2,6DNpC) (>99%), and phenol (>99%) were obtained from TCI (Tokyo, Japan). 2-Methyl-6-nitrophenol (2-nitro-o-cresol: 2NoC) (>98%) was obtained from Combi-Blocks (San Diego, CA). A stock solution of NPs containing each NP at 1000 mg L−1 and 5000 mg L−1 phenol was prepared. As deuterium isotope NPs and phenol, 2NP ring-d4, 4NP ring-d4, and phenol ring-d5 were obtained from Cambridge Isotope Laboratories (Andover, MA) for use as internal standards. Solutions of 2NP ring-d4 and 4NP ring-d4 (1000 mg L−1 each) and a solution of phenol ring-d5 (2000 mg L−1) were prepared for use as internal standard stock solutions. A working internal standard solution containing 25 μg L−1 2NP ring-d4 and 4NP ring-d4 and 50 μg L−1 phenol ring-d5 was prepared for SPE preconcentration of the absorbing solution. Another standard solution containing 500 μg L−1 2NP ring-d4 and 4NP ring-d4 and 1000 μg L−1 phenol ring-d5 was prepared for calibration. Working standard solutions for calibration were prepared daily by diluting the stock solutions and internal standard solution with methanol.2.2. PPWD and PC
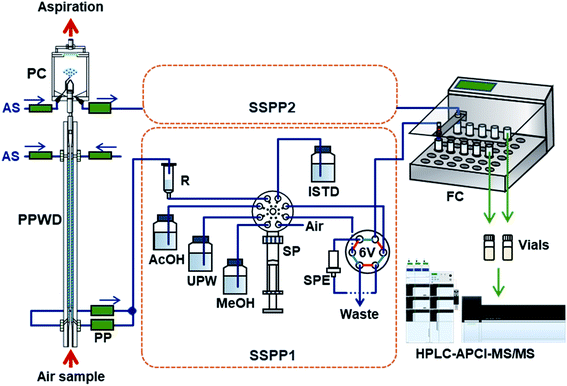
A pair of glass plates (78 mm × 420 mm × 3 mm) was used for the wet denuder. Gas collection areas (62 mm wide) were sandblasted on the glass plates to a depth of 2–3 μm. Horizontal grooves (width: 0.2–0.3 mm, depth: 20–30 μm, spacing: 1 mm) were hand etched on the sandblasted areas using a diamond pen. The two glass plates were set on transparent plastic plates and placed facing each other with a space of 3 mm between them that acted as an air flow channel. Porous polyethylene plates (65 mm × 10 mm × 3 mm, 20 μm, HDPE-3.0-300-20, Wintec, Niigata, Japan) were placed just above the glass plates to disperse the absorbing solution over the whole width of collection areas. Absorbing solutions were provided to the collection areas by a peristaltic pump (Minipuls 3, Gilson, Middleton, WI) equipped with Pharmed tubing (1/32′′ × 5/32′′) at 0.3 mL min−1via the porous polyethylene plates. The absorbing solution flowing from the collection area was collected from the bottom of each glass plate, which was shaped into a V, by aspiration with the same peristaltic pump but with larger tubing (1/16′′ × 3/16′′). Sample air was introduced to the space between the glass plates from the bottom (Fig. 2) by aspirating air at 3.0 L min−1 using a mass flow controller (SEC-B40, Horiba STEC, Kyoto, Japan) and an airpump (DA-40S, ULVAC, Chigasaki, Japan). Before each experiment, the glass plates were treated with a mixture of H2SO4 and H2O2 (2![[thin space (1/6-em)]](https://www.rsc.org/images/entities/char_2009.gif) :
:![[thin space (1/6-em)]](https://www.rsc.org/images/entities/char_2009.gif) 1, v/v) for 5 min, and washed successively with tap water and pure water to remove organic contaminants.
1, v/v) for 5 min, and washed successively with tap water and pure water to remove organic contaminants.
The PC was the same as that used for inorganic acids34 and aldehydes.33 Briefly, the absorbing solution (0.3 mL min−1) was nebulized with air, which was passed through the PPWD by a nozzle placed in the PC. A hydrophobic membrane filter (∅47 mm; PF020, Advantec, Tokyo, Japan) placed on the top of the PC was used to separate the sprayed absorbing solution from air. The absorbing solution was blocked by the filter and collected from the bottom of the PC, while air passed through the filter. The filter was replaced every 48 h.
2.3. Automated sample collection and preconcentration
NPs collected by the PPWD and PC were preconcentrated with internal standards for HPLC analysis. The whole system is shown in Fig. 2. The sequential solid-phase preconcentration system (labeled SSPP1 for the PPWD or SSPP2 for the PC) comprised of a syringe pump equipped with a 10 mL gas-tight syringe and an eight-port selection valve to switch between the absorbing solution, internal standard solution, acetic acid solution, and air, and a six-port valve equipped with a styrene-divinylbenzene based SPE cartridge (265 mg, 0.8 mL, 50 μm; Sep-Pak PS2, Waters, Milford, MA).The absorbing solution aspirated from the PPWD was continuously introduced to the reservoir (50 mL plastic syringe) of SSPP1 at the flow rate of 0.2 mL min−1. The syringe pump aspirated 1.34 mL of the absorbing solution from the reservoir, followed by 0.29 mL of 100 mM acetic acid. After repeating this process three times, 0.10 mL of internal standard solution was also introduced to the pump syringe. The mixture (5.0 mL in total) in the syringe was then transferred to the SPE cartridge at 0.4 mL min−1. The procedure was performed 18 times in total so that all the absorbing solution taken from the PPWD over 2 h (72 mL) was transferred to the SPE cartridge with the acidifier and internal standard. The SPE cartridge was then washed with 1 mL of water and dried with 8 mL of air. NPs trapped in the SPE cartridge were eluted with 1 mL of methanol at 0.4 mL min−1 and transferred to a vial, which was placed in a fraction collector (CHF122SC, Advantec, Tokyo, Japan) with the aid of 4 mL of air. The cartridge was subsequently washed with 8 mL of methanol and 5 mL of water and was treated with 5 mL of 100 mM acetic acid solution for the next sample preconcentration.
For processing of PC eluent using SSPP2, the samples were treated in the same way as those passed through SSPP1. The procedure for transfer of a mixture of three aliquots of absorbing solution (1.34 mL)/acetic acid (0.29 mL) and one aliquot of internal standard (0.20 mL) to the SPE cartridge was repeated nine times to handle a total of 36 mL of absorbing solution collected over 2 h.
SSPP1 and SSPP2 worked in parallel to collect gas and particle samples simultaneously. This system could prepare separate concentrated gas and particle NP samples every 2 h for HPLC analysis.
2.4. Determination of collection efficiencies
To investigate the performance of the PPWD, gaseous NP and phenol samples were prepared. Each NP (ca. 150 mg) was placed in a small plastic tube containing a 30 mm long AWG16 Teflon tube (inner diameter: 1.35 mm) to control vapor diffusion. These diffusion tubes were placed in a gas exchange bottle in a water bath at 50 °C to produce ortho-NPs and phenol vapors. Vapors of meta- and para-NPs and DNPs were prepared at 150 °C using an oil bath. Two PPWD devices were connected in series and the produced vapors were introduced in the first PPWD together with air. Vapor not captured in the first PPWD was collected in the second PPWD. The collection efficiency (f) of the PPWD was calculated from the amounts of NPs collected by the first and second PPWD (Q1 and Q2, respectively) as shown in eqn (1).32,35 | (1) |
The collection efficiency (f) for the PC was obtained by introducing NP aerosols to two PC devices connected in series. Aerosol was produced by nebulizing 2.0 M (NH4)2SO4 solution containing 1.0 mM NPs and phenol at 0.50 mL min−1 with air at 5.0 L min−1. The nebulizer was settled in the bottom of a 20 L plastic tank to remove droplets and mists, and gaseous species were removed by PPWD placed between the 20 L tank and the upstream PC.
2.5. HPLC-APCI-tandem MS analysis
Preconcentrated NP samples were analyzed by a liquid chromatograph mass spectrometer (LCMS-8040, Shimadzu, Kyoto, Japan). An ESI source in the mass spectrometer was replaced with an APCI unit (APCI-8030, Shimadzu). Separation of NPs was performed by a reversed phase column (Cortecs C18, particle size 2.7 μm, pore size 9 nm, 2.1 mm × 100 mm, Waters) with a 5 mm long guard column placed in a 40 °C oven. The mobile phase was a mixture of 10 mM acetic acid and methanol with a flow rate of 0.4 mL min−1. The methanol proportion in the mobile phase was increased from 5% to 100% between 0 and 5.5 min, maintained at 100% between 5.5 and 8.5 min, and then decreased to 5% from 8.5 to 20 min. Phenol was measured after NP analysis using the same equipment, but pure water was used instead of 10 mM acetic acid. This was because phenol's ionization was poor under acidic conditions, while acetic acid was needed to stabilize the retention time of the NPs. The methanol proportion in the mobile phase for phenol analysis was increased from 5% to 100% over 0 to 3 min, maintained at 100% from 3 to 6 min, and reduced to 5% from 6 to 15 min.APCI was performed using nitrogen as the nebulizing gas (3 L min−1) at 500 °C. Produced ions were analyzed by selected reaction monitoring in negative ion mode. Precursor/product ion m/z and collision energies are summarized in Table S1 of ESI.† Calibration curves were obtained by dividing the peak areas by that of 2NP ring-d4 for ortho-NPs and by that of 4NP ring-d4 for para-NPs and DNPs. The calibration curve R2 were more than 0.993. Limits of detection (LODs) for the liquid samples were between 0.043 (4NoC) and 0.24 μg L−1 (2NmC), which were corresponding to gaseous concentrations between 0.12 and 0.66 ng m−3 and particle concentrations between 0.06 and 0.33 ng m−3. The method had sufficient sensitivity to measure atmospheric NPs presenting at ng m−3 levels. The calibration curves and LODs are provided in Fig. S1 and Table S2.†
2.6. Atmospheric measurement of NPs
PPWD/PC sampling was performed on a seventh-floor laboratory of a nine-story building in the campus (32°48′49.5′′ N, 130°43′46.5′′ E) between January 16–24, 2021. The sampler was placed in a window and outside air taken from 2 m horizontally in front of the window was introduced to the PPWD via 1/2′′ PTFE tubing. Sampling was conducted continuously and SPE preconcentration of the NPs was performed simultaneously every 2 h. HPLC-APCI-MS/MS analysis for NPs was carried out within 24 h of sampling and phenol was measured after the sampling campaign.3. Results and discussion
3.1. PPWD
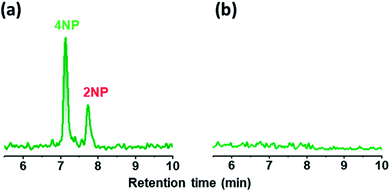
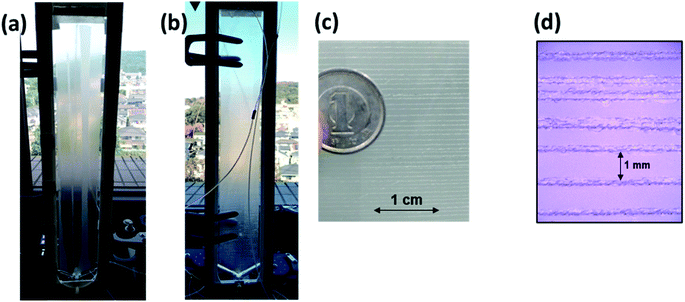
A wet denuder made of glass plates was developed and used for atmospheric analysis. A glass device will be suitable for polar organic compounds present at trace levels. The absorbing solution eluted from a conventional plastic PPWD32,33 was contaminated with NPs at sub-microgram per liter levels (Fig. 3) probably because NPs are ubiquitous and a finely machined plastic surface will adsorb the organic compounds. By contrast, the gas collection area of a glass PPWD can be treated with strong chemicals (e.g., H2SO4/H2O2 mixture as described in Section 2.2) to remove organic compounds adsorbed on the surface. The glass device in the present study retained the absorbing solution well, and the solution consumption rate was reduced to 0.3 mL min−1 compared with 1.0 mL min−1 for a plastic device.32,33 A low solution consumption rate will be advantageous because the absorbing solution reservoir will not need to be refilled as often. More importantly, it will benefit automated SPE preconcentration. When the absorbing solution was supplied to the PPWD at a rate of 1.0 mL min−1 for each plate (total of 2.0 mL for both sides), preconcentration of 240 mL took more than 2 h, and simultaneous preconcentration could not be carried out.Sandblasting made the glass surface hydrophilic, which meant that water flowed only over the sandblasted area. Water did not overflow onto the untreated area even at a water supply rate of 1 mL min−1. However, the wet surface partially dried out when air was introduced between the two plates of the wet denuder (Fig. 4a). This was because the amount of water retained on the denuder surface was small. To increase the water retention capacity, grooves were carved over the sandblasted area with a spacing of 1 mm (Fig. 4c and d). With addition of the grooves, the sandblasted area never became dry, even when the water flow rate was reduced to 0.3 mL min−1 even in the presence of air flow (Fig. 4b). The plates were now suitable for application to continuous atmospheric monitoring.
3.2. Collection efficiency of air sampling and recovery of SPE preconcentration
For selective and quantitative collection of gas and particle phase NPs, the collection efficiencies (f) of the PPWD and PC are important. The f values for the PPWD for gas (fWDg) and PC for particle (fPCp) are summarized in Fig. 5. We found that para-NPs were not detected from the second PPWD or the second PC, which indicated that quantitative collection was achieved for para-NPs with the PPWD and PC, even with pure water as the absorbing solution. The collection efficiencies of ortho-NPs were improved after the absorbing solution was changed from water to 10 mM NH3 solution. 2NoC had the worst f value, but it increased from 43 ± 9% with water to 78 ± 2% with NH3 solution. The fWDg of 2NP, the most abundant NP in our results, improved to 96 ± 1%. From these results, 10 mM NH3 solution was selected as the absorbing solution.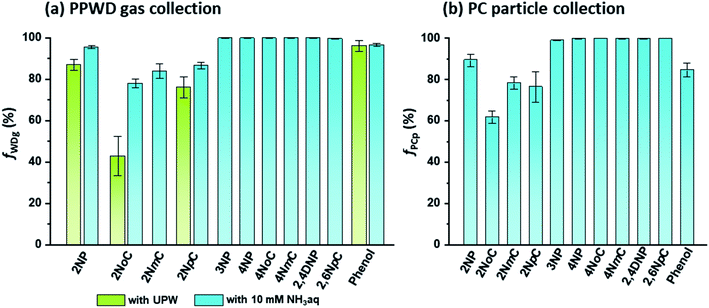 | ||
| Fig. 5 Collection efficiencies of NPs and phenol for (a) gas collection by the PPWD (fWDg) and (b) particle collection by the PC (fPCp). | ||
Direct analysis of NPs collected by the PPWD/PC was impossible because of their low concentrations. Consequently, SPE preconcentration was required before analysis. NP in-line preconcentration was conventionally performed by using either styrene-divinylbenzene short column,21,36,37 weak anion exchange resin column,38 or organic liquid film produced on inner wall of Teflon tubing.39 For our system, cartridge packed with styrene-divinylbenzene and methanol as eluent was chosen to match the HPLC eluent system. Before establishing an automated SPE system, preconcentration was performed manually using a conventional manifold. The recoveries obtained with manual SPE preconcentration were poor and between 0.86% ± 1.18% and 55% ± 14%. Sample introduction and elution were in the same direction in the manual SPE procedure. Automated SPE gave worse recoveries than manual SPE (Table 1). This problem was solved by reversing the elution direction so that it was opposite to that of sample introduction. Reversing the elution gave recoveries between 87% ± 5% and 95% ± 11% for the NPs (Table 1). With this method, NPs could be preconcentrated 72 and 36 times for gas and particle samples, respectively, and this could be performed simultaneously with air sampling. Carryover was not observed because the SPE cartridge was washed with 8 mL of methanol as mentioned in experimental section.
| Compound | Manual elution with manifolda | Automated forward elutiona | Automated backward elutionb |
|---|---|---|---|
| a The extractant was introduced in the same direction as the absorbing solution flow. b The extractant was introduced in the opposite direction to the absorbing solution flow. The SPE examinations were repeated three times. | |||
| 2NP | 5.9 ± 1.6 | 1.9 ± 0.7 | 91 ± 5 |
| 2NpC | 0.86 ± 1.18 | 0 | 95 ± 11 |
| 4NP | 46 ± 9 | 36 ± 10 | 89 ± 7 |
| 4NoC | 28 ± 5 | 22 ± 6 | 94 ± 14 |
| 4NmC | 35 ± 7 | 28 ± 6 | 93 ± 13 |
| 2,4DNP | 55 ± 14 | 51 ± 15 | 88 ± 6 |
| 2,4DNPt | 3.9 ± 1.6 | 1.2 ± 0.5 | 87 ± 5 |
| 2,6DNpC | 27 ± 12 | 29 ± 8 | 92 ± 8 |
| 3NP | 53 ± 12 | 39 ± 10 | 90 ± 9 |
| Phenol | — | — | 86 ± 1 |
Atmospheric concentrations of para-NPs in the gas phase and particle phase were calculated without correction using fWDg, fPCp or the SPE recovery, as para-NPs were quantitatively collected through the gas/aerosol collection and the SPE preconcentration process. Gas concentrations (Cg) of the ortho-NPs were corrected only with their gas collection efficiencies of the PPWD (fWDg) (eqn (2)).
| Cg = Cg°/fWDg | (2) |
The particle concentrations (Cp) of ortho-NPs were corrected using fWDg and fPCp as shown in eqn (3). Cg° and Cp° are the concentrations before correction. Particle concentrations of ortho-NPs were calculated using eqn (3) taking into considering the amount not captured at the PPWD in addition to the collection efficiency of the PC (fPCg).
| Cp = [Cp° − (1 − fWDg)CgfPCg]/fPCp | (3) |
C g and Cp for phenol were obtained in the same way as those of ortho-NPs.
3.3. Observed compounds
In this study, NPs were analyzed using APCI rather than the conventional ESI. APCI was selected so that we could detect 2NP and 2NCs (Fig. 6). In the atmospheric analyses, while para isomers and ortho isomers were detected, 3NP and 3-nitrocresols were not detected in the winter campaign. Nitration of phenol or cresol is difficult at the meta-position because of low electron density of the meta-position carbon atom.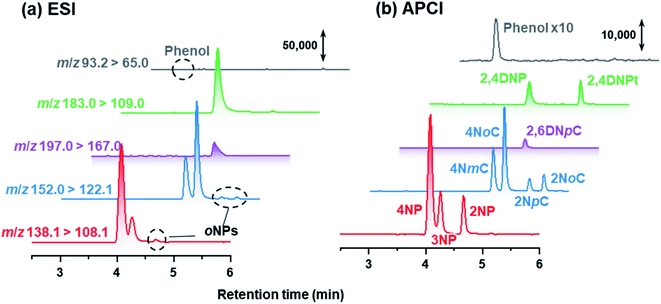 | ||
| Fig. 6 Chromatograms obtained by HPLC-ESI-MS/MS and HPLC-APCI-MS/MS for standard compounds. The concentration of each NP was 100 μg L−1. | ||
Because 2NpC and 2NmC, which are both ortho-NCs (Fig. 1), were not separated by reversed-phase chromatography, their peak was treated as sum of the two compounds (2NpC + 2NmC). The sensitivity of APCI-MS/MS was almost the same for the two 2NCs (2NpC peak was 1.1 times that of 2NmC), and the peaks were calibrated with a 2NpC standard solution. Cecinato et al. detected 2NmC, 2NpC, and 4NmC in samples collected with a solid denuder and filter (6 h: 10 am–4 pm in winter) and analyzed by GC-MS after derivatization. The 2NpC concentrations in gas and aerosol were both 1.5 times those of 2NmC.27
Chromatograms obtained are shown in Fig. 7 for standards, gas and particle samples collected 4–6 am, January 23, 2021. In addition to peaks for the originally examined compounds, peaks for unknown compounds appeared in the obtained chromatograms. These were assigned to 2NpC, 4NmC, 4NoC, and 2NoC (Fig. 7). All these compounds were detected from both gas and particle extracts. Production of cresol isomers has been examined in chamber experiments, but few studies have reported on the detection of cresols in atmospheric samples. Nojima et al. found 2NoC, 2NpC, and 4NoC were produced in chamber experiments.40 Olariu et al. confirmed production of 2NoC, 2NmC, 2NpC, 4NoC, and 4NmC using FT-IR monitoring in a chamber where ortho-, meta-, and para-cresols were reacted with NO3 radicals.41 For atmospheric particle analysis, Nojima et al. detected 2NoC and 4NoC in samples collected on filters in Yokohama, Japan, after treatment by silylation derivatization before GC-MS analysis.42 Our study is the first to report on the observation of gas phase 2NoC. We found that 2NoC was a major NP in winter gas phase samples. The amount of 2NoC in winter was comparable to that of 4NP.
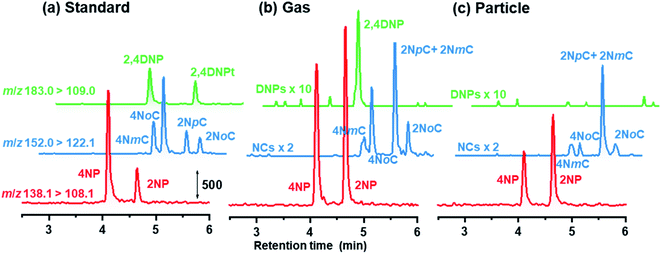 | ||
| Fig. 7 Chromatograms obtained for NPs in (a) 3 μg L−1 standard solution, and (b) gas and (c) particle samples. | ||
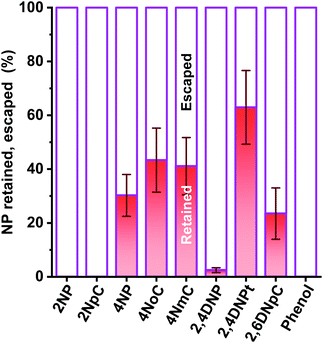
In our investigation, ortho-NPs were detected even from particle samples collected by PPWD/PC. Retention of NPs on the filter in the conventional aerosol sampling was examined. NPs (10 μg each) were dropped on 47 mm silica filters. For some of the filters, air was introduced through the filter for 6 h at a flow rate of 5 L min−1. For the filters that had air introduced, 2NP and 2NpC were not detected at all (Fig. 8). Even for the para-NPs, retentions on the filter were only 30–43%. Loss of NPs from the filter over a long sampling period with air introduction is one of reasons why ortho-NPs are not detected using conventional filter sampling. In this regard, PPWD/PC collection is advantageous for sampling of semi-volatile compounds because the absorbing solutions are continuously renewed to minimize NP vaporization. Alkaline absorbing solution would work good because the NPs were deprotonated to remain in the aqueous solution. 2NP was the predominant NP in our results, while 4NP was main NP observed from air samples collected by conventional filter sampling. Our results agreed with the results of chamber experiments,43–45 which showed production of 2NP was higher than 4NP.
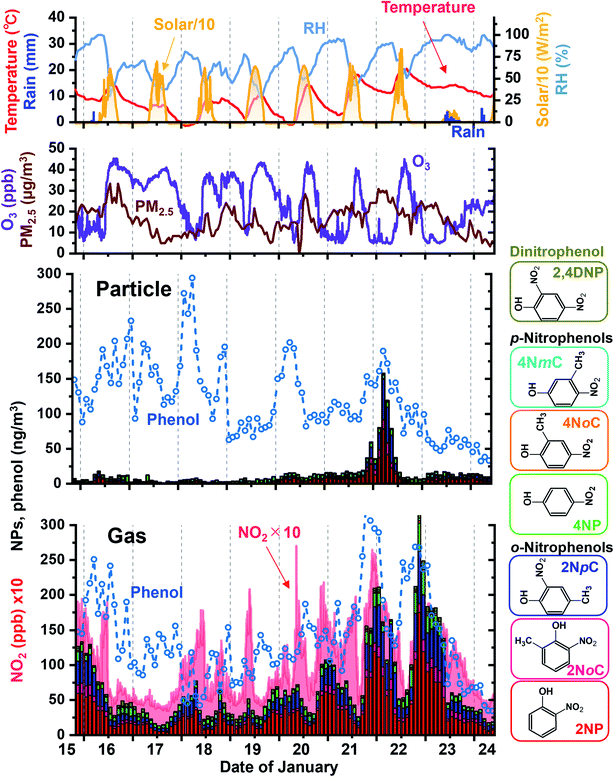
3.4. Diurnal variations of atmospheric NP concentrations
Sampling and analysis over 2 h periods was performed for 9 days in winter. Obtained results for gas and particle NPs are shown in Fig. 9 with variations of phenol, NO2, ozone and PM2.5 concentrations and weather parameters. The major NPs were 2NP, 2NpC, and 2NoC, which are all ortho isomers and account for 82% of gas phase NPs and 72% of particle phase NPs. 2NoC, which was detected as an atmospheric gaseous species for the first time, was the fourth most abundant NP and accounted for 6.9% and 8.6% of all NPs in the gas phase and particles, respectively. Concretely, gaseous and particle concentrations of 2NP were 34 ± 30 and 5.7 ± 9.8 nmol m−3, respectively for 103 samples obtained in winter. For the other major species, gas and particle concentrations were 8.8 ± 6.3 and 3.8 ± 1.8 nmol m−3 for 4NP, 5.4 ± 4.7 and 0.98 ± 2.7 nmol m−3 for 4NoP, and 20 ± 17 and 3.4 ± 8.8 nmol m−3 for 2NpC + 2NmC. Total of gaseous NP concentration varied from 13 to 320 nmol m−3 (72 ± 57 nmol m−3), while total of particulate NP concentrations from 0.9 to 158 nmol m−3 (14 ± 22 nmol m−3). 17% of total NP was in particle and remaining 83% was in gas phase.The NP concentrations greatly increased during the night. The diurnal variations and high ortho-NP/para-NP ratios were probably caused by secondary production.46 Concentrations of the NO3 radical and NO2 are both much higher at night and this is when nitration occurred. In winter, nitration of phenolic compounds was mainly initiated by NO3 radical adduction on the carbon atom having the hydroxy group. Then, NO2 was added on the activated carbon atom, which was in an ortho or para position to the hydroxy group.45 The final process of nitration was removal of HNO3, which was composed of NO3 from the hydroxy group carbon and a proton from the carbon with added NO2. Thus ortho-nitration was preferable because NO3 and the proton were located very close to each other, and this combination was easier than in para-nitration.
Another pathway of NP production is OH radical initiation followed by NO2 adduction during the daytime.43–45 However, weaker sunlight does not produce much OH radical in winter compared in summer and lower NO2 level in daytime does not contribute to the nitration of phenolic compounds. It made the winter daytime NP concentrations lower than those in winter nighttime.
3.5. Diurnal variations of NP partitioning between gas and particle phases
Partitioning between gas and particle phases is expressed by fraction of particle, Fp, which is calculated from atmospheric concentrations of gas phase (Cg) and particle phase (Cp). | (4) |
Diurnal variations in Fp are shown in Fig. 10 for 2NP, 4NP, and phenol. The Fp values of phenol and 4NP decreased during the day to reach minimum levels at 2–4 pm or 4–6 pm. They then increased at night to reach maximum levels in the morning (6–10 am). These changes in Fp were probably caused by changes in the temperature and humidity. A higher humidity will increase the hygroscopic aerosol content and lower temperature to shift the air/water absorption or air/organic adsorption equilibrium. The maximum values of Fp were higher than the minimum Fp values by 36% for phenol and 74% for 4NPs. The change in Fp for 2NP was much larger and the maximum Fp was 199% higher than that of the minimum. The equilibrium of 2NP between gas and particle phases was largely affected by the ambient conditions. Characteristically, the 2NP Fp continued to decrease in the evening. The 2NP concentration in the gas phase greatly increased during the evening, and this may be why the Fp value did not increase in the early evening unlike 4NP or phenol. 2NP Fp increased at midnight. This indicates that 2NP production occurred dominantly in gas phase.
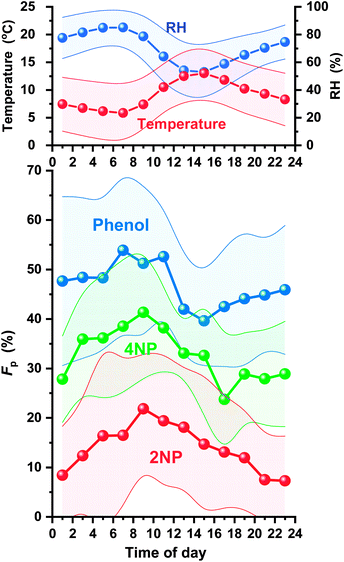 | ||
| Fig. 10 Diurnal variations in particle fractions (Fp) of 2NP, 4NP, and phenol, and the temperature and relative humidity (RH). | ||
The average Fp values were in the order of phenol (47 ± 14%) > 4NP (33 ± 11%) > 2NP (14 ± 13%). The order of the Fp values for phenol and 4NP was same as that observed by Li et al. in April in Jinan, China (phenol 63% > 4NP 55%).13 More para-NPs entered particles than ortho-NP and the Fp of 4NP was more than twice that of 2NP. Both 4NP and 2NP are considered to present as neutral forms in acidic hygroscopic aerosols because of their weak acidities (pKa values of 4NP and 2NP: 7.13 and 7.15, respectively).47,48 The hydroxy group acidities of 2NP and 4NP are almost the same. However, the polarity of 4NP is higher because positively charged hydroxy groups and negatively charged nitro groups are on opposite sides of the benzene ring. Thus, partitioning of NPs between the gas and particle phases depends on an ortho and para-arrangement.
4. Conclusions
A glass PPWD was prepared by sandblasting and diamond pen assisted etching. The collection area on the developed PPWD could be selectively and continuously covered with absorbing solution using a low flow rate of 0.3 mL min−1 for each plate. The device could be used to reduce contamination. With a low absorbing solution flow rate, SPE preconcentration could be performed simultaneously with sample collection. This overcomes the issue of preconcentration being a rate limiting step in analysis. The PPWD/PC-preconcentration system was applied to atmospheric NP monitoring, and the collected NPs were analyzed by HPLC-APCI-MS/MS. The ortho isomers, 2NP and 2NCs, could be measured with APCI, even though they could not be ionized by ESI. NPs were detected from gas and particle samples at nanogram per meter cubed levels every 2 h for both para and ortho isomers.According to the results, the major NPs were 2NP, 2NpC + 2NmC, and 2NoC, which are all ortho isomers, and 4NP. These compounds were mostly present as gaseous molecules in the atmosphere. 2NoC was detected as a gaseous species for the first time. With continuous supply of absorbing solution to the PPWD and PC, even ortho isomers of NPs could be collected and volatilization losses were avoided during sampling. Diurnal variations of NP concentrations were clear in winter, and gas phase NP concentrations were higher at nighttime. Partitioning of NPs between the gas phase and particles varied diurnally, and Fp increased in the night to reach a maximum in the early morning.
Author contributions
KS, MT and KT developed the analytical method and devices. KS, MT, KN, GK, and SO performed the atmospheric analysis and analyzed the data. KT designed and organized the whole study and prepared the manuscript. KS and SO contributed to the writing and preparation of the manuscript.Conflicts of interest
There are no conflicts of interest to declare.Acknowledgements
This work was supported by a Grant-in-Aid for Environmental Research (grant no. 20C-34) from the Steel Foundation for Environmental Protection Technology. We thank Gabrielle David, PhD, from Edanz (https://jp.edanz.com/ac) for editing a draft of this manuscript.References
- S. R. Subashchandrabose, M. Megharaj, K. Venkateswarlu and R. Naidu, p-Nitrophenol toxicty to and its removal by three select soil isolates of microalgae: The role of antioxidants, Environ. Toxicol. Chem., 2012, 31, 1980–1988 CrossRef CAS PubMed.
- I. G. Bejan, R.-I. Olariu and P. Wiesen, Secondary organic aerosol formation from nitrophenols photolysis under atmospheric conditions, Atmosphere, 2020, 11, 1346 CrossRef CAS.
- P. Lin, J. Liu, J. E. Shilling, S. M. Kathmann, J. Laskin and A. Laskin, Molecular characterization of brown carbon (BrC) chromophores in secondary organic aerosol generated from photo-oxidation of toluene, Phys. Chem. Chem. Phys., 2015, 17, 23312–23325 RSC.
- F. Ikemori, T. Nakayama and H. Hasegawa, Characterization and possible sources of nitrated mono- and di-aromatic hydrocarbons containing hydroxyl and/or carboxyl functional groups in ambient particles in Nagoya, Japan, Atmos. Environ., 2019, 211, 91–102 CrossRef CAS.
- F. Barsotti, T. Bartels-Rausch, E. De Laurentiis, M. Ammann, M. Brigante, G. Mailhot, V. Maurino, C. Minero and D. Vione, Photochemical formation of nitrite and nitrous acid (HONO) upon irradiation of nitrophenols in aqueous solution and in viscous secondary organic aerosol proxy, Environ. Sci. Technol., 2017, 51, 7486–7495 CrossRef CAS PubMed.
- T. W. G. Solomons, Fundamentals of Organic Chemistry, John Wiley & Sons, 4th edn, 1993, pp. 622–625 Search PubMed.
- L. W. Smith, G. T. Hall and G. L. Kennedy, Acute and repeated dose inhalation toxicity of para-nitrophenol sodium salt in rats, Drug Chem. Toxicol., 1988, 11, 319–327 CrossRef CAS PubMed.
- F. Dong, L. Chen, R. Wang, W. Yang, T. Lu and Y. Zhang, 4-nitrophenol exposure in T24 human bladder cancer cells promotes proliferation, motilities, and epithelial-to-mesenchymal transition, Environ. Mol. Mutagen., 2020, 61, 316–328 CrossRef CAS PubMed.
- G. Rippen, E. Zietz, R. Frank, T. Knacker and W. Klöpffer, Do airborne nitrophenols contribute to forest decline?, Environ. Technol. Lett., 1987, 8, 475–482 CrossRef CAS.
- M. Natangelo, S. Mangiapan, R. Bagnati, E. Benfenati and R. Fanelli, Increased concentrations of nitrophenols in leaves from a damaged forestal site, Chemosphere, 1999, 38, 1495–1503 CrossRef CAS.
- Z. Kitanovski, I. Grgić, R. Vermeylen, M. Claeys and W. Maenhaut, Liquid chromatography tandem mass spectrometry method for characterization of monoaromatic nitro-compounds in atmospheric particulate matter, J. Chromatogr. A, 2012, 1268, 35–43 CrossRef CAS PubMed.
- Y. Wang, M. Hu, Y. Wang, J. Zheng, D. Shang, Y. Yang, Y. Liu, X. Li, R. Tang, W. Zhu, Z. Du, Y. Wu, S. Guo, Z. Wu, S. Lou, M. Hallquist and J. Z. Yu, The formation of nitro-aromatic compounds under high NO2 and anthropogenic VOC conditions in urban Beijing, China, Atmos. Chem. Phys., 2019, 19, 7649–7665 CrossRef CAS.
- M. Li, X. Wang, C. Lu, R. Li, J. Zhang, S. Dong, L. Yang, L. Xue, J. Chen and W. Wang, Nitrated phenols and the phenolic precursors in the atmosphere in urban Jinan, China, Sci. Total Environ., 2020, 714, 136760 CrossRef CAS PubMed.
- X. Li, Y. Wang, M. Hu, T. Tan, M. Li, Z. Wu, S. Chen and X. Tang, Characterizing chemical composition and light absorption of nitroaromatic compounds in the winter of Beijing, Atmos. Environ., 2020, 237, 117712 CrossRef CAS.
- C. Lu, X. Wang, J. Zhang, Z. Liu, Y. Liang, S. Dong, M. Li, J. Chen, H. Chen, H. Xie, L. Xue and W. Wang, Substantial emissions of nitrated aromatic compounds in the particle and gas phases in the waste gases from eight industries, Environ. Pollut., 2021, 283, 117132 CrossRef CAS PubMed.
- C. Leuenberger, M. P. Ligocki and J. F. Pankow, Trace organic compounds in rain. 4. Identities, concentrations, and scavenging mechanisms for phenols in urban air and rain, Environ. Sci. Technol., 1985, 19, 1053–1058 CrossRef CAS PubMed.
- M. P. Ligocki and J. F. Pankow, Assessment of adsorption/solvent extraction with polyurethane foam and adsorption/thermal desorption with Tenax-GC for the collection and analysis of ambient organic vapors, Anal. Chem., 1985, 57, 1138–1144 CrossRef CAS.
- J. Lüttke and K. Levsen, Phase partitioning of phenol and nitrophenols in clouds, Atmos. Environ., 1997, 31, 2649–2655 CrossRef.
- J. Lüttke, V. Scheer, K. Levsen, G. Wünsch, J. Neil Cape, K. J. Hargreaves, R. L. Storeton-West, K. Acker, W. Wieprecht and B. Jones, Occurrence and formation of nitrated phenols in and out of cloud, Atmos. Environ., 1997, 31, 2637–2648 CrossRef.
- S. Levshina, Petroleum products and phenols in snow cover in Khabarovsk, Southern Russian Far East, Water, Air, Soil Pollut., 2012, 223, 3553–3563 CrossRef CAS.
- J. Nagai, Y. Nakamura, S.-I. Ohira and K. Toda, Investigation of daily variation of atmospheric nitrophenols by means of inline Preconcentration-HPLC/MS analysis with large volume injection, Bunseki Kagaku, 2013, 62, 775–783 CrossRef CAS.
- K. L. Pereira, J. F. Hamilton, A. R. Rickard, W. J. Bloss, M. S. Alam, M. Camredon, M. W. Ward, K. P. Wyche, A. Munoz, T. Vera, M. Vazquez, E. Borras and M. Rodenas, Insights into the formation and evolution of individual compounds in the particulate phase during aromatic photo-oxidation, Environ. Sci. Technol., 2015, 49, 13168–13178 CrossRef CAS PubMed.
- D. Vione, V. Maurino, C. Minero, M. Duncianu, R.-I. Olariu, C. Arsene, M. Sarakha and G. Mailhot, Assessing the transformation kinetics of 2- and 4-nitrophenol in the atmospheric aqueous phase. Implications for the distribution of both nitroisomers in the atmosphere, Atmos. Environ., 2009, 43, 2321–2327 CrossRef CAS.
- D. Vione, V. Maurino, C. Minero, M. Lucchiari and E. Pelizzetti, Nitration and hydroxylation of benzene in the presence of nitrite/nitrous acid in aqueous solution, Chemosphere, 2004, 56, 1049–1059 CrossRef CAS PubMed.
- C. D. Simpson, M. Paulsen, R. L. Dills, J. L. Liu and D. A. Kalman, Determination of methoxyphenols in ambient atmospheric particulate matter: tracers for wood combustion, Environ. Sci. Technol., 2005, 39, 631–637 CrossRef CAS PubMed.
- C. M. G. Salvador, R. Tang, M. Priestley, L. Li, E. Tsiligiannis, M. Le Breton, W. Zhu, L. Zeng, H. Wang, Y. Yu, M. Hu, S. Guo and M. Hallquist, Ambient nitro-aromatic compounds – biomass burning versus secondary formation in rural China, Atmos. Chem. Phys., 2021, 21, 1389–1406 CrossRef CAS.
- A. Cecinato, V. Palo, D. Pomata, M. Scianò and M. Possanzini, Measurement of phase-distributed nitrophenols in Rome ambient air, Chemosphere, 2005, 59, 679–683 CrossRef CAS PubMed.
- B. C. Boring, Z. Genfa, P. K. Dasgupta, M. W. Martin and W. F. Smith, Field measurement of acid gases and soluble anions in atmospheric particulate matter using a parallel plate wet denuder and an alternating filter-based automated analysis system, Anal. Chem., 2002, 74, 1256–1268 CrossRef PubMed.
- Z. Genfa, S. Slanina, B. C. Boring, P. Jongejan and P. K. Dasgupta, Continuous wet denuder measurements of atmospheric nitric and nitrous acids during the 1999 Atlanta Supersite, Atmos. Environ., 2003, 37, 1351–1364 CrossRef.
- M. Takeuchi, M. Izumi, M. Watanabe, H. Tanaka, T. Obata and K. Toda, Surface modified annular wet denuder for the collection of water-soluble trace gases, Anal. Methods, 2013, 5, 6071–6075 RSC.
- Y. Tian, H. Shen, Q. Wang, A. Liu, W. Gao, X. W. Chen, M. L. Chen and Z. Zhao, Online high temporal resolution measurement of atmospheric sulfate and sulfur trioxide with a light emitting diode and liquid core waveguide-based sensor, Anal. Chem., 2018, 90, 7843–7847 CrossRef CAS PubMed.
- K. Toda, S. Yunoki, A. Yanaga, M. Takeuchi, S.-I. Ohira and P. K. Dasgupta, Formaldehyde content of atmospheric aerosol, Environ. Sci. Technol., 2014, 48, 6636–6643 CrossRef CAS PubMed.
- K. Mitsuishi, M. Iwasaki, M. Takeuchi, H. Okochi, S. Kato, S.-I. Ohira and K. Toda, Diurnal variations in partitioning of atmospheric glyoxal and methylglyoxal between gas and particles at the ground level and in the free troposphere, ACS Earth Space Chem., 2018, 2, 915–924 CrossRef CAS.
- M. Takeuchi, M. Namikawa, K. Okamoto, T. Oda, H. Tanaka, H. Okochi, K. Toda, K. Miura and H. Tanaka, Online analysis of water-soluble acidic gases and anions in particles at the southeastern foot of Mt. Fuji, Bunseki Kagaku, 2021, 70, 65–69 CrossRef CAS.
- K. Toda, Trends in atmospheric trace gas measurement instruments with membrane-based gas diffusion scrubbers, Anal. Sci., 2004, 20, 19–27 CrossRef CAS PubMed.
- Dionex, Determination of phenols in drinking and bottled mineral waters using online solid-phase extraction followed by HPLC with UV detection, Dionex Application Note 191, Thermo Scientific, 2008 Search PubMed.
- R. Belloli, B. Barletta, E. Bolzacchini, S. Meinardi, M. Orlandi and B. Rindone, Determination of toxic nitrophenols in the atmosphere by high-performance liquid chromatography, J. Chromatogr. A, 1999, 846, 277–281 CrossRef CAS.
- L. Ganranoo, S. K. Mishra, A. K. Azad, A. Shigihara, P. K. Dasgupta, Z. S. Breitbach, D. W. Armstrong, K. Grudpan and B. Rappenglueck, Measurement of nitrophenols in rain and air by two-dimensional liquid chromatography-chemically active liquid core waveguide spectrometry, Anal. Chem., 2010, 82, 5838–5843 CrossRef CAS PubMed.
- M. Miró, A. Cladera, J. M. Estela and V. c. Cerdà, Dual wetting-film multi-syringe flow injection analysis extraction, Anal. Chim. Acta, 2001, 438, 103–116 CrossRef.
- K. Nojima and C. Isogami, Studies on photochemical reactions of air pollutants. XIII. Formation of nitrophenols by the reactions of three toluene oxides with nitrogen dioxide in air, Chem. Pharm. Bull., 1994, 42, 2426–2429 CrossRef CAS.
- R. I. Olariu, I. Barnes, I. Bejan, C. Arsene, D. Vione, B. Klotz and K. H. Becker, FT-IR product study of the reactions of NO3 radicals with ortho-, meta-, and para-cresol, Environ. Sci. Technol., 2013, 47, 7729–7738 CrossRef CAS PubMed.
- K. Nojima, A. Kawaguchi, T. Ohya, S. Kanno and M. Hirobe, Studies on photochemical reaction of air pollutants. X. Identification of nitrophenols in suspended particulates, Chem. Pharm. Bull., 1983, 31, 1047–1051 CrossRef CAS.
- R. Atkinson, S. M. Aschmann and J. Arey, Reactions of hydroxyl and nitrogen trioxide radicals with phenol, cresols, and 2-nitrophenol at 296 +/- 2 K, Environ. Sci. Technol., 2002, 26, 1397–1403 CrossRef.
- R. I. Olariu, B. Klotz, I. Barnes, K. H. Becker and R. Mocanu, FT–IR study of the ring-retaining products from the reaction of OH radicals with phenol, o-, m-, and p-cresol, Atmos. Environ., 2002, 36, 3685–3697 CrossRef CAS.
- M. Harrison, S. Barra, D. Borghesi, D. Vione, C. Arsene and R. Olariu, Nitrated phenols in the atmosphere: a review, Atmos. Environ., 2005, 39, 231–248 CrossRef CAS.
- E. Bolzacchini, M. Bruschi, J. Hjorth, S. Meinardi, M. Orlandi, B. Rindone and E. Rosenbohm, Gas-phase reaction of phenol with NO3, Environ. Sci. Technol., 2001, 35, 1791–1797 CrossRef CAS PubMed.
- USEPA, 4-nitrophenol, EPA CompTox Chemicals Dashboard, https://comptox.epa.gov/dashboard/chemical/properties/DTXSID0021834, accessed May 30, 2022 Search PubMed.
- USEPA, 2-nitrophenol, EPA CompTox Chemicals Dashboard, https://comptox.epa.gov/dashboard/chemical/properties/DTXSID1021790, accessed May 30, 2022 Search PubMed.
Footnote |
| † Electronic supplementary information (ESI) available. See https://doi.org/10.1039/d2ea00021k |
| This journal is © The Royal Society of Chemistry 2022 |

