
 Open Access Article
 This Open Access Article is licensed under a Creative Commons Attribution-Non Commercial 3.0 Unported Licence
Linking the chemical composition and optical properties of biomass burning aerosols in Amazonia†
Milena
Ponczek
 *a,
Marco A.
Franco
a,
Samara
Carbone
b,
Luciana V.
Rizzo
c,
Djacinto
Monteiro dos Santos
af,
Fernando G.
Morais
a,
Alejandro
Duarte
d,
Henrique M. J.
Barbosa
ae and
Paulo
Artaxo
*a
*a,
Marco A.
Franco
a,
Samara
Carbone
b,
Luciana V.
Rizzo
c,
Djacinto
Monteiro dos Santos
af,
Fernando G.
Morais
a,
Alejandro
Duarte
d,
Henrique M. J.
Barbosa
ae and
Paulo
Artaxo
*a
aInstitute of Physics, University of São Paulo, Rua do Matão, Travessa R, 187, São Paulo, SP 05508-900, Brazil. E-mail: milenapon@gmail.com; artaxo@if.usp.br
bInstitute of Agrarian Sciences, Federal University of Uberlandia (UFU), Av. Amazonas, Uberlândia, MG 38405-302, Brazil
cFederal University of São Paulo, Av. Conceição, 329, Diadema, SP 09920-000, Brazil
dFederal University of Acre, BR. 364 km 4, Distrito Industrial, 69915-900 – Rio Branco, AC, Brazil
eDepartment of Physics, University of Maryland Baltimore County, Baltimore, MD, USA
fDepartment of Meteorology, Federal University of Rio de Janeiro, 21941-916, Rio de Janeiro, RJ, Brazil
First published on 10th December 2021
Abstract
Biomass burning emissions in Amazonia change the atmospheric composition and aerosol properties during the dry season. We investigated fine-mode aerosol chemical composition and optical properties with an intensive field experiment in the dry-to-wet season transition in 2018 in Southwestern Amazonia. Aerosol composition and physical properties were measured using ACSMs, aethalometers, nephelometers, SMPSs, and CPCs. PM1 mass concentrations showed a mean value of 12.4 ± 10.1 μg m−3. Organic matter was the major constituent of PM1, contributing more than 75%, whereas black carbon (BC) contributed ∼15%, and inorganics were less than 10%. The organic fraction of PM1 was apportioned by positive-matrix factorization (PMF), resolving 4 organic aerosol (OA) factors: two oxygenated OAs (OOA-1 and OOA-2), one hydrocarbon-like (HOA), and one biomass burning OA (BBOA). A low single scattering albedo (637 nm) of 0.77 ± 0.08 was observed, suggesting a significant absorption material. BC and brown carbon (BrC) contributions to the absorption coefficient (470 nm) were retrieved, and BrC corresponded, on average, to 20% of total absorption. The mass scattering (MSE) and absorption efficiencies (MAE) of PM1 particles were determined by multilinear regression (MLR), using the PMF factors as predictor variables. Overall, organic aerosols showed significant light absorption in the UV-vis wavelength range and strong spectral dependence indicating the presence of organic species that act as BrC, predominantly associated with biomass burning OAs. Our results emphasize the need for a better understanding of links between aerosol composition and optical properties, including the absorption spectra of BrC in the Amazon.
Environmental significanceWildfires emit a variety of compounds both in gas and particulate phases that have implications on atmospheric composition and climate. From field observations, we investigated the correlations between aerosol chemical composition and optical properties by reconstructing the absorption and scattering coefficients from the mass concentration of PM1 components and calculating chemically resolved mass absorption and scattering efficiencies. The contribution of brown carbon to the absorption coefficient was also explored, evaluating its spectral dependence and estimating its absorption efficiency at different wavelengths. Our results reveal the important aspects of how biomass burning emissions alter the physicochemical properties of aerosols and, in turn, disturb the natural characteristics of emissions from the Amazon rainforest, which can influence the regional and global climate. |
1. Introduction
Aerosol and trace gas concentrations in the Amazonian region show a well-pronounced seasonality, alternating periods close to pristine conditions during the wet season and periods of high concentrations in the dry season.1 During the wet season, the aerosol fine mode (<2 μm) concentrations range from 1–3 μg m−3, whereas during the dry season, it raises to values in the order of 20–30 μg m−3, due to biomass burning activities, mainly for deforestation and pasture clearing.2,3 In terms of composition, the aerosols are composed of organic carbon (OC) with 80% to 90% of the total mass, with the remaining 10 to 20% composed of elemental carbon (EC) and water-soluble inorganic salts (such as sulfates, nitrates, and chlorides). Other inorganic components (e.g., K, P, and Zn) and crustal elements (e.g., Al, Si, Fe, Ti, and Mn) show up in low concentrations in the absence of episodic African mineral dust inputs.3In addition to seasonal variability, particle concentrations are also modulated by the location and the extent of the influence of in-basin biomass burning. The so-called deforestation arc, a region in the southern Brazilian Amazonian boundary that begins in the southeast of Pará and goes towards the state of Acre, is experiencing intense pressure for land-use change as it shapes the agricultural borders that over the years advance towards the forest.4 Along with deforestation, there is an increase in fire occurrence all over this region, resulting in strong biomass burning (BB) emission of gases and particles.5 Deforestation and biomass burning is modifying the hydrological cycle impacting precipitation rates and river flows.6–8 Understanding how deforestation and biomass burning affect the atmospheric composition is essential to evaluate their consequences on climate and human health.2,3
Previous studies carried out in the dry season in Amazonia have shown the predominant influence of seasonal fires.9–12 In the dry season, the concentrations of trace gases such as ozone and nitrogen dioxide are three and seven times higher than what is observed during the wet season, while the aerosol load increases by a factor of 10.9 Thus, some important field campaigns have addressed several aspects of atmospheric composition in the dry season.13–15 However, little attention has been given to the relationship between the aerosol chemical characterization and physical parameters that are important in the regional aerosol radiative forcing.16,17
Aerosols directly interact with incoming solar radiation by scattering and absorbing radiation. Scattering by atmospheric aerosols has a cooling effect on climate, while light absorption by these particles has a warming influence.18 Furthermore, aerosols also affect cloud nucleation properties and might modify the formation of cloud droplets and ice crystals. The size, shape, and elemental composition of aerosol particles are key properties that influence both their radiative effects and their role as cloud condensation nuclei (CCN).19
Mineral dust and elemental carbon have been considered as the main aerosol components that absorb efficiently a fraction of incident radiation, while the real absorption contribution of organic aerosols (OAs) has been neglected. This assumption is generally employed in global climate models that disregard the contribution of OAs to UV-vis light absorption.20 However, more recently, the absorbing nature of organic carbon particles has become an important part of total absorption, especially for biomass burning aerosols.21–23
The term “brown carbon” (BrC) has been qualified to describe the organic carbon component that absorbs radiation efficiently in the near-UV (300–400 nm) and visible ranges.24 Quantifying the contribution of BrC to the absorption of light in addition to the black carbon (BC) component is important to account for its contribution to radiative forcing and, consequently, to the Earth's radiative balance. In addition, both BC and BrC have indirect radiative effects as once immersed in cloud droplets, they absorb light facilitating water and cloud droplet evaporation.24 During combustion, thermal decomposition and pyrolysis of compounds found in plants, such as lignin, tannins, etc., can release BrC. Thus, BB is an important source of primary BrC,25 as well as precursors that produce secondary organic aerosols (SOAs) that absorb light. Moreover, the composition and optical properties of BrC evolve during its atmospheric life cycle, resulting in the processes of “whitening” or “darkening”, decreasing or increasing the ability to absorb UV and visible light.26,27 While bleaching has been observed through photochemical processing, browning is associated with reactions with NO3 radicals and other non-reactive processes.28,29
In this study, a two-month field campaign was conducted during the dry season in Rio Branco, Southwestern Amazonia, where detailed aerosol physical, chemical, and optical properties were assessed. The connection between optical properties and chemical composition and how they evolve with atmospheric processing is explored by (1) calculating the mass scattering and absorption efficiencies attributed to each chemical component relevant to PM1 and presenting their spectral dependence; (2) reconstructing the absorption and scattering coefficients from the mass concentration of the PM1 components and attributing their relative importance to the total scattering and absorption; (3) finally, we estimate the contribution of BrC to the total absorption of the fine fraction of aerosols by two independent methods, showing that both yield equivalent results.
2. Experimental
2.1. Site description
The aerosol and trace gas sampling was carried out at the campus of the Federal University of Acre (UFAC) (9° 57′15.64′′S, 67° 51′49.36′′ W), in the urban area of Rio Branco between August and November 2018. The city has 401![[thin space (1/6-em)]](https://www.rsc.org/images/entities/char_2009.gif) 000 inhabitants,30 is surrounded by agricultural activities, and is strongly impacted by regional biomass burning emissions. There are no major industrial sources nearby. Fig. 1 shows the location of Rio Branco and the sampling site.
000 inhabitants,30 is surrounded by agricultural activities, and is strongly impacted by regional biomass burning emissions. There are no major industrial sources nearby. Fig. 1 shows the location of Rio Branco and the sampling site.
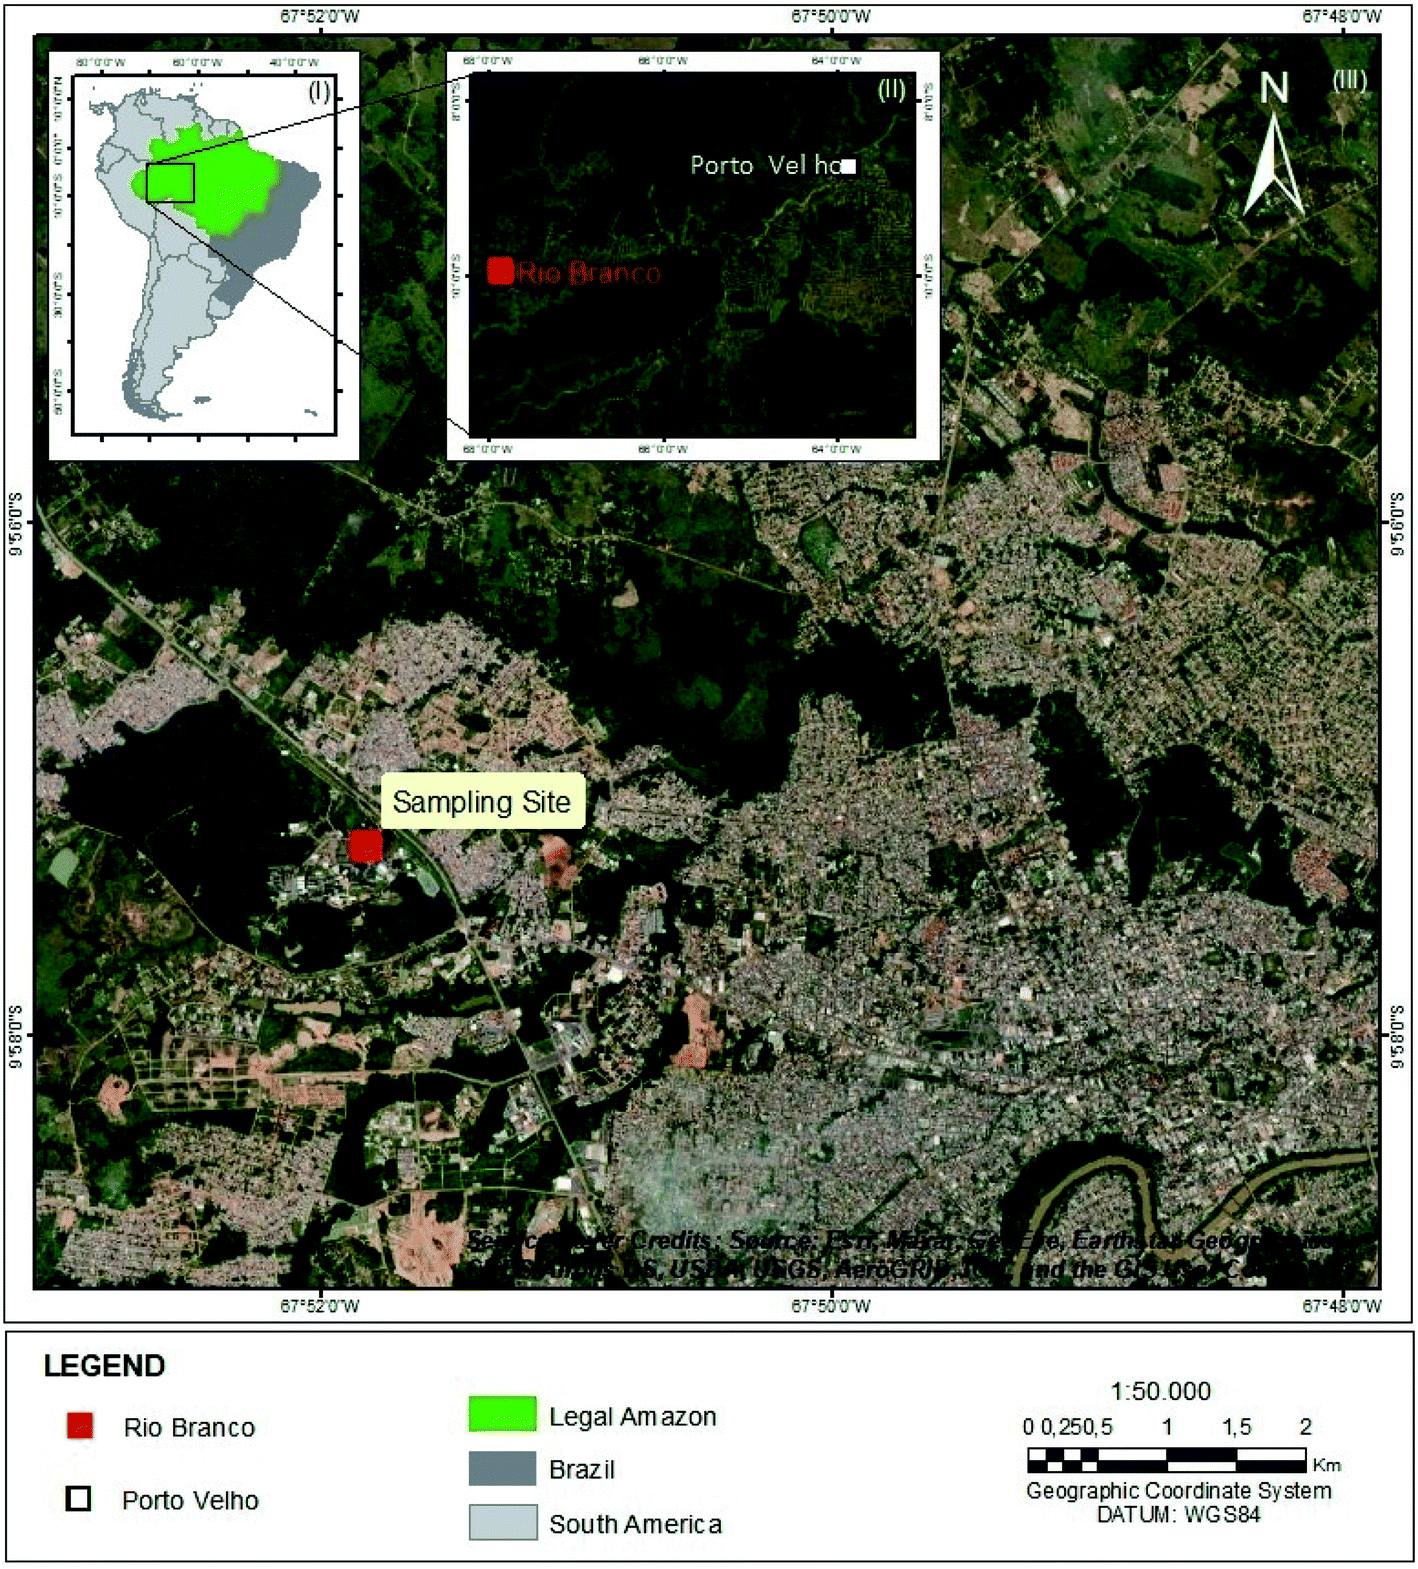 | ||
| Fig. 1 The sampling site location in the city of Rio Branco, Acre, Brazil. (I) The Brazilian legal Amazon contour in green, with the (II) inset showing Rio Branco and Porto Velho, the state capitals of Acre and Rondônia, respectively, and biggest cities in the region, and (III) the city of Rio Branco indicating the geographical location of the sampling site. Underlying map service is credited to Esri, Maxar, Geo Eye, Earth tar Geographics, CNES/Airbus DS, USDA, USGS, AeroGRID, IGN, and GIS User Community. | ||
The climate in the state of Acre is typical of the Amazonian Basin, equatorial, hot and humid with high temperatures all over the year. However, there is an alternation between two climatic seasons: a wet season when there is abundant rain, and a dry season, with less abundant rain. Usually, in Acre, the dry season occurs between June and August, and the rainy season, between October and April. September and May are transitions between the two seasons. According to Duarte, (2006),31 who reports climatology for Acre from 1971–2000, the highest temperatures occur between August and October. During the dry season, the atmospheric pressure is relatively high, and therefore cold fronts only eventually influence the region. Winds at 10 m a.g.l. are usually light with speeds not exceeding 3 m s−1, although in short storms gusts can reach between 20 and 30 m s−1. In addition, during the dry season, winds prevail from south, southeast, and east, while in the rainy season, the winds from north and northwest predominate. The dry period is characterized by precipitation rates of around 42 mm per month and lower relative humidity (∼81.4%), with average temperatures ranging around 23–25 °C, maximum between 30 °C and 32 °C and minimum between 17 °C and 18 °C.31 The months of August to November 2018 can be considered typical of the local weather. There was no occurrence of El Niño or major climatic extremes, and temperature and relative humidity during the campaign period were 26.5 ± 4.3 °C and 76.9 ± 15.9% (see Fig. SI1).†
2.2. Aerosol measurements
The field campaign was performed during the dry-to-wet transition period in 2018, from August 28th to November 4th. Meteorological parameters (temperature, relative humidity, and atmospheric pressure) were acquired by an AMES meteorological station (model AMS TPR 159). They were cross-checked with data from the National Institute of Meteorology (INMET), which operates a meteorological station on the UFAC campus.Aerosol sampling was performed using a PM2.5 isokinetic inlet impactor (Sharp Cut Cyclone) at 6 m above the ground, on the top of a two-floor building, with a total flow rate of 16.7 L min−1. The total flow was divided with a 4-way splitter (Flow Splitter 3708 TSI) to separate sampling lines that go to the instruments placed in an air-conditioner temperature-controlled laboratory. Three diffusion dryers (Magee Scientific Sample Stream Dryer) maintained the sampled air under dry conditions at constant RH ∼ 40%. All concentrations are reported at standard temperature and pressure (STP, 273.15 K, and 1013.25 hPa, respectively).
Real-time aerosol light absorption (σabs) and scattering (σscat) coefficients were measured using a Magee Scientific Aethalometer model AE33 and an Air Photon three-wavelength integrating nephelometer (model IN101), respectively. The AE33 operated at seven wavelengths (370, 470, 520, 590, 660, 880, and 950 nm) and the nephelometer at three wavelengths (450, 532, and 632 nm). The aerosol absorption coefficients were calculated taking into account corrections for artifacts such as multiple scattering effects and filter-loading effects. The correction applied here has already been described in detail by Saturno et al. (2018),32 Saturno et al. (2017),33 and Rizzo et al. (2011);34 briefly, a period sampled with MAAP was used as a reference measure to correct for multiple scattering effects, and then, retrieve the σabs through a log – adjustment to aethalometer data. Corrections for filter loadings are not necessary, as the AE33 model uses dual-spot technology that already takes this effect into account. Therefore, the black carbon equivalent concentration (herein referred to as BC) was retrieved from the corrected Aethalometer data.
Based on particle scattering and absorption measurements, scattering Ångström exponents (SAEs) and absorption Ångström exponents (AAEs) were calculated from the three wavelengths measured with the nephelometer and from the 6 wavelengths (370 to 880 nm) with the aethalometer. A linear fit over the log–log scattering and absorption spectra was performed, where the SAE and AAE are the angular coefficients:
| ln(σscat or abs,λ) = −(SAE or AAE)ln(λ) + ln(c) | (1) |
After calculating the SAE and AAE, the spectra were interpolated to obtain σscat and σabs at 637 nm. The particle scattering and absorption coefficients were used to calculate the dry aerosol single scattering albedo (SSA) at 637 nm using eqn (2):
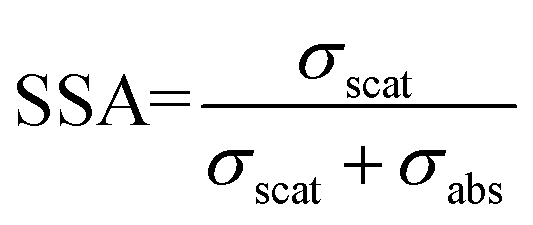 | (2) |
The aerosol size distribution (in the size range of 10 to 430 nm) was measured every 2 minutes by using an SMPS (Scanning Mobility Particle Sizer, TSI, model 3082) using an electrostatic classifier (TSI, model 3080) coupled with a CPC (Condensation Particle Counter, TSI, model 3772). Multiple charge correction was applied by using TSI software. A second CPC (TSI, model 3772) was run in parallel and was used for independent counting of total particle number concentration. The intercomparison of SPMS and CPC particle concentration measurements was used for data validation.
An aerosol chemical speciation monitor (ACSM, Aerodyne Research Inc) was deployed for online monitoring of the chemical composition of non-refractory submicron aerosols (NR-PM1 for organics, nitrate, sulfate, ammonium, and chloride) with a time resolution of 30 minutes. The instrument is composed of a system of aerodynamic lenses that focus particles in the range of 75 to 650 nm in a narrow beam which is transmitted into the detection chamber onto a 600 °C vaporizer. Particles are then flash vaporized under a high vacuum, ionized by electron impact at 70 eV, and detected with a quadrupole mass spectrometer. The ACSM measured the mass-to-charge ratio (m/z) from 10 to 140 arbitrary mass unity (amu).
PM1 was calculated as the sum of NR-PM1 measured with the ACSM and BC derived from the Aethalometer. Intercomparison was made between the integrated mass concentration measured with the SMPS and the mass concentration PM1. The result is shown in the supplement material (Fig. 3 on SI).† The agreement between the mass concentrations measured by three different instruments gives us a level of confidence and quality in the data obtained. In addition, the results of the intercomparison suggest that the Collection Efficiency (CE) value of 0.5 used for the treatment of ACSM data was adequate for dry aerosols in our study.35
Ozone was monitored with a Thermo 49i analyzer and NO2 with a Cavity Attenuated Phase Shift (CAPS Aerodyne Research Inc) analyzer. Volatile Organic Compound (VOC) mixing ratios were measured with a quadrupole Proton-Transfer-Reaction Mass Spectrometer (PTR-QMS-500, Ionicon Analytik) operated under standard conditions (2.2 mbar drift tube pressure, 600 V drift voltage, drift temperature of 333 K, and E/N ∼ 127 Td), sampling through unheated PTFE tubing. VOC mixing ratios were calculated from previous calibration as detailed elsewhere.36 The gas sampling lines were unique to each instrument using PTFE tubes to avoid the intake of particles and prevent the condensation of volatiles in the lines. Trace gases results are shown in ESI, Section 2.†
Although the data acquisition frequency was different for each instrument (∼1 min for the aethalometer; ∼2 min for the SMPS; 30 min for the ACSM), all measurements were averaged and synchronized to a 30 min resolution.
2.3. Statistical methods
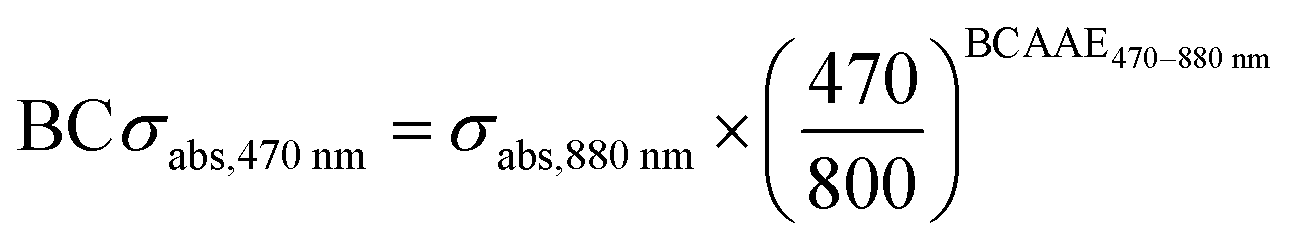
| σabs,470 nm = BCσabs,470 nm + BrCσabs,470 nm | (3) |
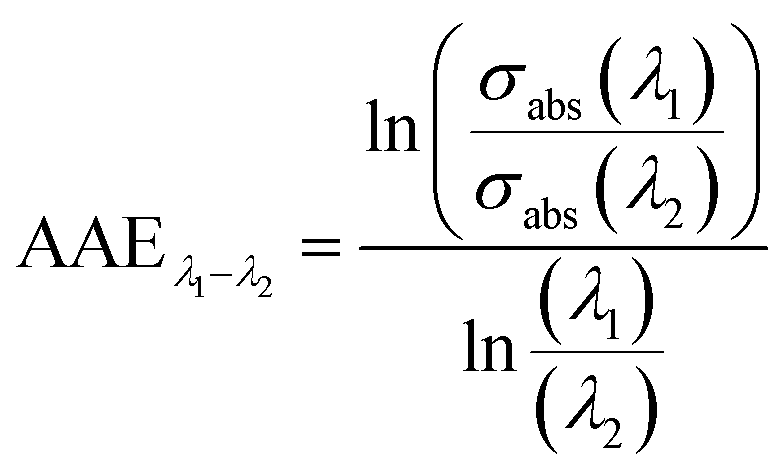
The methodology consists of first obtaining the BC absorption contribution to the total absorption coefficient and then, retrieving the BrC contribution, according to eqn (3). It considers that the wavelength dependency of the BC absorption component varies with the particle size, which implies that the BC AAE can assume values different from 1.41 This wavelength dependence is calculated considering 3 selected wavelengths which maximize the coverage of the light spectra from the near-ultraviolet (470 nm), in which the BrC component is more significant, the visible-red wavelength (660 nm), and the near-infrared (880 nm), where the BC plays a major role. Then, the wavelength dependence of absorption Ångström exponent (WDA) is defined as follows:
| WDA = AAE470–880 nm − AAE660–880 nm | (4) |
 | (5) |
Theoretical values for BCWDA, based on Mie theory, to retrieve AAE470–880 nm and AAE660–880 nm, were obtained considering polydisperse coated BC particles with different size distributions composed of an internally mixed monodisperse BC core, of the refractive index of 1.95–0.79i,42 a coat with a refractive index of 1.55–0.001i, which is typical for organic and inorganic non-absorbing aerosols41 and a BC density of 1.8 g cm−3.43 The coating size varied between 1 and 2 times the BC core, following Wang et al. (2016).41 To calculate the absorption contribution only due to the BC, we isolate the BCAAE660–880 nm term in the equation and using eqn (4), we obtain:
| BCAAE470–880 nm = BCWDA + AAE660–880 nm | (6) |
 | (7) |
| BrCσabs,470 nm = σabs,470 nm − BCσabs,470 nm | (8) |
The uncertainties of the methodology are discussed in detail elsewhere.41
The number of fire spots (and FRP, precipitation, temperature, radiation, etc.) that crossed the back-trajectories was taken into account, considering an area of 100 × 100 km around the point of the trajectory. Fire data were obtained from the FIRMS database, VIIRS NPP-375.45 The surface precipitation rate was obtained from the CMORPH (NOAA) database.46 We also used the wind direction and speed from ECMWF reanalysis ERA5 at 0.25° × 0.25° resolution.47 Specific details of the methodology are provided in the ESI.†
Considering that the sampling campaign in Rio Branco occurred during the dry season and transitioned to the rainy season, the campaign was divided into two periods. This division coincides with the end of the dry period marked by a high incidence of fire outbreaks and the beginning of a transition period which is characterized by an enhancement in precipitation rates and a lessening in fire outbreaks in the region. Therefore, period 1 was defined from the beginning of the campaign (on 08/22/2018) to 09/29/2018, and period 2, from 09/30/2018 to the end of the campaign (11/04/2018). Diurnal profiles, averages, and other statistics were calculated considering each period individually.
In Fig. 2, it can be observed that during period 1, there was a higher occurrence of fires in south and southeast Amazonia, especially in the states of Acre and Rondônia in Brazil and Bolivia. In contrast, in period 2, there was a significant decrease in fires in the before-mentioned region, while the east of the Amazon basin, in Pará and Maranhão, remained to have a high number of fire outbreaks. A video that shows on the map the trajectories and the active fire spots during each back-trajectory period is available in the ESI.†
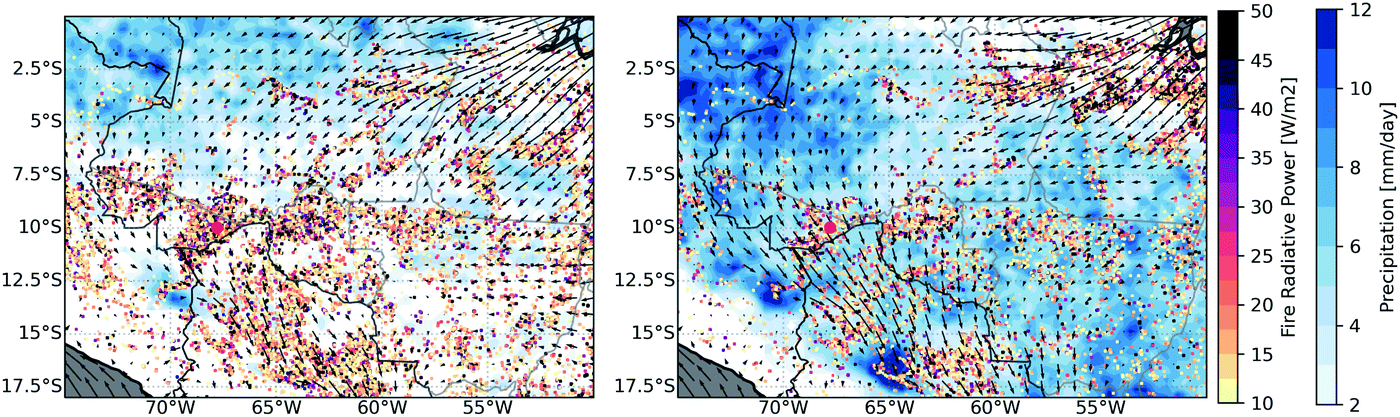 | ||
| Fig. 2 Fire spots and their fire radiative power (FRP, dots in the yellow to purple color scale), average daily precipitation (in mm per day, blue color), and average wind fields at 950 mbar (∼500 m altitude, vectors) for (left) period 1 and (right) period 2. The large red dot is the location of the experimental site. | ||
The relationship between the fire occurrences and the trajectories that reached the experimental site was also investigated. We accounted for the number of fire spots that crossed each back-trajectory for period 1 and period 2, as shown in Fig. SI5.† Overall, in period 1, the trajectories passed over many more active fires than in period 2, supporting the hypothesis that biomass burning is the predominant source of particulate material at this time of year. Moreover, in period 1, there is a significant increase in the number of close fires from ∼28 h before reaching the experimental site. In contrast, in period 2, the trajectories directly crossed fewer fire spots in the vicinity and only in the last 6 hours on their way to the site.
Typically, multilinear regressions assume externally mixed aerosols.48 However, the method can be applied assuming internally mixed aerosols as well.49 Malm and Kreidenweis50 discussed the influence of the mixing state of aerosols in the modeling of light scattering mentioning that the differences between the external and internal assumptions were generally less than 10%.
With the advent of aerosol mass spectrometry, several studies have taken advantage of this powerful instrumentation to integrate the physical properties and chemical composition of aerosols with a high temporal resolution despite the lack of information on the aerosol's mixing state.51,52 Using the PMF factors to retrieve the mass efficiencies for scattering and/or absorption of aerosols also has the advantage of considering chemical classes and not just singular compounds, taking into account emission loadings and atmospheric dynamics such as dispersion and processing.53–55 This approach reduces the collinearity between species, which coupled to the high time-resolution provides a large number of samples (when compared to more traditional filter-based techniques) making the regression coefficients more robust. Nevertheless, care must be taken as the multilinear regressions can be very sensitive to the choice of species included in the analysis.49
Only OAs and BC were considered relevant species for multilinear regression models since inorganic components had little contribution to PM1 (total relative mass contribution <10%) and attempts to include them in the model resulted in unrealistic mass efficiencies and statistically non-significant regression coefficients for both scattering and absorption.
Assuming that the scattering/absorption coefficients are a linear combination of aerosol components, we estimated the contribution of each PMF factor + BC for a single wavelength as:
| σ(scat/abs,λ nm) = aPMFFactor1 + bPMFFactor2 + cPMFFactor3 + dPMFFactor4 + eBC + ε | (9) |
The relative contribution of each chemical component was then estimated from the linear regression coefficients multiplied by their respective mass concentration to reconstruct the absorption and scattering coefficients.
3. Results and discussion
3.1. Aerosol composition
The total aerosol particle number and PM1 mass concentrations were, on average, 5000 ± 3000 cm−3 and 12.4 ± 10.1 μg m−3, respectively. Organic compounds dominated the composition of PM1 aerosol with an average of 9.15 μg m−3, which corresponds to 76% of PM1. Inorganic species sulfate, nitrate, ammonium, and chloride were observed at average concentrations of 0.25 μg m−3, 0.43 μg m−3, 0.27 μg m−3, and 0.06 μg m−3. Altogether, inorganic species represented less than 10% of PM1, in agreement with previous studies on fine mode chemical composition in the Amazonian dry season.11,14BC showed an average concentration of 2.2 μg m−3, accounting for 15% of PM1 mass. Measurements in the dry season of 1999 in a pasture area in the southwestern Amazon reported a BC average of 3.6 μg m−3 and a total fine mode concentration (total PM2.5) of 66.9 μg m−3,15 which is almost 6 times higher than that in Rio Branco. In contrast, Brito et al. (2014)13 reported particle number concentrations around 5700 cm−3, average PM1 mass concentrations of 13.7 μg m−3 and BC of 1.30 μg m−3 at Porto Velho, Southwestern Amazonia, in the dry season,13 which are in the same range of aerosol concentrations found in our study.
From the time series for PM1 component mass concentration and its relative mass fractions (Fig. 3a and b), we note that the relative aerosol composition remains almost unchanged throughout the campaign. However, the absolute concentration significantly decreased at the end of September which corresponds to the period in which fire outbreaks decline and there is a concomitant increase in precipitation in the vicinity of Rio Branco (Fig. 3f).
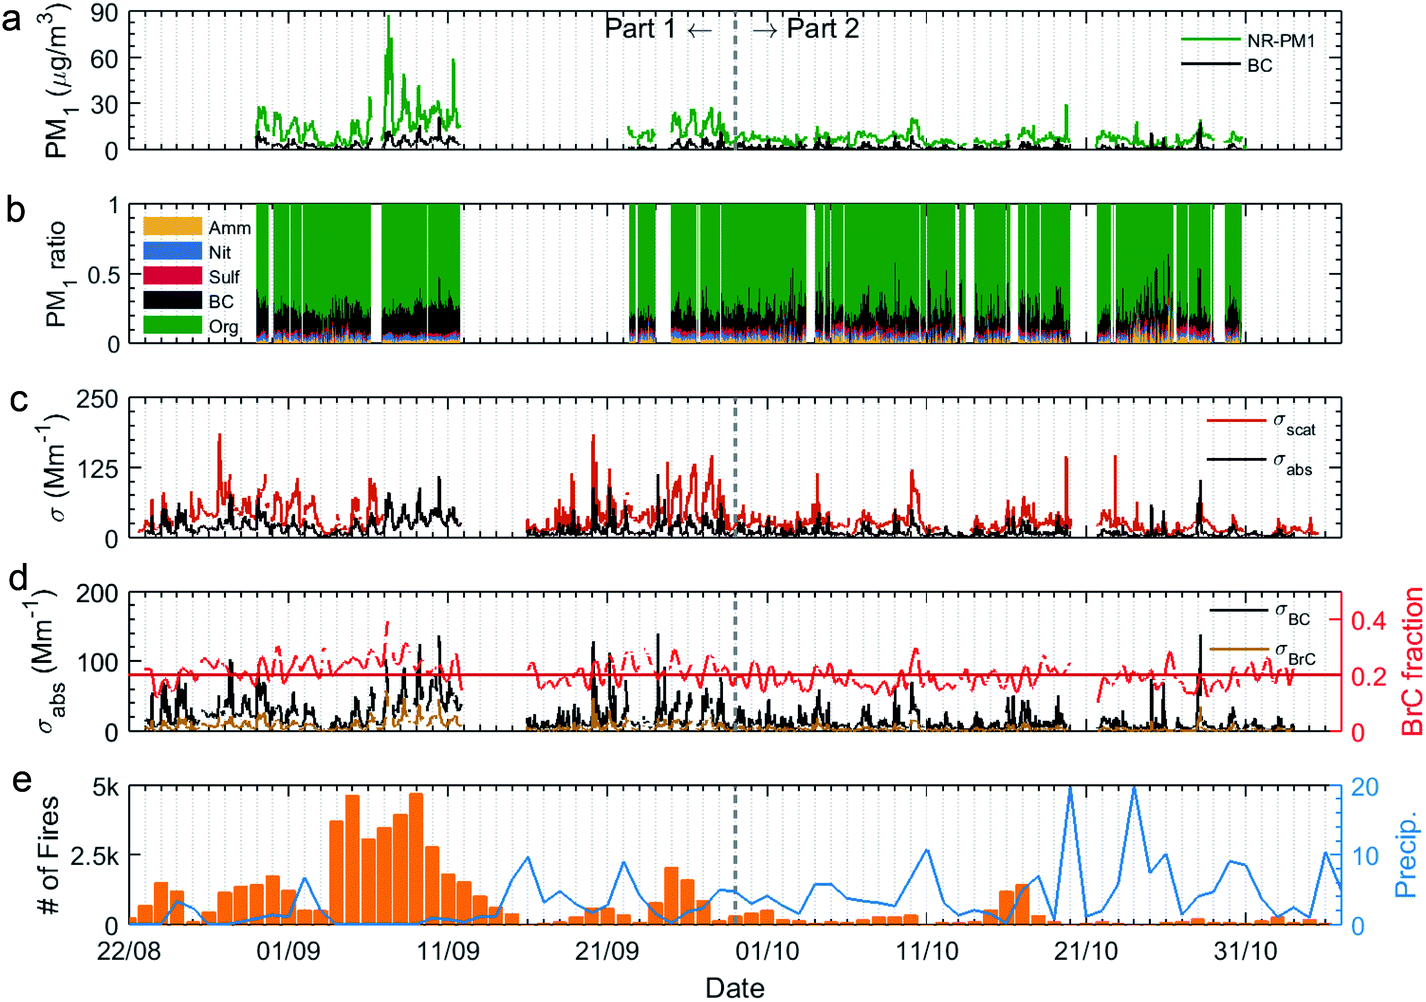 | ||
| Fig. 3 Time series for aerosol mass, BC, optical properties, and number of fire spots. (a) NR-PM1 (Org, Sulfate, Nitrate, and Ammonium) and BC chemical composition mass concentration in μg m−3 and (b) PM1 relative mass fractions, (c) scattering and absorption coefficients at 637 nm in Mm−1, and (d) black and brown carbon absorption coefficients at 470 nm (left axis) in Mm−1 and BrC fraction to total absorption. 6 h moving average was applied on the BrC fraction time-series, and the straight line is the BrC fraction mean value and (e) the number of fire spots and daily precipitation (mm per day) in the region surrounding Rio Branco. Both the number of fire spots and precipitation were calculated within the area of −11 to −8 N, −70.5 to −63 W, which encompasses the municipality of Rio Branco. | ||
There was also a change in the daily pattern of the PM1 components (Fig. SI10†), suggesting two different regimes: before and after September 29th, 2018, with a considerable decrease in the absolute mass concentration of PM1. Also remarkable is the increase in aerosol concentrations in the week from September 7th to 12th when organics reached concentrations of 79.0 μg m−3 and BC of 21.2 μg m−3. During this period, the daily averages of total PM1 mass concentration exceeded the World Health Organization (WHO) air quality standards of 25 μg m−3 for PM2.5.
Aerosol optical properties such as scattering and absorption coefficients had average values of 32 ± 24 and 10 ± 10 Mm−1 at 637 nm, respectively (Fig. 3c). It is also observed from the optical property time series that they followed the same trend of PM1 concentration, substantially decreasing their absolute values after September 29th. The contribution of BrC to the total absorption coefficient at 470 nm was estimated, as described in the methodology (Sec. 2.3). In general, the ratio of BrC to total absorption (σabs BrC/σabs) ranged between 16 and 25% (considering the interquartile range (IQR)). Similarly, although applying a slightly different approach, Saturno et al. (2018)32 obtained a BrC contribution at 370 nm of 17–29% (IQR) to the total absorption coefficient at a pristine site in Central Amazonia which is equivalent to the lower contributions of BrC at 470 nm wavelength. The BrC fraction calculated from the absorption coefficient measured with the AE33 is also in agreement with the BrC fraction retrieved from the sunphotometer from NASA's Aerosol Robotic Network (Aeronet) (shown in Fig. SI8 in the ESI†). The BrC fraction for the historical series from 2000 to 2017 has a median of 18%, oscillating between quartiles (5th and 95th) of 0 and 40%. It is important to mention that the Aeronet BrC calculations considered the months from July to October, which consists of the dry season and the beginning of the transition to the wet season and therefore includes meteorologic conditions similar to those of the campaign reported herein. Our values are also comparable to those of Wang et al. (2016),41 which were reported for BrC contributions to light absorption retrieved from Aeronet for South America.
The influence of biomass burning emissions can be seen in Fig. 4, which shows the organic fragment ratios f44 vs. f60. The f44 is correlated with the O:C ratio and therefore represents oxygenated organic compounds (considering CO2+ at the m/z 44 fragment as a proxy), while f60 consists of fragments of levoglucosan and is considered a BB tracer. This representation establishes an f60 threshold of 0.003 (vertical dashed line) for the influence of fresh biomass burning emissions.56 The relative concentration of biomass tracers (f60) increased with the aerosol loading. Between August and September (blue and green points), f60 exhibited higher values, while in October (orange to red points), it gradually decreased, ranging close to the limit of 0.3%. Conversely, f44 showed an opposite behavior enriching its relative contribution and indicating that the aerosol became more oxygenated from the dry season towards the wet transition. It is worth noting that f44 presented relatively high values (≥0.1 for the entire study) compared, for instance, to other studies in Amazonia, such as in Porto Velho, where f44 was >0.05,12 and in Manaus city vicinities, where f44 was in the range of 0.05–0.25.54
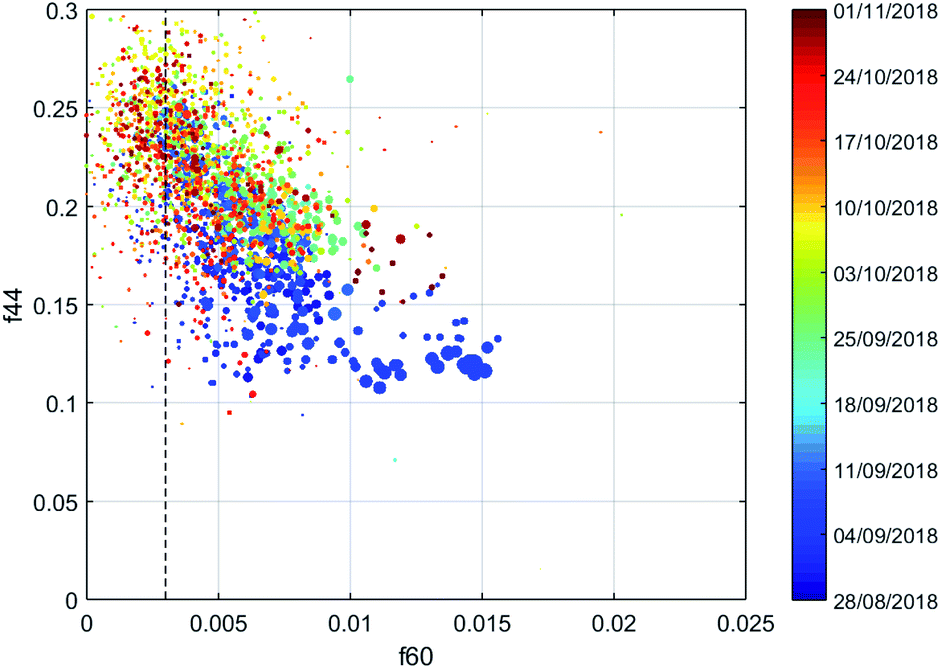 | ||
| Fig. 4 Mass fractions f44 vs. f60 in the mass spectra of ambient OAs colored by time and dot size proportional to PM1 mass loading. The dashed line represents a considered threshold for negligible influence by biomass burning (f60 = 0.003). | ||
3.2. Organic aerosol source apportionment (PMF)
To evaluate the sources of PM1, the PMF approach analyzed the OA spectra. Details of the PMF analysis are presented in the ESI.† The four-factor solution was chosen as it satisfactorily represented the typical aerosol sources in this region, considering the correlations with external factors (inorganic components of PM1) and minimizing the total sum of squares of the scaled residuals. The factor mass spectra profiles (MS) and the time series of the factor loadings are shown in Fig. 5.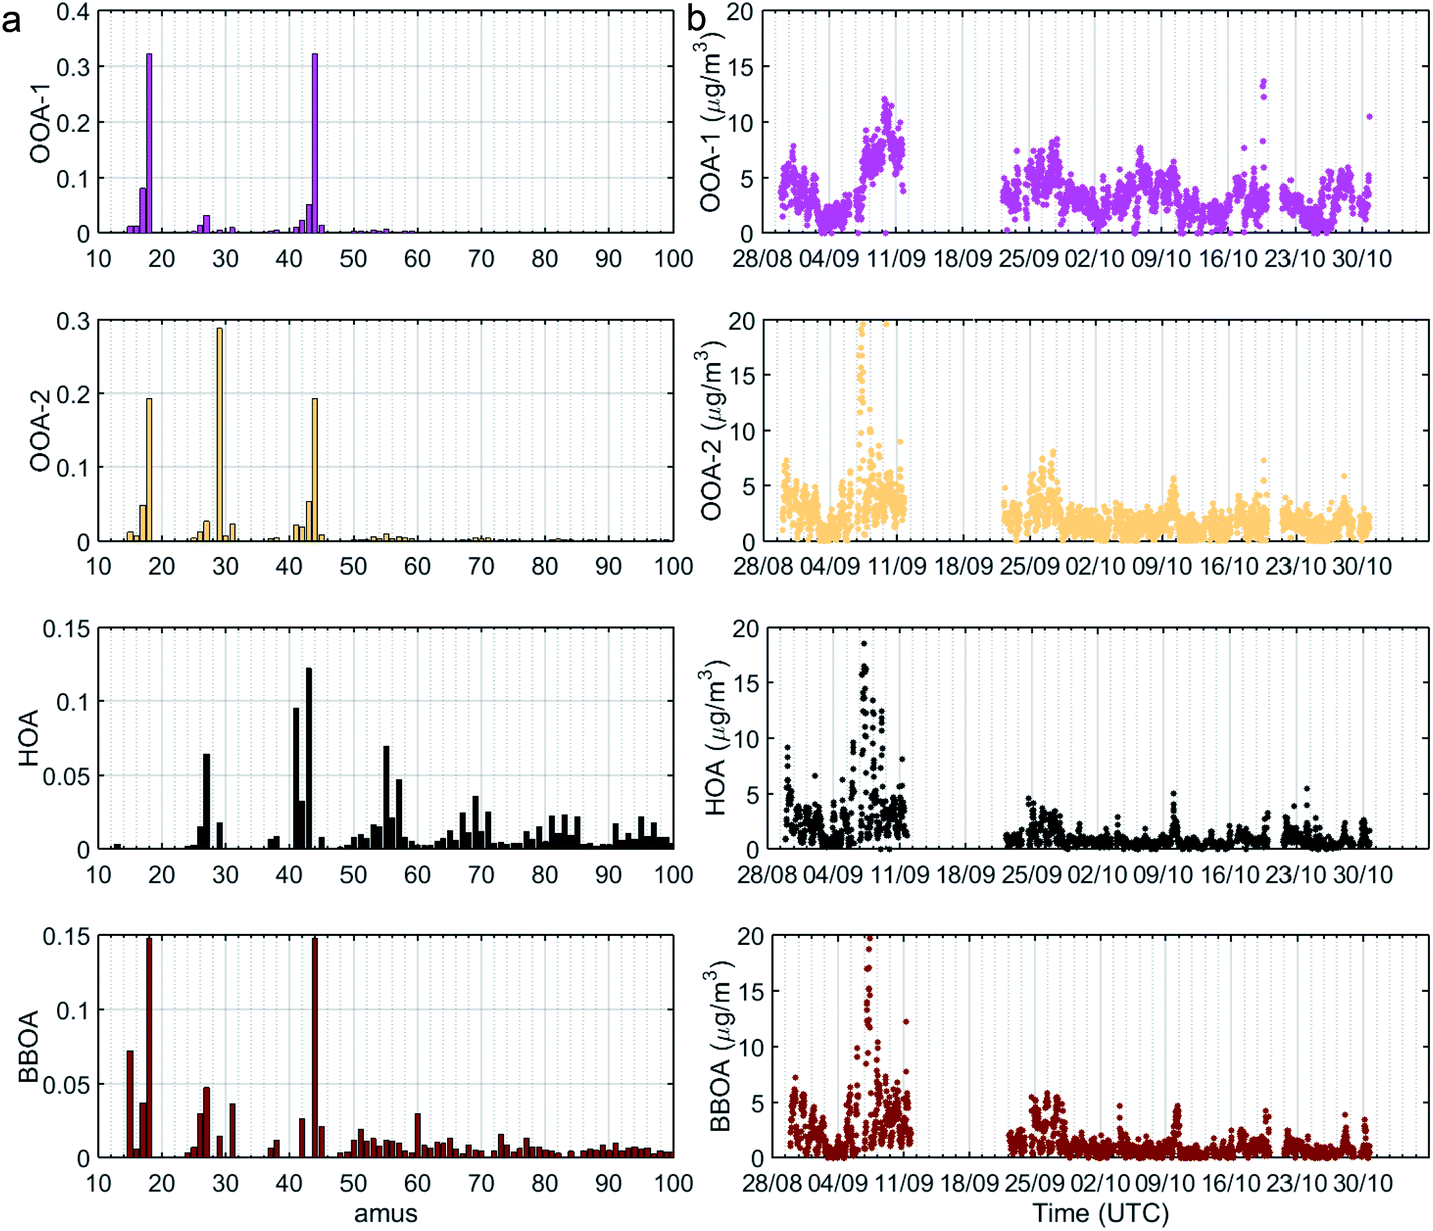 | ||
| Fig. 5 Results from the PMF analyses of ACSM OA data. (a) PMF factor mass spectra profiles and (b) PMF factor mass loading time series. | ||
The first factor identified was a biomass burning OA (BBOA) that represents relatively fresh biomass burning aerosols. It is characterized by the presence of m/z 60 (C2H4O2+) and 73 (C3H5O2+), arrised from levoglucosan and other sugars produced by the pyrolysis of cellulose, recognized as tracers of biomass burning emissions. Interestingly, there is some contribution from m/z 44 (CO2+) to this factor, suggesting the presence of oxygenated compounds.
The second factor identified is a hydrocarbon-like OA (HOA) that has a characteristic profile of low oxidation hydrocarbon emissions, indicated by the presence of fragments like m/z 41 (C3H5+), 43 (C3H7+), 55 (C4H7+), 57 (C4H9+), and 91. The double peaks separated by 14 amu are characteristic of the fragmentation of hydrocarbon molecules.57 We attribute this factor to anthropogenic-related sources since the site is within an urban environment, and emissions from fuels (vehicles, diesel generators, etc.) are expected.
In addition, two oxygenated organic aerosol (OOA) factors were identified. OOA-1 represents a regional source of oxygenated organic aerosols and is dominated by m/z 44 (CO2+) and m/z 18 (H2O+). Almost no signals were assigned to peaks above m/z 44. This factor shows the characteristic pattern expected for a low-volatile OOA (LVOOA) factor. Observing the time series of the OOA-1 factor loading, we can note that its variations are smooth in time, indicating effects from regional sources and processes.39 The OOA-1 factor is the dominant component and accounts for 40–50% of the OA fraction.
The last factor obtained was OOA-2. It presents prominent signals at m/z 44 (CO2+), m/z 18 (H2O+), m/z 29 (COH+ or C2H5+) and 43 (C2H3O+ and/or C3H7+). In terms of f44, this factor presents a lower value (19%) compared to OOA-1 (32%), suggesting that it is less oxygenated than OOA-1. This fact is also confirmed by the larger ratio between m/z 44 and 43 obtained for OOA-1, and the larger content of a less oxygenated fragment, m/z 29. Despite the similarities between OOA-2 and OOA-1 in terms of mass spectra, their time series do not present good agreement (R2 = 0.33). In fact, their diel profiles present very different behaviors in P1 and P2 (Fig. SI10†). The OOA-2 presents larger mass concentration values during the nighttime over P1, while over P2 no clear pattern can be observed.
Due to the low concentration of inorganic aerosols in general, including nitrates, instrumental artifacts such as the so-called Pieber effect58 were ruled out to explain the detection of overall high f44. Instead, we consider that local and regional emissions justify the significant presence of processed organic aerosols or even less aged OAs that contain oxygenated species in their composition. In chamber experiments, it has been observed that fresh particles emitted by biomass burning show a contribution of m/z 44 in its MS.59 Fang et al. (2017)60 showed that primary particles emitted by the burning of agricultural residues contained an average of 23% of oxygenated compounds. In both studies, the proportion of f44 progressively increases as a function of aging time. Accordingly, Timonem et al. (2013)61 found 2 well-defined factors related to BB for a field study in the spring in Helsinki, one of local influence, and the other of long-distance transport, whereas both BBOA factors had a significant contribution of oxygenated compounds.
Concerning the aerosol chemical species related to BB in the Amazon Basin, the fraction of water-soluble organic carbon in PM2.5 aerosols during the dry season is a complex mixture of oxygenated compounds.62 Graham et al. (2002)62 identified levels of levoglucosan as high as 6.9 μg m−3 and highly oxygenated compounds such as anhydrosugars, hydroxy acids, oxoacids, and polyalcohols in samples in the Amazon. Likewise, Claeys et al. (2002)63 characterized HULIS components from BB aerosol samples collected in Southwestern Amazonia identifying nitrocathechols as dominant components and also some minor components such as hydroxy dicarboxylic acids (such as terebic acid, terpenilyc acid, etc.).63 Considering the electron-impact ionization used in the ACSM technique, oxygenated biomass burning compounds are prone to fragment generating CO2+ ions at m/z 44.
Interestingly, Graham et al. (2002)62 observed an increase in the relative fraction of di/triacids and oxo-/hydroxy acids simultaneously to a decrease in anhydrosugars from the peak of the burning season towards the wet season. These findings are comparable to our PMF results, where we did observe significant contributions of oxygenated compounds (notably CO2+ ions), besides the gradual rise of the OOA relative fraction concomitant to BBOA reduction.
Possibly, part of the fresh BBOA was accounted for in the HOA factor, while the BBOA factor itself might be attributed to an aged fraction of BB aerosols, as was previously demonstrated by DeCarlo et al. (2010).64 They point out that the partition of primary-BBOA vs. secondary-BBOA is difficult. However, using the relationship between HOA and ΔCO, they estimated that 51% of the PMF HOA factor was attributable to urban sources and 49% to BB sources.64 The case reported is consistent with the observations in Rio Branco, mainly at the beginning of the campaign when there was a large influence of BB emissions on the total aerosol load.
3.3. Changes in aerosol chemical and optical properties associated with fire occurrence
The substantial difference in the number of fire spots in the vicinity of the site accompanied by the increase in precipitation (shown in Fig. 2 and SI5†) strongly influenced the aerosol load in the atmosphere and provided some insights that are consistent with the diurnal profiles (see Fig. SI10†). During period 1, the Rio Branco site was impacted by closer fires, whose emissions stayed trapped within the boundary layer, while in period 2, there may be a greater influence of regional emissions, arriving at different times in Rio Branco, when prominent diel cycles were less evident.There were major reductions in all absolute aerosol mass concentrations from period 1 to period 2, with total PM1 declining from 18.8 to 8.31 μg m−3, representing more than 2-fold (see Table SI2†). In a field experiment in Porto Velho, a substantial decrease in the aerosol concentrations during the transition from the dry to the wet season in 2012 was also observed,13 with a decrease in the OA concentration from 15.0 to 4.5 μg m−3, whereas, in Rio Branco, the mean concentration ranged from 13.8 to 6.15 μg m−3. The decrease in the absolute concentration of OA is accompanied by a change in the chemical characteristics of PMF components. As evidenced in Fig. 6a, between period 1 and period 2, the OOA contribution increased from 64% to 76% (if we consider the sum of OOA-1 and OOA-2). Meanwhile, the relative contribution of less processed oxygenated aerosols decreased, namely, BBOA, which went from 19% to 12%.
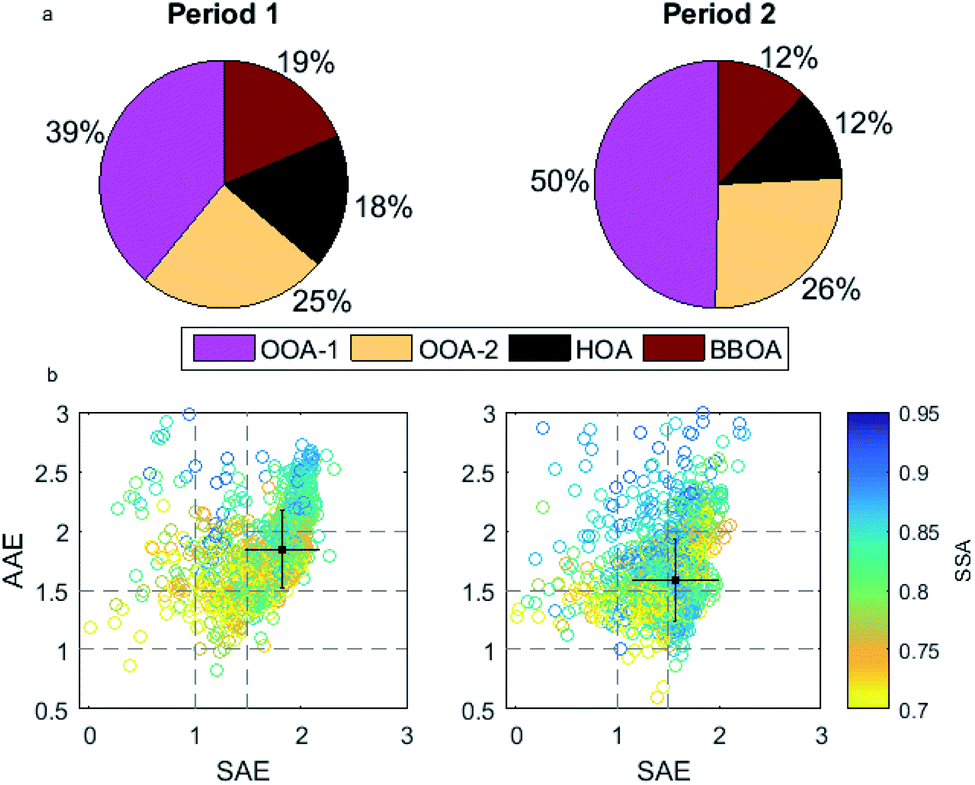 | ||
| Fig. 6 (a) The pizza plots depict the mean mass fraction of PMF factors for period 1 and period 2 time-series. (b) The Ångström matrix obtained in Rio Branco: Absorption Ångström Exponent (AAE) vs. Scattering Ångström Exponent (SAE) space, as proposed by Cazorla et al. (2013),21 colored according to single scattering albedo (SSA) values. | ||
Changes in chemical composition directly influenced the aerosol's intrinsic optical properties, as shown in Fig. 6b. The visualization of AAE vs. SAE space provides an overview of aerosol optical properties as an aerosol classification scheme21 and, in addition, data were colored according to the values of the single scattering albedo (SSA).
The AAE, which represents the aerosol absorption wavelength dependence, was almost always higher than 1. Median values were, respectively, 1.81 and 1.58 for period 1 and period 2. Higher values of the AAE imply stronger absorption at shorter (UV-vis) wavelengths, suggesting a stronger influence of non-BC light-absorbing particles. Meanwhile the SAE ranged from close to 0 up to 2.31, and medians were 1.79 and 1.57. As a comparison base, prior studies in the Central and Southwestern Amazon have reported similar values of 1.70 ± 0.4 for the dry season.15,65 The complete time-series of AAE and SAE are available in ESI Fig. SI11.†
In general, our measurements are in the AAE > 1.5 and SAE > 1.5 region, which features small, highly absorbent particles. AAE values above 1.5 can be identified as BrC contributions to submicron particle absorption,66 whilst our median values fall in the area considered as “mixed BC/BrC”21 (see Fig. 6b). However, a significant part of the measurements here is in the region of AAE > 2 and SAE > 1.5, described as aerosols strongly influenced by BrC,21 which for period 1, corresponds to 23% of observations and 9.7% for period 2.
At the ATTO site in Central Amazon, closer fires are more likely to bring aerosol particles rich in BrC.32 Similar behavior was observed in Rio Branco: peaks with a high BrC fraction were more frequent in period 1, strongly characterized by BB than in period 2. Comparing the number of measurements that had BrC fraction >0.29 (the 95th percentile for the whole campaign), in period 1, it occurred in 7.8%, while in period 2, it was only 3.6% of observations. The smaller contribution of BrC associated with the increase in aerosol oxidation in period 2 suggests bleaching of the BrC components as the aerosol is processed by atmospheric oxidation,67,68 compatible with BB transported from regions much further away (ESI Fig. SI5 and SI7).† This result agrees with the increase in the f44/f60 ratio shown in Fig. 4 and with the PMF results (Fig. 6) which indicates the contribution of 39% of OOA-1 in period 1, against 50% in period 2.
Table 1 summarizes the results for the aerosol optical properties in Rio Banco, including the intrinsic properties AAE, SAE, and SSA, and extrinsic properties, absorption, and scattering coefficients at 637 nm (the coefficients for the other wavelengths are presented in Table SI3 in the ESI).† Descriptive statistics for periods 1 and 2 were calculated separately. The absorption coefficients decreased by more than 60% at all the wavelengths, as shown in Table 1. The absorption coefficient at 637 nm, for example, went from 12 to 5 Mm−1 (median values), considerably higher than the values reported for forest sites in the Amazon, where absorption is typically below 4 Mm−1, even in the dry season.32,65
| Period 1 | Period 2 | |||||||
|---|---|---|---|---|---|---|---|---|
| Mean ± std | Max | Median | IQR | Mean ± std | Max | Median | IQR | |
| AAE | 1.83 ± 0.33 | 3.58 | 1.81 | 1.62–2.02 | 1.65 ± 0.35 | 3.65 | 1.58 | 1.41–1.82 |
| SAE | 1.67 ± 0.37 | 2.31 | 1.79 | 1.47–1.93 | 1.46 ± 0.42 | 2.25 | 1.57 | 1.35–1.7 |
| SSA (637 nm) | 0.76 ± 0.07 | 0.91 | 0.76 | 0.71–0.81 | 0.79 ± 0.08 | 0.91 | 0.81 | 0.74–0.85 |
| σ abs (Mm−1) 637 nm | 15 ± 12 | 112 | 12 | 6–21 | 7 ± 8 | 101 | 5 | 2–8 |
| f BrC (470 nm) | 0.22 ± 0.05 | 0.42 | 0.22 | 0.19–0.25 | 0.19 ± 0.05 | 0.37 | 0.18 | 0.15–0.22 |
| σ Scat (Mm−1) 637 nm | 43 ± 28 | 185 | 36 | 20–59 | 23 ± 15 | 146 | 21 | 13–28 |
Nevertheless, the observed range of absorption coefficients in Rio Branco is similar to previously reported values for the dry season and transition to the wet season at pasture sites in Rondônia.34,69 The scattering coefficients decreased by more than 40% from period 1 to period 2. At 550 nm, Chand et al. (2006)69 observed scattering coefficients as high as 1000 Mm−1, but they were associated with also much higher PM concentration of 100 to 200 μg m−3, ranges that were never achieved in Rio Branco in 2018.
Surprisingly, the SSA had only a slight variation throughout the campaign, going from 0.76 to 0.81, or only a 6% variation, despite the larger differences between period 1 and period 2 in the AAE and SAE and in particle concentrations. Similar to a primary forest site in Amazonia, where a very weak seasonal variation in the SSA was observed between the wet and the dry season, being 0.87 ± 0.06 and 0.86 ± 0.09, respectively.65 The authors point out that this trend can be explained by the fact that both the scattering and the absorption increased/decreased at similar rates, especially in aerosols coming from BB that contain particles from a wide range of scattering and absorption coefficients depending on the plume age and fire type (smoldering or flaming). Nevertheless, the small increase in the single-scattering albedo at the end of the campaign suggests that these particles scatter more radiation, not entirely due to the presence of efficient light scattering species but also because of the decrease of absorbing species.
It is important to note that the SSA in our study was on average 0.77 ± 0.08, notably lower than that reported for pristine forested sites near Manaus65 and ATTO sites in Central Amazonia,32 but also lower than that reported in Porto Velho, which in the dry/transition season was around 0.90.2 A lower SSA is consistent with the more substantial absorption characteristic of the aerosols found in this study discussed in the following sections.
3.4. Average mass scattering efficiency (MSE) and mass absorption efficiency (MAE) estimation for multiple wavelengths
The MSE and MAE were, first, estimated as the linear regression slope between the respective optical properties and the mass of PM1. Scattering and absorption coefficients were linearly related to aerosol mass concentration at all wavelengths measured with a good coefficient of determination, as shown in the ESI for scattering (Fig. SI12†) and absorption (Fig. SI13).† All mass efficiencies and regression coefficients are summarized in Table 2. The mass efficiencies calculated from this method represent the average conditions of an aerosol population that varies due to changes in relative humidity, size distribution, and composition during the sampling.49| MSE ± SE (m2 g−1) | R 2 | MAE ± SE (m2 g−1) | R 2 | |
|---|---|---|---|---|
| 370 nm | — | — | 4.85 ± 0.03 | 0.94 |
| 450 nm | 6.85 ± 0.07 | 0.84 | — | — |
| 470 nm | 2.51 ± 0.02 | 0.89 | ||
| 520 nm | — | — | 1.82 ± 0.02 | 0.84 |
| 532 nm | 4.90 ± 0.05 | 0.85 | ||
| 637 nm | 3.36 ± 0.03 | 0.85 | 1.17 ± 0.01 | 0.78 |
| 880 nm | — | — | 0.67 ± 0.01 | 0.71 |
Both the MSE and MAE are wavelength-dependent. MSE values were higher than those reported by Reid et al. (2005) for smoke particles from individual fires and for regional hazes dominated by smoke in Brazil70,71 that ranged between 4.4 and 5.5 at 450 nm. McMeeking et al. (2005)72 noted, however, that the MSE increased during periods dominated by biomass smoke in Yosemite National Park, CA, USA and reported an average MSE (for 530 nm) of 4.1 ± 0.7 m2 g−1, which reached values as high as 6 m2 g−1 which are in accordance with findings in Rio Branco. The MSE for PM1 at 532 nm is comparable with what was reported at other studies in Amazonia during the burning season, such as in ATTO, 4.9 m2 g−1 (ref. 73) and in a pasture site in Rondônia, 5.0 m2 g−1 (at 545 nm).69
It is worth noting that for the BB aerosol, both the MAE and MSE depend on the type of burned vegetation, fire conditions (flaming vs. smoldering) and other variables. For instance, larger particles tend to be associated with smoldering combustion, as well as smaller BC concentrations.71 We do not have information about fire conditions during the experiment, but at the end of the burn process (when the temperature decreases and the fuel is running out) as well as the burning of the wet vegetation tends to produce smoldering conditions. Thus, for this study in Rio Branco we can expect though a mixture of flaming and smoldering fires trending to diminish flaming fires throughout the sampling period.
The estimates of absorption efficiency and its spectral dependence are scarcer than for scattering. Since BC is the most important type of light-absorbing aerosol in the atmosphere, many studies in the literature have focused on its MAE,42,74 without considering other components that contribute to the absorption, like organic aerosols. More recently, the potential of organic carbon as an absorber of UV and visible light began to be explored and reported in the literature. Our values are considerably higher than those of 1.0 and 0.7 m2 g−1 at 550 nm for flaming and smoldering fire particles reported by Reid et al. (2005).75 But at an urban site in southern Spain where the carbonaceous matter dominated the absorption process, its absorption efficiency was 1.9 ± 0.1 m2 g−1 at 550 nm.76
3.5. The link between optical properties and chemical composition
To better understand how the optical properties of aerosols relate to their chemical composition, a multivariate regression model (MLR) was applied using OAs in its subcomponents according to the PMF factors and black carbon as predictor variables and scattering and absorption coefficients at multiple wavelengths as the outcome (eqn (9)). The results for the multivariate correlation presented here were statistically significant for all the predictor variables (p-value < 0.001), which are shown in the ESI.†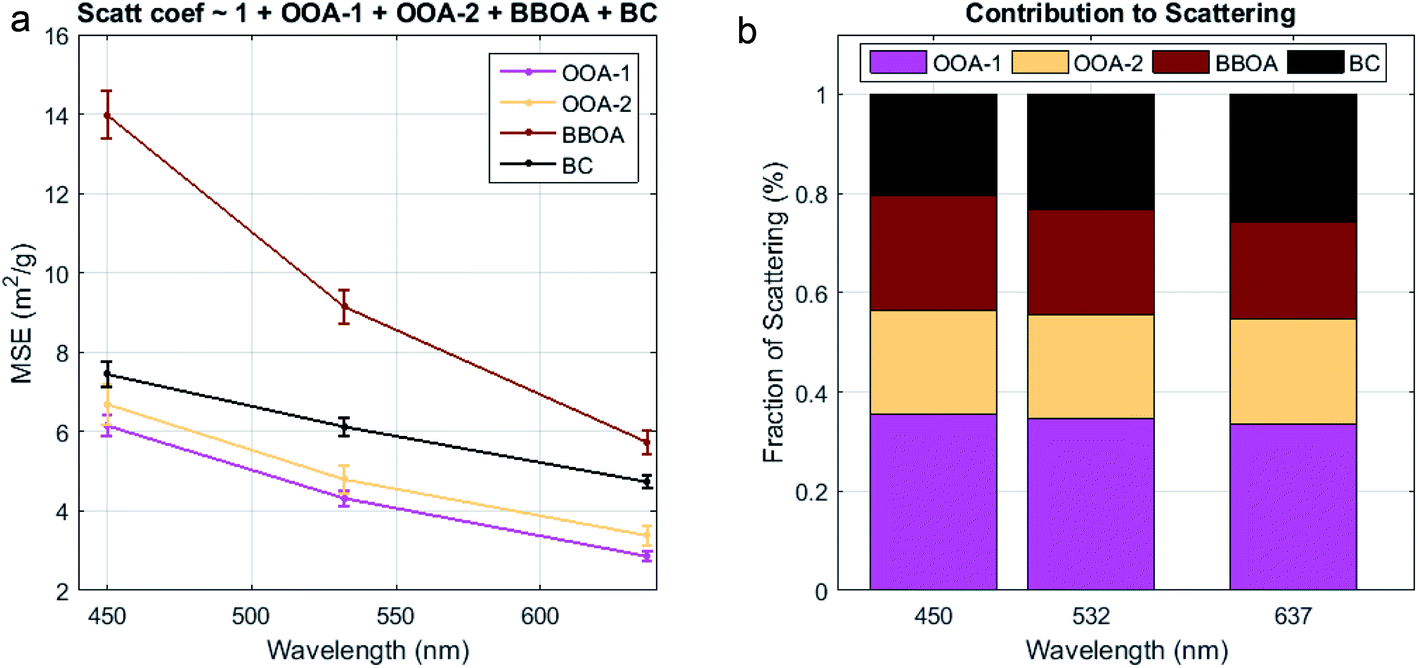 | ||
| Fig. 7 (a) Mass scattering efficiencies (MSEs) for each component, and MSEs are the coefficients from multivariate linear regression. Error bars correspond to standard error and (b) estimate of the contribution of each component to the scattering coefficient at each wavelength. | ||
The MSE of all components decreased as a function of wavelength (Fig. 7a), in agreement with the behavior expected for scattering in the Mie regime. BBOA had the highest MSE, 9.15 ± 0.43 m2 g−1 at 532 nm (Table 3). The high scattering efficiency for the BBOA component corroborates the results of other authors who associated the biomass burning aerosol with high scattering efficiencies (Hand and Malm (2007)49 and references therein, Malm et al. (2005)77).
| MSE | OOA-1 | OOA-2 | BBOA | BC |
|---|---|---|---|---|
| 450 nm | 6.15 ± 0.27 | 6.69 ± 0.51 | 13.97 ± 0.60 | 7.44 ± 0.30 |
| 532 nm | 4.32 ± 0.19 | 4.8 ± 0.35 | 9.15 ± 0.43 | 6.12 ± 0.22 |
| 637 nm | 2.86 ± 0.13 | 3.38 ± 0.24 | 5.73 ± 0.29 | 4.73 ± 0.16 |
Bond and Bergstrom (2006)42 mention that the mass scattering efficiency of light-absorbing carbon (LAC) particles is highly dependent on the particle size, and therefore these values vary widely. Meanwhile, knowing that the real part of the BC refraction index is around 1.95 at 550 nm, it is expected that its contribution to the total scattering is not negligible, especially in Rio Branco where the BC mass fraction was around 15%. The MSE of BC was 6.12 m2 g−1 at 532 nm, very close to the MSE (5.9 m2 g−1) for EC particles at 150 nm found for a suburban location in Hong Kong.78
When taking the mass concentration into account and calculating the contribution of each component to the total scattering coefficient (Fig. 7b), we observe that both OOAs presented an almost constant profile across the spectrum contributing to approx. 55% of scattering, while BC and BBOA contributed to 20–25% and 19–23% of the scattering, respectively. That is, the secondary organic aerosol components (OOAs) are most responsible for the total light scattering.
The relationship between light scattering and the degree of oxidation of particles is complex and not fully understood.79 Several studies show that secondary organic aerosols scatter light more than primary organic aerosols; for instance, monitoring a wavelength range of 500–570 nm, Smith et al. (2020)80 found that after 12 h of aging, the BB aerosol became highly scattering. Paredes-Miranda et al. (2009)81 estimated that 75% of light scattering was due to secondary aerosols (inorganic and organic) from photochemical production. Nonetheless, Malm et al. (2005)77 investigated the contribution of organics for the total scattering, concluding that OA mass scattering efficiencies were higher during BB episodes and recommended further studies for other smoke events where aerosol aging and fuel types are different. It is important to note that the increase in MSEs and scattering coefficients as a function of aerosol age is also associated with changes in particle size because as the plume ages there is a shift in particle size modes.82,83 Therefore, measurements on the chemical composition of size-resolved aerosols would be enlightening to verify in which size modes components contribute most to scattering, and which are the mechanisms responsible for the increase in their scattering efficiencies.
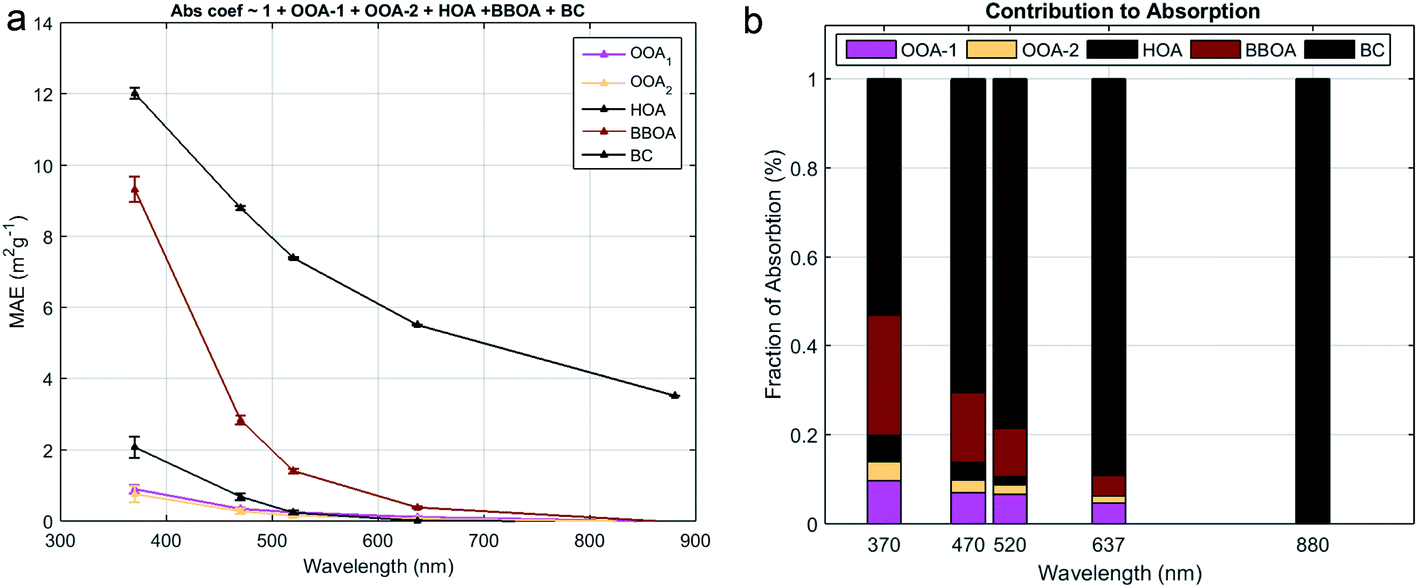 | ||
| Fig. 8 (a) Mass absorption efficiencies (MAE) for each component (OA factors and BC), and MAEs are the coefficients from multivariate linear regression. The error bars represent the coefficient standard deviation and (b) estimate of the contribution of OA and BC to the absorption coefficient at each wavelength. | ||
The MLR coefficients shown in Fig. 8a correspond to the MAE of the respective aerosol component. The spectral dependence of all organic components is evidenced by the sharp drop in their absorption efficiency between 370 and 520 nm. MAE values and their respective errors are summarized in Table 4. The OA component that presented the highest values of the MAE was BBOA, followed by HOA whose coefficients were 9.31 ± 0.35 m2 g−1 and 2.07 ± 0.29 m2 g−1 at 370 nm, respectively. In contrast, the OOA components showed much lower absorption efficiency. In general, our results are consistent with other studies that have estimated mass absorption efficiencies of chemical components.53,54
| MAE OOA-1 | MAE OOA-2 | MAE HOA | MAE BBOA | MAE BC | MAE BrC | |
|---|---|---|---|---|---|---|
| a Coefficients were not significantly different from zero. | ||||||
| 370 nm | 0.90 ± 0.11 | 0.76 ± 0.23 | 2.07 ± 0.29 | 9.32 ± 0.35 | 12.02 ± 0.14 | 3.09 ± 0.11 |
| 470 nm | 0.34 ± 0.04 | 0.28 ± 0.08 | 0.68 ± 0.10 | 2.83 ± 0.12 | 8.80 ± 0.05 | 0.97 ± 0.04 |
| 520 nm | 0.24 ± 0.02 | 0.15 ± 0.04 | 0.24 ± 0.06 | 1.41 ± 0.07 | 7.39 ± 0.03 | 0.47 ± 0.02 |
| 637 nm | 0.11 ± 0.01 | 0.07 ± 0.02 | 0.01 ± 0.02 | 0.38 ± 0.02 | 5.51 ± 0.01 | 0.13 ± 0.00 |
| 880 nm | 3.52 ± 0.002 | |||||
The BC MAE ranged from 12.02 m2 g−1 to 3.52 m2 g−1 in the 370–880 nm interval. As a comparison, values reported in the literature for BC in ambient aerosols are in the range of 7.5 m2 g−1 at 550 nm and 12–13 m2 g−1 at 350 nm.84,85 However, a BC MAE as high as 12.1 ± 4.0 m2 g−1 at 550 nm was reported for smoke particles from biomass burning in Brazil.74
The reconstructed absorption coefficients calculated by multiplying the mass absorption efficiencies and the mass concentrations corresponding to each component (Fig. SI13b†) showed a high coefficient of determination (R2 > 0.9) with what was measured with the AE33 for all wavelengths. As a consequence of their strong spectral dependence, organics' relative contribution to absorption coefficients is also very variable, starting from ∼50% at 370 nm to ∼10% at 637 nm and falling to 0 at 880 nm. Conversely, BC absorbs light efficiently across the whole visible spectrum, increasing its contribution from ∼50% at 370 nm to 100% at 880 nm. Therefore, the results presented in this section corroborate those in Section 3.3 that the submicrometric aerosol in Rio Branco strongly absorbs visible light.
The comparison between the absorption by total organics (sum of all the absorption coefficients for all PMF factors) estimated by MLR and the BrC contribution to light absorption at 470 nm independently retrieved from absorption spectra exhibited a good agreement. The correlation has an angular coefficient of 0.87 and an R2 of 0.88, indicating that those two independent methods resulted in close estimates of BrC absorption (Fig. SI15 in the ESI).† The difference between the calculations can be explained by the experimental measurements' uncertainty and the errors and assumptions associated with the two models (MLR and the BrC estimation method).
Since the absorption coefficient due to organics (σAbs–Org calculated by the MLR method) is similar to the absorption attributed to BrC (σAbs–BrC), we estimated the mass absorption efficiency for BrC as σAbs–Org/morg for the wavelength range of this study, and results are reported as MAE BrC at Table 4.
The BrC MAEs reported in the literature vary from 0.02 to 2 m2 g−1 at mid visible wavelengths and 1–10 m2 g−1 at 350 nm.84 The results for Rio Branco at 520 nm are compared to the value of 0.4 m2 g−1 at 532 nm, indicated by Laskin et al. (2015)24 as characteristics in the Amazon Basin. Wang et al. (2016)41 estimated a range of MACs of 0.05–1.5 m2 g−1 for OAs at 440 nm and remarked that the upper limit is comparable to the highest MAC of acetone/methanol-soluble OAs found in laboratory experiments.
The absorption of light in the UV-vis range can be explained by absorbing molecules such HULIS,24 nitroaromatics,86 polyoxygenated compounds,87 and polyaromatic hydrocarbons (PAHs),88 which are known chromophores and yet chelating agents, complexing with transition metals such as iron.89 Laboratory-controlled studies of BB identified a variety of oxygenated hydrocarbons87 with diverse chemical characteristics such as lignin pyrolysis products, lignin-derived products, distillation products, nitroaromatics, and PAHs90 emphasizing that most BrC chromophores were common in samples from distinct vegetation species and meanwhile their relative contributions to total light absorption differ.
Thus, the formation of chromophore compounds in BB has mechanisms common to all types of fuel/fire and exhibits unique properties that need to be addressed concerning local characteristics. Regarding the overall fine particulate matter absorption, we cannot rule out the contribution of other OA components to the light absorption as many studies have assessed atmospheric chemical processes that resulted in light-absorbing SOAs.24,79 The presence of BrC, therefore, should not be neglected, and studies in the Amazon basin, especially in the dry season when massive biomass burning occurs, should investigate the characteristics of the regional aerosol addressing its climatic effects.
4. Conclusions
We have investigated the chemical composition and the optical characteristics of atmospheric aerosols during the dry-to-wet season (late August to November 2018) at a site in Southwestern Amazonia. Aerosol loadings were mainly dominated by BB activities common at the time of the year the sampling was performed, especially in the arc of deforestation, in Southwestern Amazonia.Our findings agree with previous studies in this region showing that submicron particles are largely produced during the biomass burning period and are dominated by non-refractory organics (∼75% in PM1 mass), followed by BC (∼15% in PM1 mass), and less than 10% of inorganic compounds, such as nitrates and sulfates. The total scattering and absorption coefficients at 637 nm presented a mean value of 32 ± 24 and 10 ± 10 Mm−1. Also noteworthy is the high contribution of BrC to the absorption coefficient, around 27% at 470 nm on average for the campaign.
During the field campaign, we were able to differentiate the end of the dry season and the beginning of the transition, which was marked by a sharp drop in aerosol mass concentrations, scattering and absorption coefficients, and a change in their diurnal profiles. Organic aerosol concentration lowered from 13.87 ± 9.70 to 6.15 ± 3.23 μg m−3. The effect of both regional and closer fresh fires seems to be predominant in the region, and the dynamics of the boundary layer shapes the diurnal profiles of both organic and inorganic aerosols in the first part of the campaign.
Positive matrix factorization resolved four chemical classes of organic aerosols: two oxygenated OAs (OOA-1 and OOA-2), one hydrocarbon-like OA (HOA), and one biomass burning related OA (BBOA). Throughout the campaign, the OOA-1 factor that is related to regional oxygenated organics increases its mass fraction contribution from 39 to 50%.
Finally, we applied multilinear regression to further investigate the link between optical properties and chemical composition. The modeled scattering and absorption coefficients were described as a linear combination of PMF factors + BC. By comparing the results of the linear regression models for scattering and absorption, we provided an overview of the importance of chemical components for each of these phenomena. The two classes of oxygenated aerosols (OOAs) contribute most to the scattering, while for absorption, the most important components were BBOA and BC. Overall, OAs contributed approximately 50% of absorption at 370 nm, decreasing to less than 10% at 670 nm. The strong light absorption in the UV-vis wavelength range was related to the biomass burning organic aerosol (BBOA) arising from local emissions.
Therefore, the mixing state and the optical properties of carbonaceous aerosols in the regions of massive biomass burning should be better addressed and characterized to allow climate studies to estimate the direct radiative forcing more accurately. BB is a key driver for aerosol changes, and its complex optical properties are a challenge for global models' adequate assessment.
Conflicts of interest
There are no conflicts to declare.Acknowledgements
The authors gratefully acknowledge the financial support of the São Paulo Research Foundation – FAPESP (Thematic project grant number 2017/17047-0 and M. P. postdoctoral fellowship number 2018/26375-4). MAF acknowledges the financial support of CNPq for the PhD scholarship, project number 169842/2017-7, and CAPES, for a sandwich doctorate at the Max Planck Institute for Chemistry, project number 88887.368025/2019-00. The authors would like to thank the LFA IFUSP technicians, especially Fabio de Oliveira Moraes Jorge, Delano Campos, Foster Brown, and the UFAC staff who supported the field campaign in Rio Branco.References
- M. L. Pöhlker, C. Pöhlker, F. Ditas, T. Klimach, I. Hrabe de Angelis, A. Araújo, J. Brito, S. Carbone, Y. Cheng, X. Chi, R. Ditz, S. S. Gunthe, J. Kesselmeier, T. Könemann, J. V. Lavrič, S. T. Martin, E. Mikhailov, D. Moran-Zuloaga, D. Rose, J. Saturno, H. Su, R. Thalman, D. Walter, J. Wang, S. Wolff, H. M. J. Barbosa, P. Artaxo, M. O. Andreae and U. Pöschl, Long-term observations of cloud condensation nuclei in the Amazon rain forest – part 1: aerosol size distribution, hygroscopicity, and new model parametrizations for CCN prediction, Atmos. Chem. Phys., 2016, 16, 15709–15740 CrossRef.
- P. Artaxo, L. Rizzo, J. Brito, H. M. J. Barbosa, A. Arana, E. T. Sena, G. G. Cirino, W. Bastos, S. T. Martin and M. O. Andreae, Atmospheric aerosols in Amazonia and land use change: from natural biogenic to biomass burning conditions, Faraday Discuss., 2013, 165, 203 RSC.
- S. T. Martin, M. O. Andreae, P. Artaxo, D. Baumgardner, Q. Chen, A. H. Goldstein, A. Guenther, C. L. Heald, O. L. Mayol-Bracero, P. H. McMurry, T. Pauliquevis, U. Poschl, K. A. Prather, G. C. Roberts, S. R. Saleska, M. A. Silva Dias, D. V. Spracklen, E. Swietlicki and I. Trebs, Sources and properties of Amazonian aerosol particles, Rev. Geophys., 2010, 48, RG2002 CrossRef.
- J. M. B. Carreiras, J. Jones, R. M. Lucas and C. Gabriel, Land Use and Land Cover Change Dynamics across the Brazilian Amazon: Insights from Extensive Time-Series Analysis of Remote Sensing Data, PLoS One, 2014, 9, e104144 CrossRef PubMed.
- E. A. Davidson, A. C. Araújo, P. Artaxo, J. K. Balch, I. F. Brown, M. M. Mercedes, M. T. Coe, R. S. Defries, M. Keller, M. Longo, J. W. Munger, W. Schroeder, B. S. Soares-Filho, C. M. Souza and S. C. Wofsy, The Amazon basin in transition, Nature, 2012, 481, 321–328 CrossRef CAS PubMed.
- L. S. Lima, M. T. Coe, B. S. Soares Filho, S. V. Cuadra, L. C. P. Dias, M. H. Costa, L. S. Lima and H. O. Rodrigues, Feedbacks between deforestation, climate, and hydrology in the Southwestern Amazon: implications for the provision of ecosystem services, Landsc. Ecol., 2014, 29, 261–274 CrossRef.
- M. C. Levy, A. V. Lopes, A. Cohn, L. G. Larsen and S. E. Thompson, Land Use Change Increases Streamflow Across the Arc of Deforestation in Brazil, Geophys. Res. Lett., 2018, 45, 3520–3530 CrossRef.
- L. V. Gatti, L. S. Basso, J. B. Miller, M. Gloor, L. Gatti Domingues, H. L. G. Cassol, G. Tejada, L. E. O. C. Aragão, C. Nobre, W. Peters, L. Marani, E. Arai, A. H. Sanches, S. M. Corrêa, L. Anderson, C. Von Randow, C. S. C. Correia, S. P. Crispim and R. A. L. Neves, Amazonia as a carbon source linked to deforestation and climate change, Nature, 2021, 595, 388–393 CrossRef CAS PubMed.
- M. O. Andreae, P. Artaxo, C. Brandão, F. E. Carswell, P. Ciccioli, A. L. Da Costa, A. D. Culf, J. L. Esteves, J. H. C. Gash, J. Grace, P. Kabat, J. Lelieveld, Y. Malhi, A. O. Manzi, F. X. Meixner, A. D. Nobre, C. Nobre, M. D. L. P. Ruivo, M. A. Silva-Dias, P. Stefani, R. Valentini, J. Von Jouanne and M. J. Waterloo, Biogeochemical cycling of carbon, water, energy, trace gases, and aerosols in Amazonia: The LBA-EUSTACH experiments, J. Geophys. Res.: Atmos., 2002, 107(D20), 8066 CrossRef.
- M. O. Andreae, D. Rosenfeld, P. Artaxo, A. A. Costa, G. P. Frank, K. M. Longo and M. A. F. Silva-Dias, Smoking Rain Clouds over the Amazon, Science, 2004, 303, 1337–1342 CrossRef CAS PubMed.
- A. K. Hodgson, W. T. Morgan, S. O'Shea, S. Bauguitte, J. D. Allan, E. Darbyshire, M. J. Flynn, D. Liu, J. Lee, B. Johnson, J. M. Haywood, K. M. Longo, P. E. Artaxo and H. Coe, Near-field emission profiling of tropical forest and Cerrado fires in Brazil during SAMBBA 2012, Atmos. Chem. Phys., 2018, 18, 5619–5638 CrossRef CAS.
- W. T. Morgan, J. D. Allan, S. Bauguitte, E. Darbyshire, M. J. Flynn, J. Lee, D. Liu, B. Johnson, J. Haywood, K. M. Longo, P. E. Artaxo and H. Coe, Transformation and ageing of biomass burning carbonaceous aerosol over tropical South America from aircraft in situ measurements during SAMBBA, Atmos. Chem. Phys., 2020, 20, 5309–5326 CrossRef CAS.
- J. Brito, L. V. Rizzo, W. T. Morgan, H. Coe, B. Johnson, J. Haywood, K. Longo, S. Freitas, M. O. Andreae and P. Artaxo, Ground-based aerosol characterization during the South American Biomass Burning Analysis (SAMBBA) field experiment, Atmos. Chem. Phys., 2014, 14, 12069–12083 CrossRef.
- S. Fuzzi, S. Decesari, M. C. Facchini, F. Cavalli, L. Emblico, M. Mircea, M. O. Andreae, I. Trebs, A. Hoffer, P. Guyon, P. Artaxo, L. V. Rizzo, L. L. Lara, T. Pauliquevis, W. Maenhaut, N. Raes, X. Chi, O. L. Mayol-Bracero, L. L. Soto-García, M. Claeys, I. Kourtchev, J. Rissler, E. Swietlicki, E. Tagliavini, G. Schkolnik, A. H. Falkovich, Y. Rudich, G. Fisch and L. V. Gatti, Overview of the inorganic and organic composition of size-segregated aerosol in Rondônia, Brazil, from the biomass-burning period to the onset of the wet season, J. Geophys. Res., 2007, 112, D01201 CrossRef.
- P. Artaxo, Physical and chemical properties of aerosols in the wet and dry seasons in Rondônia, Amazonia, J. Geophys. Res., 2002, 107, 8081 CrossRef.
- E. T. Sena, P. Artaxo and A. L. Correia, Spatial variability of the direct radiative forcing of biomass burning aerosols and the effects of land use change in Amazonia, Atmos. Chem. Phys., 2013, 13, 1261–1275 CrossRef.
- E. T. Sena and P. Artaxo, A novel methodology for large-scale daily assessment of the direct radiative forcing of smoke aerosols, Atmos. Chem. Phys., 2015, 15, 5471–5483 CrossRef CAS.
- O. Boucher, D. Randall, P. Artaxo, C. Bretherton, G. Feingold, V. P. Forster, M. Kerminen, Y. Kondo, H. Liao, U. Lohmann, P. Rasch, S. K. Satheesh, S. Sherwood, B. Stevens and X. Y. Zhan, in Climate Change 2013 – The Physical Science Basis, Intergovernmental Panel on Climate Change, Cambridge University Press, Cambridge, 2013, pp. 571–658 Search PubMed.
- B. Ervens, Modeling the Processing of Aerosol and Trace Gases in Clouds and Fogs, Chem. Rev., 2015, 115, 4157–4198 CrossRef CAS PubMed.
- M. Shrivastava, C. D. Cappa, J. Fan, A. H. Goldstein, A. B. Guenther, J. L. Jimenez, C. Kuang, A. Laskin, S. T. Martin, N. L. Ng, T. Petaja, J. R. Pierce, P. J. Rasch, P. Roldin, J. H. Seinfeld, J. Shilling, J. N. Smith, J. A. Thornton, R. Volkamer, J. Wang, D. R. Worsnop, R. A. Zaveri, A. Zelenyuk and Q. Zhang, Recent advances in understanding secondary organic aerosol: implications for global climate forcing, Rev. Geophys., 2017, 55, 509–559 CrossRef.
- A. Cazorla, R. Bahadur, K. J. Suski, J. F. Cahill, D. Chand, B. Schmid, V. Ramanathan and K. A. Prather, Relating aerosol absorption due to soot, organic carbon, and dust to emission sources determined from in situ chemical measurements, Atmos. Chem. Phys., 2013, 13, 9337–9350 CrossRef.
- A. Hoffer, A. Gelencsér, P. Guyon, G. Kiss, O. Schmid, G. P. Frank, P. Artaxo and M. O. Andreae, Optical properties of humic-like substances (HULIS) in biomass-burning aerosols, Atmos. Chem. Phys., 2006, 6, 3563–3570 CrossRef CAS.
- M. O. Andreae and A. Gelencsér, Black carbon or brown carbon? The nature of light-absorbing carbonaceous aerosols, Atmos. Chem. Phys., 2006, 6, 3131–3148 CrossRef CAS.
- A. Laskin, J. Laskin and S. A. Nizkorodov, Chemistry of Atmospheric Brown Carbon, Chem. Rev., 2015, 115, 4335–4382 CrossRef CAS PubMed.
- Y. Wang, M. Hu, N. Xu, Y. Qin, Z. Wu, L. Zeng, X. Huang and L. He, Chemical composition and light absorption of carbonaceous aerosols emitted from crop residue burning: influence of combustion efficiency, Atmos. Chem. Phys., 2020, 20, 13721–13734 CrossRef CAS.
- A. P. S. Hettiyadura, V. Garcia, C. Li, C. P. West, J. Tomlin, Q. He, Y. Rudich and A. Laskin, Chemical Composition and Molecular-Specific Optical Properties of Atmospheric Brown Carbon Associated with Biomass Burning, Environ. Sci. Technol., 2021, 1–53 Search PubMed.
- H. Wu, J. W. Taylor, J. M. Langridge, C. Yu, J. D. Allan, P. I. Williams, M. J. Flynn, K. Szpek, M. I. Cotterell, C. Fox, P. Barker, G. Allan, J. Haywood and H. Coe, Rapid transformation of ambient absorbing aerosols from West African biomass burning, Atmos. Chem. Phys., 2021 DOI:10.5194/acp-2021-49..
- C. Li, Q. He, A. P. S. Hettiyadura, U. Käfer, G. Shmul, D. Meidan, R. Zimmermann, S. S. Brown, C. George, A. Laskin and Y. Rudich, Formation of Secondary Brown Carbon in Biomass Burning Aerosol Proxies through NO3 Radical Reactions, Environ. Sci. Technol., 2020, 54, 1395–1405 CrossRef CAS PubMed.
- A. G. Rincón, M. I. Guzmán, M. R. Hoffmann and A. J. Colussi, Optical Absorptivity versus Molecular Composition of Model Organic Aerosol Matter, J. Phys. Chem. A, 2009, 113, 10512–10520 CrossRef PubMed.
- IBGE, IBGE, https://www.ibge.gov.br/cidades-e-estados/ac/rio-branco.html?, accessed 18 December 2020.
- A. F. Duarte, Aspectos da climatologia do Acre, Brasil, com base no intervalo 1971–2000, Rev. Bras. Meteorol., 2006, 21, 308–317 Search PubMed.
- J. Saturno, B. A. Holanda, C. Pöhlker, F. Ditas, Q. Wang, D. Moran-Zuloaga, J. Brito, S. Carbone, Y. Cheng, X. Chi, J. Ditas, T. Hoffmann, I. Hrabe De Angelis, T. Könemann, J. V. Lavrič, N. Ma, J. Ming, H. Paulsen, M. L. Pöhlker, L. V. Rizzo, P. Schlag, H. Su, D. Walter, S. Wolff, Y. Zhang, P. Artaxo, U. Pöschl and M. O. Andreae, Black and brown carbon over central Amazonia: long-term aerosol measurements at the ATTO site, Atmos. Chem. Phys., 2018, 18, 12817–12843 CrossRef CAS.
- J. Saturno, C. Pöhlker, D. Massabò, J. Brito, S. Carbone, Y. Cheng, X. Chi, F. Ditas, I. Hrabě de Angelis, D. Morán-Zuloaga, M. L. Pöhlker, L. V. Rizzo, D. Walter, Q. Wang, P. Artaxo, P. Prati and M. O. Andreae, Comparison of different Aethalometer correction schemes and a reference multi-wavelength absorption technique for ambient aerosol data, Atmos. Meas. Tech., 2017, 10, 2837–2850 CrossRef.
- L. V. Rizzo, A. L. Correia, P. Artaxo, A. S. Procópio and M. O. Andreae, Spectral dependence of aerosol light absorption over the Amazon Basin, Atmos. Chem. Phys., 2011, 11, 8899–8912 CrossRef CAS.
- A. M. Middlebrook, R. Bahreini, J. L. Jimenez and M. R. Canagaratna, Evaluation of Composition-Dependent Collection Efficiencies for the Aerodyne Aerosol Mass Spectrometer using Field Data, Aerosol Sci. Technol., 2012, 46, 258–271 CrossRef CAS.
- A. M. Yáñez-Serrano, A. C. Nölscher, J. Williams, S. Wolff, E. Alves, G. A. Martins, E. Bourtsoukidis, J. Brito, K. Jardine, P. Artaxo and J. Kesselmeier, Diel and seasonal changes of biogenic volatile organic compounds within and above an Amazonian rainforest, Atmos. Chem. Phys., 2015, 15, 3359–3378 CrossRef.
- F. Canonaco, M. Crippa, J. G. Slowik, U. Baltensperger and A. S. H. Prévôt, SoFi, an IGOR-based interface for the efficient use of the generalized multilinear engine (ME-2) for the source apportionment: ME-2 application to aerosol mass spectrometer data, Atmos. Meas. Tech., 2013, 6, 3649–3661 CrossRef.
- I. M. Ulbrich, M. R. Canagaratna, Q. Zhang, D. R. Worsnop and J. L. Jimenez, Interpretation of organic components from Positive Matrix Factorization of aerosol mass spectrometric data, Atmos. Chem. Phys., 2009, 9, 2891–2918 CrossRef CAS.
- Q. Zhang, J. L. Jimenez, M. R. Canagaratna, I. M. Ulbrich, N. L. Ng, D. R. Worsnop and Y. Sun, Understanding atmospheric organic aerosols via factor analysis of aerosol mass spectrometry: a review, Anal. Bioanal. Chem., 2011, 401, 3045–3067 CrossRef CAS PubMed.
- P. Paatero, The Multilinear Engine—A Table-Driven, Least Squares Program for Solving Multilinear Problems, Including the n-Way Parallel Factor Analysis Model, J. Comput. Graph. Statist., 1999, 8, 854–888 Search PubMed.
- X. Wang, A. J. Sedlacek, S. S. de Sá, S. T. Martin, M. L. Alexander, M. L. Alexander, T. B. Watson, A. C. Aiken, S. R. Springston and P. Artaxo, Deriving brown carbon from multiwavelength absorption measurements: method and application to AERONET and Aethalometer observations, Atmos. Chem. Phys., 2016, 16, 12733–12752 CrossRef CAS.
- T. C. Bond and R. W. Bergstrom, Light absorption by carbonaceous particles: an investigative review, Aerosol Sci. Technol., 2006, 40, 27–67 CrossRef CAS.
- G. Schkolnik, D. Chand, A. Hoffer, M. O. Andreae, C. Erlick, E. Swietlicki and Y. Rudich, Constraining the density and complex refractive index of elemental and organic carbon in biomass burning aerosol using optical and chemical measurements, Atmos. Environ., 2007, 41, 1107–1118 CrossRef CAS.
- A. F. Stein, R. R. Draxler, G. D. Rolph, B. J. B. Stunder, M. D. Cohen and F. Ngan, NOAA's HYSPLIT Atmospheric Transport and Dispersion Modeling System, Bull. Am. Meteorol. Soc., 2015, 96, 2059–2077 CrossRef.
- FIRMS, NRT VIIRS 375 m Active Fire product VNP14IMGT distributed from NASA FIRMS, available on-line, https://earthdata.nasa.gov/firms Search PubMed.
- P. Xie, R. Joyce, S. Wu, S.-H. Yoo, Y. Yarosh, F. Sun and R. Lin, NOAA Climate Data Record (CDR) of CPC Morphing Technique (CMORPH) High Resolution Global Precipitation Estimates, Version 1, 2021, DOI:10.25921/w9va-q159.
- H. Hersbach, B. Bell, P. Berrisford, G. Biavati, A. Horányi, J. Muñoz Sabater, J. Nicolas, C. Peubey, R. Radu, I. Rozum, D. Schepers, A. Simmons, C. Soci, D. Dee and J.-N. Thépaut, ERA5 Hour. data single levels from 1979 to Present. Copernicus Climate Change Service (C3S) Climate Data Store (CDS), 2018, DOI:10.24381/cds.adbb2d47.
- W. C. Malm and J. L. Hand, An examination of the physical and optical properties of aerosols collected in the IMPROVE program, Atmos. Environ., 2007, 41, 3407–3427 CrossRef CAS.
- J. L. Hand and W. C. Malm, Review of aerosol mass scattering efficiencies from ground-based measurements since 1990, J. Geophys. Res.: Atmos., 2007, 112, D16203 CrossRef.
- W. C. Malm and S. M. Kreidenweis, The effects of models of aerosol hygroscopicity on the apportionment of extinction, Atmos. Environ., 1997, 31, 1965–1976 CrossRef CAS.
- J. Brito, S. Carbone, D. A. Monteiro dos Santos, P. Dominutti, N. Oliveira Alves, L. V. Rizzo and P. Artaxo, Disentangling vehicular emission impact on urban air pollution using ethanol as a tracer, Sci. Rep., 2018, 8, 10679 CrossRef PubMed.
- D. dos Santos, L. V. Rizzo, S. Carbone, P. Schlag and P. Artaxo, Physical and chemical properties of urban aerosols in São Paulo, Brazil: links between composition and size distribution of submicron particles, Bull. Am. Meteorol. Soc., 2021, 2021, 1–29 Search PubMed.
- M. Ealo, A. Alastuey, N. Pérez, A. Ripoll, X. Querol and M. Pandolfi, Impact of aerosol particle sources on optical properties in urban, regional and remote areas in the north-western Mediterranean, Atmos. Chem. Phys., 2018, 18, 1149–1169 CrossRef CAS.
- S. S. De Sá, L. V. Rizzo, B. B. Palm, P. Campuzano-Jost, D. A. Day, L. D. Yee, R. Wernis, G. Isaacman-Vanwertz, J. Brito, S. Carbone, Y. J. Liu, A. Sedlacek, S. Springston, A. H. Goldstein, H. M. J. Barbosa, M. Lizabeth Alexander, P. Artaxo, J. L. Jimenez and S. T. Martin, Contributions of biomass-burning, urban, and biogenic emissions to the concentrations and light-absorbing properties of particulate matter in central Amazonia during the dry season, Atmos. Chem. Phys., 2019, 19, 7973–8001 CrossRef.
- R. A. Washenfelder, A. R. Attwood, C. A. Brock, H. Guo, L. Xu, R. J. Weber, N. L. Ng, H. M. Allen, B. R. Ayres, K. Baumann, R. C. Cohen, D. C. Draper, K. C. Duffey, E. Edgerton, J. L. Fry, W. W. Hu, J. L. Jimenez, B. B. Palm, P. Romer, E. A. Stone, P. J. Wooldridge and S. S. Brown, Biomass burning dominates brown carbon absorption in the rural southeastern United States, Geophys. Res. Lett., 2015, 42, 653–664 CrossRef CAS.
- M. J. Cubison, A. M. Ortega, P. L. Hayes, D. K. Farmer, D. Day, M. J. Lechner, W. H. Brune, E. Apel, G. S. Diskin, J. A. Fisher, H. E. Fuelberg, A. Hecobian, D. J. Knapp, T. Mikoviny, D. Riemer, G. W. Sachse, W. Sessions, R. J. Weber, A. J. Weinheimer, A. Wisthaler and J. L. Jimenez, Effects of aging on organic aerosol from open biomass burning smoke in aircraft and laboratory studies, Atmos. Chem. Phys., 2011, 11, 12049–12064 CrossRef.
- M. R. Alfarra, H. Coe, J. D. Allan, K. N. Bower, H. Boudries, M. R. Canagaratna, J. L. Jimenez, J. T. Jayne, A. A. Garforth, S. M. Li and D. R. Worsnop, Characterization of urban and rural organic particulate in the Lower Fraser Valley using two Aerodyne Aerosol Mass Spectrometers, Atmos. Environ., 2004, 38, 5745–5758 CrossRef CAS.
- S. M. Pieber, I. El Haddad, J. G. Slowik, M. R. Canagaratna, J. T. Jayne, S. M. Platt, C. Bozzetti, K. R. Daellenbach, R. Fröhlich, A. Vlachou, F. Klein, J. Dommen, B. Miljevic, J. L. Jiménez, D. R. Worsnop, U. Baltensperger and A. S. H. Prévôt, Inorganic Salt Interference on CO2+ in Aerodyne AMS and ACSM Organic Aerosol Composition Studies, Environ. Sci. Technol., 2016, 50, 10494–10503 CrossRef CAS PubMed.
- A. P. Grieshop, N. M. Donahue and A. L. Robinson, Laboratory investigation of photochemical oxidation of organic aerosol from wood fires 2: analysis of aerosol mass spectrometer data, Atmos. Chem. Phys., 2009, 9, 2227–2240 CrossRef CAS.
- Z. Fang, W. Deng, Y. Zhang, X. Ding, M. Tang, T. Liu, Q. Hu, M. Zhu, Z. Wang, W. Yang, Z. Huang, W. Song, X. Bi, J. Chen, Y. Sun, C. George and X. Wang, Open burning of rice, corn and wheat straws: primary emissions, photochemical aging, and secondary organic aerosol formation, Atmos. Chem. Phys., 2017, 17, 14821–14839 CrossRef CAS.
- H. Timonen, S. Carbone, M. Aurela, K. Saarnio, S. Saarikoski, N. L. Ng, M. R. Canagaratna, M. Kulmala, V. M. Kerminen, D. R. Worsnop and R. Hillamo, Characteristics, sources and water-solubility of ambient submicron organic aerosol in springtime in Helsinki, Finland, J. Aerosol Sci., 2013, 56, 61–77 CrossRef CAS.
- B. Graham, O. L. Mayol-Bracero, P. Guyon, G. C. Roberts, S. Decesari, M. C. Facchini, P. Artaxo, W. Maenhaut, P. Köll and M. O. Andreae, Water-soluble organic compounds in biomass burning aerosols over Amazonia 1. Characterization by NMR and GC-MS, J. Geophys. Res.: Atmos., 2002, 107, LBA 14-1–LBA 14-16 CrossRef.
- M. Claeys, R. Vermeylen, F. Yasmeen, Y. Gómez-González, X. Chi, W. Maenhaut, T. Mészáros and I. Salma, Chemical characterisation of humic-like substances from urban, rural and tropical biomass burning environments using liquid chromatography with UV/vis photodiode array detection and electrospray ionisation mass spectrometry, Environ. Chem., 2012, 9, 273–284 CrossRef CAS.
- P. F. DeCarlo, I. M. Ulbrich, J. Crounse, B. De Foy, E. J. Dunlea, A. C. Aiken, D. Knapp, A. J. Weinheimer, T. Campos, P. O. Wennberg and J. L. Jimenez, Investigation of the sources and processing of organic aerosol over the Central Mexican Plateau from aircraft measurements during MILAGRO, Atmos. Chem. Phys., 2010, 10, 5257–5280 CrossRef CAS.
- L. V. Rizzo, P. Artaxo, T. Müller, A. Wiedensohler, M. Paixão, G. G. Cirino, A. Arana, E. Swietlicki, P. Roldin, E. O. Fors, K. T. Wiedemann, L. S. M. Leal and M. Kulmala, Long term measurements of aerosol optical properties at a primary forest site in Amazonia, Atmos. Chem. Phys., 2013, 13, 2391–2413 CrossRef CAS.
- C. D. Cappa, K. R. Kolesar, X. Zhang, D. B. Atkinson, M. S. Pekour, R. A. Zaveri, A. Zelenyuk-Imre and Q. Zhang, Understanding the Optical Properties of Ambient Sub- and Supermicron Particulate Matter: Results from the CARES 2010 Field Study in Northern California, Atmos. Chem. Phys., 2016, 16, 6511–6535 CrossRef CAS.
- G. Adler, J. M. Flores, A. Abo Riziq, S. Borrmann and Y. Rudich, Chemical, physical, and optical evolution of biomass burning aerosols: A case study, Atmos. Chem. Phys., 2011, 11, 1491–1503 CrossRef CAS.
- C. Li, Q. He, J. Schade, J. Passig, R. Zimmermann, D. Meidan, A. Laskin and Y. Rudich, Dynamic changes in optical and chemical properties of tar ball aerosols by atmospheric photochemical aging, Atmos. Chem. Phys., 2019, 19, 139–163 CrossRef CAS.
- D. Chand, P. Guyon, P. Artaxo, O. Schmid, G. P. Frank, L. V. Rizzo, O. L. Mayol-Bracero, L. V. Gatti and M. O. Andreae, Optical and physical properties of aerosols in the boundary layer and free troposphere over the Amazon Basin during the biomass burning season, Atmos. Chem. Phys., 2006, 6, 2911–2925 CrossRef CAS.
- J. S. Reid and P. V. Hobbs, Physical and optical properties of young smoke from individual biomass fires in Brazil, J. Geophys. Res.: Atmos., 1998, 103, 32013–32030 CrossRef.
- J. S. Reid, P. V. Hobbs, R. J. Ferek, D. R. Blake, J. V. Martins, M. R. Dunlap and C. Liousse, Physical, chemical, and optical properties of regional hazes dominated by smoke in Brazil, J. Geophys. Res.: Atmos., 1998, 103, 32059–32080 CrossRef CAS.
- G. R. McMeeking, S. M. Kreidenweis, C. M. Carrico, J. L. Collett, D. E. Day and W. C. Malm, Observations of smoke-influenced aerosol during the Yosemite Aerosol Characterization Study: 2. Aerosol scattering and absorbing properties, J. Geophys. Res., D: Atmos., 2005, 110, 1–9 Search PubMed.
- S. Carbone, in 10th International Aerosol Conference (IAC), American Association for Aerosol Researc, St. Louis, Missouri, 2018, p. 127 Search PubMed.
- J. V. Martins, P. Artaxo, C. Liousse, J. S. Reid, P. V. Hobbs and Y. J. Kaufman, Effects of black carbon content, particle size, and mixing on light absorption by aerosols from biomass burning in Brazil, J. Geophys. Res.: Atmos., 1998, 103, 32041–32050 CrossRef CAS.
- J. S. Reid, T. F. Eck, S. A. Christopher, R. Koppman, O. Dubovik, D. P. Eleuterio, B. N. Holben, E. A. Reid and J. Zhang, A review of biomass burning emissions part III: intensive optical properties of biomass burning particles, Atmos. Chem. Phys., 2005, 5, 827–849 CrossRef CAS.
- G. Titos, I. Foyo-Moreno, H. Lyamani, X. Querol, A. Alastuey and L. Alados-Arboledas, Optical properties and chemical composition of aerosol particles at an urban location: an estimation of the aerosol mass scattering and absorption efficiencies, J. Geophys. Res.: Atmos., 2012, 117, 1–12 CrossRef.
- W. C. Malm, D. E. Day, C. Carrico, S. M. Kreidenweis, J. L. Collett, G. McMeeking, T. Lee, J. Carrillo and B. Schichtel, Intercomparison and closure calculations using measurements of aerosol species and optical properties during the Yosemite aerosol characterization study, J. Geophys. Res., D: Atmos., 2005, 110, 1–21 CrossRef.
- H. Yu, C. Wu, D. Wu and J. Z. Yu, Size distributions of elemental carbon and its contribution to light extinction in urban and rural locations in the pearl river delta region, China, Atmos. Chem. Phys., 2010, 10, 5107–5119 CrossRef CAS.
- T. Moise, J. M. Flores and Y. Rudich, Optical Properties of Secondary Organic Aerosols and Their Changes by Chemical Processes, Chem. Rev., 2015, 115, 4400–4439 CrossRef CAS PubMed.
- D. M. Smith, M. N. Fiddler, R. P. Pokhrel and S. Bililign, Laboratory studies of fresh and aged biomass burning aerosol emitted from east African biomass fuels-part 1: optical properties, Atmos. Chem. Phys., 2020, 20, 10149–10168 CrossRef CAS.
- G. Paredes-Miranda, W. P. Arnott, J. L. Jimenez, A. C. Aiken, J. S. Gaffney and N. A. Marley, Primary and secondary contributions to aerosol light scattering and absorption in Mexico City during the MILAGRO 2006 campaign, Atmos. Chem. Phys., 2009, 9, 3721–3730 CrossRef CAS.
- L. I. Kleinman, A. J. Sedlacek III, K. Adachi, P. R. Buseck, S. Collier, M. K. Dubey, A. L. Hodshire, E. Lewis, T. B. Onasch, J. R. Pierce, J. Shilling, S. R. Springston, J. Wang, Q. Zhang, S. Zhou and R. J. Yokelson, Rapid evolution of aerosol particles and their optical properties downwind of wildfires in the western US, Atmos. Chem. Phys., 2020, 20, 13319–13341 CrossRef CAS.
- J. S. Reid, R. Koppmann, T. F. Eck and D. P. Eleuterio, A review of biomass burning emissions part II: intensive physical properties of biomass burning particles, Atmos. Chem. Phys., 2005, 5, 799–825 CrossRef CAS.
- D. A. Lack and C. D. Cappa, Impact of brown and clear carbon on light absorption enhancement, single scatter albedo and absorption wavelength dependence of black carbon, Atmos. Chem. Phys., 2010, 10, 4207–4220 CrossRef CAS.
- T. C. Bond, S. J. Doherty, D. W. Fahey, P. M. Forster, T. Berntsen, B. J. DeAngelo, M. G. Flanner, S. Ghan, B. Kärcher, D. Koch, S. Kinne, Y. Kondo, P. K. Quinn, M. C. Sarofim, M. G. Schultz, M. Schulz, C. Venkataraman, H. Zhang, S. Zhang, N. Bellouin, S. K. Guttikunda, P. K. Hopke, M. Z. Jacobson, J. W. Kaiser, Z. Klimont, U. Lohmann, J. P. Schwarz, D. Shindell, T. Storelvmo, S. G. Warren and C. S. Zender, Bounding the role of black carbon in the climate system: a scientific assessment, J. Geophys. Res.: Atmos., 2013, 118, 5380–5552 CrossRef CAS.
- N. Bluvshtein, P. Lin, J. Michel Flores, L. Segev, Y. Mazar, E. Tas, G. Snider, C. Weagle, S. S. Brown, A. Laskin and Y. Rudich, Broadband optical properties of biomass-burning aerosol and identification of brown carbon chromophores, J. Geophys. Res., 2017, 122, 5441–5456 CrossRef CAS.
- P. Lin, P. K. Aiona, Y. Li, M. Shiraiwa, J. Laskin, S. A. Nizkorodov and A. Laskin, Molecular Characterization of Brown Carbon in Biomass Burning Aerosol Particles, Environ. Sci. Technol., 2016, 50, 11815–11824 CrossRef CAS PubMed.
- V. Samburova, J. Connolly, M. Gyawali, R. L. N. Yatavelli, A. C. Watts, R. K. Chakrabarty, B. Zielinska, H. Moosmüller and A. Khlystov, Polycyclic aromatic hydrocarbons in biomass-burning emissions and their contribution to light absorption and aerosol toxicity, Sci. Total Environ., 2016, 568, 391–401 CrossRef CAS PubMed.
- M. S. Win, Z. Tian, H. Zhao, K. Xiao, J. Peng, Y. Shang, M. Wu, G. Xiu, S. Lu, S. Yonemochi and Q. Wang, Atmospheric HULIS and its ability to mediate the reactive oxygen species (ROS): a review, J. Environ. Sci., 2018, 71, 13–31 CrossRef CAS PubMed.
- L. T. Fleming, P. Lin, J. M. Roberts, V. Selimovic, R. Yokelson, J. Laskin, A. Laskin and S. A. Nizkorodov, Molecular composition and photochemical lifetimes of brown carbon chromophores in biomass burning organic aerosol, Atmos. Chem. Phys., 2020, 20, 1105–1129 CrossRef CAS.
Footnote |
| † Electronic supplementary information (ESI) available. See DOI: 10.1039/d1ea00055a |
| This journal is © The Royal Society of Chemistry 2022 |