 Open Access Article
Creative Commons Attribution 3.0 Unported Licence
SnO deposition via water based ALD employing tin(II) formamidinate: precursor characterization and process development†
Niklas
Huster‡
 a,
Ramin
Ghiyasi‡
b,
David
Zanders
 a,
Detlef
Rogalla
c,
Maarit
Karppinen
 *b and
Anjana
Devi
 *a
*a
aInorganic Materials Chemistry, Faculty of Chemistry and Biochemistry, Ruhr-University Bochum, 44801 Bochum, Germany. E-mail: anjana.devi@rub.de
bDepartment of Chemistry and Materials Science, Aalto University, FI-00076 Espoo, Finland. E-mail: maarit.karppinen@aalto.fi
cRUBION, Ruhr University Bochum, 44801 Bochum, Germany
First published on 31st August 2022
Abstract
Tin monoxide (SnO) is a promising oxide semiconductor which is appealing for a wide range of applications from channel materials in p-type field effect transistors (FET) to electrode materials searched for next-generation batteries. For the controlled growth of SnO films at low temperatures, atomic layer deposition (ALD) is employed in this study, where the choice of the precursor plays a significant role. A comparative thermal evaluation of four different amidinate-based tin(II) precursors and the influence of the ligand sphere on their physicochemical properties revealed that bis(N,N′-diisopropylformamidinato tin(II) (1) possesses the required volatility, good thermal stability and sufficient reactivity towards water, to be implemented as the ALD precursor. The water-assisted ALD process resulted in crystalline SnO films on Si substrates with a growth per cycle (GPC) of 0.82 Å at temperatures as low as 140 °C. By employing complementary analytical tools, namely, X-ray diffraction (XRD), atomic force microscopy (AFM), X-ray reflectivity (XRR), Rutherford backscattering spectrometry/nuclear reaction analysis (RBS/NRA) and X-ray photoelectron spectroscopy (XPS), the formation of tin monoxide was confirmed. Finally, the optical properties of the as-deposited films were analyzed via UV-Vis spectroscopy, exhibiting a band gap of 2.74 eV, which further confirms the formation of the targeted SnO phase.
Introduction
Tin oxides mainly occur in two different phases, as tin dioxide (SnO2) and as metastable tin monoxide (SnO), both combining properties like high optical transparency in the visible range of the electromagnetic spectrum1 and a low electrical resistance. In the stable oxidation state +IV, SnO2 exhibits n-type semiconductivity with a band gap of 3.6 eV.2 This compound is well established, e.g., in material composites like indium tin oxide (ITO) or fluorine doped tin oxide (FTO) as a transparent conductive oxide (TCO). In the oxidation state +II, SnO is an intrinsic p-type semiconductor with an optical band gap of 2.7–3.4 eV (ref. 3–5) and an indirect band gap of 0.7 eV.4,6 Particularly, the p-type semiconductivity of SnO is drawing great interest towards this material, since comparably a few p-type semiconducting materials7 exhibiting optical transparency and mechanical flexibility8 are known and accessible in the form of thin films. Herein, SnO is one of the materials likely to meet the demand for p-type TCO thin films for applications such as photovoltaics, thermoelectric modules9 and thin film transistors (TFTs).10 In TFTs, particularly p-type materials show significant advantages over their n-type counterparts for applications such as light-emitting diodes (LEDs).11 Further frequently reported applications of SnO thin films include gas sensing devices12 for a variety of reactive gases such as CO, CO2, NOx, NH3, SO2, H2S, Cl2, H2 or CH4. Hence, reliable processes for the deposition of SnO thin films are of high interest for material scientists and engineers.Fabrication of single-phase thin films of SnO has proven to be a rather challenging goal for a long time, due to its narrow phase stability and sensitivity towards oxidation to SnO2 at higher temperatures,6 or upon exposure to oxidative atmosphere. Most used deposition techniques for SnO include physical vapor deposition (PVD) techniques such as thermal evaporation11 and sputtering.13 However, some of these techniques are limited for thin film depositions on structurally demanding substrates. Chemical vapor deposition (CVD) is another option, but higher deposition temperatures are needed that precludes the use of sensitive substrates.14 Atomic layer deposition (ALD) as an advanced technology for highly controlled thin film deposition can adequately address this issue, featuring full surface coverage, and thickness control to an extent of atomic-scale and low temperature deposition.15–19 Particularly, water-based ALD processes, featuring comparably mild conditions in contrast to e.g., ozone or plasma assisted ALD, and thus targeting the oxidation sensitivity of SnO, are relevant for future developments and applications.
To date, only a few water-based ALD processes for the deposition of SnO have been reported. Tupala et al. reported a water based ALD process with comparably easily synthesized bis[bis(trimethylsilyl)amino] tin(II) ([Sn(tmsa)2]); this process yielded SnO films with a GPC value ranging from 0.05 to 0.18 Å.20 Bis(1-dimethylamino-2-methyl-2-propoxy) tin(II) ([Sn(dmamp)2]) was successfully utilized for the growth of p-type SnO films with GPC values ranging between 0.08 and 0.61 Å (ref. 21) depending on the deposition temperature, and later used for the fabrication of TFTs.22 In 2019, Kim et al. reported a process for phase-controlled growth of SnO2 and SnO films employing bis(N-ethoxy-2,2-dimethyl propanamido) tin(II) ([Sn(edpa)2]) as the precursor, resulting in a GPC value of 0.26 Å for amorphous SnO films with H2O as the co-reactant.23 Bis(dimethylamino-2-methyl-2-butoxy) tin(II) ([Sn(dmamb)2]) was recently used for the fabrication of p-channel TFTs in an ALD water process.24 The principle of co-reactant driven phase controlled growth of SnO2 and SnO was reported in 2018 by Lee et al., with a GPC value of about 0.5 Å, using bis(N-ethoxy-2,2-dimethyl propanamido) tin(II).25 Recently, Mameli et al. reported a high-throughput spatial ALD process for SnO using tin(II) bis(tert-amyloxide) ([Sn(TAA)2]) and water with GPC values of 0.09 Å to 0.55 Å.26
It is thus apparent that the choice of the precursor is crucial for the successful process development and process characteristics of SnO films. Rational design of the precursor ligand sphere can significantly tune physicochemical parameters like reactivity, volatilization temperature (Tvol) and aggregation state and can be tailored towards the desired properties for the respective processes. Furthermore, precursor handling, considering toxicity or pyrophoricity, thermal stability, and shelf-life can be improved by sophisticated precursor design. Synthesis, characterization, and ALD process development of different acetamidinate and formamidinate complexes as precursors have been previously reported.27–30 The employed ligand systems feature an all-nitrogen coordinating ligand sphere and show suitable balance between reactivity and stability to function as ALD precursors with mildly oxidizing co-reactants like H2O. By structural manipulation of the N-side chains and ligand backbone the physicochemical properties of these ligands can be tuned towards the desired characteristics. Recently, the synthesis and thermal characterization of structurally related Sn(II) triazenide with comparable volatilization behavior have been reported, however the applicability of the ALD process using this precursor was not demonstrated.31
Kim et al. previously reported the synthesis and evaluation of formamidinate- and acetamidinate-based tin(II) precursors, namely bis(diisopropylformamidinato) tin(II)28 ([Sn(iPr2fAMD)2] 1) and bis(diisopropylacetamidinato) tin(II)27 ([Sn(iPr2AMD)2] 3), and the successful deposition of SnS employing these precursors with H2S as the co-reactant. Here the thermal properties and evaporation behavior of compounds 1 and 3 were compared to those of another precursor, N,N′-di-tert-butyl-2,3-diamidobutane tin(II). Motivated by this study, we were interested in incremental structural variations of the ligand N-side chain and their respective impact on thermal and physicochemical properties. Taking the reported SnS ALD process into account, these precursors are likely to be suitable for co-reactant conversion to the lower sulfur homologue oxygen in a water based thermal ALD process for the deposition of SnO, where we were interested in deposition temperature (Tdep) driven phase control of the deposited thin film.
Herein, we report a comparative study on four different amidinate-based precursors of tin(II), namely previously reported bis(diisopropylformamidinato) tin(II) ([Sn(iPr2fAMD)2], 1) and bis(diisopropylacetamidinato) tin(II) ([Sn(iPr2AMD)2], 3) in comparison with the newly synthesized bis(di-tert-butyl-formamidinato) tin(II) ([Sn(tBu2fAMD)2], 2), and bis(ethyl-tert-butyl-acetamidinato) tin(II) ([Sn(EttBuAMD)2], 4). These four compounds were chosen to evaluate the influence of small but distinct changes in the precursor ligand sphere on the precursor properties such as thermal stability, reactivity, and volatility. Motivated by the comparative thermal studies previously reported,28–30,32 our goal was to gain a deeper insight into the influence of extended rational manipulation of the precursor ligand sphere, namely structural variation of the N-side chain. As compound 4 has the same molecular mass as that of 3 with structural variation towards asymmetric N-side chains, the impact of only structural variations on the aggregation state and general thermal behavior could be investigated. In the case of the formamidinate ligand system, the influence of a bulkier N-side chain substitution pattern in the form of tert-butyl was characterized.
The synthesized compounds were analyzed by means of 1H and 13C nuclear magnetic resonance spectroscopy (NMR), elemental analysis (EA), infrared spectroscopy (IR), and electron impact mass spectrometry (EI-MS). In addition, the solid-state structure was determined by means of single crystal X-ray diffraction (SCXRD).
Employing 1 as a precursor, we developed a new water-based ALD process for the deposition of SnO thin films and the temperature driven phase control of the deposition product. The growth characteristics and film properties are compared to the growth and crystallographic and compositional characteristics of the previously reported ALD-grown SnS (employing H2S and 1) and SnO films.
Results and discussion
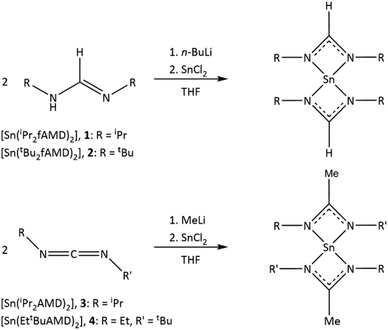
Most common synthesis procedures for metalorganic tin complexes comprise ligand exchange reactions33 or salt-metathesis reactions employing organolithium or Grignard reagents.34 For the synthesis of 1–4, the straightforward salt-metathesis route via lithiation of the amidine ligands reported by Kim et al.27,28 was adapted with minor modifications. Bis(di-tert-butyl-formamidinato) tin(II) ([Sn(tBu2fAMD)2], 2) and bis(ethyl-tert-butyl-acetamidinato) tin(II) ([Sn(EttBuAMD)2], 4) were synthesized alongside compounds 1 and 3 and thoroughly characterized (Scheme 1).The products were purified via distillation (2) and sublimation (4) in yields ranging around 70%. The spectroscopic purity was verified employing nuclear NMR spectroscopy. The corresponding 1H and 13C NMR spectra are provided in the ESI (Fig. S1 and S2).†
Structural analysis
The solid-state structure of 4 (Fig. 1) was derived from SCXRD analysis of crystals directly obtained after workup via sublimation. Quite like compound 3, compound 4 crystallizes in a monomeric structure with four-fold coordination of the bidentate ligands. Resulting from the κ2-N,N′-coordination and the stereo chemically active lone pairs at the tin(II) center, compound 4 exhibits a distorted square pyramidal geometry. The Sn–N bond distances are within the same range, showing slightly shorter bond length for the ethyl substituted Sn–N bonds in the range of 2.178(4) Å–2.187(5) Å, in comparison with the tert-butyl substituted Sn–N bonds with bond distances of 2.333(4) Å–2.361(5) Å. A similar trend of bond length distortion can be observed for the structure of compound 3, where the sum of Sn–N bond distances is slightly bigger than that of compound 4. The backbone C–N bond distances of 4 range from 1.318(7) Å to 1.342(7) Å, which is in good agreement with those reported for 3 (1.324(4) Å–1.333(4) Å). The selected bond distances of 3 and 4 are compared in Table 1. The bond angles of the bidentate ligands towards the metal center range from N002–Sn01–N003 = 58.3(1)° to N004–Sn01–N005 = 57.7(2)° and are in a comparable range to the ligand binding angle reported for compound 3 (57.82(9)°). Ligand orientation supports the observation of a distorted square pyramidal geometry with angle values close to 90° in the range of 87.2(2)°–94.7(2)° for three of the angles and a value of N003–Sn01–N004 = 130.7(1)° for only one. This matches the trend reported by Kim et al. for the diisopropyl derivate (3), while the sum of the comparable angles is higher than that of the derivate featuring asymmetric ligands. Selected bond angles in comparison for both the asymmetric compound 4 and symmetric compound 3 are given in Table 1.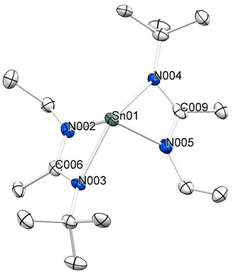 | ||
| Fig. 1 Solid state structure with the displacement ellipsoid plot (50% probability) of [Sn(EttBuAMD)2] (4). Hydrogens are omitted for clarity. | ||
| Asymmetric | Symmetric | ||
|---|---|---|---|
| Bis(N-ethyl-N′-tert-butyl-acetamidinato) tin(II), [Sn(EttBuAMD)2] (4) | Bis(N,N′-diisopropyl-acetamidinato) tin(II),27 [Sn(iPr2AMD)2] (3) | ||
| Bond distances (Å) | |||
| Sn01–N002 | 2.178(4) | Sn1–N3 | 2.192(3) |
| Sn01–N003 | 2.333(4) | Sn1–N2 | 2.195(2) |
| Sn01–N004 | 2.361(4) | Sn1–N1 | 2.386(3) |
| Sn01–N005 | 2.187(5) | Sn1–N4 | 2.388(3) |
| N002–C006 | 1.333(6) | N1–C4 | 1.325(4) |
| N003–C006 | 1.324(7) | N2–C4 | 1.331(4) |
| N004–C009 | 1.318(7) | N3–C12 | 1.333(4) |
| N005–C009 | 1.342(7) | N4–C12 | 1.324(4) |
| Bond angles (°) | |||
| N002–Sn01–N003 | 58.3(1) | N2–Sn1–N1 | 57.82(9) |
| N002–Sn01–N004 | 88.8(1) | N3–Sn1–N2 | 98.12(9) |
| N002–Sn01–N005 | 94.7(2) | N3–Sn1–N1 | 92.88(9) |
| N003–Sn01–N004 | 130.7(1) | N1–Sn1–N4 | 136.40(8) |
| N003–Sn01–N005 | 87.2(2) | N2–Sn1–N4 | 92.47(2) |
| Sn01–N002–C006 | 97.6(3) | C4–N1–Sn1 | 89.80(18) |
| Sn01–N003–C006 | 90.9(3) | C4–N2–Sn1 | 98.24(18) |
| N002–C006–N003 | 112.0(4) | N1–C4–N2 | 113.5(3) |
Infrared spectroscopy
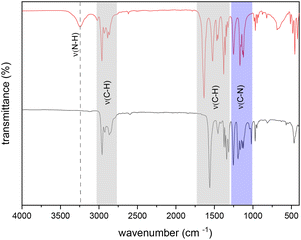
The spectroscopic purity of the isolated isopropyl-substituted compounds 1 and 3 was further analyzed by means of IR analysis. For both compounds, the absence of ν(N–H) signals (3.247 cm−1) indicates full conversion of the reactants without a residual free ligand. In the regions of ∼3000–2750 cm−1 and ∼1700–1250 cm−1 signals for the C–H stretches are observed. Signals in the region of ∼1250–1000 cm−1 wavenumbers correspond to the C–N stretches. The IR spectra of compound 1 and the respective free ligand (N,N′-diisopropylformamidine) are exemplarily shown for compound 1 in Fig. 2.Mass spectrometry
For complementary verification of the formation of the target compound, EI-MS was performed for compounds 1, 3, and 4. For the three compounds, the molecular peak [M+] and the molecule with one ligand cleaved off ([M+ − L]; L = ligand) was found in relatively low abundance. The low abundance of the [M+] and [M+ − L] peaks can be attributed to the harsh ionization conditions during EI-MS and thus strong fragmentation of the sensitive complexes. The most prominent detected fragments are listed in Table 2.| Compound | 1 | 3 | 4 | |||
|---|---|---|---|---|---|---|
| Fragment | m/z | Rel. int. (%) | m/z | Rel. int. (%) | m/z | Rel. int. (%) |
| M+ | 374.2 | <1% | 402.3 | 4.46 | 402.2 | <1 |
| M+–2tBu | — | — | — | — | 281.2 | 2.95 |
| M+–L | 247 | <1% | 261.1 | 27.47 | 261.1 | <1 |
| M+–L–tBu | — | — | — | — | 207.1 | 16.49 |
| L+ | 128.2 | 35.94 | 141.2 | 100 | 142.3 | 35.2 |
| L+–tBu | — | — | — | — | 86.1 | 23.12 |
| L+–Et–tBu | — | — | — | — | 58.1 | 100 |
| L+–2Pr | 43.1 | 100 | — | — | — | — |
| Pr+ | 43.1 | 100 | 42.1 | 43.35 | — | — |
| t Bu+ | — | — | — | — | 42.1 | 94.02 |
| Et+ | — | — | — | — | 29.1 | 23.07 |
| Me+ | — | — | — | — | 15 | 8.9 |
Thermal characteristics
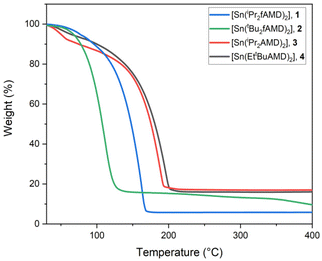 | ||
| Fig. 3 Thermogravimetric analysis of compounds 1–4 with a heating rate of 5 °C min−1 and a N2 flow rate of 300 mL min−1. | ||
In comparison, both liquid formamidinate derivatives (1 and 2) show lower Tvol and lower residual masses than 3 and 4, with 5.8 wt% for 1 and 15.5 wt% further decreasing to 9.8 wt% for 2. This indicates a lower thermal stability for the tBu-substituted formamidine derivative 2, alongside a higher vapor pressure. The higher vapor pressure most likely is attributable to the bulkier N-side chain substituents, allowing less intermolecular interaction, but also resulting in a lower thermal stability of the compound.
ALD process development
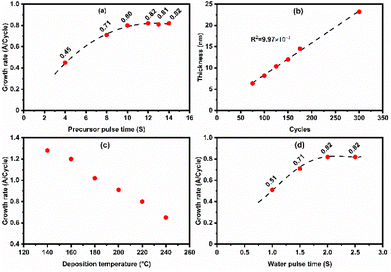
Compound 1 was selected over compound 2 for ALD process development for the following reasons: (a) higher thermal stability, (b) lower Tvol and (c) higher synthetic yields of the ligand and Sn-complex. To investigate the impact of each individual process parameter and to finally optimize the process conditions, a series of depositions were carried out.First, the precursor pulse time was varied (4–14 s) while keeping all other parameters fixed to: bubbler temperature 60 °C, deposition temperature 220 °C, H2O pulse length 2 s, purge time 30 s for both precursors, and 150 ALD cycles. The complete surface saturation was reached for the precursor pulse of 10 s or longer (Fig. 5a). This indicates the self-limiting nature of the deposition process that is an essential characteristic of an ALD process.
Next, the precursor pulse length was fixed to 10 s, and the number of ALD cycles applied was varied; a linear dependence of film thickness on the number of cycles could be confirmed – as expected for an ALD process – with an average GPC value of 0.82 Å (Fig. 5b).
Fig. 5c displays the GPC values obtained at different deposition temperatures ranging from 140 to 240 °C, demonstrating a gradual decrease of GPC with increasing deposition temperature. A similar temperature dependence behavior was also reported for the SnS process with the same precursor and H2S as the co-reactant,28 and for a series of group III,35,36 IV37 and IIB38,39 sulfide depositions. In the case of the SnO processes, based on the bis(1-dimethylamino-2-methyl-2-propoxy) tin(II)21 and N,N′-tert-butyl-1,1-dimethylethylenediamine tin(II) precursors,25 this behavior was explained by the decreasing number of available reactive surface hydroxyl groups.
Finally, we optimized the H2O pulse time while keeping the other parameters fixed to the aforementioned values; from Fig. 5d, it is seen that the film growth saturates with the 2 s H2O pulse time with a GPC value of 0.82 Å. Purging times for the precursor and H2O were set to 30 s of N2 purging. These purging times were chosen to ensure the films free of H2O and traceable as no thickness change was observed after annealing up to 420 °C.
Film characterization
Rutherford backscattering spectrometry
The bulk film composition was analyzed by means of RBS/NRA. Derived from RBS, the presence of the main elements Sn and O is observed. The composition variation as a function of the deposition temperature is given in Table 3. The obtained data indicate an O/Sn ratio close to 1.0, however, at lower temperatures slightly higher ratios are observed due to excess hydroxyl groups; the values are ranging from 1.04 to 1.34 (see Table 3). The C and N contamination level determined via NRA is below 1 at% for most of the deposited films, with slightly higher values for Tdep of 160 °C and 200 °C (Table 3).| T dep (°C) | O/Sn | Sn (at.%) | O (at.%) | C (at%) | N (at.%) |
|---|---|---|---|---|---|
| 140 | 1.22 | 44.7 | 54.6 | 0.7 | 0.0 |
| 160 | 1.34 | 40.5 | 54.1 | 1.1 | 4.3 |
| 180 | 1.10 | 47.7 | 52.3 | 0.0 | 0.0 |
| 200 | 1.18 | 42.3 | 50.1 | 5.2 | 2.3 |
| 220 | 1.07 | 48.2 | 51.4 | 0.2 | 0.2 |
| 240 | 1.04 | 49.0 | 51.0 | 0.0 | 0.0 |
X-ray photoelectron spectroscopy
Complementary to RBS/NRA analysis, XPS was used to investigate the chemical species and surface composition (∼2 nm–5 nm depth) of a selected thin film deposited at 180 °C obtained with optimized process parameters. Survey scans for the investigated film exhibited no other contamination-related species than adventitious carbon and all expected Sn and O X-ray induced photoemission lines were clearly visible (Fig. S9†). The Sn 3d and O 1s core levels were evaluated in detail and are shown in Fig. 8, while the extracted peak positions, peak integrals, full width at half maximum (FWHM) values and associated species are summarized in Table 4. Owing to the proximity of Sn2+ and Sn4+, binding energies in the Sn 3d core level region, the capability of laboratory based XPS with its restricted energy resolution to determine the exact oxidation state of the metal on the surface is limited. However, notable differences in the O/Sn surface ratio and shifts in the binding energies can forward a valid statement on the oxidation state of Sn in the film.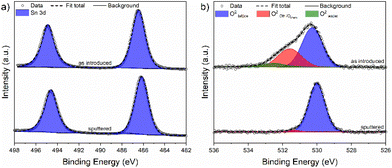 | ||
| Fig. 8 XPS core level spectra showing (a) deconvoluted Sn 3d and (b) deconvoluted O 1s peak positions of a SnO thin film deposited on Si at 180 °C before and after sputtering. | ||
| Species | As introduced | Sputtered | ||||
|---|---|---|---|---|---|---|
| Energya (eV) | Integral (%) | FWHM (eV) | Energya (eV) | Integral (%) | FWHM (eV) | |
| a Energy = binding energy. b As no clear differentiation between the Sn2+ and Sn4+ states is possible, oxidation numbers are omitted. | ||||||
| Sn 3d5/2b | 486.4 | 100 | 1.64 | 486.1 | 100 | 1.54 |
| O2−lattice | 530.3 | 61.2 | 1.52 | 530.1 | 96.7 | 1.14 |
| O2−OH/chem. | 531.5 | 32.2 | 1.62 | 531.4 | 3.3 | 0.7 |
| O2−(Water) | 532.5 | 6.6 | 1.41 | — | — | — |
The position of the Sn 3d5/2 spin orbital component in the Sn 3d core level for stoichiometric SnO2 is reported to be at 486.6 eV typically for lab based XPS.40 Thus, it comes to no surprise that XPS investigations on SnO2 thin films deposited by numerous thermal and plasma-enhanced ALD processes located the Sn 3d5/2 component in a narrow range of 486.5–486.9 eV.21,34,41,42 In contrast to this, the position of the Sn 3d5/2 core level for SnO is known to be around 486.2 eV for the films deposited with either chemical or physical methods.21,42–44 In our study (Fig. 8a), the thin films deposited at 180 °C exhibited a binding energy of 486.4 eV. It is noteworthy that the O/Sn ratio was determined to be 1.2 indicating the presence of additional oxygen species apart from lattice oxygen in the immanent surface region. After sputtering, the position of the Sn 3d5/2 core level was shifted to a slightly lower value of 486.1 eV which is again consistent with the literature.
To obtain a better understanding of the surface functional groups embedding the Sn species and potential differences between them, the O 1s core level region was analyzed as shown in Fig. 8b. For the as introduced surface, generally three different oxygen species were found. They can be assigned to lattice O2− (529.7–530.3 eV),34,40,45 chemisorbed oxygen species and hydroxyls (531.4–531.8 eV),45–47 and physisorbed H2O (532.4–533.0 eV).48,49 The oxygen lattice component at 530.3 eV exhibited a contribution of 61.2% to the overall core level integral while it was 32.2% for the chemisorbed oxygen species and hydroxyls at 531.5 eV. With 6.6%, the adsorbed water at 532.5 eV provided only a minor contribution. As a consequence of the sputter treatment, the contribution of both the last-mentioned species to the oxygen core level diminished, as seen in Fig. 8b and Table 4.
UV-Vis spectroscopy
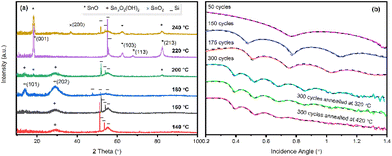
Optical bandgaps were determined from the measured UV-Vis absorbance spectra through the Tauc plot method for the as-deposited (at 220 °C) SnO film and for the same film after being annealed at 320 and 420 °C (Fig. 9). An optical band gap of 2.74 eV was calculated for all the films, and it matches the value of 2.76 eV reported for SnO in the literature.4,5 The consistency of this value throughout the annealing up to 420 °C is taken as a strong indication of the purity of the obtained films. The slight increase in the absorbance could be due to an increase in the degree of crystallinity, as we observed both slightly higher roughness values from XRR fittings and slightly increased diffraction peak intensities in the GIXRD patterns for the annealed films, see Fig. S8 (ESI).†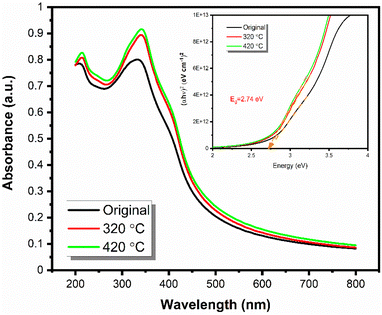 | ||
| Fig. 9 UV-Vis spectra of the originally obtained thin film and annealed ones at higher temperatures and the Tauc plot. | ||
Conclusions
We reported the successful synthesis of four acetamidinate and formamidinate based Sn(II) precursors and their comprehensive characterization, especially for the influence of structural variation of the ligand sphere on the thermal properties. Compound 1 was investigated for its long-term thermal stability. It was moreover successfully employed in a water-based ALD process for the fabrication of phase-pure thin films of SnO with the potential of temperature driven phase control towards SnO2, employing only one precursor.The direct fabrication of in situ crystalline and phase pure thin films of the p-type semiconductor SnO films at a relatively low temperature, 220 °C, without post deposition treatment such as annealing indicates the high potential of this process for reliable and large-scale development. This is remarkable as the variety of facile ALD processes are lacking behind for their n-type counterparts (e.g. ZnO and TiO2).
Another attractive fact is that this newly developed ALD process for SnO is water-based, which makes it compatible with the typical molecular layer deposition (MLD) processes. Hence the inclusion of organic layers inside the SnO structure should be readily achieved to create new exciting synergistic functionalities.50–56 We foresee that the breakthroughs in this field could open a whole new area of possibilities in numerous application domains.
Experimental
Precursor synthesis and characterization
All reactions and handling of air- and moisture sensitive compounds were carried out under a dried argon atmosphere (Air Liquide, 99.995%) using a conventional Schlenk technique. Sample preparation for further analysis was carried out in an argon filled glovebox (Mbraun). All commercially available chemicals were used without further purification. Solvents were dried by using a solvent purification system (MBraun) and stored over molecular sieves (4 Å) under an argon atmosphere. NMR-solvents were degassed and dried over activated molecular sieves (4 Å). Formamidines were synthesized from triethyl orthoformate (Alfa Aesar), acetic acid (Acros) and isopropylamine (Acros) or tert-butylamine (Acros), respectively, following previously reported procedures.57 Acetamidinate ligands were synthesized in situ from the respective carbodiimides (Acros) and MeLi (Acros). Anhydrous SnCl2 was purchased from Alfa Aesar and n-butyllithium was purchased from Acros.For product characterization, different NMR-spectrometers were used, namely Bruker DPX-200 and Bruker Avance III 400. All spectra were referenced to the internal solvent signal (C6D6) and analyzed with the software MestReNova v10.0.2-15465 from Mestrelab Research S.L.
EI-MS were recorded at the RubioSpec Service Center of the Ruhr-University Bochum with a Varian MAT spectrometer at an ionizing energy of 70 eV.
IR measurements were performed on a FT-IR spectrometer Spectrum Two by PerkinElmer, utilizing an UATR Two ATR-unit by PerkinElmer, placed in an argon filled glove box.
TGA was performed on a Netzsch STA 409 PC at ambient pressure (sample size ≈ 10 mg), with a heating rate of 5 °C min−1 (N2 flow rate = 300 mL min−1), placed in an argon (Air Liquide, 99.995%) filled glove box (SylaTech).
Bis(N,N′-diisopropylformamidinato) tin(II) (1) was synthesized following a slightly modified procedure reported by Kim et al.28 5.13 g of N,N′-diisopropylformamidine (40 mmol, 2 equiv.) in THF was treated with an equimolar amount of 1.6 M n-BuLi in n-hexane. The mixture was reacted with a solution of 3.79 g of SnCl2 (20 mmol, 1 equiv.) in THF. After filtration and extraction in n-hexane, the solvent was evaporated, and the product was purified via distillation in a vacuum at 70 °C and isolated as a colorless oil (yield: 68%). Calc. (%): C: 45.07, H: 8.10, N: 15.02 found (%): C: 43.61, H: 7.72, N: 13.99, 1H NMR (400 MHz, C6D6) δ (ppm) = 1.31 (d, 24H), 3.56 (h, 4H), 8.29 (s, 2H) 13C NMR (101 MHz, C6D6) δ = 26.15, 51.28, 159.86, IR (cm−1): ν(C–H) = 2965, ν(C–H) = 2860, δ(C–H) = 1564, ν(C–H) = 1346, ν(C–N) = 1254, ν(C–N) = 1191.
Bis(N,N′-di-tert-butylformamidinato) tin(II) (2) was synthesized following a similar synthesis route to that used for compound 1, treating 530 mg of N′′-di-tert-butylformamidine (3.4 mmol, 2 equiv.) in THF with an equimolar amount of 1.6 M n-BuLi in n-hexane. Subsequently the mixture was reacted with a solution of 322 mg of SnCl2 (1.7 mmol, 1 equiv.) in THF. The workup was performed as for 1. After purification via vacuum distillation at 70 °C, 2 was isolated as a colorless oil (yield: 52%). 1H NMR (200 MHz, C6D6) δ (ppm) = 1.16 (d, 36H), 7.36 (s, 2H) 13C NMR (50 MHz, C6D6) δ (ppm) = 31.81, 52.99, 156.52.
Bis(N,N′-diisopropylacetamidinato) tin(II) (3) was synthesized following a literature procedure reported by Kim et al.27 and purified via sublimation at 90 °C (yield: 68%). Calc. (%): C: 47.9, H: 8.54, N: 13.97 found: C: 47.73, H: 8.53, N: 14.45, 1H NMR (200 MHz, C6D6) δ (ppm) = 1.30 (d, 24H), 1.54 (s, 6H), 3.68 (h, 4H) 13C NMR (50 MHz, C6D6) δ (ppm) = 12.33, 25.70, 47.77, 165.59.
Bis(N-ethyl-N′-tert-butylacetamidinato) tin(II) (4). 3.94 mL of MeLi (1.6 M) (6.3 mmol, 2.1 equiv.) in Et2O was treated with 0.93 mL of N-ethyl-N′-tert-butyl-carbodiimide (6 mmol, 2 equiv.) and a solution of 568.8 mg of SnCl2 (3 mmol, 1 equiv.) in THF was added dropwise. All volatiles were removed in a vacuum, and the product was extracted in n-hexane and isolated via sublimation at 90 °C as a white crystalline solid (yield: 73%). 1H NMR (200 MHz, C6D6) δ (ppm) = 1.02 (t, 6H), 1.30 (s, 18H), 1.66 (s, 6H), 3.36 (q, 4H) 13C NMR (50 MHz, C6D6) δ (ppm) = 15.62, 18.70, 32.36, 40.26, 51.46, 166.60, IR (cm−1): ν(C–H) = 2952, ν(C–H) = 2860, δ(C–H) = 1505, δ(C–H) = 1437, ν(C–N) = 1332, ν(C–N) = 1230.
Thin film deposition
The thin films were deposited in an F120 ALD flow-type reactor from ASM Microchemistry Ltd. on 2 × 2 cm silicon, glass, and quartz substrates. The silicon substrates (Okmetic Oyj; 2 × 2 cm2) were washed with deionized water and ethanol before use. The quartz substrates (Finnish Special Glass Oy; 2 × 1 cm2) were used as provided by the supplier. During the depositions, water was utilized as the co-reactant, and N2 as the carrier and purge gas. Bubbler temperatures were kept constant where the tin precursor was evaporated at 60 °C and water at room temperature for all the depositions. All further parameters were varied for optimized conditions as described above.Film characterization
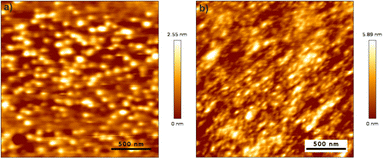
Film densities, film morphology and growth rates were determined by means of XRR and GIXRD (PANalytical X'Pert diffractometer, Cu Kα source) with an incidence angle of 0.5°. XRR patterns were fitted with the X'Pert Reflectivity program v1.3 from PANalytical.AFM measurements of the selected films were conducted using a JPK NanoWizard 3 device in the tapping mode at a frequency of 218 kHz and a line rate of 1 Hz. The recorded images were further analyzed using the Gwyddion software58 to access the RMS roughness of the analyzed films.
RBS/NRA measurements were carried out at the Central Unit for Ion Beams and Radionuclides (RUBION) at the Ruhr-University Bochum. RBS was carried out with a 2.0 MeV 4He+ ion beam with an intensity of about 40 nA in combination with a particle detector placed at 160°. For NRA a 1.0 MeV deuteron beam with an intensity of about 80 nA was used. Emitted protons from the nuclear reactions were detected by using a particle detector at 135°, which was shielded against elastically scattered deuterons by a Ni foil. In both methods, a tilt angle of 7° was applied to the films. The spectra were analyzed with the software SIMNRA.59
XPS was carried out on a PHI 5000 instrument. The X-ray source was operated at 10 kV and 24.6 W using Al Kα (1486.6 eV) radiation with a 45° electron takeoff angle. The kinetic energy of electrons was analyzed with a spherical Leybold EA-10/100 analyzer using a pass energy of 18 eV. The films were analyzed by a combination of survey scans and core level scans for peaks of interest. Step widths were adjusted to 0.5 eV for each survey scan and 0.05 eV for the core level scans. Spectra were recorded prior to and after sputter cleaning (2 min 2 kV 2 × 2). All binding energies of tin Sn 3d and oxygen O 1s were referenced to adventitious carbon C 1s at 284.8 eV.60 The analysis chamber pressure was maintained at < 10−7 mbar. Deconvolution analysis was completed with Shirley background processing and Gaussian functions using UniFit 2017 software.61 The spin–orbit splitting between Sn 3d5/2 and Sn 3d3/2 was set to 8.4 eV. The FWHM was calculated during the fitting procedure using functions built into UniFit 2017.
Author contributions
All authors have given approval to the final version of the manuscript. N. H. and R. G. contributed equally to the manuscript. N. H. and R. G. were involved in project management, ideation film characterization, data interpretation, and manuscript writing; N. H., precursor synthesis, analysis, and precursor selection; R. G., ALD process development and depositions, and UV-Vis spectroscopy; D. Z., XPS analysis; D. R., RBS/NRA analysis; A. D. and M. K., ideation and project supervision.Conflicts of interest
There are no conflicts to declare.Acknowledgements
The authors at the RUB thank the BMBF project ForMikro-FlexTMDSense (16ES1096K) and DFG-SPP 1796; FFLexCom; DE-790-17-1 for funding. Funding from the European Union's Horizon 2020 research and innovation programme under the Marie Skłodowska-Curie grant agreement (No. 765378) is acknowledged. DZ thanks the Fund of Chemical Industries for supporting his PhD project (Kekulé fellowship). The authors acknowledge Florian Preischel for performing AFM measurements.References
- S. Das and V. Jayaraman, Prog. Mater. Sci., 2014, 66, 112–255 CrossRef CAS.
- A. Stanulis, A. Hardy, C. de Dobbelaere, J. D'Haen, M. van Bael and A. Kareiva, J. Sol-Gel Sci. Technol., 2012, 62, 57–64 CrossRef CAS.
- W. Guo, L. Fu, Y. Zhang, K. Zhang, L. Y. Liang, Z. M. Liu, H. T. Cao and X. Q. Pan, Appl. Phys. Lett., 2010, 96, 42113 CrossRef.
- Y. Ogo, H. Hiramatsu, K. Nomura, H. Yanagi, T. Kamiya, M. Hirano and H. Hosono, Appl. Phys. Lett., 2008, 93, 32113 CrossRef.
- J. P. Allen, D. O. Scanlon, L. F. J. Piper and G. W. Watson, J. Mater. Chem. C, 2013, 1, 8194 RSC.
- J. Geurts, S. Rau, W. Richter and F. J. Schmitte, Thin Solid Films, 1984, 217–225 CrossRef CAS.
- K. J. Saji, Y. P. Venkata Subbaiah, K. Tian and A. Tiwari, Thin Solid Films, 2016, 605, 193–201 CrossRef CAS.
- K. Okamura, B. Nasr, R. A. Brand and H. Hahn, J. Mater. Chem., 2012, 22, 4607 RSC.
- S. A. Miller, P. Gorai, U. Aydemir, T. O. Mason, V. Stevanović, E. S. Toberer and G. J. Snyder, J. Mater. Chem. C, 2017, 5, 8854–8861 RSC.
- C. Shen, Z. Yin, F. Collins and N. Pinna, Adv. Sci., 2022, 9, 2104599 CrossRef CAS.
- H.-N. Lee, H.-J. Kim and C.-K. Kim, Jpn. J. Appl. Phys., 2010, 49, 20202 CrossRef.
- H.-J. Kim and J.-H. Lee, Sens. Actuators, B, 2014, 192, 607–627 CrossRef CAS.
- P.-C. Hsu, S.-P. Tsai, C.-H. Chang, C.-J. Hsu, W.-C. Chen, H.-H. Hsieh and C.-C. Wu, Thin Solid Films, 2015, 585, 50–56 CrossRef CAS.
- T. Wildsmith, M. S. Hill, A. L. Johnson, A. J. Kingsley and K. C. Molloy, Chem. Commun., 2013, 49, 8773–8775 RSC.
- T. Suntola, Mater. Sci. Rep., 1989, 4, 261–312 CrossRef CAS.
- S. M. George, Chem. Rev., 2010, 110, 111–131 CrossRef CAS PubMed.
- H. H. Sønsteby, A. Yanguas-Gil and J. W. Elam, J. Vac. Sci. Technol., A, 2020, 38, 20804 CrossRef.
- R. W. Johnson, A. Hultqvist and S. F. Bent, Mater. Today, 2014, 17, 236–246 CrossRef CAS.
- T. S. Tripathi and M. Karppinen, Adv. Mater. Interfaces, 2017, 4, 1700300 CrossRef.
- J. Tupala, M. Kemell, M. Mattinen, K. Meinander, S. Seppälä, T. Hatanpää, J. Räisänen, M. Ritala and M. Leskelä, J. Vac. Sci. Technol., A, 2017, 35, 41506 CrossRef.
- J. H. Han, Y. J. Chung, B. K. Park, S. K. Kim, H.-S. Kim, C. G. Kim and T.-M. Chung, Chem. Mater., 2014, 26, 6088–6091 CrossRef CAS.
- S. H. Kim, I.-H. Baek, D. H. Kim, J. J. Pyeon, T.-M. Chung, S.-H. Baek, J.-S. Kim, J. H. Han and S. K. Kim, J. Mater. Chem. C, 2017, 5, 3139–3145 RSC.
- H. Y. Kim, J. H. Nam, S. M. George, J.-S. Park, B. K. Park, G. H. Kim, D. J. Jeon, T.-M. Chung and J. H. Han, Ceram. Int., 2019, 45, 5124–5132 CrossRef CAS.
- M. G. Chae, S. H. Han, B. K. Park, T.-M. Chung and J. H. Han, Appl. Surf. Sci., 2021, 547, 148758 CrossRef CAS.
- J.-H. Lee, M. Yoo, D. Kang, H.-M. Lee, W.-H. Choi, J. W. Park, Y. Yi, H. Y. Kim and J.-S. Park, ACS Appl. Mater. Interfaces, 2018, 10, 33335–33342 CrossRef CAS.
- A. Mameli, J. D. Parish, T. Dogan, G. Gelinck, M. W. Snook, A. J. Straiton, A. L. Johnson and A. J. Kronemeijer, Adv. Mater. Interfaces, 2022, 9, 2101278 CrossRef CAS.
- S. B. Kim, P. Sinsermsuksakul, A. S. Hock, R. D. Pike and R. G. Gordon, Chem. Mater., 2014, 26, 3065–3073 CrossRef CAS.
- S. B. Kim, X. Zhao, L. M. Davis, A. Jayaraman, C. Yang and R. G. Gordon, ACS Appl. Mater. Interfaces, 2019, 11, 45892–45902 CrossRef CAS.
- N. Boysen, D. Zanders, T. Berning, S. M. J. Beer, D. Rogalla, C. Bock and A. Devi, RSC Adv., 2021, 11, 2565–2574 RSC.
- P. Kaur, L. Mai, A. Muriqi, D. Zanders, R. Ghiyasi, M. Safdar, N. Boysen, M. Winter, M. Nolan, M. Karppinen and A. Devi, Chem. – Eur. J., 2021, 27, 4913–4926 CrossRef CAS.
- R. Samii, D. Zanders, A. Fransson, G. Bačić, S. T. Barry, L. Ojamäe, V. Kessler, H. Pedersen and N. J. O'Brien, Inorg. Chem., 2021, 60, 12759–12765 CrossRef CAS PubMed.
- P. Sinsermsuksakul, J. Heo, W. Noh, A. S. Hock and R. G. Gordon, Adv. Energy Mater., 2011, 1, 1116–1125 CrossRef CAS.
- N. Huster, D. Zanders, S. Karle, D. Rogalla and A. Devi, Dalton Trans., 2020, 49, 10755–10764 RSC.
- L. Mai, D. Zanders, E. Subaşı, E. Ciftyurek, C. Hoppe, D. Rogalla, W. Gilbert, T. D. L. Arcos, K. Schierbaum, G. Grundmeier, C. Bock and A. Devi, ACS Appl. Mater. Interfaces, 2019, 11, 3169–3180 CrossRef CAS PubMed.
- X. Meng, J. A. Libera, T. T. Fister, H. Zhou, J. K. Hedlund, P. Fenter and J. W. Elam, Chem. Mater., 2014, 26, 1029–1039 CrossRef CAS.
- S. K. Sarkar, J. Y. Kim, D. N. Goldstein, N. R. Neale, K. Zhu, C. M. Elliott, A. J. Frank and S. M. George, J. Phys. Chem. C, 2010, 114, 8032–8039 CrossRef CAS.
- G. Popov, G. Bačić, M. Mattinen, T. Manner, H. Lindström, H. Seppänen, S. Suihkonen, M. Vehkamäki, M. Kemell, P. Jalkanen, K. Mizohata, J. Räisänen, M. Leskelä, H. M. Koivula, S. T. Barry and M. Ritala, Chem. Mater., 2020, 32, 8216–8228 CrossRef CAS.
- J. R. Bakke, J. S. King, H. J. Jung, R. Sinclair and S. F. Bent, Thin Solid Films, 2010, 518, 5400–5408 CrossRef CAS.
- J. R. Bakke, H. J. Jung, J. T. Tanskanen, R. Sinclair and S. F. Bent, Chem. Mater., 2010, 22, 4669–4678 CrossRef CAS.
- M. A. Stranick and A. Moskwa, Surf. Sci. Spectra, 1993, 2, 45–49 CrossRef CAS.
- J. Heo, A. S. Hock and R. G. Gordon, Chem. Mater., 2010, 22, 4964–4973 CrossRef CAS.
- D. Shuttleworth, J. Phys. Chem., 1980, 84, 1629–1634 CrossRef CAS.
- R. O. Ansell, T. Dickinson, A. F. Povey and P. M. A. Sherwood, J. Electron Spectrosc. Relat. Phenom., 1977, 11, 301–313 CrossRef CAS.
- R. Naeem, M. A. Ehsan, A. Rehman, Z. H. Yamani, A. S. Hakeem and M. Mazhar, New J. Chem., 2018, 42, 5256–5266 RSC.
- B.-E. Park, J. Park, S. Lee, S. Lee, W.-H. Kim and H. Kim, Appl. Surf. Sci., 2019, 480, 472–477 CrossRef CAS.
- W. J. Kim, W. H. Koo, S. J. Jo, C. S. Kim, H. K. Baik, J. Lee and S. Im, Appl. Surf. Sci., 2005, 252, 1332–1338 CrossRef CAS.
- Q.-H. Wu, J. Song, J. Kang, Q.-F. Dong, S.-T. Wu and S.-G. Sun, Mater. Lett., 2007, 61, 3679–3684 CrossRef CAS.
- D. Zanders, E. Ciftyurek, C. Hoppe, T. de los Arcos, A. Kostka, D. Rogalla, G. Grundmeier, K. D. Schierbaum and A. Devi, Adv. Mater. Interfaces, 2019, 6, 1801540 CrossRef.
- M. Di Giulio, A. Serra, A. Tepore, R. Rella, P. Siciliano and L. Mirenghi, Mater. Sci. Forum, 1996, 203, 143–148 CAS.
- X. Meng, J. Mater. Chem. A, 2017, 5, 18326–18378 RSC.
- F. Krahl, A. Giri, J. A. Tomko, T. Tynell, P. E. Hopkins and M. Karppinen, Adv. Mater. Interfaces, 2018, 5, 1701692 CrossRef.
- A. Philip, J.-P. Niemelä, G. C. Tewari, B. Putz, T. E. J. Edwards, M. Itoh, I. Utke and M. Karppinen, ACS Appl. Mater. Interfaces, 2020, 12, 21912–21921 CrossRef CAS PubMed.
- A. Khayyami, A. Philip, J. Multia and M. Karppinen, Dalton Trans., 2020, 49, 11310–11316 RSC.
- R. Ghiyasi, M. Milich, J. Tomko, P. E. Hopkins and M. Karppinen, Appl. Phys. Lett., 2021, 118, 211903 CrossRef CAS.
- A. Philip, Y. Zhou, G. C. Tewari, S. van Dijken and M. Karppinen, J. Mater. Chem. C, 2021, 10, 294–300 RSC.
- J. Multia and M. Karppinen, Adv. Mater. Interfaces, 2022, 9, 2200210 CrossRef CAS.
- E. C. Taylor and W. A. Ehrhart, J. Org. Chem., 1963, 28, 1108–1112 CrossRef CAS.
- D. Nečas and P. Klapetek, Cent. Eur. J. Phys., 2012, 10, 181–188 Search PubMed.
- M. Mayer, SIMNRA User's Guide. Report IPP 9/113, Garching, Germany, 1997 Search PubMed.
- T. Takahagi and A. Ishitani, Carbon, 1988, 26, 389–396 CrossRef CAS.
- I. Jordan, A. Beloqui Redondo, M. A. Brown, D. Fodor, M. Staniuk, A. Kleibert, H. J. Wörner, J. B. Giorgi and J. A. van Bokhoven, Chem. Commun., 2014, 50, 4242–4244 RSC.
Footnotes |
| † Electronic supplementary information (ESI) available: NMR data and XPS data. CCDC 2195121. For ESI and crystallographic data in CIF or other electronic format see DOI: https://doi.org/10.1039/d2dt02562k |
| ‡ Equal contribution. |
| This journal is © The Royal Society of Chemistry 2022 |

