
 Open Access Article
 This Open Access Article is licensed under a Creative Commons Attribution-Non Commercial 3.0 Unported Licence
Coprecipitation of actinide peroxide salts in the U–Th and U–Pu systems and their thermal decomposition†
Nicolas
Hibert
ab,
Bénédicte
Arab-Chapelet
a,
Murielle
Rivenet
b,
Laurent
Venault
a,
Christelle
Tamain
 a and
Olivier
Tougait
*b
a and
Olivier
Tougait
*b
aCEA, DES, ISEC, DMRC, Univ Montpellier, Marcoule, France
bUniv. Lille, CNRS, Centrale Lille, Univ. Artois, UMR 8181 – UCCS – Unité de Catalyse et Chimie du Solide, F-59000 Lille, France. E-mail: olivier.tougait@univ-lille.fr
First published on 27th July 2022
Abstract
The uranium and plutonium co-conversion process constitutes a continuous subject of interest for MOx fuel fabrication. Among the various routes considered, chemical coprecipitation by the salt effect has been widely investigated regarding its simplicity of integration between the partitioning and purification steps of the PUREX process, and the straightforward recovery of precursors that are easily converted into oxide phases by thermal decomposition. The present study focuses on the coprecipitation behavior of U–Th and U–Pu actinide peroxide mixed systems by examining the precipitation yields and settling properties for nitric acidity in the range of 1 to 3 M and hydrogen peroxide concentration in the range of 4.5 to 7 M. The precipitated solids have been characterized by powder XRD, IR and Raman spectroscopy, laser granulometry and SEM-EDS analyses revealing the synthesis of studtite and actinide(IV) peroxo-nitrates as aggregated particles. The actinide solid phases are uniformly distributed within the filtered cakes. The precursor thermal decomposition results in the formation of oxide phases at low temperature according to a sequential release of water molecules, peroxide ligands and nitrate ions. The calcination step has a limited effect on the morphology of the powders which remain highly divided. The high precipitation rate of actinides makes this chemical route potentially interesting as a co-precipitation process.
1. Introduction
The slow deployment of fourth generation reactors based on the fast neutronic spectrum brings up new environmental and industrial issues. First, a re-increase in the demand for natural uranium and some pressure on uranium mining, and second, a change in the spent fuel strategy regarding long-term disposal options and plutonium management. However, it also offers opportunities to consider innovative mixed-oxide (MOx) fuels in a pressurized water reactor (PWR) and uranium and plutonium multi-recycling as some examples1–4 increasing the interest in advanced processing routes based on the co-management of actinides.Coprecipitation methods are widely used for the preparation of mixed oxide constituting technological ceramics. Regarding the specific methods considered for MOx fuel, several routes were already investigated with great attention: the denitrification route5,6 and hydroxide route, in fact the coprecipitation of ammonium diuranate and Pu(OH)4![[thin space (1/6-em)]](https://www.rsc.org/images/entities/char_2009.gif) 7,8 and its derivatives using hydroxylamine,9 the carbonate route,10 oxalate route,11,12 peroxide route13 and sol–gel methods.14,15 Each of these coprecipitation methods, which has its own advantages (but also drawbacks), affords either mixed UO2–PuO2 batches or fluorite based solid solutions for a wide range of concentrations, after an appropriate heat-treatment.
7,8 and its derivatives using hydroxylamine,9 the carbonate route,10 oxalate route,11,12 peroxide route13 and sol–gel methods.14,15 Each of these coprecipitation methods, which has its own advantages (but also drawbacks), affords either mixed UO2–PuO2 batches or fluorite based solid solutions for a wide range of concentrations, after an appropriate heat-treatment.
The number of studies that have examined the coprecipitation conditions of actinide precursors in a peroxide medium is very low.13,16,17 Coprecipitation experiments in the uranyl–thorium peroxide system have been attempted by McTaggart and Mailen17 for low to moderate nitric acidities (0.3 M and 1.25 M) and a  ratio of about 0.25. Their results clearly show that it is a syn-precipitation reaction with individual precipitation of thorium peroxide and uranyl peroxide (studtite). The precipitation of studtite is considered as rapid and quantitative since it occurs with a precipitation yield of more than 99% after 15 min under optimum conditions. On the other hand, for thorium peroxide, a maximum precipitation yield of about 90% is obtained only for the lowest nitric acidity (0.3 M) and the longest aging time (300 min), indicating a significant difference in the precipitation rates between the two actinide peroxides. The precipitated powders were calcined at 350 °C, with a stop at 220 °C to allow slow decomposition of the peroxides, resulting in mixed UO3–ThO2 oxide powders.
Regarding the uranium and plutonium system, a unique experimental study is reported by Ganivet,13 who explored the syn-precipitation under less acidic conditions (0.4–0.5 M), moderate hydrogen peroxide concentration (3 M) and with the help of sulfate ions to improve the powder filtering behavior and the decontamination factor (highly selective process with high precipitation yields). Nevertheless, in the presence of nitrate ions only, the analysis of the supernatant shows that the precipitation yields of U and Pu are 99.4% and 97.6%, respectively. Despite these encouraging preliminary results, the author highlighted the antagonistic conditions for plutonium peroxide and uranyl peroxide precipitations, and pursued his efforts on sulfate additions leaving the role of the acidity itself ([H+]) and the influence of the O22− complexing behavior unexplored.
Regarding the few studies on the coprecipitation of actinide peroxides which left the concentrated acid conditions unexplored, typically those encountered at the partitioning step of the PUREX process, we decided to reinvestigate this attractive synthetic route with the main objectives of achieving a high precipitation yield (>98%), stable U/Pu and U/Th ratios between solutions and solid phases, acceptable sedimentation and filtration properties and high ability of peroxide precursors to afford oxide powders with homogeneous physical behavior. Since these two series of experiments indicate individual precipitation of actinide peroxide salts with contrasting features in terms of experimental conditions and powder behavior, a detailed bibliographical survey on the synthesis processes and physicochemical properties of the three actinide peroxide salts was carried out in order to identify the key-parameters for quantitative precipitation and easy powder recovery.
The synthesis of the thorium peroxide salt from thorium nitrate solutions by hydrogen peroxide has been finely studied by Hamaker and Koch18 for varied acidic conditions (from 0.5 to 2.0 M [H+]), hydrogen peroxide concentrations (from 0.4 to 3.3 M [H2O2]) and for various mineral acids such as nitric, sulfuric or perchloric acids. Several Th(IV) peroxide salts depending on the nature of the counterions (bases) in solution were identified. In the case of nitric acid, the exact chemical formula of the thorium peroxo-nitrate salt remains undetermined but based on consistent chemical titrations, it has been established that the formula contains about 3.2 peroxide oxygens and about 0.5 nitrate ions per Th ion.18 The resulting powder was found to be poorly crystallized, and the crystal structure of the salt remains unknown up to now. The peroxo-nitrate salt could be characterized by Raman spectroscopy19,20 only. To our knowledge no study of the solubility of the thorium peroxo-nitrate is reported in mixed nitric acid and hydrogen peroxide media and the settling characteristics remain largely unexplored. However, it should be stressed that Th peroxo-nitrate salt precipitates as aggregated grains at room temperature.17
The uranyl peroxide chemistry has been widely studied revealing interesting features as a function of pH and p(O22−).21 In the presence of peroxide ions and for a wide range of moderate to low nitric acid concentrations (10−1 M < [H+] < 10−6 M), uranyl ions readily precipitate as UO2(O2)·4H2O with very low solubility, in an order of magnitude of 10−3–10−5 M.22–24 Under most experimental conditions, a finely aggregated and crystallized powder is produced,21,25–28 which exhibits good filtration ability. The crystal structure of studtite has been determined from single-crystal diffraction data.29
The main physicochemical properties of plutonium peroxides have been analyzed in a review by Fugate and Navratil.30 Since this bibliographic survey, few complementary studies on plutonium peroxide complexes or salts have appeared.31–35
Nitric acid with hydrogen peroxide aqueous solution constitutes a balanced oxidizing to reducing medium for plutonium ions. Reduction of Pu(VI) to Pu(IV) by hydrogen peroxide in concentrated nitric acid solution straightforwardly occurs.36–38 Further reduction to Pu(III) can occur,39–44 but for purified Pu solutions, Pu(IV) is the stable cation only under equilibrium conditions.38 All studies establish that in a nitric acid medium, plutonium peroxide salts precipitate as a green solid composed of Pu in the tetravalent state only.31,35–40
Chemical analyses showed that the number of peroxide ligands is close to three, possibly with the presence of a perhydroxyl ion but with the proven presence of free counter-anions, acting on the electrical neutrality of the salt.45,46 In accordance with the geometry of the soluble complexes,39 arrangement of Pu(IV) as a dimer is proposed in the solid.39,40 The formation of Pu dimers has been recently observed in the plutonium peroxo-carbonate, Na8Pu2(O2)2(CO3)6·12H2O.31 However, similar to the Th peroxo-nitrate salt, the crystal structures of the Pu(IV) peroxo-nitrate phases remain undetermined. Infrared spectroscopy has proven to be the only relevant technique for characterizing plutonium peroxide salts, thanks to the identification of distinct functional groups.45 The precipitation of plutonium peroxide salts from plutonium nitrate solutions by hydrogen peroxide was considered as a route of interest for both high decontamination factor and precipitation yield.40,41 It is well documented for various experimental conditions. The most effective results were obtained in the presence of a small amount of sulfate ions ([H2SO4] = 0.1 M),47 but in nitric acid only media, the solubility of plutonium peroxide can be reduced by increasing the [H2O2]/[Pu] ratio up to 40 for a nitric acid concentration of about 1 M. For such conditions, a precipitation yield above 99% is obtained.47 Hagan & Miner48 have reviewed plutonium peroxide precipitation in nitric acid media for lab-scale experiments. Among the 6 tested precipitation parameters, namely the nitric acidity and hydrogen peroxide concentrations, the H2O2 addition rate, the presence of impurities, the digestion time and the temperature, the nitric acid concentration was found to be the paramount variable for both the filtering rate and the Pu concentration in the filtrate. A slow hydrogen peroxide addition rate was found to reduce the relative filtration time, while the increase of the hydrogen peroxide concentration was found to limit the Pu content in the filtrate. The other parameters have mutually dependent effects mostly antagonist or with minute combined effects. A list of recommended values is given as optimum precipitation conditions of the plutonium peroxide salt, i.e. a HNO3 concentration in the range from 2.3 to 2.7 M, a H2O2 concentration of 22 moles per mole of Pu, a H2O2 addition rate of 2 moles per minute per mole of Pu, an aging time of 30 min and a temperature of 14 °C.
The thermal decomposition of the Pu(IV) peroxo-nitrate salts has been studied by Moseley and Robison49 using thermogravimetric analysis. Their study is not directly accessible, but has been reported by Cuillerdier50 and only a few details about the experimental conditions are given. Information regarding the preparation of the precipitate and the experimental set up, heating rate, atmosphere, and prior-drying process, are some examples of missing information. The thermogravimetric curve shows three successive mass losses before reaching a plateau at as low as 300 °C which corresponds to plutonium dioxide, PuO2. The first mass variation occurs below 130 °C. It is ascribed to the release of the water molecules. The second mass loss occurs between 160 and 200 °C. It has been assigned to the decomposition of the peroxide ligands. The third jump, between 220 and 250 °C would correspond to the degradation of nitrate ions.
Based on the analysis of the individual salt precipitation conditions and the shortcomings of previous Th–U and U–Pu coprecipitation experiments, the present investigation examined new experimental conditions, using the peroxide route. Precipitation yields were optimized according to three experimental parameters, the nitric acid concentration, the hydrogen peroxide concentration and the  or
or  ratio, whereas the aging time, temperature and H2O2 addition rate have been set. Setup experiments were first carried out on the Th(IV)–U(VI) system, in order to anticipate, to a certain extent by analogy, the U(VI)–Pu(IV) peroxide behavior. The results are presented in four subsections exposing successively the (i) coprecipitation behavior in terms of yields and filtration ability, the (ii) chemical and (iii) physical characterization of the peroxide precursors and (iv) the thermal decomposition and physical properties of the oxide powders. Finally, the coprecipitation behavior and the ability of peroxide salts to afford oxide phases are discussed.
2. Materials and methods
Caution! Standard safety procedures for handling radioactive substances must be followed. In the present study, handling of U–Pu solutions and solids was carried out in dedicated glove-boxes and handling of Th–U solutions and solids was carried out under a fume hood or laminar-flow benchtops. Unless mentioned otherwise, all the analyses were carried out in dedicated chambers or sample holders.2.1 Materials and synthesis conditions
The reagents used were concentrated nitric acid (65 wt%, Sigma Aldrich), hydrogen peroxide (30%, Sigma Aldrich), a thorium(IV) nitrate solution in 1 M HNO3 with a thorium concentration of 1.53 mol L−1, a uranyl nitrate solution with a uranium(VI) concentration of 1.25 mol L−1 and a plutonium(IV) nitrate solution in 2 M HNO3 with a plutonium concentration of 0.3 mol L−1. The thorium and uranyl solutions were prepared from nitrate salt, Th(NO3)4·5H2O and UO2(NO3)2·6H2O, respectively, whereas the Pu(IV) nitrate solution (239Pu) was prepared by dissolving the corresponding oxide, PuO2, in a nitro-fluorhydric solution (HNO3 10 M–HF 0.05 M) followed by a purification step on a DOWEX resin. The concentration of the actinide ions was checked by ICP-OES and the peroxide content of hydrogen peroxide was checked by chemical titration using Ce(IV) ions.51 of 0.2, 0.25 and 0.50 and
  of 0.07, 0.23, 0.25, 0.50 and 0.60, before the addition of nitric acid solution to reach an initial acidity of 0.8, 1, 2 and 3 M. The final acidity inducing the free acidity resulting from the cation precipitation and cation complexation with the peroxo ion was disregarded owing to its low quantity compared to the one initially introduced. The hydrogen peroxide solution was introduced at a constant flow rate of 1.2 mL min−1 in the middle of the vortex resulting from the stirring (420 rpm). In the case of the mixed U–Pu experiments, the addition of hydrogen peroxide was allowed to vary in the range
 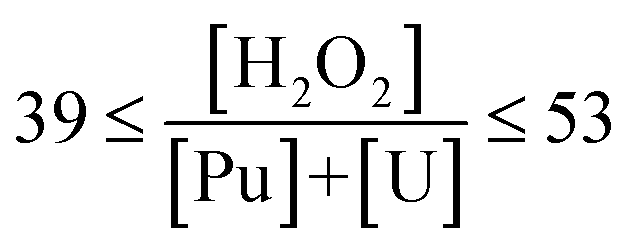 whereas for the mixed U–Th ones, it was kept constant at
  . The precipitation tests were performed at 10 °C and 23 °C for the U–Pu and U–Th systems, respectively. For all experiments, the aging time was maintained constant at 1 hour, except for the one with an aging time of 80 minutes.
The peroxide precipitates were recovered by vacuum filtration on a Büchner funnel using Whatman glass fiber filter (GF/F) paper with a pore size of 0.7 μm. The solid was rinsed twice with 2 mL of 50% vol. ethanol solution. The filtration and washing steps were considered as achieved when the supernatant liquid disappeared from the slurry surface. Finally, the filtered cake was dried in air at room temperature overnight. The filtrates were kept for elemental analyses. The filtration time was evaluated as the time needed by the supernatant including washing solution to vanish from the filtered cake surface.
Details of the experimental conditions for the U–Th and U–Pu coprecipitation tests are given in Tables 1 and 2, respectively. The series of experiments in the U–Th system is denoted as zeta (ζ) whereas the series of experiments in the U–Pu system is denoted as gamma (γ).
| ζ n°1 | ζ n°2 | ζ n°3 | |
|---|---|---|---|
| [Th(IV)] (M) | 0.032 | 0.042 | 0.083 |
| [U(VI)] (M) | 0.132 | 0.125 | 0.083 |

|
20% | 25% | 50% |
| [H2O2] (M) | 7.4 | 6.7 | 6.7 |

|
45 | 40 | 40 |
| [HNO3] (M) | 1 | 1 | 1 |
| Aging time (min) | 60 | 60 | 60 |
| U precipitation yield (%) | 99.7(0.1) | 99.7(0.1) | 99.5(0.1) |
| Th precipitation yield (%) | 96.4(0.4) | 70.8(3.0) | 88.6(1.1) |
| Filtering rate (mg min−1) | 125(25) | 109(11) | 99(10) |
| γ n°1 | γ n°2 | γ n°3 | γ n°4 | γ n°5 | γ n°6 | γ n°7 | γ n°8 | γ n°9 | |
|---|---|---|---|---|---|---|---|---|---|
| [Pu(IV)] (M) | 0.006 | 0.025 | 0.05 | 0.065 | 0.065 | 0.065 | 0.028 | 0.028 | 0.028 |
| [U(VI)] (M) | 0.83 | 0.075 | 0.05 | 0.043 | 0.043 | 0.043 | 0.093 | 0.093 | 0.093 |
|
7% | 25% | 50% | 60% | 60% | 60% | 23% | 23% | 23% |
| [H2O2] (M) | 4.39 | 4.63 | 4.63 | 4.78 | 4.78 | 4.77 | 6.41 | 6.41 | 6.41 |

|
49 | 46 | 46 | 39 | 39 | 39 | 53 | 53 | 53 |
| [HNO3] (M) | 0.8 | 0.8 | 0.8 | 1 | 2 | 3 | 2 | 2 | 2 |
| Aging time (min) | 60 | 60 | 60 | 60 | 60 | 60 | 60 | 80 | 60 |
| U precipitation yield (%) | — | 99.3(1) | 99.2(1) | 97.9(2) | 91.1(1) | 53.3(6) | 99.4(1) | 99.3(1) | 99.2(1) |
| Pu precipitation yield (%) | 98.6(2) | 99.3(1) | 99.2(1) | 99.1(1) | 99.0(1) | 98.6(1) | 99.8(1) | 98.7(3) | 98.7(1) |
| Filtering rate (mg min−1) | 21(6) | 8(1) | 4(1) | 4(1) | 16(3) | 25(11) | 38(4) | 51(6) | 41(4) |
2.2 Chemical characterization techniques
For samples stored for a few days after the filtration stage, supernatants were heated to 80 °C for approximately 6 hours just before the ICP-OES analyses, to help in the redissolution of the actinide species that could have precipitated in the filtrates.
The precipitation yield was calculated based on the actinide titrations in the effluent which are considered to represent the solubility of the peroxide salts in the tested experimental conditions.
Raman spectra were recorded on a HORIBA Jobin–Yvon LabRam HR Evolution between 300 and 2000 cm−1 utilizing a 532 nm excitation YAG laser with a 2 cm−1 step. A micro-beam (20 μm) with a power reduced to 1% (∼3 mW) as well as short acquisition times (t = 60–1800 s) were preferred to maintain the sample integrity. The powder (∼1 mg) is spread evenly onto a glass slide.
For Pu containing samples, the powder was mixed with 30 mg of silicone grease for particle immobilization. The mixture was spread onto a Si low background sample holder, and covered by a hermetic fully removable sample dome, compatible with a Bruker D8 goniometer installed in a glovebox.52
For mixed oxide samples, the powder is dispersed in 180 mg of glue diluted with 60 μL of acetone. The mixture is spread onto a metallic plate and left to dry overnight. The X-ray powder plate is introduced in an airtight specimen holder, with a dome-like cap equipped with a knife edge beam stop.
Rietveld and LeBail refinements were performed with the Fullprof Suite.53
2.3 Physical characterization techniques
The thermal decomposition of the mixed uranyl and plutonium peroxides was carried out up to 1000 °C, whereas for the uranyl and thorium peroxides it was performed up to 600 °C under a reducing atmosphere.
3. Results
3.1 Precipitation of actinide peroxide salts: yields and filtering rates
Tables 1 and 2 list the individual precipitation yields and filtering rates in the U–Th (zeta, ζ series of experiments) and U–Pu (gamma, γ series of experiments) mixed systems, respectively. Graphical representation of the results as a function of the actinide ratio, initial nitric acid and hydrogen peroxide concentrations is given in the ESI Fig. S1† for the ζ series and in Fig. S2 and S3† for the γ series of coprecipitation tests.Regarding the large excesses of hydrogen peroxide and nitrate ions compared to actinide ions, the residual concentrations of actinide ions (Th4+, UO22+ and Pu4+) in the supernatants correspond to the saturation limits (or solubility considering the equilibrium between solid and solution) for each tested condition and therefore, were used to calculate the precipitation yields. The results show that efficient coprecipitation conditions can be reached or predicted by slightly adjusting some specific experimental parameters for these two mixed systems.
The results of the ζ series underline the difference in the precipitation behavior of the thorium peroxide salt and studtite. In line with the analyses of McTaggart and Mailen,17 the precipitation yield of the thorium peroxide salt is significantly lower than that of studtite, which remains almost quantitative under the tested conditions. However, improvement toward quantitative precipitation of the thorium peroxide salt could be achieved by reducing the Th content and by increasing the [H2O2] as depicted for the ζ n°1 test. The filtering rate of the ζ n°1, ζ n°2 and ζ n°3 tests displays high values, being at least, two times higher than those of the γ series, suggesting rather good filtering ability of the mixed uranyl–thorium peroxide slurry.
Unlike for the mixed U–Th system, the increase of the Pu content has no detectable effect on the precipitation yield of both actinide peroxide salts for the mixed U–Pu system. Regarding the effect of acidity, the variation of the [HNO3] within the considered range (1 to 3 M) has no influence on the Pu peroxide precipitation yield which remains unchanged at a high value above 98.6(2)%. In contrast, the increase of nitric acidity leads to a strong increase of the uranyl saturation limit in the supernatant. This observation is in agreement with previous work on the solubility of studtite in concentrated nitric acid solutions.22 The comparison of γ n°5 and γ n°7 precipitation yields, carried out at  , respectively and
  respectively, demonstrates the effect of the hydrogen peroxide concentration. Since the
  ratio has no impact on the precipitation yield, the increase of the initial
  ratio has a beneficial effect on the uranium precipitation yield, which is significantly increased for high hydrogen peroxide concentrations at a high nitric acidity value of 2 M (see Fig. S2.c, in the ESI†).
The filtering rate (mg min−1) of the 9 coprecipitation tests performed in the γ series increases with both the HNO3 and H2O2 concentrations whereas it decreases with the increase of the Pu content, indicating the low filtering properties of the precipitated Pu peroxide powder (see Fig. S3, in the ESI†).
The γ series of coprecipitation tests stress that the precipitation yields and therefore the ability to maintain a controlled actinide content in the solid are governed by the precipitation behavior of the uranyl peroxide whereas the filtering ability of the slurry is guided by the physical behavior of the Pu peroxide. Lowering of the studtite solubility can be managed by increasing the hydrogen peroxide concentration. Improvement of the filtering ability of Pu peroxide can be achieved by increasing both the nitric acid and hydrogen peroxide concentrations.
A comparative ranking of the individual behavior of the three actinides in peroxo-nitric media under the tested conditions can be deduced based on the precipitation yield and the filtering rate. The filtering ability decreases from uranium, to thorium, and finally plutonium. The precipitation yield increases from thorium, to uranium, and finally plutonium.
3.2 Chemical characterization of the precipitate powders
 molar ratio from 7% to 50%. In line with the study of Johnson and Vejvoda,59 the precipitation of plutonium peroxide in the slurry was confirmed by the absorption bands of nitrate ions which show up at νA = 1407 cm−1 and νB = 1341 cm−1. These two signals fall within the range of typical vibrational bands of free nitrate and coordinated nitrate ligands, but exclude the bidentate chelating fashion.60 The absorption band ρr (H2O) = 716 cm−1 suggests the presence of coordinated water molecules,57,61 as present in the studtite.
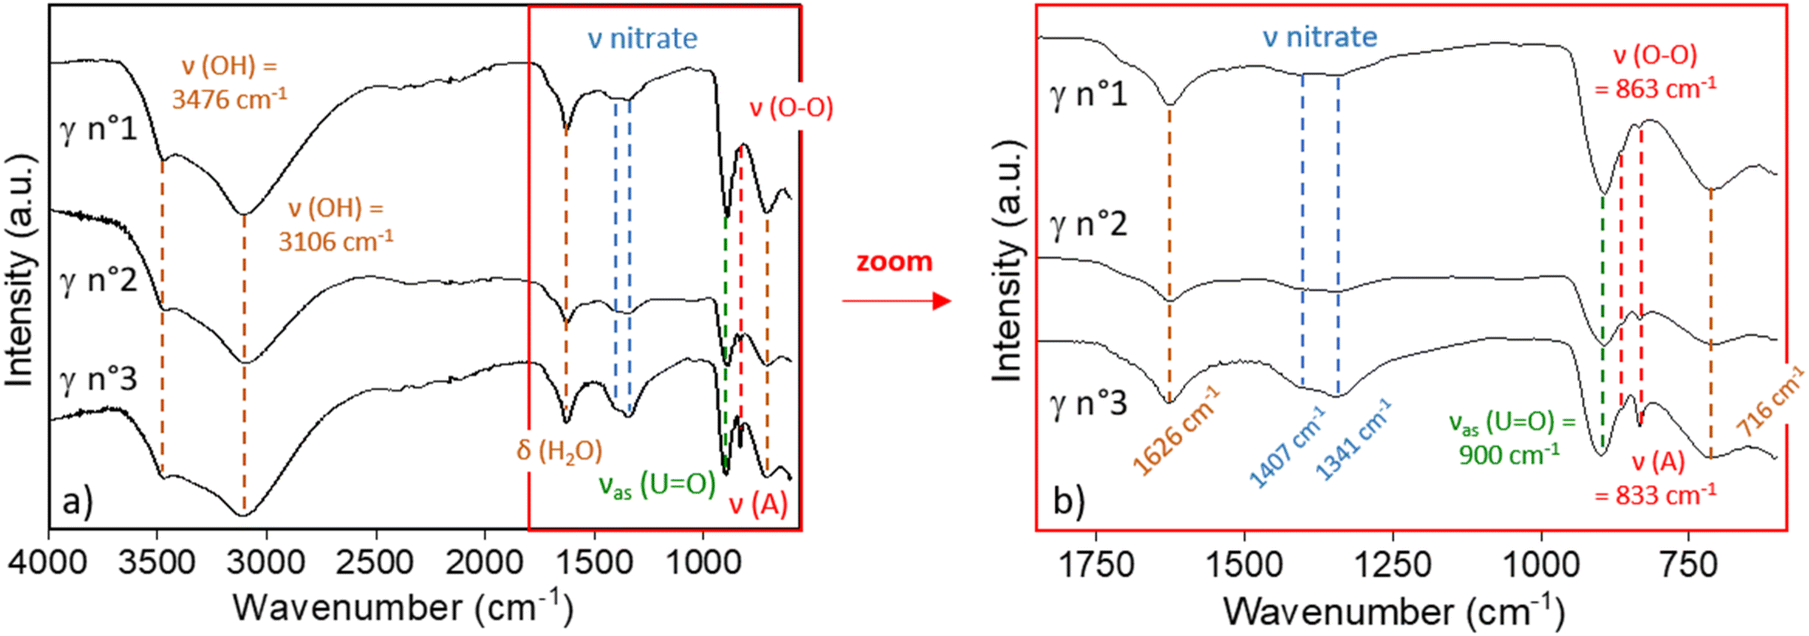 | ||
| Fig. 1 Infrared spectra of γ n°1, γ n°2 and γ n°3 of U–Pu precipitation tests, along with signal assignment for the specific functional groups. (a) Whole spectra and (b) enlarged area: 1800–650 cm−1. | ||
The infrared spectra of the other filtered solids of the γ series display similar vibration bands as presented in the ESI (Fig. S5†) for the γ n°4 and γ n°5 powders, confirming the precipitation of studtite and the plutonium peroxo-nitrate salt.
Fig. 2 displays the IR spectrum of the ζ n°3 precipitate which exhibits the absorption bands of uranyl (ν UO22+ at 897 cm−1) and peroxide (ν O22− at 864 cm−1) functional groups. The absorption band at ν = 716 cm−1 can be ascribed to the presence of coordinated water molecules57,61 which are present in studtite. In line with the results of Jere et al.,20 no specific band can be associated with the peroxide ligand in the thorium peroxide salt. However, similar to the work on Pu(IV) peroxide, the bands in the 1450 to 1000 cm−1 domain can be assigned to vibrational bands of nitrate ions.
 | ||
| Fig. 2 Infrared spectrum of the ζ n°3 mixed U peroxide and Th peroxide precipitate along with signal assignment for the specific functional groups. (a) Whole spectrum and (b) enlarged area: 1800–650 cm–1. Note that the presence of –CH2 and –CH3 vibrations results from washing with ethanol. | ||
Analysis of the Raman spectra confirms the presence of functional moieties, uranyl ion at 819(1) cm−1, peroxide ligand at 865(1) cm−1 (ref. 58) and nitrate ligand at 1052(2) cm−1.60 The latter is detected for the highest Pu or Th contents, only, confirming that the nitrate ligands are bonded to the actinides and could not be considered as free nitrate ions (Fig. S6 in the ESI†).
The combination of the IR and Raman analyses confirms the presence of the functional groups expected for both studtite and actinide(IV) peroxide salts, confirming the coprecipitation of both salts within the slurry. In addition, the association of the two spectroscopic techniques provides further insights into the coordination mode of the nitrate ions which are either monodentate or bridging.
3.3 Physical characterization of the precipitated powders
 | ||
| Fig. 3 SEM image in the SE mode of the ζ n°3 precipitate at (a) medium and (b) high magnification. | ||
High magnification images reveal two distinct surface features associated with the grain shape. Elongated crystals display a smooth surface whereas blocky crystals have a fractured surface with abundant porosity. In agreement with previous observations carried out on thorium peroxide precipitates62 and studtite,21,27 the elongated grains with a smooth surface can be uranyl peroxide, whereas the blocky grains with a rough surface can be thorium peroxo-nitrate.
Fig. 4 presents the SEM images in the SE mode for two magnifications of γ n°4 and γ n°6 powders which were synthesized under the same experimental conditions, except for the nitric acidity of 1 and 3 M, respectively.
 | ||
| Fig. 4 SEM images in the SE mode of the γ n°4 and γ n°6 precipitates at (a) and (b) medium and (c) and (d) high magnification, respectively. | ||
They show that the particle morphologies and filtered cake compaction are distinctly different. The γ n°4 powder is rather compact, with hardly distinguishable grains and low surface porosity, while the γ n°6 powder presents sub-rounded grains (spherules) with significant surface porosity. High magnification images reveal some differences in the spherule size, with submicrometer (or nanometer) particles for γ n°4 and aggregates of a few micrometers for γ n°6. The SEM examinations indicate that the particle size gradually increases with the increase of the nitric acid concentration, affecting the slurry compaction and the porosity level. The lower apparent compaction can be correlated to the increase of filtering rates under high nitric acid conditions, as mentioned in the 3.1.2 subsection.
Embedded in both powders, elongated (needle or plate-like) crystals are visible, which correspond to studtite according to EDS analyses. Nevertheless, the X-elemental mapping for U and Pu of the agglomerated grains indicates the presence of both actinides with a rather homogeneous distribution, as presented in Fig. 5.
 | ||
| Fig. 5 SEM image and X-EDS maps for U (Ma emission line) and Pu (Ma emission line) of the γ n°5 precipitate. | ||
Particle size distributions measured by laser granulometry for the samples ζ n°1 and γ n°7, 8, and 9 (powders gathered together) are presented in Fig. 6. Both measurements display an asymmetric Gaussian distribution due to the presence of submicron particles. The mode values (maximum of occurrence) are about 5(1) μm and 3(1) μm for the mixed U–Th and U–Pu peroxide powders respectively. For the ζ n°1 precursor (Fig. 6a), PSD exhibits isolated agglomerates of about ∼30 μm.
 | ||
| Fig. 6 Particle Size distribution (PSD) measured by laser granulometry for the precipitated powder from (a) ζ n°1 and (b) γ n°7–8–9 tests. | ||
The analysis of the powder morphology of the coprecipitated powder of the mixed U–Th and U–Pu peroxide systems reveals submicrometric to micrometric particles with strong tendency to agglomeration (cohesive powder). In line with the previous observations, the nitric acid concentration plays a paramount role in both the particle size distribution and the crystal habit with marked differences between the studtite and the peroxo-nitrates of Th and Pu. The latter salts precipitate as grains of irregular shape, either rounded or blocky, with a rather porous surface that may account for the cohesive nature of the powder. In contrast, the studtite forms mostly as individual particles with a rather well defined-shape, confirming a good crystallization behavior already noticed in powder X-ray diffraction patterns (Fig. S4 in the ESI†) and in line with the filtering ability deduced from the 3.1. subsection.
3.4 Thermal decomposition and physical properties of oxide powders: TG-DSC, powder XRD, SEM-EDS, granulometry
 | ||
| Fig. 7 TG-DSC analyses performed under an Ar flow for the (a) γ n°2 sample with [Pu]/[U] + [Pu] = 25% and (b) γ n°3 sample, for [Pu]/[U] + [Pu] = 50%. Black, red and blue lines stand for TG, DSC and DTG, respectively. | ||
The evolution of the mass loss curve of both samples shows two main variations for temperatures below 200 °C, one at about 65 to 75 °C and a second centered at around 170 °C. The first mass loss is associated with the departure of water molecules and this is in accordance with the studies of the thermal decomposition of studtite25,27,28,63 and of plutonium peroxo-nitrate salts.49 The second mass loss can be assigned to the release of water molecules chemically bonded to the cations and of the peroxide ions.27,28,49 At higher temperatures, above 200 °C, the mass curve smoothly decreases, up to about 430(10) °C when a short plateau is observed, before the last mass loss centered at about 480(10) °C. According to Schwerdt et al.27 and Thompson et al.,28 the gradual loss of mass can be associated with the conversion of amorphous phases, presumably from am-U2O7 to am-UO363,64 (am = amorphous). The last detectable mass peak at about 480(10) °C corresponds to the loss of O2 associated with the conversion of am-UO3 to a disordered orthorhombic crystalline form, denoted as αUO365 or α′U3O8.66 Above 500 °C, the evolution of the TG curve is featureless. Several changes in the DSC baseline are visible above 400 °C, which may feature the formation of am-UO3,63 its crystallization to αUO326 followed at higher temperature by its self-reduction to U3O8.25,27,28,63
Despite an increase of the Pu content to 50% in the γ n°3 sample (Fig. 7b), the decomposition of nitrate ions which is claimed to occur at about 220 °C (ref. 67) is not detected on the TG curve (neither in its derivative, DTG), but it may appear in the DSC signal as a small endothermic peak with a T onset of ∼185(5) °C. It should be underlined that for the γ n°2 sample which contains 25% Pu only, this small thermal effect is not detected.
The analysis by powder X-ray diffraction of the residues leads to a mixture of two oxides corresponding to the room temperature form of αU3O868 and PuO2 phases69 (Table 3). The Rietveld plots are given in the ESI as Fig. S7 and Fig. S8† for γ n°2 and γ n°3 residual solids, respectively. The small expansion of the a axis and contraction of the b axis of αU3O8 lattice parameters agree with the anisotropic thermal evolution of the orthorhombic structure described by Ackermann et al.70 The unit-cell volumes calculated from the refined lattice parameters compare well to those of the reference compounds, suggesting the absence of interdiffusion of the U and Pu cations between the two binary phases.
| Sample | U3O868 |
PuO269 |
Oxides U–Pu (ex-γ n°2) | Oxides U–Pu (ex-γ n°3) | ||
|---|---|---|---|---|---|---|
| Symmetry | Ortho. | Cubic | Ortho. | Cubic | Ortho. | Cubic |
| Space group | Amm2 |
Fm![[3 with combining macron]](https://www.rsc.org/images/entities/char_0033_0304.gif) m m |
Amm2 |
Fmm |
Amm2 |
Fmm |
| a (Å) | 6.716(1) | 5.396(1) | 4.146(1) | 5.402(1) | 4.146(1) | 5.402(1) |
| b (Å) | 11.960(2) | — | 11.861(1) | — | 11.865(1) | — |
| c (Å) | 4.1469(5) | — | 6.758(1) | — | 6.753(1) | — |
| Volume (Å3) | 333(1) | 157.1(2) | 332.3(1) | 157.6 (1) | 332.2(1) | 157.6(1) |
| R p | — | — | 3.62 | 2.56 | ||
| wRp | — | 4.64 | 3.30 | |||
| χ 2 | — | 1.89 | 1.93 | |||
The SEM observations of the as-precipitated powder and TGA-DSC residual powder for the γ n°5 test reveal that the main morphological behavior of the precipitated powder is not affected by the heat-treatment up to 800 °C (Fig. S9 in the ESI†). The samples correspond to a mixture of elongated crystals, assigned as uranium oxide, covered by submicrometric (or nanometric) spherules imputed as plutonium oxide. Some porosities are visible on the flat surface of crystals which may originate from the release of the volatile species. The homogeneous distribution of the particles of actinide oxides remains in the calcined powder as depicted on the X-EDS elemental maps (Fig. S10 in the ESI†).
Table 4 presents the refined lattice parameters of the two fluorite structures with comparison to reference values for ThO269 and UO2.71 The Rietveld plot is displayed in Fig. S11 in the ESI.† The small reduction of the UO2 lattice parameter compared to the reference one suggests a slight re-oxidation of the powder (Table 4). From the relation72 connecting the oxygen stoichiometry to the UO2 unit-cell parameter, the hyper stoichiometry would be UO2.13(1). The decrease of the UO2 cell-parameter and the slight increase of the ThO2 one indicates the absence of interdiffusion between the actinide cations in these two binary phases.
The SEM images of the as-precipitated and heat-treated powders of the ζ n°2 test are displayed in Fig. 8 which reveal slight morphological changes of the particles after calcination up to 600 °C. But the micrometric particle size and elongated shape are conserved.
 | ||
| Fig. 8 SEM microviews of the ζ n°2 test powder, (a) as-precipitated (left) and (b) heat-treated at 600 °C under Ar + H2 (5%) (right). | ||
The particle size distribution, which is displayed in Fig. S12 in the ESI† reveals three classes of particles. The main category is composed of micrometric particles with a mode value at about 1.4 μm. They correspond to isolated particles and represent 75% of the total powder volume. The remaining particles are constituted of agglomerates of about 6 to 7 μm (visible as a foot of the main particle histogram), at about 70 μm and at about 300 μm, the mechanical shaking being insufficient for full particle disaggregation. However, regarding the small volume fraction of these agglomerates, it outlines that the consolidation remains rather weak after heat-treatment at 600 °C. For this conversion temperature, the surface area of 12.8 m2 g−1, compares well with the values for mixed UO2–ThO2 converted powder from the oxalate route.73,74
The U and Th cation distributions have been examined by X-EDS resulting in elemental maps displayed in Fig. S13 in the ESI.† It shows that the uniform actinide distribution at the grain scale is retained for the oxide phases.
4. Discussion
4.1 Synthesis conditions, high precipitation yields, filtering ability, powder habit and agglomeration behavior
The present parametric study confirms that both Th(IV) and Pu(IV) peroxide salts present similarities in their chemical and physical behavior. They are extremely sensitive to the acidity of the medium which has a substantial influence on their crystallization behavior. Improvement of the crystallization requires high acidity and high hydrogen peroxide concentrations which represent synthetic conditions significantly different from the typical ones of the studtite (U(VI) peroxide). However, optimized conditions for coprecipitation in the U–Pu and U–Th systems using the peroxide route can be deduced which enable quantitative precipitation of the actinide cations and a sizeable filtering ability.Despite a limited number of U–Th peroxide coprecipitation tests (ζ series of tests), our results show that the thorium(IV) ion content in the filtrate increases sharply with that of the feed solution. Under the tested conditions, only an atomic percentage limited to 20% thorium met the criteria of our objectives. Nevertheless, the filtration properties of the precipitated powders are found to be excellent, with both a high filtering rate and easy recovery of the powder. The crystallization of the salts affords sharp-edged grains of micrometric size. The thorium peroxo-nitrate grains show a highly developed surface which can be at the origin of some agglomeration tendencies of these grains, whereas the studtite grains remain rather isolated. Therefore, the main improvement issue relates to the quantitative precipitation of thorium peroxide, which requires a nitric acidity below 1 M, a limited Th content  of 20% and a high
  ratio above 45. As suggested by McTaggart and Mailen,17 long aging time of several hours should help to reduce the Th concentration in the supernatant.
Regarding the U–Pu system, the precipitation yield is governed by the significant increase of the solubility of studtite when the nitric acidity rises, while the precipitation yield of plutonium peroxo-nitrate remains constant with a high value above 98.6(1)%. At constant acidity, the solubility of the studtite decreases with the increase of the hydrogen peroxide concentration. A minimum value of 0.647 mmol L−1 of the uranyl outflow is obtained for a  ratio above 50 in a 2 M nitric acid solution. The filtering rate increases with the nitric acidity and with the decrease of the
  ratio. According to Leary45 and Leary et al.,46 the improvement of the filtration properties, can be ascribed to a polymorphic transition of the Pu peroxo-nitrate salt from a cubic form to a hexagonal form at nitric acidity above 2 M. As demonstrated by the microscopic examination of the filtered cake, the increase of nitric acidity has a beneficial effect on the Pu(IV) peroxo-nitrate particle agglomeration. Pu(IV) peroxo-nitrate precipitates as free nanosized grains at low nitric acidity ([HNO3] = 1 M) which agglomerate as submicronic spherules at high nitric acidity ([HNO3] = 3 M). The agglomerate enlargement results in a lower degree of compaction of the filtered cakes which show micrometric size cavities. Unfortunately, the precipitated Pu peroxo-nitrate salt still remains a poorly crystallized powder with high cohesiveness, yielding extremely low settling properties even at the highest tested nitric acidity of 3 M. The analysis of the γ series of tests leads to a list of recommendations for parameters associated with optimized U–Pu coprecipitation conditions, namely a nitric acidity close to 2 M, and a hydrogen peroxide concentration in a molar ratio to actinide ion concentration greater than 50. A Pu content limited to 30 at% is found reasonable for our filtering conditions. Improvement of the filtering ability is observed when the aging time is extended (γ n°8 test).
Although the precipitation of actinide(IV) and uranyl peroxides leads to independent phase-crystallization, homogeneous mixing of the particles is observed, as shown by the absence of segregation between U and Th and U and Pu in the X-elemental maps of both mixed systems. Two main reasons can be suggested to explain this uniform distribution, close settling properties and permanent stirring during the aging time.
The chemical characterization of the precipitated solid confirms that both actinide(IV) salts incorporated nitrate ions, as established by IR and Raman analyses.
4.2 Thermal decomposition behavior and the ability of the actinide peroxide salts to produce mixed oxide powder
Heat treatment of actinide peroxides confirms their low stability and high ability as oxide precursors. In agreement with the thermal decomposition scheme of actinide peroxide or actinide nitrate phases,49,75,76 volatile species, such as water molecules, (O2)2− ligands, and (NO3)− are successively decomposed and released to result in a mixture of binary oxide phases at about 350 °C. The morphological properties of the grains slightly evolve for heat-treatment as high as 800 °C. The grain growth is moderate, and the most frequent grain shapes remain identical, with thorium oxide as rhombohedral crystals, uranium oxide as elongated crystals and plutonium oxide as spherules (agglomerated nanograins). The high surface areas measured for the uranium and thorium oxides were well comparable to the typical values of mixed UO2–ThO2 powder issued from the conversion of oxalate precursors73,74 and are significantly higher than those reported for UO2 powder alone synthesized either by the dry or wet routes,77,78 suggesting some ability for sintering.5. Conclusion
Our investigation on two mixed systems, U–Th and U–Pu, presents the results in terms of precipitation yield and filtering rate along with the chemical and physical characterizations of precipitated solids, for coprecipitation conditions covering extended ranges of hydrogen peroxide concentration and actinide feed solutions comparable to those at the partitioning and purification cycles of the PUREX process. It establishes that quantitative precipitation yields leading to uniform blending of the Th(IV) or Pu(IV) peroxo-nitrate salt with studtite can be obtained by adjusting the nitric acid and hydrogen peroxide concentrations. Achieving a high co-precipitation yield of more than 98% and a reasonable filtering capacity is the result of a compromise of the experimental conditions between the chemical and physical behavior of the three peroxide salts. An increase in the nitric acidity of the coprecipitation medium improves the powder settling properties but induces an increase of uranium solubility in the supernatant. The uranium outflow can be significantly reduced by increasing the hydrogen peroxide molar concentration. The low filtering ability of the Th(IV) and the Pu(IV) peroxo-nitrate salts may originate from their weak crystallization behavior and the high cohesiveness of the precipitated particles which form nanometric to submicrometric spherules. Longer aging time, greater than one hour, should help in the increase of the filtering rate.The conversion to oxide phases occurs at a low temperature (at about 350 °C) with the sequential decomposition and release of water molecules, peroxide functional group and nitrate ions. The latter species is suggested to be continuously expelled before oxygen release due to self-reduction of uranium oxide binaries. The intimate mixing between actinide peroxide salts observed at precipitation is maintained after thermal conversion. The heat-treatment slightly affects the powder properties which remain highly divided suggesting favorable sintering capability.
Conflicts of interest
The authors declare that they have no known competing financial interests or personal relationships that could have appeared to influence the work reported in this paper.Acknowledgements
The authors gratefully thank R. Vauchy and L. Burylo for the powder XRD experiment, G. Jouan, J-R. Sevilla, and M. Vandewalle for SEM images, A. Quemet for ICP analyses, V. Brethenoux, J. Hennuyer and N. Djelal for TGA-DSC analyses and P. Devaux for help with the lab equipment.Chevreul Institute (FR 2638), Ministère de l'Enseignement Supérieur, de la Recherche et de l'Innovation, Hauts-de-France Region and FEDER are acknowledged for partially supporting and funding this work.
References
- M. Kato, S. Maeda, T. Abe and K. Asakura, 2.01 - Uranium Oxide and MOX Production, Second Edi, Elsevier, 2020. DOI:10.1016/B978-0-12-803581-8.11701-1.
- M. Miguirditchian, S. Grandjean, C. Sorel, V. Vanel, T. Delahaye, S. Pillon, L. Ramond, C. Ladirat, I. Giboire and C. Poinssot, Advanced concepts for uranium and plutonium multi-recycling, GLOBAL 2017 International Nuclear Fuel Cycle conference, Sep 2017, Seoul, South Korea, hal-02418116, 2019. https://hal.archives-ouvertes.fr/hal-02418116 Search PubMed.
- N. Camarcat, D. Lecarpentier, F. Lavaud and P. Lemaire, Plutonium multi recycling in pressurised water reactors of the EPR type using laser isotope separation of Pu 242, Ann. Nucl. Energy, 2019, 129, 399–411, DOI:10.1016/j.anucene.2019.02.010.
- F. Courtin, N. Thiollière, X. Doligez, M. Ernoult, B. Leniau, J. Liang, B. Mouginot and A. A. Zakari-Issoufou, Assessment of plutonium inventory management in the french nuclear fleet with the fuel cycle simulator CLASS, Nucl. Eng. Des., 2021, 377, 1–13, DOI:10.1016/j.nucengdes.2020.111042.
- E. D. Collins, Advanced thermal denitration conversion processes for aqueous-based reprocessing and recycling of spent nuclear fuels, Elsevier Ltd., 2015. DOI:10.1016/B978-1-78242-212-9.00012-5.
- M. Leblanc, G. Leturcq, E. Welcomme, X. Deschanels and T. Delahaye, Actinide mixed oxide conversion by advanced thermal denitration route, J. Nucl. Mater., 2019, 519, 157–165, DOI:10.1016/j.jnucmat.2019.03.049.
- R. N. R. Mulford and F. H. Ellinger, UO2-PuO2 Solid Solution, J. Am. Chem. Soc., 1958, 80, 2023, DOI:10.1021/ja01541a068.
- J. E. Menghini, D. E. Marchi, V. G. Trimarco and E. H. Orosco, Mixed oxides pellets obtention by the “Reverse Strike”co-precipitation method, in Advanced Fuel Pellet Materials and Designs for Water Cooled Reactors, IAEA-TECDOC-1416, 2004. https://www-pub.iaea.org/MTCD/publications/PDF/TE_1416_web.pdf Search PubMed.
- E. G. Il'in, A. G. Beirakhov, Y. M. Kulyako, T. I. Trofimov, M. D. Samsonov and B. F. Myasoedov, A new procedure for preparing mixed uranium-plutonium dioxide, Radiochemistry, 2010, 52, 350–353, DOI:10.1134/S106636221004003X.
- P. Govindan, A. Palamalai, T. Vasudevan, K. S. Vijayan, R. V. Subba Rao, M. Venkataraman and R. Natarajan, Ammonium uranyl carbonate (AUC) based process of simultaneous partitioning and reconversion for uranium and plutonium in fast breeder reactors (FBRs) fuel reprocessing, J. Radioanal. Nucl. Chem., 2013, 295, 77–82, DOI:10.1007/s10967-012-1831-x.
- F. Abraham, B. Arab-Chapelet, M. Rivenet, C. Tamain and S. Grandjean, Actinide oxalates, solid state structures and applications, Coord. Chem. Rev., 2014, 266–267, 28–68, DOI:10.1016/j.ccr.2013.08.036.
- S. Grandjean, B. Arab-Chapelet, M. Bertrand, S. Picart, P. Baron, P. Blanc and D. Warin, The oxalic process for the conversion of Pu into PuO2 and the coconversion of U and Pu into (U,Pu)O2, Proc. Glob. 2009 Congr. Nucl. Fuel Cycle Sustain. Options Ind. Perspect., 2009, p. 567. https://inis.iaea.org/collection/NCLCollectionStore/_Public/40/092/40092065.pdf?r=1 Search PubMed.
- M. Ganivet, Effets de l'Eau Oxygénée sur les solutions contenant du Plutonium et de l'Uranium, Rapport n°142, C_820499, conservé au CIDRA, SECACI, Serv. Chim. Du Plutonium. 1961.
- D. D. Sood, The role sol-gel process for nuclear fuels-an overview, J. Sol-Gel Sci. Technol., 2011, 59, 404–416, DOI:10.1007/s10971-010-2273-y.
- C. Ganguly and P. V. Hegde, Sol-Gel Microsphere Pelletisation Process for Fabrication of (U,Pu)O2, (U,Pu)C and (U,Pu)N Fuel Pellets for the Prototype Fast Breeder Reactor in India, J. Sol-Gel Sci. Technol., 1997, 9, 285–294, DOI:10.1023/A:1018363412570.
- R. Oringer, R. W. Woodard and C. E. Larson, The Coprecipitation Of Thorium and Uranium Peroxides (Technical Report AECD-4102), Tennessee Eastman Corp., Oak Ridge, Tenn., U.S. At. Energy Comm., 1946. https://doi.org/10.2172/4361568.
- D. R. McTaggart and J. C. Mailen, Coprecipitation of Thorium and Uranium Peroxides From Acid Solutions (CONF-811108–7), Annu. Meet. Inst. Chem. Eng. New Orleans, LA, USA; 8–12 Nov 1981; ORNL, 1981. https://www.osti.gov/servlets/purl/5963165 Search PubMed.
- J. W. Hamaker and C. W. Koch, Report T.I.D. 5223, Part I, Paper 7.2, U. S. At. Energy Comm. Oak Ridge, Tennesse, 1952.
- R. A. Hasty and J. E. Boggs, Isotopic Exchange Study On Thorium Peroxide, J. Inorg. Nucl. Chem., 1971, 33, 874–876, DOI:10.1016/0022-1902(71)80490-6.
- G. V. Jere, G. D. Gupta, V. Raman and M. T. Santhamma, IR & Thermal Data of the Peroxo Compounds of Group IVA Elements, –indian J. Chem., Sect. A: Inorg., Phys., Theor. Anal., 1978, 16, 435–437, DOI:10.1002/chin.197845015.
- K.-W. Kim, Y.-H. Kim, S.-Y. Lee, J.-W. Lee, K.-S. Joe, E.-H. Lee, J.-S. Kim, K. Song and K.-C. Song, Precipitation characteristics of uranyl ions at different pHs depending on the presence of carbonate ions and hydrogen peroxide, Environ. Sci. Technol., 2009, 43, 2355–2361, DOI:10.1021/es802951b.
- J. R. Sanderson, H. E. Dibben and H. Mason, The Reaction between Hydrogen Peroxide and Solutions of Pure Uranyl Salts. Part I : The Interaction of Hydrogen Peroxide and Uranyl Nitrate (Technical report CI-R-15),United Kingdom At. Authority, Gt. Britain Springfields Work. Engl., 1951. https://www.osti.gov/servlets/purl/4249033.
- K. H. Gayer and L. C. Thompson, The solubility of uranium peroxide in acidic and basic media at 25 C, Can. J. Chem., 1968, 36, 1649–1652, DOI:10.1139/v58-239.
- K. A. H. Kubatko, K. B. Helean, A. Navrotsky and P. C. Burns, Stability of Peroxide-Containing Uranyl Minerals, Science, 2003, 302, 1191–1193, DOI:10.1126/science.1090259.
- R. Thomas, M. Rivenet, E. Berrier, I. de Waele, M. Arab, D. Amaraggi, B. Morel and F. Abraham, Thermal decomposition of (UO2)O2(H2O)2·2H2O: Influence on structure, microstructure and hydrofluorination, J. Nucl. Mater., 2017, 483, 149–157, DOI:10.1016/j.jnucmat.2016.11.009.
- E. H. P. Cordfunke and A. A. van der Giessen, Pseudomorphic Decomposition of Uranium Peroxide Into UO3, J. Inorg. Nucl. Chem., 1963, 25, 553–554, DOI:10.1016/0022-1902(63)80240-7 , IN4−IN6, 555.
- I. J. Schwerdt, A. Olsen, R. Lusk, S. Heffernan, M. Klosterman, B. Collins, S. Martinson, T. Kirkham and L. W. McDonald, Nuclear forensics investigation of morphological signatures in the thermal decomposition of uranyl peroxide, Talanta, 2018, 176, 284–292, DOI:10.1016/j.talanta.2017.08.020.
- N. B. A. Thompson, M. R. Gilbert and N. C. Hyatt, Nuclear forensic signatures of studtite and α-UO3 from a matrix of solution processing parameters, J. Nucl. Mater., 2021, 544, 152713, DOI:10.1016/j.jnucmat.2020.152713.
- P. C. Burns and K.-A. Hughes, Studtite, (UO2)(O2)(H2O)(2)(H2O)(2): The first structure of a peroxide mineral, Am. Mineral., 2003, 88, 1165–1168, DOI:10.2138/am-2003-0725.
- G. A. Fugate and J. D. Navratil, Chapter 11 : Plutonium Peroxide in Process Chemistry: Oxidation, Coordination Chemistry and Solubility, Sep. Nucl. Fuel Cycle 21st Century, ACS Symp. Ser. Vol. 933., 2006, pp. 167–181. DOI:10.1021/bk-2006-0933.ch011.
- W. Runde, L. F. Brodnax, G. S. Goff, S. M. Peper, F. L. Taw and B. L. Scott, Synthesis And Structural Characterization Of A Molecular Plutonium(IV) Compound Constructed From Dimeric Building Blocks, Chem. Commun., 2007, 1728–1729, 10.1039/b617878b.
- W. Deng, S. Tan, M. Tao, J. Wu, X. Hao, G. Jiang and W. Wang, Chemical Treatment of Plutonium With Hydrogen Peroxide Before UTEVA Separation Procedure, J. Nucl. Radiochem., 2014, 36, 334–339, DOI:10.7538/hhx.2014.36.06.0334.
- M. V. Nikonov, I. G. Tananaev and B. F. Myasoedov, Effect of hydrogen peroxide on precipitation of Pu(IV) in alkaline solutions, Radiochemistry, 2010, 52, 27–30, DOI:10.1134/S1066362210010066.
- L. E. Sweet, J. F. Corbey, F. Gendron, J. Autschbach, B. K. McNamara, K. L. Ziegelgruber, L. M. Arrigo, S. M. Peper and J. M. Schwantes, Structure And Bonding Investigation Of Plutonium Peroxocarbonate Complexes Using Cerium Surrogates And Electronic Structure Modeling, Inorg. Chem., 2017, 56, 791–801, DOI:10.1021/acs.inorgchem.6b02235.
- M. Virot, E. Dalodiere, T. Dumas, O. Dieste Blanco, T. Wiss, P. Moisy and S. Nikitenko, Preparation of a New Water Soluble Polynuclear Peroxide Complex of Pu(IV), Pu Futur. 2018, Sep 2018, San Diego, United States. 2018. https://hal-cea.archives-ouvertes.fr/cea-02400196.
- M. N. Myers, Reduction Of Plutonium(VI) With Hydrogen Peroxide Report, Gen. Electr. Co. Hanford At. Prod. Oper. Richland, Wash. 1956. https://digital.library.unt.edu/ark:/67531/metadc1017087/m2/1/high_res_d/4217991.pdf.
- B. Lesigne, Etude Cinétique De La Réduction Par Le Peroxyde D′hydrogène Du Plutonium(VI) En Solution Acide (CEA-R 3168), Rapp. CEA. 1967.
- C. Maillard and J.-M. Adnet, Plutonium(IV) Peroxide Formation In Nitric Medium And Kinetics Pu(VI) Reduction By Hydrogen Peroxide, Radiochim. Acta, 2001, 89, 485–490, DOI:10.1524/ract.2001.89.8.485.
- R. E. Connick and W. H. McVey, The Peroxy Complexes of Plutonium(IV), J. Am. Chem. Soc., 1949, 71, 1534–1542, DOI:10.1021/ja01173a003.
- P. V. Balakrishnan and A. S. G. Mazumdar, Observation of the action of hydrogen peroxide on trivalent and tetravalent plutonium solutions, J. Inorg. Nucl. Chem., 1964, 26, 759–765, DOI:10.1016/0022-1902(64)80320-1.
- V. S. Koltunov, I. A. Kulikov, N. V. Kermanova and L. K. Nikishova, Kinetics of the Reduction of Pu(IV) by Hydrogen-Peroxide in Nitric-Acid Solution, Soviet Radiochemistry, 1981, 23, 384–386 Search PubMed.
- A. S. G. Mazumdar, P. R. Natarajan and S. Vaidyanathan, On The Decomposition Of The Brown Peroxy Complex Of Pu(IV) In Perchloric Acid, J. Inorg. Nucl. Chem., 1970, 32, 3363–3367, DOI:10.1016/0022-1902(70)80225-1.
- J. W. Hamaker and C. W. Koch, Paper 6.02 Study Of The Peroxides of Plutonium (AECD-2493), Transuranium Elem, ed. G. T. Seaborg, J. J. Kaz and W. M. Manning Jr. Natl. Nucl. Energy Ser. Div. IV, Vol. 14B, Part I; McGraw Hill New York, 1949, pp. 666–681 Search PubMed.
- D. E. Koshland, J. C. Kroner and L. Spector, Paper 6.6 Peroxide Of Plutonium And Thorium (MDDC-1268), Transuranium Elem, ed. G. T. Seaborg, J. J. Kaz and W. M. Manning Jr., Natl. Nucl. Energy Ser. Div. IV, Vol. 14B, Part I; McGraw Hill New York, 1949, pp. 731–739 Search PubMed.
- J. A. Leary, Studies on the Preparation, Properties and Composition of Plutonium Peroxide, USAEC (Rep. LA-1913), Los Alamos Sci. Lab. 1955. https://permalink.lanl.gov/object/tr?what=info:lanl-repo/lareport/LA-01913.
- J. A. Leary, A. N. Morgan and W. J. Maraman, Plutonium Peroxide Precipitation, Ind. Eng. Chem., 1959, 51, 27–31, DOI:10.1021/ie50589a029.
- M. Ganivet, Extraction Du Plutonium Par Formation De Sels Insolubles (CEA n°1592), Rapp. CEA. 1960.
- P. G. Hagan, F. J. Miner and A. Separation, Chapter 5 Plutonium Peroxide Precipitation: Review and Current Research, in Am. Nucl. Soc. Symp. Ser. Vol. 117. 1980, pp. 51–67. DOI:10.1021/bk-1980-0117.ch005.
- J. D. Moseley and H. N. Robison, Thermal Decomposition of Plutonium Peroxide, Trans. Am. Nucl. Soc., 1966, 9, 20 Search PubMed.
- C. Cuillerdier, Procédés de conversion du plutonium ou de coconversion Uranium-Plutonium pour produire PuO2 ou (U,Pu)O2 - Etude Bibliographique - 2ème partie : Les autres procédés de précipitation conduisant à PuO2 (Rapport DGR n°289), DERDCA, Département Génie Radioact. Serv. Des Etudes Procédés, Sect. Chim. Des Procédés. 1985.
- N. H. Furman and J. H. Wallace, Applications Of Ceric Sulfate In Volumetric Analysis. VI. Oxidation Of Hydrogen Peroxide By Ceric Sulfate. Indirect Determination Of Lead, J. Am. Chem. Soc., 1929, 51, 1449–1453, DOI:10.1021/ja01380a020.
- R. Vauchy, P. Fouquet-Metivier, P. M. Martin, C. Maillard, I. Solinhac, C. Gueneaub and C. Leoriera, New sample stage for characterizing radioactive materials by X-ray powder diffraction: Application on five actinide dioxides ThO2, UO2, NpO2, PuO2 and AmO2, J. Appl. Crystallogr., 2021, 54(2), 636–643, DOI:10.1107/S1600576721002235.
- J. Rodriguez-Carvajal, Recent Developments of the Program FULLPROF, in Newsletter of the Commission on Powder Diffraction (IUCr), 2001, vol. 26, pp. 12–19. https://journals.iucr.org/iucr-top/comm/cpd/Newsletters/ Search PubMed.
- G. Oudinet, I. Munoz-Viallard, L. Aufore, M.-J. Gotta, J. M. Becker, G. Chiarelli and R. Castelli, Characterization of plutonium distribution in MIMAS MOX by image analysis, J. Nucl. Mater., 2008, 375, 86–94, DOI:10.1016/j.jnucmat.2007.10.013.
- M. Falk and T. A. Ford, Infrared Spectrum and Structure of Liquid Water, Can. J. Chem., 1966, 44, 1699–1707, DOI:10.1139/v66-255.
- G. E. Sigmon and P. C. Burns, Crystal chemistry of thorium nitrates and chromates, J. Solid State Chem., 2010, 183, 1604–1608, DOI:10.1016/j.jssc.2010.04.042.
- C. R. Bhattacharjee, M. K. Chaudhuri, S. K. Chettri and J. J. Laiwan, Fluoroperoxouranates (VI). Synthesis and physico-chemical studies of (NH4)2[UO2(O2)F2] and K2[UO2(O2)F2(H2O)], J. Fluorine Chem., 1994, 66, 229–231, DOI:10.1016/0022-1139(93)02923-3.
- S. Bastians, G. Crump, W. P. Griffith and R. Withnall, Raspite and Studtite: Raman Spectra of Two Unique Minerals, J. Raman Spectrosc., 2004, 35, 726–731, DOI:10.1002/jrs.1176.
- A. J. Johnson and E. Vejvoda, Determination Of Sulphate And Nitrate In Plutonium Compounds By Infrared Spectroscopy, Talanta, 1966, 13, 81–86, DOI:10.1016/0039-9140(66)80128-5.
- U. Casellato, P. A. Vigato and M. Vidali, Actinide Nitrate Complexes, Coord. Chem. Rev., 1981, 36, 183–265, DOI:10.1016/S0010-8545(00)80500-7.
- L. Bonato, M. Virot, T. Dumas, A. Mesbah, P. Lecante, D. Prieur, X. Le Goff, C. Hennig, N. Dacheux, P. Moisy and S. I. Nikitenko, Deciphering the Crystal Structure of a Scarce 1D Polymeric Thorium Peroxo Sulfate, Chem. – Eur. J., 2019, 25, 9580–9585, DOI:10.1002/chem.201901426.
- R. A. Hasty and J. E. Boggs, Formation And Properties Of Thorium Peroxide, J. Less-Common Met., 1964, 7, 447–452, DOI:10.1016/0022-5088(64)90042-6.
- X. Guo, D. Wu, H. Xu, P. C. Burns and A. Navrotsky, Thermodynamic Studies of Studtite Thermal Decomposition Pathways via Amorphous Intermediates UO3, U2O7, and UO4, J. Nucl. Mater., 2016, 478, 158–163, DOI:10.1016/j.jnucmat.2016.06.014.
- S. O. Odoh, J. Shamblin, C. A. Colla, S. Hickam, H. L. Lobeck, R. A. K. Lopez, T. Olds, J. E. S. Szymanowski, G. E. Sigmon, J. Neuefeind, W. H. Casey, M. Lang, L. Gagliardi and P. C. Burns, Structure and Reactivity of X-ray Amorphous Uranyl Peroxide, U2O7, Inorg. Chem., 2016, 55, 3541–3546, DOI:10.1021/acs.inorgchem.6b00017.
- B. O. Loopstra and E. H. P. Cordfunke, On the structure of α-UO3, Recl. Des Trav. Chim. Des Pays-Bas, 1966, 85, 135–142, DOI:10.1002/recl.19660850204.
- R. Herak, The crystal structure of the high temperature modification of U3O8, Acta Crystallogr., Sect. B: Struct. Crystallogr. Cryst. Chem., 1969, 25, 2505–2508, DOI:10.1107/S0567740869006005.
- J. D. Moseley and R. O. Wing, Properties of PuO2 Part I (Report RFP-503), Dow Chem. Co., Rocky Flats Div., 1965. https://digital.library.unt.edu/ark:/67531/metadc1028004/m2/1/high_res_d/4613823.pdf.
- B. O. Loopstra, The Phase Transition in alpha-U3O8 at 210 °C, J. Appl. Crystallogr., 1970, 3, 94–96, DOI:10.1107/S002188987000571X.
- T. Yamashita, N. Nitani, T. Tsuji and H. Inagaki, Thermal expansions of NpO2 and some other actinide dioxides, J. Nucl. Mater., 1997, 245, 72–78, DOI:10.1016/S0022-3115(96)00750-7.
- R. J. Ackermann, A. T. Chang and C. A. Sorrell, Thermal expansion and phase transformations of the U3O8-z phase in air, J. Inorg. Nucl. Chem., 1977, 39, 75–85, DOI:10.1016/0022-1902(77)80436-3.
- G. Leinders, T. Cardinaels, K. Binnemans and M. Verwerft, Accurate Lattice Parameter Measurements of Stoichiometric Uranium Dioxide, J. Nucl. Mater., 2015, 459, 135–142, DOI:10.1016/j.jnucmat.2015.01.029.
- L. Lynds, W. A. Young, J. S. Mohl and G. G. Libowitz, X-Ray and Density Study of Nonstoichiometry in Uranium Oxides, in Nonstoichiom. Compd. Chapter 5, 1963, pp. 58–65. DOI:10.1021/ba-1964-0039.ch005.
- T. R. G. Kutty, K. B. Khan, P. V. Achuthan, P. S. Dhami, A. Dakshinamoorthy, P. S. Somayajulu, J. P. Panakkal, A. Kumar and H. S. Kamath, Characterization of ThO2-UO2 pellets made by co-precipitation process, J. Nucl. Mater., 2009, 389, 351–358, DOI:10.1016/j.jnucmat.2008.12.334.
- N. Hingant, N. Clavier, N. Dacheux, N. Barre, S. Hubert, S. Obbade, F. Taborda and F. Abraham, Preparation, sintering and leaching of optimized uranium thorium dioxides, J. Nucl. Mater., 2009, 385, 400–406, DOI:10.1016/j.jnucmat.2008.12.011.
- G. V. Jere and M. T. Santhamma, Preparation, IR And Thermal Studies Of Thorium Peroxide Species, J. Less-Common Met., 1977, 55, 281–284, DOI:10.1016/0022-5088(77)90202-8.
- B. B. Kalekar, K. V. Rajagopalan and P. V. Ravindran, Room temperature reaction between uranyl nitrate hexahydrate and rubidium nitrate and polymerisation during denitration of rubidium uranyl nitrate at elevated temperatures, Thermochim. Acta, 2010, 507–508, 21–26, DOI:10.1016/j.tca.2010.04.024.
- J.-L. Guillet, Y. Guerin and B. Bonin, Les combustibles nucléaires (cea-01153334), CEA Saclay; Groupe Moniteur, E-DEN. 2008. https://hal-cea.archives-ouvertes.fr/cea-01153334.
- N. T. Hung, L. B. Thuan, D. Van Khoai, J. Y. Lee and R. K. Jyothi, Modeling conversion of ammonium diuranate (ADU) into uranium dioxide (UO2) powder, J. Nucl. Mater., 2016, 479, 483–488, DOI:10.1016/j.jnucmat.2016.07.045.
Footnote |
| † Electronic supplementary information (ESI) available. See DOI: https://doi.org/10.1039/d2dt02376h |
| This journal is © The Royal Society of Chemistry 2022 |