
 Open Access Article
 This Open Access Article is licensed under a Creative Commons Attribution-Non Commercial 3.0 Unported Licence
Luminescent cyclometalated alkynylplatinum(II) complexes with 1,3-di(pyrimidin-2-yl)benzene ligands: synthesis, electrochemistry, photophysics and computational studies†
Mariia
Hruzd
 a,
Nicolas
le Poul
b,
Marie
Cordier
a,
Samia
Kahlal
a,
Jean-Yves
Saillard
a,
Sylvain
Achelle
*a,
Sébastien
Gauthier
*a and
Françoise
Robin-le Guen
*a
a,
Nicolas
le Poul
b,
Marie
Cordier
a,
Samia
Kahlal
a,
Jean-Yves
Saillard
a,
Sylvain
Achelle
*a,
Sébastien
Gauthier
*a and
Françoise
Robin-le Guen
*a
aUniv. Rennes, CNRS, ISCR (Institut des Sciences Chimiques de Rennes) – UMR 6226, F-35000 Rennes, France. E-mail: sylvain.achelle@univ-rennes1.fr; sebastien.gauthier@univ-rennes1.fr; francoise.le-guen@univ-rennes1.fr
bLaboratoire de Chimie, Électrochimie Moléculaires et Chimie Analytique, UMR CNRS 6521, Université de Bretagne Occidentale, UFR Sciences et Techniques, 6 avenue Victor Le Gorgeu – CS 93837, F-29238 Brest Cedex 3, France
First published on 11th March 2022
Abstract
In this article, we report on a series of cyclometalated chloro- and alkynyl-platinum(II) complexes bearing various tridentate N^C^N-cyclometalated ligands derived from 1,3-bis(pyrimidin-2-yl)benzene. The X-ray crystal structures of two alkynyl-platinum(II) complexes were determined and other structures were DFT-calculated. Electrochemical and DFT-computational studies suggest a ligand-centred reduction on the R1-substituted N^C^N ligand, whereas oxidation likely occurs either on the Pt-phenylacetylide moiety and/or the cyclometalated ligand. In CH2Cl2 solution at room temperature, the complexes show phosphorescent emissions ranging from green to orange, depending on the R1 and R2 substituents on the ligands. In KBr solid state matrix, excluding complexes bearing a trifluoromethyl substituted ligand, all compounds exhibit red emission. The presence of an alkynyl ancillary ligand has limited influence on absorption and emission spectra except in the case of the complex with the strongly electron-donating diphenylamino R2 substituent on the alkynyl ligand, for which a significant red-shift was observed. The alkynyl Pt(II) complex with OMe groups as both R1 and R2 substituents shows the best emission quantum yield (0.81 in CH2Cl2 solution) in this series. The full series of DFT calculated band gaps correlated generally well with the electrochemical and absorption data and reasonably model the impact of the substituents on the electronics of these complexes.
Introduction
Luminescent organometallic complexes have attracted considerable interest over the past few decades in the area of functional molecular materials, notably for their applications in photocatalysis,1–4 luminescence sensing and cellular imaging,5–7 as well as in organic light-emitting diode (OLED) devices.8–11 The main advantage of employing organometallic complexes as emitters for the fabrication of highly efficient phosphorescent OLEDs is their capacity to access triplet states via intersystem crossing (ISC) from the singlet excited state through strong spin–orbit coupling mediated by the heavy metal in the complexes.12–17Phosphorescent transition metal compounds, such as iridium(III),18 platinum(II),19,20 ruthenium(II),21 osmium(II)22 and gold(III) complexes23 have proven to be an outstanding class of emitter materials for making OLEDs because of their high luminescence quantum yields. The photophysical properties of luminescent metal complexes could be directly modulated by an appropriate variation of ligands and metal ions.24,25 A large number of highly phosphorescent materials are coordination compounds based on cyclometalated complexes.23,26,27 The combination of rigidity of the molecule, strong metal–chelate bonding, substituent effect on ligands and design of the ligand skeleton may contribute to improving the luminescence quantum efficiency and tuning the color of the emission of the resulting cyclometalated complexes.28
Among them, cyclometalated platinum(II) complexes represent an important class of phosphorescent materials due to their interesting coordination geometry and rich photochemical and photophysical properties in solution and in solid state.29–31 Notably, their four-coordinated square-planar structure can accommodate bidentate, tridentate, or tetradentate chelating ligands32–37 and additional ancillary ligands,38–40 which offers considerable options for engineering targeted highly phosphorescent materials. It has been shown that electronic excited states and their relative energies can be improved via modifications the coordinated ligands around the platinum ion.41–43 Furthermore, the planar geometry of the platinum complexes facilitates interesting specific self-assembly behaviors and luminescence properties of the complexes by intermolecular π⋯π stacking or axial Pt⋯Pt interactions.44–48
Recently a series of tridentate cyclometalated [Pt(N^C^N)Cl] complexes with an electron-deficient pyrimidine-contained N^C^N ligands have been synthesized by Jin and co-workers, and as reported, the replacement of one pyridine with a pyrimidine ring in N^C^N platinum(II) complexes affect the intermolecular interactions and the luminescence properties of the complexes.49 However, no supplementary studies in this series of complexes have been carried out to enhance the photophysical properties by substitution of the chloride by ancillary acetylide ligands. In fact, Williams and co-workers have reported that the substitution of the chloride ligand of cyclometalated [PtLCl] complex (L = 5-methyl-1,3-di(2-pyridyl)benzene) by 3,5-difluorophenyl-acetylide induces higher photoluminescence quantum yields than the corresponding chloride complex (ΦPL = 0.77 vs. 0.68).50 In addition, complementary studies have demonstrated that the Pt(II) acetylide complexes are interesting because the excited and luminescence properties of the complexes can be optimized by variation of the substituent in the σ-alkynyl auxiliary.51–54
In this context, this study aims to develop high-efficiency emitters based on cyclometalated chloro- and alkynyl-platinum complexes bearing a 1,3-bis(pyrimidin-2-yl)benzene derivative ligands. The effect of substitution of the monodentate ancillary ligand (chloride or various substituted phenylacetylides) and the introduction of different groups to the central phenyl ring of the N^C^N ligands on the complexes 1–14 have been investigated experimentally and theoretically (Fig. 1). The results show that the incorporation of electro-donating or electro-withdrawing groups on both the tridentate and σ-alkynyl ligands in these complexes can result in tuning and, in some case, improving their photophysical properties in solution and in solid state.
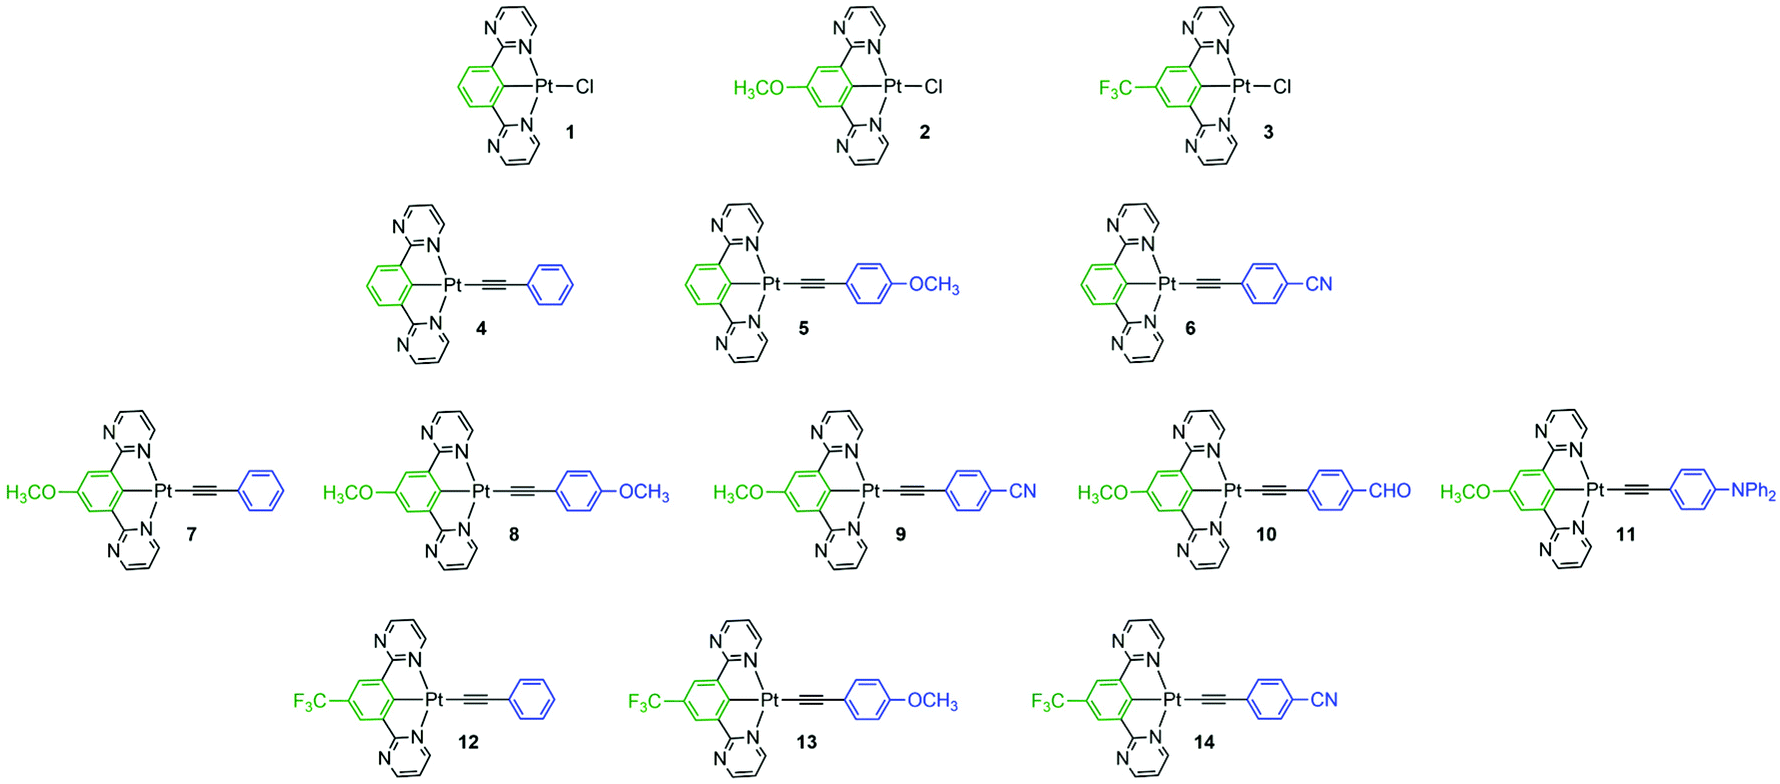 | ||
| Fig. 1 Chemical structures of the cyclometalated platinum-based complexes 1–14 investigated in this work. | ||
Results and discussion
Synthesis and characterization
The synthesis of the complexes requires the cyclometalating tridentate N^C^N ligands 18–20 whose preparation was accomplished in a two-step synthesis as previously reported (synthetic scheme is provided in ESI, Scheme S1†).49 In a first step, the arylboronate ester derivatives 15–17 were produced by Pd-catalyzed Miyaura borylation cross-coupling reaction of 1,3-dibromobenzene derivatives with bis(pinacolato)diboron in the presence of PdCl2(dppf) and a weak base KOAc in DMF at 90 °C in moderate yield. In the second step, the arylboronate ester derivatives 15–17 were converted into the corresponding ligands 18–20 under Pd-catalyzed Suzuki–Miyaura cross-coupling reaction in presence of the 2-chloropyrimidine, Pd(PPh3)4 and K2CO3 (aq) under reflux of toluene in moderate to good yields. The N^C^N cyclometalated chloro-platinum(II) complexes 1 and 2 are known compounds and were prepared as previously reported method.49,55 The chloro-platinum(II) precursor complexes 3 was obtained using a similar procedure in a good yield, after a 2-day reaction between the corresponding ligand 20 and potassium tetrachloroplatinate (K2PtCl4) in a refluxed solution of glacial acetic acid (Scheme 1). Finally, N^C^N cyclometalated alkynyl-platinum(II) complexes 4–14 were prepared under conventional cross-coupling condition by reaction of chloro-platinum(II) precursors 1–3 with the corresponding organic alkynes in the presence of sodium methoxide and MeOH/CH2Cl2 (4![[thin space (1/6-em)]](https://www.rsc.org/images/entities/char_2009.gif) :1 v/v) at 40 °C.56 Due to his low solubility, chloro-platinum complex 3 has only been characterized by HRMS. Alkynyl-platinum complexes 4–14 were analyzed by 1H NMR, IR and HRMS. The characterization data were found to be in complete agreement with the proposed structures.
:1 v/v) at 40 °C.56 Due to his low solubility, chloro-platinum complex 3 has only been characterized by HRMS. Alkynyl-platinum complexes 4–14 were analyzed by 1H NMR, IR and HRMS. The characterization data were found to be in complete agreement with the proposed structures.
 | ||
| Scheme 1 Synthesis of N^C^N cyclometalated chloro-platinum(II) complexes 1–3 and alkynyl-platinum(II) complexes 4–14. | ||
X-ray crystal structures
Single crystals of alkynyl-platinum complexes 7 and 8 were obtained by slow evaporation of CH2Cl2 solution of the complex at room temperature, and their molecular structures were determined by X-ray crystallography analysis as shown in Fig. 2(A) and Fig. 3(A). The crystal data and structure refinement details are provided in the ESI (Tables S2 and S3†), and selected bond lengths and bond angles are listed in Table 1. As generally observed for cyclometalated N^C^N and C^N^N platinum(II) complexes, the Pt(II) ion center of complexes 7 and 8 adopts a distorted square-planar geometry defined by a tridentate cyclometalated ligand 19 and one alkynyl fragment.51,54,57,58 The N–Pt–C and N–Pt–N angles (C6–Pt1–N3 80.30°, C6–Pt1–N1 79.00° and N3–Pt1–N1 159.30° for complex 7, and C10–Pt1–N3 79.70°, C10–Pt1–N3 79.30°, N3–Pt1–N1 158.90° for complex 8) are found to deviate from the idealized value of 180° and 90°, respectively. The Pt–N bond distances in the two complexes 7 and 8 are 2.029–2.040 Å, comparable to those in the reported analogue [Pt(N^C^N)Cl] complexes. The bond lengths Pt–C16 for complex 7 and 8 are 2.125 and 2.092 Å, respectively. Complex 7 and 8 have a longer Pt–C(N^C^N) bond lengths (Pt1–C6 1.951 Å for 7 and Pt1–C10 1.949 Å for 8), which can be attributed to the higher trans influence of the alkynyl ligand than that of the chloride ligand. | ||
| Fig. 2 ORTEP drawings of complex 7 (A) and 8 (B). Thermal ellipsoids are set at 50% probability level. | ||
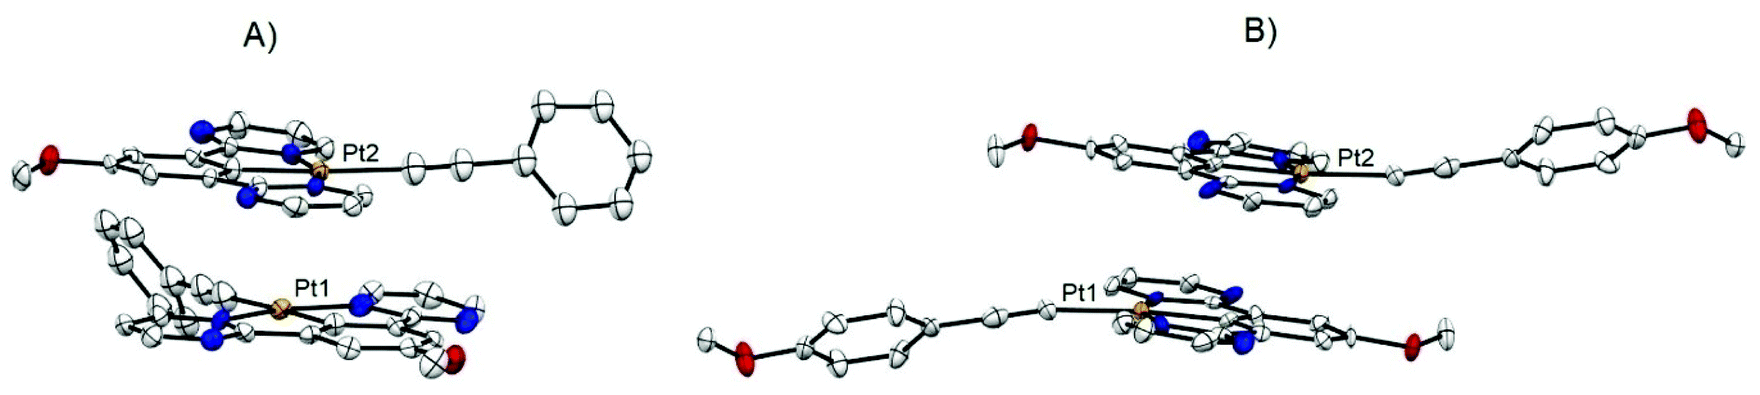 | ||
| Fig. 3 ORTEP drawings of the crystal packing structure in dimeric form: (A) complex 7 showing the staggered configuration, (B) complex 8 showing the head-to-tail configuration. Thermal ellipsoids are set at 50% probability level. Hydrogen atoms have been omitted for clarity. | ||
| Complex 7 | Complex 8 | ||
|---|---|---|---|
| Pt1–C6 | 1.951(8) [1.940] | Pt–C10 | 1.949(8) [1.939] |
| Pt1–N3 | 2.029(7) [2.039] | Pt1–N3 | 2.036(7) [2.039] |
| Pt1–N1 | 2.030(6) [2.039] | Pt1–N1 | 2.040(7) [2.039] |
| Pt1–C16 | 2.125(8) [2.046] | Pt1–C16 | 2.092(8) [2.047] |
| C6–Pt1–N3 | 80.30(3) [79.50] | C10–Pt1–N3 | 79.70(3) [79.49] |
| C6–Pt1–N1 | 79.00(3) [79.39] | C10–Pt1–N1 | 79.30(3) [79.38] |
| N3–Pt1–N1 | 159.30(2) [158.89] | N3–Pt1–N1 | 158.90(3) [158.87] |
| C6–Pt1–C16 | 176.80(4) [179.91] | C10–Pt1–C16 | 175.30(3) [179.81] |
| N3–Pt1–C16 | 98.10(3) [100.53] | N3–Pt1–C16 | 99.40(3) [100.50] |
| N1–Pt1–C16 | 102.50(3) [100.59] | N1–Pt1–C16 | 101.60(3) [100.63] |
| Pt⋯Pt | 3.300 | Pt⋯Pt | 4.683 |
| π–π | ∼3.30 | π–π | 3.401 |
Notably intermolecular interactions and conformations have been observed in these crystal lattices of complexes 7 and 8 (Fig. 3(A and B). The crystal packing of complex 7 show a staggered stacking arrangement between pairs of complex molecules (Fig. 3(A)). Intermolecular π⋯π interaction was found in the crystal packing, and the distance between the vertical plane-to-plane separation (dπ–π) of two adjacent molecules is ∼3.30 Å. The closest Pt–Pt distance (dPt–Pt) in the crystal of 7 is only 3.300 Å, which is indicative of strong metal–metal interactions. The crystal packing of complex 8 show a head-to-tail stacking arrangement between pairs of complex molecules (Fig. 3(B)). Intermolecular π⋯π interaction have been detected in the crystal packing, and the distance between the vertical plane-to-plane separation (dπ–π) of two adjacent molecules is ∼3.40 Å. There is no Pt⋯Pt interaction for 8, the shortest Pt–Pt distance (4.683 Å) of 8 is much longer than 7. The divergence can be attributed to the difference in structural arrangement created by the addition of a methoxy group on the phenyl ring.
Electrochemical properties
Cyclic voltammograms of the chloro-platinum complexes 1–3 display an irreversible and broad peak at Epa(1) at ca. 0.6–0.8 V vs. Fc+/Fc upon scanning in the positive direction (Fig. 4(A)). The value of Epa(1) varies with R1, as evidenced by the most positive value obtained with complex 3 (see Table 2). On the cathodic part, a single reduction peak is detected at Epc(3) (Table 3 and Fig. 4(A)). This peak is irreversible at v = 0.1 V s−1, but displays more reversibility when the scan rate is increased (inset, Fig. 4(A)). The value of Epc(3) is R1-dependent, consistent with a reduction process on the phenyl ligand. Noteworthy, this redox behavior is slightly different from that found for pyridine-based N^C^N Pt complexes,55 although experimental conditions were not fully the same (DMF vs. CH2Cl2). Indeed, replacement of the two pyridine rings by two pyrimidine units induces of loss of reversibility of the reduction process. Moreover, both oxidation and reduction processes are shifted towards more positive potential values by approximatively 200 mV, as shown by the comparative data for H- and OMe-phenyl-based Pt complexes. Such a result is consistent with the stronger electron-deficient properties of the pyrimidine vs. pyridine moieties. | ||
| Fig. 4 Cyclic voltammetry (CV) at a Pt working electrode (E/V vs. Fc+/Fc) of (A) chloro-platinum complexes 1, 2 and 3 (v = 0.1 V s−1) and (B) alkynyl-platinum complexes 4, 7 and 12 in CH2Cl2/NBu4PF6 0.1 M under inert atmosphere. C = 0.5 mM. Inset (A): CV of complex 1 at v = 5 V s−1. | ||
| 1 | 2 | 3 | 4 | 5 | 6 | 7 | 8 | 9 | 10 | 11 | 12 | 13 | 14 | |
|---|---|---|---|---|---|---|---|---|---|---|---|---|---|---|
| a (0.24 V, NPh2). b A second broad an irreversible peak appears at Epa(2). | ||||||||||||||
| E pa(1) | 0.64 | 0.61 | 0.78 | 0.61 | 0.54 | 0.66 | 0.59 | 0.51 | 0.51 | 0.61 | 0.54a | 0.73 | 0.59 | 0.53 |
| E pa(2) | — | 0.93 b | — | 0.88 | 1.03 | 0.79 | 0.73 | 0.90 | 0.88 | 0.84 | 0.69 | 0.96 | 1.02 | 0.81 |
| E pc(3) | −2.00 | −1.99 | −1.88 | −2.04 | −2.05 | −2.00 | −2.02 | −2.02 | −1.99 | −1.99 | −2.02 | −1.91 | −1.92 | −1.87 |
| EA | 2.50 | 2.59 | 2.75 | 2.52 | 2.50 | 2.59 | 2.54 | 2.53 | 2.59 | 2.59 | 2.54 | 2.69 | 2.68 | 2.73 |
| IE | 6.11 | 5.70 | 6.19 | 5.64 | 5.34 | 5.89 | 5.50 | 5.27 | 5.66 | 5.65 | 4.99 | 5.73 | 5.41 | 6.00 |
| CH2Cl2a |
KBr | ||||||
|---|---|---|---|---|---|---|---|
| UV/Vis | PL | Stokes Shift,c cm−1 | PL | ||||
| λ max, nm (ε, mM−1 cm−1) | λ max,b nm | τ, μs | Φ PL | λ max, nm | τ, μs | ||
| a All spectra were recorded at room temperature at c ∼ 10−5 M with deoxygenated solution prepared by bubbling N2 though the solutions. b λ exc = λabsmax of the lowest energy band. c Calculated using the less energetic absorption band and the more energetic emission band. d Photoluminescence quantum yield (±10%) measured relative to 9,10-bisphenylethynylanthracene in cyclohexane (ΦPl = 1.00).59 e Photoluminescence quantum yield (±10%) measured relative to Rhodamine 6G in ethanol (ΦPl = 0.95).59 f No emission detected. | |||||||
| 1 | 237(22.9), 266(28.0), 362 (4.4), 381 (5.8), 410 (4.6) | 485, 518, 556 | 5.4 | 0.34d | 3710 | 701 | 15.4 |
| [264, 321, 386] | [460] | ||||||
| 2 | 267 (23.3), 363 (2.1), 381 (3.3), 448 (4.9) | 561, 589 | 9.5 | 0.37e | 4500 | 778 | 15.1 |
| [265, 325, 429] | [556] | ||||||
| 3 | 263 (28.1), 363 (5.0), 379 (7.4), 404(5.5) | 476, 508, 549 | 5.6 | 0.08d | 3680 | —f | —f |
| [260, 326, 382] | [453] | ||||||
| 4 | 270 (44.9), 315 (10.5), 393 (6.6), 426 (4.9) | 507, 524 | 5.0 | 0.07e | 4670 | 718 | 14.0 |
| [267, 395] | — | ||||||
| 5 | 269 (35.3), 322 (7.1), 445 (2.4) | 538 | 6.7 | 0.27d | 3550 | 717 | 19.2 |
| [271, 329, 461] | [522] | ||||||
| 6 | 274 (23.1), 307 (18.6), 390 (2.2) 422 (1.3) | 498, 522 | 5.6 | 0.16d | 4310 | 732 | 20.9 |
| [265, 311, 388] | [483] | ||||||
| 7 | 268 (22.4), 382 (2.1), 451 (3.5) | 562, 593 | 9.1 | 0.55e | 4380 | 701 | 13.1 |
| [270, 339, 455] | [555] | ||||||
| 8 | 269 (86.0), 381 (7.4), 458 (11.3) | 572, 590 | 9.1 | 0.81e | 4350 | 739 | 17.3 |
| [272, 327, 360, 479] | [562] | ||||||
| 9 | 274 (49.0), 306 (42.0), 392 (9.5), 450 (11.9) | 561 | 7.1 | 0.35e | 4400 | 740 | 17.9 |
| [265, 312, 427] | [548] | ||||||
| 10 | 269 (27.1), 336 (4.4), 381 (2.3), 448 (3.2) | 561, 592 | 12.3 | 0.52e | 4500 | 764 | 19.3 |
| [265, 334, 427] | [549] | ||||||
| 11 | 272 (59.9), 317 (51.0), 381 (13.6), 457 (13.8) | 605 | — | 0.01e | 5350 | 741 | 17.4 |
| [267, 330, 383, 503] | [568] | ||||||
| 12 | 265 (38.9), 315 (7.6), 393 (6.6), 425 (5.3) | 506 | 3.4 | 0.06e | 3660 | —f | —f |
| [267, 317, 433] | [507] | ||||||
| 13 | 266 (30.1), 318 (3.9), 380 (1.5), 445 (1.9) | 552 | 4.3 | 0.18e | 3500 | —f | —f |
| [265, 328, 465] | — | ||||||
| 14 | 272 (29.6), 305 (25.8), 373 (6.6), 389 (7.6), 418 (6.1) | 495 | 3.1 | 0.02d | 4010 | —f | —f |
| [263, 309, 385] | [494] | ||||||
As shown in Fig. 4(B) and Table 2, alkynyl-complexes 4–14 display similar behavior to 1–3. On one hand, the value of Epc(3) varies with the electronic properties of R1 as for complexes 1–3, in agreement with a reduction process on the Pt-bound phenyl ligand, the values being close to those found for the chloride complexes. On the other hand, the irreversible oxidation process at Epa(1) does not sensibly change with R2 for this series, as previously found for analogous Pt complexes.31
For instance, alkynyl-complexes 4, 7 and 12 (R2 = H) display similar values to their chloro-platinum analogues (complexes 1, 2 and 3 respectively). Within a single R1 series such as for complexes 7–11, the oxidation potential seems independent of the electronic properties of R2 (see Table 2). Moreover, the R1 – Epa(1) trend found with complexes 1–3 is no longer observed. Thus, these electrochemical data emphasize that the redox properties of the phenylacetylide complexes 4–14 can be mainly controlled through the variation of the substituting group R1 which can significantly affect the reduction potential. Possibly, the random variation of the oxidation potential Epa(1) with R2 originates from the different possible orientations of the phenyl ring relative to the cyclometalated ligand, favoring or not conjugation between the two moieties (see computational part).
Photophysical properties
The UV/Vis absorption and photoluminescence (PL) properties of chloro- and alkynyl-platinum complexes 1–14 are summarized in Table 3.Absorption spectra of chloro-platinum complexes 1–3 are displayed in Fig. 5. These complexes exhibit intense absorption band in the UV region from 250 to 300 nm, assigned to intra-ligand (IL) π–π* transition on the cyclometalated (N^C^N) ligands and less intense bands from 350 to 450 nm attributed in particular to metal to ligand charge transfer (MLCT). For complex 2, the presence of a methoxy electron-donating group in conjugated position with the platinum atom on the central phenyl ring of the N^C^N ligand induces a significant red-shift of the less energetic absorption band with regards to complex 1 (Δλ = 37 nm), as observed recently in a series of 2-phenylpyrimidine platinum complexes.60 On the contrary, the presence of a trifluoromethyl electron-withdrawing substituent, in the N^C^N ligand of complex 3 causes a slight blue shift of 6 nm of the same band. Alkynyl-platinum complexes 4–14 exhibit similar absorption profile than their respective chloro-platinum parent complexes, with the lowest-energy absorption band attributed mainly to interligand charge transfer (see computational part). In the series of complexes with methoxy substituted N^C^N ligand, the presence of methoxy electron-donating group on the alkynyl ligands (complex 8) leads to slight red-shift of the less energetic absorption band with regards to complex 7 (Fig. 6). The same trend is also observed in the two other series of complexes with unsubstituted and trifluoromethyl substituted N^C^N ligand (Fig. S23 and S24†). This red-shift is more pronounced with stronger electron-donating diphenylamino substituent on alkynyl ligand (complex 11).
 | ||
| Fig. 5 Absorption spectra of chloro-platinum complexes 1–3 in CH2Cl2 (c ∼ 10−5 M). | ||
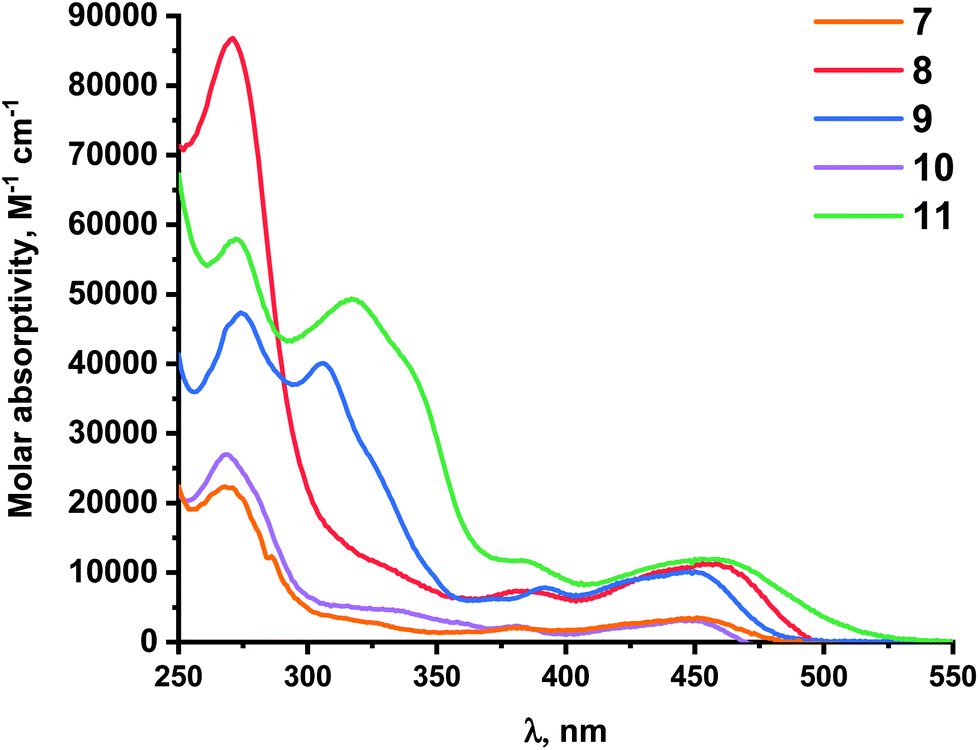 | ||
| Fig. 6 Absorption spectra of alkynyl-platinum complexes 7–11 in CH2Cl2 (c ∼ 10−5 M). | ||
All complexes exhibit emission in CH2Cl2 solution with emission lifetimes comprised between 3.1 to 12.3 μs, characteristic of phosphorescence emission. The photoluminescence quantum yield (PLQY) are in some cases rather high (ΦPL up to 0.81), as expected for platinum(II) complexes with N^C^N ligand.19 The emission spectra of chloro-platinum complexes 1–3 are displayed in Fig. 7. Structured spectra with vibrational spacing of around 1300 cm−1 are observed for complexes 1 and 3 as described previously for similar N^C^N complexes.55 A large red shift of the main emission maxima and longer emission lifetime are displayed by complex 2 with methoxy substituted N^C^N ligand with regard to complex 1 (Δλ = 76 nm). The less structured shape of the emission band of this complex would indicate a lower structural distortion of excited state and could explain the higher PLQY observed.61 On the other hand, complex 3 with trifluoromethyl substituted N^C^N ligand shows a really similar emission profile than complex 1 with a blue shift of 7–12 nm and reduced PLQY. In the series of alkynyl-platinum complexes 7–11 with methoxy substituted N^C^N ligand, the presence of a methoxy electron-donating group on the alkynyl ligand in complex 8 leads to a slight red shift of the main emission band to 572 nm (Fig. 8). This complex exhibits the best quantum yield of the whole series (ΦPL = 0.81). Diphenylamino group appended on alkynyl ancillary ligand in complex 11 induced a more pronounced red-shift of the position of emission maxima, but the PLQY is dramatically reduced. The replacement of chlorine ligand by a stronger-field ligand such as phenylacetylene ones is known to raise the energy of the metal-centered d–d excited state, which is subject to efficient non-radiative decay, well above the emitting triplet state.61–63 Strong electron-donating diphenylamino or electron-withdrawing cyano groups on the phenylacetylene anciliary ligand in complexes 11 and 9 reduce the PLQY and the highest PLQY are observed with softer electron-donating methoxy group. For the two other series of alkynyl complexes 4–6 and 12–14, the p-anisole alkyne ligand provides the highest PLQY in each case (Fig. S26 and S27†). When compared their analogue complexes based on 1,3-bis(pyrimidin-2-yl)benzene ligand, the complexes 1, 4, 12 and 13 exhibit similar emission profile but lower PLQY.55,64 On the other hand, methoxy substituted chloro-platinum complex 2 exhibits higher PLQY than its pyridine analogue (0.37 vs. 0.30).55
 | ||
| Fig. 7 Normalized emission spectra of chloro-platinum complexes 1–3 in deoxygenated CH2Cl2 solution (c ∼ 10−5 M). λexc = λabsmax of the lowest energy band inset: picture of CH2Cl2 solution taken under UV irradiation. | ||
 | ||
| Fig. 8 Normalized emission spectra of alkynyl-platinum complexes 7–11 in deoxygenated CH2Cl2 solution (c ∼ 10−5 M). λexc = λabsmax of the lowest energy band inset: picture of CH2Cl2 solution taken under UV irradiation. | ||
In solid state, complexes 1, 2, 4–11 exhibit red emission with unstructured band attributed to the formation of excimers more than to MMLCT (Fig. 9 and Fig. S27†). Indeed, in solution when the concentration is increased to more than 10−4 M a new broad band is observed at respectively 700 and 720 nm for complexes 2 and 8. On the other hand the absorption and excitation profile are not modified at this concentration and no deviation of the Beer Lamber Law is detected (Fig. S28 and S29†).
 | ||
| Fig. 9 Normalized emission spectra of complexes 1, and 4–6 in KBr matrix (2 w%). λexc = λabsmax of the lowest energy band in CH2Cl2 solution inset: picture of KBr pellets taken under UV irradiation. | ||
Theoretical calculations
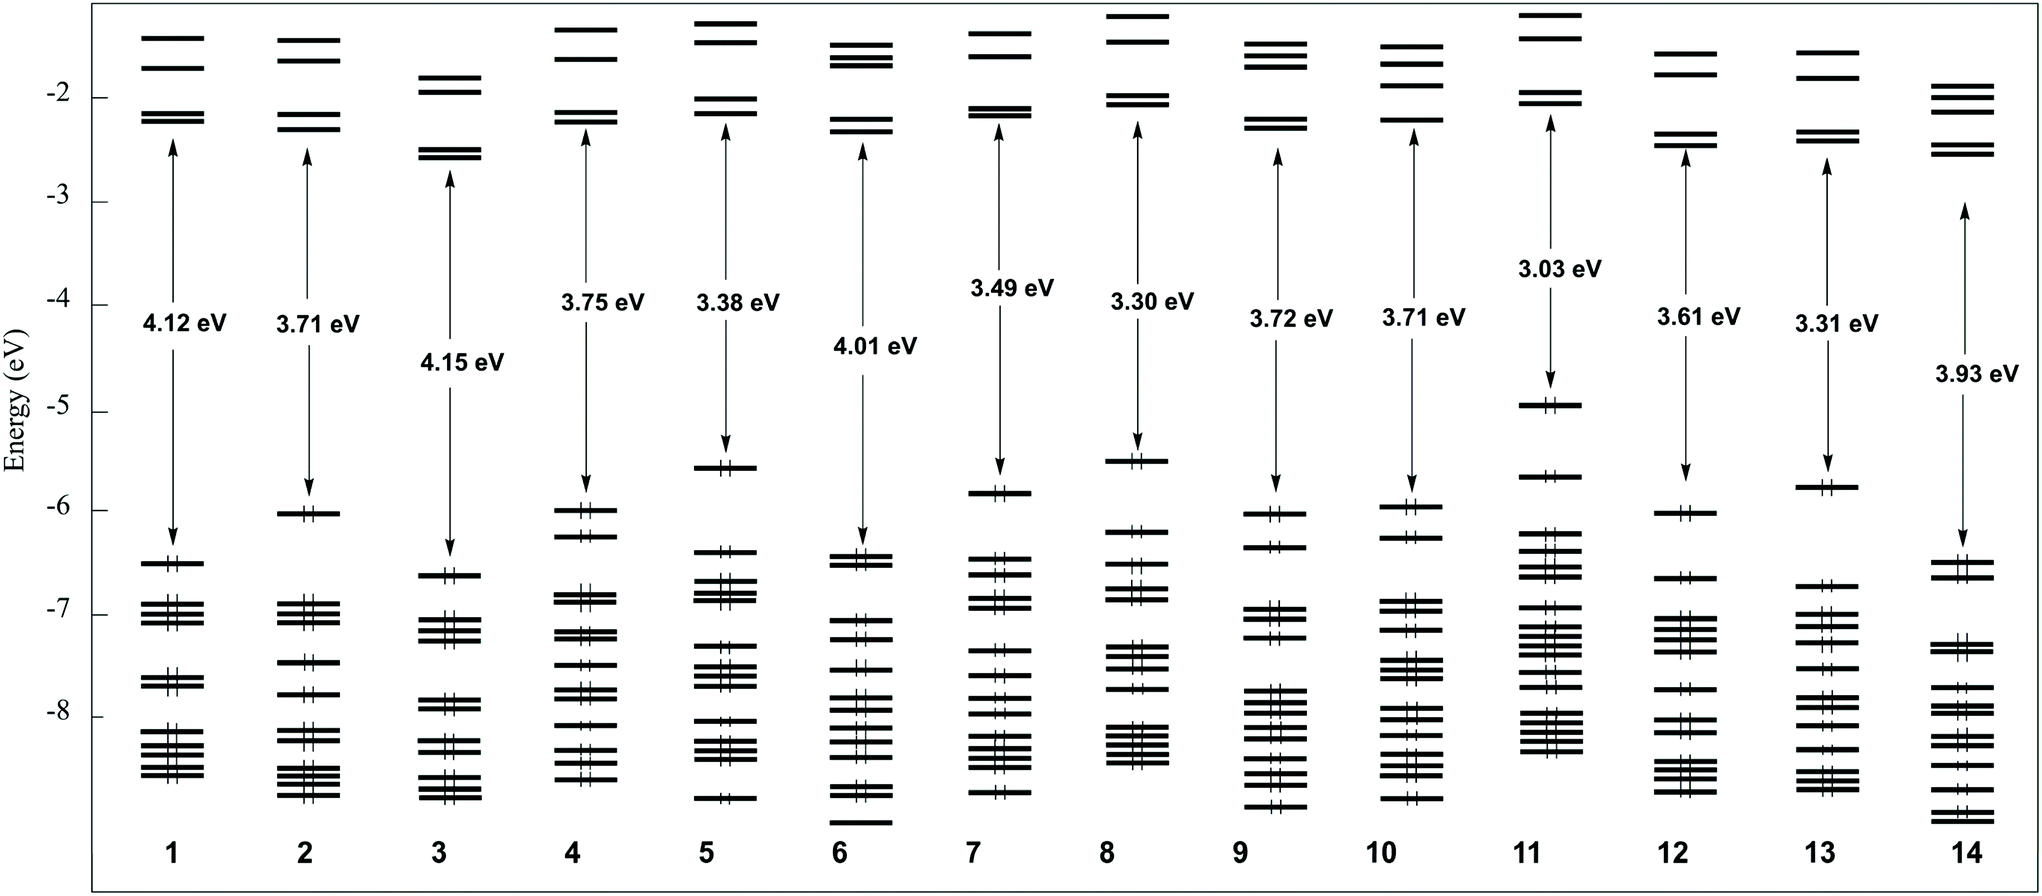
Following previous computational studies on related platinum complexes,31,49,63,65–67 we performed density functional theory (DFT) calculations at the PBE0/Def2-TZVP level were performed to optimize the geometries of chloro- and alkynyl-platinum complexes 1–14. Solvent (CH2Cl2) effect corrections were included (see Computational details). The 14 optimized structures are shown in Fig. S30.† Selected computed data are provided in Table 4 and Table S5.† The optimized geometries of 7 and 8 are essentially consistent with their X-ray structures (Table 1). The optimized Pt–N and Pt–C(N^C^N) distances are ∼0.5% longer and shorter, respectively, than their X-ray counterparts, whereas the computed Pt-CCR separations are found ∼3% shorter than the experimental one. In addition, the phenyl ring makes a larger angle with the N^C^N ligand plane in the X-ray structure of 7 and it is more bent in that of 8. These differences, which are more pronounced in the case of 7, can be attributed to the existence of the intermolecular forces existing in the solid state (substantial in the case of 7, see above), whereas the optimized structures were considered isolated in dichloromethane solution. As a matter of fact, the optimized geometries of 7 and 8 were found nearly planar, as all the investigated complexes, except that of 4, 6, 9, 10, 11 and 14. In the case of 11, the whole molecular framework is planar except that the NPh2 substituent is out-of-plane rotated by ∼40° due to steric repulsions. On the other hand, in 4, 6, 9, 10 and 14 the phenyl ring is found perpendicular to the N^C^N ligand. Actually, 6, 9, 10 and 14 are the only species bearing an electron accepting group of the phenyl-alkynyl ligand (R2 = CN, CHO) whereas 4 is unsubstituted. An evaluation of the rotational energy barrier in 4, 6 and 9 provided values lower than 1 kcal mol−1, indicating nearly free rotation of the phenyl ring in these compounds. Obviously, in these complexes, the Pt center is reluctant to set up the π-type communication between the N^C^N ligand on one side and the phenyl alkynyl group on the other side when R2 is not a donating group.| Compound | 1 | 2 | 3 | 4 | 5 | 6 | 7 | 8 | 9 | 10 | 11 | 12 | 13 | 14 | |
|---|---|---|---|---|---|---|---|---|---|---|---|---|---|---|---|
| HOMO–LUMO gap (eV) | 4.12 | 3.71 | 4.15 | 3.75 | 3.39 | 4.01 | 3.49 | 3.30 | 3.72 | 3.71 | 3.03 | 3.60 | 3.31 | 3.93 | |
| NAO charges | Pt | 0.67 | 0.66 | 0.68 | 0.68 | 0.68 | 0.68 | 0.68 | 0.68 | 0.68 | 0.68 | 0.68 | 0.69 | 0.69 | 0.69 |
| N | −0.44 | −0.44 | −0.44 | −0.44 | −0.44 | −0.44 | −0.44 | −0.44 | −0.44 | −0.44 | −0.43 | −0.43 | −0.44 | −0.44 | |
| C N^C^N | −0.05 | −0.07 | −0.04 | −0.13 | −0.13 | −0.13 | −0.16 | −0.16 | −0.15 | −0.15 | −0.16 | −0.12 | −0.12 | −0.11 | |
| Cl/C(CR) | −0.73 | −0.73 | −0.72 | −0.40 | −0.42 | −0.36 | −0.40 | −0.42 | −0.36 | −0.36 | −0.41 | −0.40 | −0.42 | −0.36 | |
| Dipole moment (D) | 3.47 | 4.51 | 0.70 | 1.49 | 1.49 | 8.78 | 2.57 | 0.96 | 9.77 | 8.01 | 2.30 | 3.01 | 4.66 | 4.48 | |
Unsurprisingly, the Pt–N distances are almost constant within the whole series (range: 0.006 Å). This is not of course the case for the Pt–CN^C^N distances. The shortest ones, associated with the largest Wiberg bond indices (WBIs), are found for the chloro-platinum derivatives 1–3. Within the alkynyl-platinum series 4–14, they lie in a range of 0.006 Å and the shortest correspond to the trifluoromethyl-substituted complexes 12–14. The Pt-CCR separations vary also within a small range of 0.005 Å, as well as the C![[triple bond, length as m-dash]](https://www.rsc.org/images/entities/char_e002.gif) C distances which are almost constant within the 4–14 series (1.225–1.226 Å). The corresponding WBIs, however, show a larger dispersion (2.704–2.742), indicative of different bond strengths. The larger values corresponds to the cases where there is no donor substituent on the N^C^N ligand together with the presence of the electron donor OCH3 group on the phenylacetylene ancillary ligand (complexes 5 and 13). The lowest values correspond to the cases where there is no acceptor substituent on the N^C^N ligand together with the presence of an electro acceptor group on the phenyl ring (complexes 6, 9 and 10). Obviously, this latter situation favors conjugation. The natural atomic orbital (NAO) charges show little variations on Pt and N (Table 4). That of the C alkynyl carbon are more dispersed and the lowest negative values correspond to the more conjugated 6, 9 and 10 complexes. These three compounds have by far the largest dipole moment (Table 4), indicating that the –CN or –CHO substituted phenyl–alkynyl moiety acts as a good acceptor and the N^C^N ligand behaves as a good donor, providing that the latter is not substituted by an electron acceptor group.
C distances which are almost constant within the 4–14 series (1.225–1.226 Å). The corresponding WBIs, however, show a larger dispersion (2.704–2.742), indicative of different bond strengths. The larger values corresponds to the cases where there is no donor substituent on the N^C^N ligand together with the presence of the electron donor OCH3 group on the phenylacetylene ancillary ligand (complexes 5 and 13). The lowest values correspond to the cases where there is no acceptor substituent on the N^C^N ligand together with the presence of an electro acceptor group on the phenyl ring (complexes 6, 9 and 10). Obviously, this latter situation favors conjugation. The natural atomic orbital (NAO) charges show little variations on Pt and N (Table 4). That of the C alkynyl carbon are more dispersed and the lowest negative values correspond to the more conjugated 6, 9 and 10 complexes. These three compounds have by far the largest dipole moment (Table 4), indicating that the –CN or –CHO substituted phenyl–alkynyl moiety acts as a good acceptor and the N^C^N ligand behaves as a good donor, providing that the latter is not substituted by an electron acceptor group.
The Kohn–Sham MO level energy diagrams of chloro- and alkynyl-platinum complexes 1–14 are shown in Fig. 10 and their HOMOs and LUMOs are plotted in Fig. 11, Fig. S31a and S31b.† The highest HOMOs are those of complexes bearing a donor R2 substituent (5, 8, 11 and 13). The lowest HOMOs are those of complexes with no donor substituent (1, 3, 6 and 14). The LUMO energies are significantly less dispersed in energy and appear more dependent to the nature of R1 than that of R2. It results that the lowest HOMO–LUMO gaps are those of complexes with donor R2 substituents (8, 11 and 13) and the largest HOMO–LUMO gaps are those of compounds with no donor substituent (1, 3, 6 and 14). The HOMOs of the chloro derivatives 1–3 have a major contribution from the N^C^N ligand, with some Cl and Pt admixture. The same type of N^C^N centered HOMO is found for 9 and 10 (R1 = H3CO; R2 = acceptor). That of all the other complexes can be identified as the π-type HOMO of the substituted phenyl–alkynyl ligand. It is rotated by 90° in the case of the “perpendicular” complexes 4, 6 and 14 with respect to their “planar” counterparts. In the case of 7–10, this HOMO gets also some non-negligible contribution from the N^C^N ligand. In all the complexes, the LUMO is N^C^N-localized, as well as the LUMO+1. Rather similar frontier orbital characteristics were found for related chloro- and alkynyl-platinum(II) complexes bearing a N^C^N ligand.66 The calculated ionization energies (IE; see Computational details) are gathered in Table 2. Their variation across the 1–14 series mainly reflects that of their HOMOs. Surprisingly, no linear relationship could be traced between the recorded Epa(1) and neither computed IEs or the HOMO energies. This absence of correlation is likely to be attributed to the irreversible nature of the first oxidation potential. On the other hand, a good linear correlation can be traced between the electrochemical Epc(3) values and the computed electron affinities (EA; see Computational details), as exemplified by Fig. S32.†
 | ||
| Fig. 10 Kohn–Sham MO diagrams of complexes 1–14. | ||
 | ||
| Fig. 11 The frontier orbitals of complexes 1, 5, 6 and 13. | ||
TD-DFT calculations were performed to simulate the UV-vis absorption spectra of complexes 7–14, which are shown in Fig. S31 and S34.† The simulated and experimental spectra of complexes 1, 2, 7 and 8 are plotted together in Fig. S44† to exemplify their rather good consistency. The λmax values of the simulated spectra are given in Table 3, for comparison with the experimental λmax. The major optical transitions contributing to the simulated band of lowest energy are given in Table S4.† There is an overall good agreement with the experimental data, apart from the fact that the observed weak band of lowest energy of compounds 1–4, 6 and 14 is not reproduced in the simulations, it should be noted however that in the case of 4 and 6, the HOMO–LUMO transition is found at ∼420 nm (Table S4†), but its modest oscillator strength prevents it to contribute to an individual simulated band of low-energy. In the slightly less stable planar configuration of 4 and 6, this transition is associated with a slightly higher oscillator strength. In the case of 14, the HOMO–LUMO transition appears fully forbidden. These results suggest that in the case of complexes 4, 6 and 14, the weak band observed at ∼420 nm corresponds to the HOMO–LUMO transition (phenyl-akynyl → (N^C^N) charge transfer), the expected oscillator strength of which being underestimated by the calculations in the considered frozen rotational conformations. In the case of complexes 1–3, the computed absorption band of lowest energy corresponds to the HOMO → LUMO transition and is thus of major intra-(N^C^N) charge transfer character. In the case of the alkynyl complexes 5–14, it is of HOMO → LUMO and/or HOMO → LUMO+1 nature, thus of major interligand phenyl-akynyl → (N^C^N) charge transfer nature. The phosphorescence data where computed assuming the emissive state being the first excited triplet state, of which the optimized geometries are shown in Fig. S41.† Complexes 4–14 have all their N^C^N ligand and phenyl ring coplanar, compounds 4, 12 and 14 being in addition bent at the alkynyl carbon bonded to Pt, indicative of an electron-rich phenyl–alkynyl ligand in the excited state. This is consistent with the fact that in all the cases, the involved excited triplet state corresponds to the promotion of a single electron into the LUMO, LUMO+1 or a combination of both. Thus, in the cases of complexes 4–14, the electron is promoted into a phenyl–alkynyl orbital. The spin densities of the first excited triplet states, plotted in Fig. S42,† nicely illustrate this view. The simulated emission spectra are shown in Fig. S37–S40,† except that of 4 and 13 that could not be computed, in the case of the former, probably because of the too large structural difference between the ground and excited states. The shapes of the simulated spectra match quite well with those of their experimental counterparts recorded in solution and the agreement between the computed and experimental λmax of the major (first) emission band varies from satisfying to very good (see Table 3). The charge transfers associated with the triplet → singlet emission are illustrated by the plots of the differences between the densities of these two states shown in Fig. S43† and quantified by corresponding transferred fractions of electron qCT over associated spatial extends dCT (see Computational details). From the values of the qCT/dCT couples, the highest quantum yields are expected for compounds 5 and 11–14, which is obviously not the case (see Table 3). On the other hand, non-radiative decay should not be neglected. It is expected to be, inter alia, favored by the amplitude of the structural difference between the triplet and singlet states.65 From this perspective, complexes 7–10 appear to be among those satisfying both criteria at best (see Fig. S30, S41 and S43†).
Conclusions
In summary, a series of luminescent cyclometallated N^C^N chloro- and alkynyl-platinum(II) complexes based on 1,3-bis(pyrimidin-2-yl)benzene ligands was designed. Their electrochemical and photophysical properties were thoroughly studied experimentally and theoretically with the help of DFT calculation. All compounds are phosphorescent in CH2Cl2 solution with emission ranging from green to orange depending on the R1 and R2 substituents on the ligands. All complexes, except those with trifluoromethyl substituted ligands exhibit red emission in KBr solid matrix.For chloro-platinum complexes, the presence of a methoxy group in the central benzene core of the ligand induces a red shift of less energetic absorption and emission band that can be correlated to a reduction of calculated HOMO–LUMO gap. The presence of alkynyl ancillary ligand has a limited influence on absorption and emission spectra except in case of complex 11 with strongly electron-donating diphenylamino R2 substituent for which a significant red-shift is observed. Reduction potential and LUMO energy are rather independent of the nature of R2 substituent. In term of emission intensity, the presence of CF3 electron-withdrawing group as R1 substituent on the N^C^N ligand has a negative effect. Even if the PLQY of some of these complexes are lower than their analogues based on 1,3-bis(pyrimidin-2-yl)benzene ligand, the presence of OMe groups as both R1 and R2 substituents has a beneficial effect on PLQY. In CH2Cl2, PLQY up to 0.81 was achieved for complex 8 with R1 = R2 = OMe, one of the best ever reported for the class of complexes.
These results represent a useful study for the understanding of influence of ligands on the photophysical properties of platinum(II) complexes. Experiments are currently underway to improve solid state emission properties of this family of platinum(II) complexes.
Experimental part
General information
In air- and moisture-sensitive reactions, all glassware was flame-dried. All reactions were conducted under a dry nitrogen atmosphere using Schlenk techniques. The starting materials were purchased from Sigma-Aldrich, TCI or Alfa-Aesar and were used as received. Ligands 15–19, and complexes 1–2 were prepared as previously reported,49,55,68,69 whereas new ligand 20 and complexes 3–14 were prepared as described below. The solvents and reactants were used as received except tetrahydrofuran that was distilled under a dry nitrogen atmosphere over sodium and benzophenone. Organic solutions were concentrated under reduced pressure using a rotary evaporator. Thin layer chromatography (TLC) was conducted on pre-coated aluminum sheets with 0.20 mm Merck Alugram SIL G/UV254 with fluorescent indicator UV254 and 0.25 mm Merck silica gel (60-F254). Column chromatography was carried out using Acros silica gel 60 (particle size 63–200 μm) and Macherey Nagel Aluminum neutral oxide 40 (particle size 40–160 μm). Nuclear magnetic resonance (NMR) spectra were acquired at room temperature on a Bruker AC-300 spectrometer (1H at 300 MHz, 13C at 75 MHz,) and referenced as follows: 1H NMR, residual CHCl3 (δ = 7.26 ppm); 13C{1H} NMR, internal CDCl3 (δ = 77.16 ppm). The chemical shifts δ are reported in parts per million relative to TMS (1H, 0.0 ppm) and CDCl3 (13C, 77.16 ppm). The coupling constant J is given in Hz. In the 1H NMR spectra, the following abbreviations are used to describe the peak pattern: s (singlet), d (doublet), dd (doublet of doublet), t (triplet), and m (multiplet). Acidic impurities in CDCl3 were removed by treatment with anhydrous K2CO3. IR spectra were recorded on a PerkinElmer spectrum 100 spectrometer with an ATR sampling accessory. High Resolution Mass Spectrometry (HRMS) analyses were performed at the “Centre Régional de Mesures Physiques de l'Ouest” (CRMPO, University of Rennes 1, France) using a Bruker MicroTOFQ II apparatus.X-ray structure determination
The SCXRD studies of 7 (CCDC 2126978†) and 8 (CCDC 2126979†) were performed on an APEXII, Bruker AXS diffractometer equipped with a CCD plate detector and a Mo-Kα radiation (λ = 0.71073 Å, graphite monochromator). Measurements were done at 150 K. Crystal structures were solved by dual-space algorithm using the SHELXT program,70 and then refined with full-matrix least-square methods based on F2 (SHELXL).71 All non hydrogen atoms were refined with anisotropic atomic displacement parameters. H atoms were finally included in the structural model in their calculated positions, and constrained to ride on the attached carbon atom. Relevant collection and refinement data for all compounds are given in the ESI.†Cyclic voltammetry
The electrochemical studies were performed in a glovebox (Jacomex) (O2 < 1 ppm, H2O < 1 ppm) with a home-made 3-electrode cell (WE: Pt, RE: Ag wire, CE: Pt). Ferrocene was added at the end of each experiment to determine the redox potential values. The standard potential of the Fc+/Fc couple in CH2Cl2/NBu4PF6 was measured experimentally with reference to the standard calomel electrode (SCE): E°(Fc+/Fc) = 0.47 V vs. SCE. The potential of the cell was controlled by an AUTOLAB PGSTAT 100 (Metrohm) potentiostat monitored by the NOVA© software (Metrohm). Dichloromethane was freshly distilled from CaH2 and kept under Ar in the glovebox. The supporting salt NBu4PF6 was synthesized from NBu4OH (Fluka) and HPF6 (Aldrich). It was then purified, dried under vacuum for 48 hours at 100 °C, and then kept under N2 in the glovebox.Photophysical details
UV/vis absorption spectra were recorded on a Jasco V-650 spectrophotometer. Emission spectra were measured on a Horiba Fluoromax spectrometer. Complexes were excited at their absorption maxima (band of lowest energy) to record the emission spectra in degassed DCM. The emission quantum yields of these complexes were calculated relative to 9,10 – bis(phenylethynyl) anthracene in cyclohexane (Φem = 1) or Rhodamine 6G in ethanol (ΦPl = 0.95) as the reference solution.59 Five diluted solutions (with A > 0.1 at excitation wavelength) are used for studied chromophores and standard. QY is calculated according to the following equation: where Gradx and GradSt correspond to the slope of the regression line of integration of the emission band versus the absorbance at the excitation wavelength for the studied chromophore and the standard respectively. The phosphorescence lifetimes measurements of deoxygenated CH2Cl2 solutions samples were performed on the same spectrometer in the phosphorimeter mode using xenon flash lamp for excitation. UV-vis and fluorescence spectra were recorded using standard 1 cm quartz cells. Stokes shifts were calculated by considering the lowest energetic absorption and the highest energy emission bands.
Computational details
DFT calculations were carried out using the Gaussian16 package,72 employing the PBE0 functional,73–75 together with the Def2-TZVP basis set with relativistic pseudopotentials, from EMSL Basis Set Exchange Library.76,77 Implicit solvent (chloroform) effects were included through the polarizable continuum model (PCM) approximation, which is routinely used for non-coordinating solvents.78,79 This level of theory has been shown appropriate in previous investigations on related Pt complexes.31,80 The optimized geometries were fully characterized as true minima by analytical frequency calculations (no imaginary values). The geometries obtained from DFT calculations were used to perform natural atomic charge analysis with the NBO 6.0 program.81 TD-DFT calculations were carried out at the same level of calculations, which has been shown to provide satisfactory results on related investigations.31,66 Only singlet–singlet transitions were taken into account in these calculations. Only singlet–singlet transitions were taken into account in the TD-DFT calculations. Only the transitions with non-negligible oscillator strengths are discussed in the paper. The graphical SWizard program82,83 was used for simulating UV-vis spectra. A TD-DFT check did not show any other excited triplet state in the vicinity of the lowest triplet state, except for compound 13 (0.02 eV). Thus, phosphorescence was assumed to occur from the lowest triplet state that was fully optimized at the PBE0/Def2-TZVP level. The phosphorescence emission spectra were computed within the Franck–Condon principle by using the Adiabatic Hessian method84,85 which takes into account vibrational mode mixing and a proper description of both optimized ground and excited (triplet) states potential energy surfaces. The lowest normal modes in the vibronic treatment were neglected in order to obtain sufficient spectrum progression. We employed the class-based pre-screening to limit the number of terms involved in the vibronic calculation with the following settings: Cmax1 = 70, Cmax2 = 70, Nmax1 = 100 × 108.86–88 All the vibronic plots were realized using the VMS piece of software.89 Charge transfers associated with the triplet → singlet emissive transitions were illustrated by plots of the differences between the densities of the excited and ground states and quantified by associated charge transfer values and distance values as defined by Adamo and coworkers.90–92Synthesis
:1, v/v) to give compound 20 as a white crystalline solid in 65% yield (197 mg). NMR (δ (ppm), CDCl3): 1H (300 MHz): 9.75 (s, 1H), 8.94–8.82 (m, 6H), 7.32–7.23 (m, 2H). 13C{1H} NMR (75 MHz, CDCl3): 162.9(C), 157.1(CH), 138.7(C), 131.6(C, 2JCF = 33 Hz), 130.7(CH), 126.7(CH, 3JCF = 4 Hz), 125.6(C, 1JCF = 271 Hz), 119.6(CH). HRMS (ESI) m/z calculated for C15H9N4F3Na [M + Na]+: 325.0672, found: 325.0672 (0 ppm).
:1 v/v) was added and the mixture was left for 15 hours at room temperature. Then the solvents were removed, and the crude product was washed with water, methanol, and n-hexane. The complex 4 was obtained as orange powder in 87% yield (28 mg). NMR (δ (ppm), THF-d8): 1H (300 MHz): 9.55 (ddd, 3JHH = 2.2 Hz, 4JHH = 5.7 Hz, 3JHPt = 19.8 Hz, 2H), 8.98 (dd, 3JHH = 2.2 Hz, 4JHH = 4.7 Hz, 2H), 7.87 (d, 3JHH = 7.6 Hz, 2H), 7.39 (s, 1H), 7.38–7.33 (m, 2H), 7.29 (t, 3JHH = 7.6 Hz, 2H), 7.19 (t, 3JHH = 7.6 Hz, 2H), 7.12–7.03 (m, 1H). 13C{1H} NMR (JMOD, 75 MHz, THF-d8): 162.1 (CH), 161.0 (C), 158.5 (CH), 144.8 (C), 136.0 (C), 131.8 (CH), 129.0 (CH), 128.0 (CH), 127.8 (C), 124.9 (CH), 123.7 (CH), 119.9 (CH), 105.6 (C), 105.4 (C). IR (ATR, cm−1): 2083(νCC), 1583(νC![[double bond, length as m-dash]](https://www.rsc.org/images/entities/char_e001.gif) C), 1551(νCN). HRMS (ESI) m/z calculated for C22H14N4Na195Pt [M + Na]+: 552.0759, found: 552.0761 (0 ppm).
C), 1578(νCC), 1549(νCN), 1046(νCO). HRMS (ESI) m/z calculated for C23H16N4ONa195Pt [M + Na]+: 582.0864, found: 582.0868 (1 ppm).
N), 2080(νCC), 1582(νCC), 1553(νCN). HRMS (ESI) m/z calculated for C23H13N5Na195Pt [M + Na]+: 577.0711, found: 577.0712 (0 ppm).
C), 1578(νCC), 1549(νCN), 1046(νC–O). HRMS (ESI) m/z calculated for C23H16N4ONa195Pt [M + Na]+: 582.0864, found: 582.0866 (0 ppm).
C), 1578(νCC), 1551(νCN), 1044(νC–O). HRMS m/z calculated for C24H18N4O2Na195Pt [M + Na]+: 612.0970, found: 612.0977 (1 ppm).
N), 2090(νCC), 1577(νCC), 1552(νCN), 1046(νC–O). HRMS (ESI) m/z calculated for C24H15N5ONa195Pt [M + Na]+: 607.0817, found: 607.0820 (0 ppm).
C), 1686(νCO), 1577(νCC), 1551(νCN), 1046(νC–O). HRMS (ESI) m/z calculated for C24H16N4O2Na195Pt [M + Na]+: 610.0813, found: 610.0816 (0 ppm).
C), 1579(νCC), 1551(νCN). HRMS (ESI) m/z calculated for C35H25N5ONa195Pt [M + Na]+: 749.1599, found: 749.1603 (0 ppm).
C), 1585(νCC), 1553(νCN). HRMS (ESI) m/z calculated for C23H13N4Na195Pt [M + Na]+: 620.0632, found: 620.0633 (0 ppm).
C), 1582(νCC), 1505(νCN), 1060(νC–O). HRMS (ESI) m/z calculated for C24H15N4OF3Na195Pt [M + Na]+: 650.0738, found: 650.0734 (1 ppm).
N), 2089(νCC), 1593(νCC), 1552(νCN). HRMS (ESI) m/z calculated for C24H12N5F3Na195Pt [M + Na]+: 645.0585, found: 645.0590 (1 ppm).
C), 1551(νCN). HRMS (ESI) m/z calculated for C22H14N4Na195Pt [M + Na]+: 552.0759, found: 552.0761 (0 ppm).
C), 1578(νCC), 1549(νCN), 1046(νCO). HRMS (ESI) m/z calculated for C23H16N4ONa195Pt [M + Na]+: 582.0864, found: 582.0868 (1 ppm).
N), 2080(νCC), 1582(νCC), 1553(νCN). HRMS (ESI) m/z calculated for C23H13N5Na195Pt [M + Na]+: 577.0711, found: 577.0712 (0 ppm).
C), 1578(νCC), 1549(νCN), 1046(νC–O). HRMS (ESI) m/z calculated for C23H16N4ONa195Pt [M + Na]+: 582.0864, found: 582.0866 (0 ppm).
C), 1578(νCC), 1551(νCN), 1044(νC–O). HRMS m/z calculated for C24H18N4O2Na195Pt [M + Na]+: 612.0970, found: 612.0977 (1 ppm).
N), 2090(νCC), 1577(νCC), 1552(νCN), 1046(νC–O). HRMS (ESI) m/z calculated for C24H15N5ONa195Pt [M + Na]+: 607.0817, found: 607.0820 (0 ppm).
C), 1686(νCO), 1577(νCC), 1551(νCN), 1046(νC–O). HRMS (ESI) m/z calculated for C24H16N4O2Na195Pt [M + Na]+: 610.0813, found: 610.0816 (0 ppm).
C), 1579(νCC), 1551(νCN). HRMS (ESI) m/z calculated for C35H25N5ONa195Pt [M + Na]+: 749.1599, found: 749.1603 (0 ppm).
C), 1585(νCC), 1553(νCN). HRMS (ESI) m/z calculated for C23H13N4Na195Pt [M + Na]+: 620.0632, found: 620.0633 (0 ppm).
C), 1582(νCC), 1505(νCN), 1060(νC–O). HRMS (ESI) m/z calculated for C24H15N4OF3Na195Pt [M + Na]+: 650.0738, found: 650.0734 (1 ppm).
N), 2089(νCC), 1593(νCC), 1552(νCN). HRMS (ESI) m/z calculated for C24H12N5F3Na195Pt [M + Na]+: 645.0585, found: 645.0590 (1 ppm).
Conflicts of interest
There are no conflicts of interest to declare.Acknowledgements
M. H. acknowledges the Région Bretagne, France and Conseil Départemental des Côtes d'Armor, France for her Ph. D. funding (MMLum project).Notes and references
- W. T. Eckenhoff and R. Eisenberg, Dalton Trans., 2012, 41, 13004 RSC.
- D. M. Schultz and T. P. Yoon, Science, 2014, 343, 1239176–1239176 CrossRef PubMed.
- J. Twilton, C. Le, P. Zhang, M. H. Shaw, R. W. Evans and D. W. C. MacMillan, Nat. Rev. Chem., 2017, 1, 0052 CrossRef CAS.
- J. He, Z.-Q. Bai, P.-F. Yuan, L.-Z. Wu and Q. Liu, ACS Catal., 2021, 11, 446–455 CrossRef CAS.
- M. Mauro, A. Aliprandi, D. Septiadi, N. S. Kehr and L. De Cola, Chem. Soc. Rev., 2014, 43, 4144–4166 RSC.
- V. W.-W. Yam and A. S.-Y. Law, Coord. Chem. Rev., 2020, 414, 213298 CrossRef CAS.
- K. K.-W. Lo, Acc. Chem. Res., 2020, 53, 32–44 CrossRef CAS PubMed.
- S.-W. Lai and C.-M. Che, in Transition Metal and Rare Earth Compounds, Springer Berlin Heidelberg, Berlin, Heidelberg, 2004, vol. 241, pp. 27–63 Search PubMed.
- H. Yersin, A. F. Rausch, R. Czerwieniec, T. Hofbeck and T. Fischer, Coord. Chem. Rev., 2011, 255, 2622–2652 CrossRef CAS.
- P.-T. Chou, Y. Chi, M.-W. Chung and C.-C. Lin, Coord. Chem. Rev., 2011, 255, 2653–2665 CrossRef CAS.
- L. Xiao, Z. Chen, B. Qu, J. Luo, S. Kong, Q. Gong and J. Kido, Adv. Mater., 2011, 23, 926–952 CrossRef CAS PubMed.
- M. A. Baldo, D. F. O'Brien, Y. You, A. Shoustikov, S. Sibley, M. E. Thompson and S. R. Forrest, Nature, 1998, 395, 151–154 CrossRef CAS.
- M. A. Baldo, S. Lamansky, P. E. Burrows, M. E. Thompson and S. R. Forrest, Appl. Phys. Lett., 1999, 75, 4–6 CrossRef CAS.
- C. Adachi, M. A. Baldo, S. R. Forrest and M. E. Thompson, Appl. Phys. Lett., 2000, 77, 904–906 CrossRef CAS.
- M. Ikai, S. Tokito, Y. Sakamoto, T. Suzuki and Y. Taga, Appl. Phys. Lett., 2001, 79, 156–158 CrossRef CAS.
- H. Sasabe and J. Kido, Eur. J. Org. Chem., 2013, 7653–7663 CrossRef CAS.
- B. Minaev, G. Baryshnikov and H. Agren, Phys. Chem. Chem. Phys., 2014, 16, 1719–1758 RSC.
- P. Rajakannu, H. S. Kim, W. Lee, A. Kumar, M. H. Lee and S. Yoo, Inorg. Chem., 2020, 59, 12461–12470 CrossRef CAS PubMed.
- C. Cebrián and M. Mauro, Beilstein J. Org. Chem., 2018, 14, 1459–1481 CrossRef PubMed.
- M. Z. Shafikov, P. Pander, A. V. Zaytsev, R. Daniels, R. Martinscroft, F. B. Dias, J. A. G. Williams and V. N. Kozhevnikov, J. Mater. Chem. C, 2021, 9, 127–135 RSC.
- H. Shahroosvand, L. Najafi, A. Sousaraei, E. Mohajerani and M. Janghouri, J. Mater. Chem. C, 2013, 1, 6970 RSC.
- J.-L. Liao, Y. Chi, Y.-D. Su, H.-X. Huang, C.-H. Chang, S.-H. Liu, G.-H. Lee and P.-T. Chou, J. Mater. Chem. C, 2014, 2, 6269 RSC.
- M.-C. Tang, M.-Y. Chan and V. W.-W. Yam, Chem. Rev., 2021, 121, 7249–7279 CrossRef CAS PubMed.
- W.-Y. Wong and C.-L. Ho, Coord. Chem. Rev., 2009, 253, 1709–1758 CrossRef CAS.
- X. Yang, G. Zhou and W.-Y. Wong, Chem. Soc. Rev., 2015, 44, 8484–8575 RSC.
- L. Bischoff, C. Baudequin, C. Hoarau and E. P. Urriolabeitia, in Advances in Organometallic Chemistry, Elsevier, 2018, vol. 69, pp. 73–134 Search PubMed.
- E. Kabir, Y. Wu, S. Sittel, B.-L. Nguyen and T. S. Teets, Inorg. Chem. Front., 2020, 7, 1362–1373 RSC.
- Y. Chi and P.-T. Chou, Chem. Soc. Rev., 2010, 39, 638–655 RSC.
- S. Huo, J. Carroll and D. A. K. Vezzu, Asian J. Org. Chem., 2015, 4, 1210–1245 CrossRef CAS.
- P. Pander, G. Turnbull, A. V. Zaytsev, F. B. Dias and V. N. Kozhevnikov, Dyes Pigm., 2021, 184, 108857 CrossRef CAS.
- M. Hruzd, S. Gauthier, J. Boixel, S. Kahlal, N. le Poul, J.-Y. Saillard, S. Achelle and F. Robin-le Guen, Dyes Pigm., 2021, 109622 CrossRef CAS.
- Y. Unger, D. Meyer, O. Molt, C. Schildknecht, I. Münster, G. Wagenblast and T. Strassner, Angew. Chem., Int. Ed., 2010, 49, 10214–10216 CrossRef CAS PubMed.
- T. Fleetham, Z. Wang and J. Li, Org. Electron., 2012, 13, 1430–1435 CrossRef CAS.
- D. A. K. Vezzu, J. C. Deaton, J. S. Jones, L. Bartolotti, C. F. Harris, A. P. Marchetti, M. Kondakova, R. D. Pike and S. Huo, Inorg. Chem., 2010, 49, 5107–5119 CrossRef CAS PubMed.
- S. C. F. Kui, P. K. Chow, G. S. M. Tong, S.-L. Lai, G. Cheng, C.-C. Kwok, K.-H. Low, M. Y. Ko and C.-M. Che, Chem. – Eur. J., 2013, 19, 69–73 CrossRef CAS PubMed.
- E. Turner, N. Bakken and J. Li, Inorg. Chem., 2013, 52, 7344–7351 CrossRef CAS PubMed.
- J. Kalinowski, V. Fattori, M. Cocchi and J. A. G. Williams, Coord. Chem. Rev., 2011, 255, 2401–2425 CrossRef CAS.
- G.-J. Zhou, Q. Wang, W.-Y. Wong, D. Ma, L. Wang and Z. Lin, J. Mater. Chem., 2009, 19, 1872 RSC.
- M. Tanaka and H. Mori, J. Phys. Chem. C, 2014, 118, 12443–12449 CrossRef CAS.
- H. Tsujimoto, S. Yagi, Y. Honda, H. Terao, T. Maeda, H. Nakazumi and Y. Sakurai, J. Lumin., 2010, 130, 217–221 CrossRef CAS.
- M. Hissler, J. E. McGarrah, W. B. Connick, D. K. Geiger, S. D. Cummings and R. Eisenberg, Coord. Chem. Rev., 2000, 208, 115–137 CrossRef CAS.
- S. C. F. Kui, F.-F. Hung, S.-L. Lai, M.-Y. Yuen, C.-C. Kwok, K.-H. Low, S. S.-Y. Chui and C.-M. Che, Chem. – Eur. J., 2012, 18, 96–109 CrossRef CAS PubMed.
- W. Zhang, J. Wang, Y. Xu, W. Li and W. Shen, J. Organomet. Chem., 2017, 836–837, 26–33 CrossRef CAS.
- S.-W. Lai, M. C.-W. Chan, T.-C. Cheung, S.-M. Peng and C.-M. Che, Inorg. Chem., 1999, 38, 4046–4055 CrossRef CAS.
- K. Wong and V. Yam, Coord. Chem. Rev., 2007, 251, 2477–2488 CrossRef CAS.
- K. M.-C. Wong and V. W.-W. Yam, Acc. Chem. Res., 2011, 44, 424–434 CrossRef CAS PubMed.
- V. W.-W. Yam, V. K.-M. Au and S. Y.-L. Leung, Chem. Rev., 2015, 115, 7589–7728 CrossRef CAS PubMed.
- C.-H. Tseng, M. A. Fox, J.-L. Liao, C.-H. Ku, Z.-T. Sie, C.-H. Chang, J.-Y. Wang, Z.-N. Chen, G.-H. Lee and Y. Chi, J. Mater. Chem. C, 2017, 5, 1420–1435 RSC.
- X. Li, J. Hu, Y. Wu, R. Li, D. Xiao, W. Zeng, D. Zhang, Y. Xiang and W. Jin, Dyes Pigm., 2017, 141, 188–194 CrossRef CAS.
- E. Rossi, A. Colombo, C. Dragonetti, D. Roberto, R. Ugo, A. Valore, L. Falciola, P. Brulatti, M. Cocchi and J. A. G. Williams, J. Mater. Chem., 2012, 22, 10650 RSC.
- W. Lu, B.-X. Mi, M. C. W. Chan, Z. Hui, C.-M. Che, N. Zhu and S.-T. Lee, J. Am. Chem. Soc., 2004, 126, 4958–4971 CrossRef CAS PubMed.
- W. Wu, D. Huang, X. Yi and J. Zhao, Dyes Pigm., 2013, 96, 220–231 CrossRef CAS.
- W. Zhang, Y. Luo, Y. Xu, L. Tian, M. Li, R. He and W. Shen, Dalton Trans., 2015, 44, 18130–18137 RSC.
- E. S.-H. Lam, D. P.-K. Tsang, W. H. Lam, A. Y.-Y. Tam, M.-Y. Chan, W.-T. Wong and V. W.-W. Yam, Chem. – Eur. J., 2013, 19, 6385–6397 CrossRef CAS PubMed.
- Z. Wang, E. Turner, V. Mahoney, S. Madakuni, T. Groy and J. Li, Inorg. Chem., 2010, 49, 11276–11286 CrossRef CAS PubMed.
- E. Rossi, A. Colombo, C. Dragonetti, S. Righetto, D. Roberto, R. Ugo, A. Valore, J. A. G. Williams, M. G. Lobello, F. De Angelis, S. Fantacci, I. Ledoux-Rak, A. Singh and J. Zyss, Chem. – Eur. J., 2013, 19, 9875–9883 CrossRef CAS PubMed.
- C. F. Harris, D. A. K. Vezzu, L. Bartolotti, P. D. Boyle and S. Huo, Inorg. Chem., 2013, 52, 11711–11722 CrossRef CAS PubMed.
- J. Schneider, P. Du, P. Jarosz, T. Lazarides, X. Wang, W. W. Brennessel and R. Eisenberg, Inorg. Chem., 2009, 48, 4306–4316 CrossRef CAS PubMed.
- M. Taniguchi and J. S. Lindsey, Photochem. Photobiol., 2018, 94, 290–327 CrossRef CAS PubMed.
- M. Fecková, S. Kahlal, T. Roisnel, J.-Y. Saillard, J. Boixel, M. Hruzd, P. le Poul, S. Gauthier, F. Robin le Guen, F. Bureš and S. Achelle, Eur. J. Inorg. Chem., 2021, 2021, 1592–1600 CrossRef.
- K. Li, G. S. Ming Tong, Q. Wan, G. Cheng, W.-Y. Tong, W.-H. Ang, W.-L. Kwong and C.-M. Che, Chem. Sci., 2016, 7, 1653–1673 RSC.
- S. J. Farley, D. L. Rochester, A. L. Thompson, J. A. K. Howard and J. A. G. Williams, Inorg. Chem., 2005, 44, 9690–9703 CrossRef CAS PubMed.
- G. S.-M. Tong and C.-M. Che, Chem. – Eur. J., 2009, 15, 7225–7237 CrossRef CAS PubMed.
- Y. Chen, K. Li, W. Lu, S.-Y. Chui, C.-W. Ma and C.-M. Che, Angew. Chem., Int. Ed., 2009, 48, 9909–9913 CrossRef CAS PubMed.
- W. Shen, W. Zhang and C. Zhu, Phys. Chem. Chem. Phys., 2017, 19, 23532–23540 RSC.
- R. J. Ortiz, J. D. Braun, J. A. G. Williams and D. E. Herbert, Inorg. Chem., 2021, 60, 16881–16894 CrossRef CAS PubMed.
- M. Xie and W. Lu, Dalton Trans., 2019, 48, 1275–1283 RSC.
- A. M. Mfuh, V. T. Nguyen, B. Chhetri, J. E. Burch, J. D. Doyle, V. N. Nesterov, H. D. Arman and O. V. Larionov, J. Am. Chem. Soc., 2016, 138, 8408–8411 CrossRef CAS PubMed.
- J. Tasseroul, M. M. Lorenzo-Garcia, J. Dosso, F. Simon, S. Velari, A. De Vita, P. Tecilla and D. Bonifazi, J. Org. Chem., 2020, 85, 3454–3464 CrossRef CAS PubMed.
- G. M. Sheldrick, SHELXT - Integrated Space-group and Crystal-structure Determination, Acta Crystallogr., Sect. A: Found. Adv., 2015, 71, 3–8 CrossRef PubMed.
- G. M. Sheldrick, Crystal Structure Refinement with SHELXL, Acta Crystallogr., Sect. C: Struct. Chem., 2015, 71, 3–8 Search PubMed.
- M. J. Frisch, G. W. Trucks, H. B. Schlegel, G. E. Scuseria, M. A. Robb, J. R. Cheeseman, G. Scalmani, V. Barone, G. A. Petersson, H. Nakatsuji, X. Li, M. Caricato, A. V. Marenich, J. Bloino, B. G. Janesko, R. Gomperts, B. Mennucci, H. P. Hratchian, J. V. Ortiz, A. F. Izmaylov, J. L. Sonnenberg, D. Williams-Young, F. Ding, F. Lipparini, F. Egidi, J. Goings, B. Peng, A. Petrone, T. Henderson, D. Ranasinghe, V. G. Zakrzewski, J. Gao, N. Rega, G. Zheng, W. Liang, M. Hada, M. Ehara, K. Toyota, R. Fukuda, J. Hasegawa, M. Ishida, T. Nakajima, Y. Honda, O. Kitao, H. Nakai, T. Vreven, K. Throssell, J. A. Montgomery, Jr., J. E. Peralta, F. Ogliaro, M. J. Bearpark, J. J. Heyd, E. N. Brothers, K. N. Kudin, V. N. Staroverov, T. A. Keith, R. Kobayashi, J. Normand, K. Raghavachari, A. P. Rendell, J. C. Burant, S. S. Iyengar, J. Tomasi, M. Cossi, J. M. Millam, M. Klene, C. Adamo, R. Cammi, J. W. Ochterski, R. L. Martin, K. Morokuma, O. Farkas, J. B. Foresman and D. J. Fox, Gaussian 16, Revision B.01, Gaussian, Inc., Wallingford CT, 2016 Search PubMed.
- J. P. Perdew, K. Burke and M. Ernzerhof, Phys. Rev. Lett., 1996, 77, 3865–3868 CrossRef CAS PubMed.
- J. P. Perdew, K. Burke and M. Ernzerhof, Phys. Rev. Lett., 1997, 78, 1396–1396 CrossRef CAS.
- C. Adamo and V. Barone, J. Chem. Phys., 1999, 110, 6158–6170 CrossRef CAS.
- A. Schäfer, H. Horn and R. Ahlrichs, J. Chem. Phys., 1992, 97, 2571–2577 CrossRef.
- A. Schäfer, C. Huber and R. Ahlrichs, J. Chem. Phys., 1994, 100, 5829–5835 CrossRef.
- J. Tomasi, R. Cammi, B. Mennucci, C. Cappelli and S. Corni, Phys. Chem. Chem. Phys., 2002, 4, 5697–5712 RSC.
- J. Tomasi, B. Mennucci and R. Cammi, Chem. Rev., 2005, 105, 2999–3093 CrossRef CAS PubMed.
- S. Gauthier, A. Porter, S. Achelle, T. Roisnel, V. Dorcet, A. Barsella, N. Le Poul, P. Guevara Level, D. Jacquemin and F. Robin-Le Guen, Organometallics, 2018, 37, 2232–2244 CrossRef CAS.
- E. D. Glendening, J. K. Badenhoop, A. E. Reed, J. E. Carpenter, J. A. Bohmann, C. M. Morales, C. R. Landis and F. Weinhold, NBO 6.0, Theoretical Chemistry Institute, University of Wisconsin, Madison, WI, 2013, http://nbo6.chem.wisc.edu Search PubMed.
- S. I. Gorelsky, SWizard program, http://www.sg-chem.net/, University of Ottawa, Ottawa, Canada, 2013 Search PubMed.
- S. I. Gorelsky and A. B. P. Lever, J. Organomet. Chem., 2001, 635, 187–196 CrossRef CAS.
- M. Cossi, V. Barone, R. Cammi and J. Tomasi, Chem. Phys. Lett., 1996, 255, 327–335 CrossRef CAS.
- V. Barone, M. Cossi and J. Tomasi, J. Chem. Phys., 1997, 107, 3210–3221 CrossRef CAS.
- F. Santoro, R. Improta, A. Lami, J. Bloino and V. Barone, J. Chem. Phys., 2007, 126, 084509 CrossRef PubMed.
- F. Santoro, A. Lami, R. Improta and V. Barone, J. Chem. Phys., 2007, 126, 184102 CrossRef PubMed.
- F. Santoro, A. Lami, R. Improta, J. Bloino and V. Barone, J. Chem. Phys., 2008, 128, 224311 CrossRef PubMed.
- D. Licari, A. Baiardi, M. Biczysko, F. Egidi, C. Latouche and V. Barone, J. Comput. Chem., 2015, 36, 321–334 CrossRef CAS PubMed.
- T. Le Bahers, C. Adamo and I. Ciofini, J. Chem. Theory Comput., 2011, 7, 2498–2506 CrossRef CAS PubMed.
- I. Ciofini, T. Le Bahers, C. Adamo, F. Odobel and D. Jacquemin, J. Phys. Chem. C, 2012, 116, 11946–11955 CrossRef CAS.
- D. Jacquemin, T. L. Bahers, C. Adamo and I. Ciofini, Phys. Chem. Chem. Phys., 2012, 14, 5383 RSC.
Footnote |
| † Electronic supplementary information (ESI) available. CCDC 2126978 and 2126979. For ESI and crystallographic data in CIF or other electronic format see DOI: 10.1039/d1dt04237h |
| This journal is © The Royal Society of Chemistry 2022 |