 Open Access Article
Creative Commons Attribution 3.0 Unported Licence
Molecular set transformer: attending to the co-crystals in the Cambridge structural database†
Aikaterini
Vriza
 ab,
Ioana
Sovago
c,
Daniel
Widdowson
bd,
Vitaliy
Kurlin
bd,
Peter A.
Wood
 c and
Matthew S.
Dyer
 *ab
*ab
aDepartment of Chemistry and Materials Innovation Factory, University of Liverpool, 51 Oxford Street, Liverpool L7 3NY, UK. E-mail: M.S.Dyer@liverpool.ac.uk
bLeverhulme Research Centre for Functional Materials Design, University of Liverpool, Oxford Street, Liverpool L7 3NY, UK
cCambridge Crystallographic Data Centre, 12 Union Road, Cambridge CB2 1EZ, UK
dMaterials Innovation Factory and Computer Science Department, University of Liverpool, Liverpool, L69 3BX UK
First published on 29th September 2022
Abstract
In this paper we introduce molecular set transformer, a Pytorch-based deep learning architecture designed for solving the molecular pair scoring task whilst tackling the class imbalance problem observed on datasets extracted from databases reporting only successful synthetic attempts. Our models are being trained on all the existing molecular pairs that form co-crystals and are deposited in the Cambridge Structural Database (CSD). Given any new molecular combination, the primary objective of the tool is to be able to select the most effective way to represent the pair and then assign a score coupled with an uncertainty estimation. Molecular set transformer is an attention-based framework which learns the important interactions in the various molecular combinations by trying to reconstruct its input by minimizing its bidirectional loss. Several methods to represent the input were tested, both fixed and learnt, with the Graph Neural Network (GNN) and the Extended-Connectivity Fingerprints (ECFP4) molecular representations to perform best showing an overall accuracy higher than 75% on previously unseen data. The trustworthiness of the models is enhanced by adding uncertainty estimates which aims to help chemists prioritize at the early materials design stage both the pairs with high scores and low uncertainty and pairs with low scores and high uncertainty. Our results indicate that the method can achieve comparable or better performance on specific APIs for which the accuracy of other computational chemistry and machine learning tools is reported in the literature. To help visualize and get further insights of all the co-crystals deposited in CSD, we developed an interactive browser-based explorer (https://csd-cocrystals.herokuapp.com/). An online Graphical User Interface (GUI) has also been designed for enabling the wider use of our models for rapid in silico co-crystal screening reporting the scores and uncertainty of any user given molecular pair (https://share.streamlit.io/katerinavr/streamlit/app.py).
1 Introduction
The tendency of various molecules to form multi-component crystal structures has been linked to the observation of several new properties in organic materials. Understanding the molecular basis of co-crystallization and predicting whether two molecules will form a co-crystal or not can have a significant impact in the design of functional materials and especially in the drug discovery process. As a concept it is very similar to the drug pairing scoring,1 although in our case instead of drug–drug interactions we are interested in the formation of co-crystals. Although the crystal structure of a material is what determines its properties and is the most trustworthy indicator that a co-crystal can indeed exist, crystal structure prediction is time consuming and thus prohibitive for quick co-former screening. Data-driven approaches have shown great promise for developing time efficient tools that can learn the patterns from the existing data and perform predictions with a high success rate. However, they still suffer from many limitations in terms of defining the appropriate representations of the target materials and achieving reliable predictions based solely on known instances or otherwise biased datasets.The aim of this work is to develop predictive models for co-crystal formation that can generalize to all types of currently known co-crystals, ranging from pharmaceutical to electronic co-crystals. For that reason, the workflow proposed in our previous work,2i.e., training using only the ‘positive data’, will be adjusted and scaled-up to cover all the existing co-crystals in the Cambridge structural database (∼7500 molecular combinations). Key improvements of this framework include the consideration of various molecular representation techniques, hyperparameter tuning, uncertainty estimation and extensive benchmarking. Feature representation has a major impact on the effectiveness of Machine Learning (ML) models especially on imbalanced datasets. In this context, if both the positive and negative or unknown classes with high amount of disproportionality are well-represented with non-overlapping distributions, good classification rates can be obtained by the ML classifiers.
Molecular set transformer, which is an attention based autoencoder designed for sets, is the key building block of our classifier. The training of our model was performed in a way such that the reconstruction error is minimized and also an uncertainty aware component was added. The uncertainty estimates of each prediction can mitigate the effect of out-of-distribution examples and provide a degree of confidence with which the classifier ranks every new datapoint. The final models were tested in real case scenarios using several independent external co-crystal screening datasets collected from literature. To showcase the applicability of the methodology, the best performing model was used for ranking a molecular pairs dataset extracted from ZINC20 database, considering the drug delivery and solubility of the co-formers.
1.1 Trends in co-crystal research
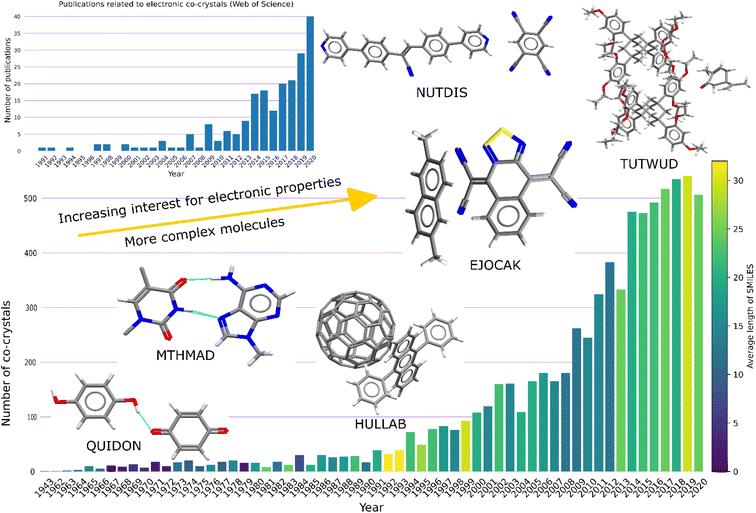
Co-crystals are crystalline materials composed of two or more different uncharged molecular compounds in a particular stoichiometry. Over the past years significant attention has been received both from academia and industry due to their possible applications in the pharmaceutical and electronic materials industries. This can be verified by the exponential increase in deposited co-crystals in the Cambridge structural database over the recent years (Fig. 1). Looking at the timeline, it can be observed that the first co-crystals were composed of smaller molecules, as indicated by the average length of their SMILES (Simplified Molecular Input Line Entry System). The highest complexity among the molecular pairs is observed around the early 90's with the discovery of the fullerene (C60) co-crystals.3 Moreover, an increasing interest in co-crystals with electronic properties is also observed, based on statistics extracted from Web of Science4 using as key words ‘co-crystal’ and ‘electronic’.In pharmaceutical co-crystals at least one of the components is an Active Pharmaceutical Ingredient (API), whereas the co-crystals of electronic interest are mainly composed from polyaromatic hydrocarbons (PAHs) which are π-electron rich molecules. For pharmaceutical applications, co-crystallization is an important technique for improving the physicochemical properties of the API without interfering with the chemical behaviour. For example, many pharmaceutical compounds do not make it to the commercial market due to their low solubility. The incorporation of a co-former into the API can result in significantly higher solubility levels in comparison to any crystal form of the API itself. In electronic co-crystals, the existence of two or more different molecules, which can play the roles of a donor and an acceptor, generates charge transfer complexes with potential electronic applications, e.g., near-infrared photothermal materials.
The constituent molecules are arranged in appropriate crystal packing such that the electronic transport can be achieved between the highest occupied molecular orbital (HOMO) of the donor and the lowest unoccupied molecular orbital (LUMO) of the acceptor.5 The first example of such a co-crystals was the TTF-TCNQ complex.6
1.2 Interactions between molecular pairs
Co-crystallization relies purely on intermolecular interactions, and it therefore opens a new range of potential combinations of building blocks to be investigated. If the two building blocks contain only one binding site each and if there is only one way in which those two moieties can be connected a heteromeric synthon can be formed. However, synthetic predictability deteriorates quickly when the number of potentially interacting moieties on each reactant is increased or in cases where one or both reactants lack strong directional moieties. The intermolecular interactions that are present in co-crystals are largely dominated by hydrogen bonds. Within the crystal structure the molecules with appropriate functionalities will arrange themselves in a packing arrangement in an attempt to maximize the number and strength of the hydrogen bonding interactions within the solid-state crystal.7 Alongside H-bonding, other interactions appear to play a significant role in the formation of stable structures, i.e., halogen bonding and π–π stacking (Table S1†).Halogen bonds are another type of non-covalent bonding which is typically formed between iodine- or bromine atoms (the halogen-bond donor) and an appropriate halogen-bond acceptor (electron-pair donor) such as an N-heterocycle.8 Hydrogen and halogen bonds display important strength and directionality and thus offer a good starting point for supramolecular strategies that simultaneously encompass two different non-covalent interactions.
The π–π interactions play a key role in the electronic structure of the materials and refer to the attractive interactions between adjacent π systems such as aromatic rings. Aromatic rings of neighbouring molecules can arrange themselves in a variety of different orientations, each of which can allow for π–π stacking interactions to form.9 Despite the importance of the π–π interactions, they are still quite underrepresented among the co-crystal forming molecular pairs as they are relatively weak in comparison to hydrogen or halogen bonding.
1.3 Data-driven approaches for in silico co-crystal screening
Following the trend of increasing interest in co-crystal synthesis, data-driven methods aimed towards reducing the time needed to screen co-crystals are being actively developed. The first such data-driven method was proposed back in 2009 by Fabian, who first analysed the co-crystals in the Cambridge structural database and extracted important statistics that drive co-crystallization.10 Since then, several other data-driven workflows have been developed, either focusing on a co-crystal subset2,11–13 or on the whole co-crystal dataset.14,15 The common ground in the aforementioned approaches is that they all use a negative dataset and focus on training binary classifiers. Labels in chemistry can be expensive (more experiments), unsustainable (solvents) or in some cases unreliable (different experimentalist and/or different conditions might enable the synthesis of a materials that was previously labelled as negative). For that reason, this work is focused only on the information we have at hand and try to make better use of it. Previously, we used a focussed co-crystal dataset, referring to π–π interconnected polyaromatic hydrocarbons (PAHs) co-crystals. We implemented and compared several one class classification approaches and designed a neural network for one class classification which outperformed the standard anomaly detection algorithms. Indeed, we managed to synthesize two new co-crystals based on the Pareto optimal co-formers which had the highest similarity to TCNQ, well known for its application in electronically active co-crystals. During this study we noted that the absence of negative data limited the evaluation of the performance of our algorithms to the true positive rate (TPR) alone. In this study we present a dataset of positive and negative co-crystallisation data to enable more robust evaluation of our algorithms.2 Methods
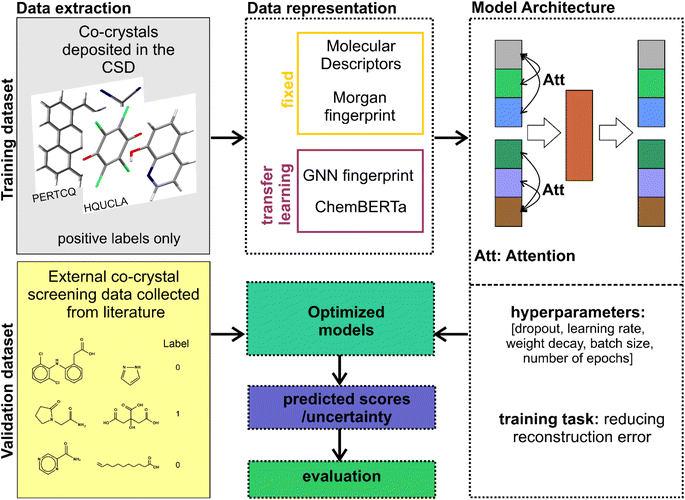
Our workflow (Fig. 2) is the following: (i) we created the co-crystals dataset by screening the CSD for crystal structures composed of two different organic molecules following the process described below. (ii) We tested four different representations for the molecular pairs (both fixed and learnt) to be given as an input to the machine learning model. (iii) For each different representation we trained our model after modifying its loss function to a bidirectional loss. The hyperparameters of the network were tuned such that the reconstruction loss was minimized. (iv) The trained models were then used for scoring and evaluating a benchmark database created from experimental co-crystal screening data collected from publicly available resources.2.1 Creating the datasets
(i) The structures should be only organic, not polymeric, not ionic and should not contain metals.
(ii) The structures should have 3D coordinates and no disorder so that they can be modelled as periodic sets of points, defined by a motif of points that repeats according to a basis.
(iii) Duplicates, i.e., crystals with the same unit molecules, are ruled out based on the CSD identifier by dropping out structures that have the first 6 letters the same.
(iv) The structures should have exactly two distinct molecules independent of the stoichiometry, i.e., the CSD entry CSATBR with SMILES string: OC(![[double bond, length as m-dash]](https://www.rsc.org/images/entities/char_e001.gif) O)c1cc(Cl)ccc1O·OC(
O)c1cc(Cl)ccc1O·OC(![[double bond, length as m-dash]](https://www.rsc.org/images/entities/char_e001.gif) O)c1cc(Cl)ccc1O·CN1C
O)c1cc(Cl)ccc1O·CN1C![[double bond, length as m-dash]](https://www.rsc.org/images/entities/char_e001.gif) NC2
NC2![[double bond, length as m-dash]](https://www.rsc.org/images/entities/char_e001.gif) C1C(
C1C(![[double bond, length as m-dash]](https://www.rsc.org/images/entities/char_e001.gif) O)NC(
O)NC(![[double bond, length as m-dash]](https://www.rsc.org/images/entities/char_e001.gif) O)N2C, has three molecules in the asymmetric unit, however there are only two different co-formers with 2
O)N2C, has three molecules in the asymmetric unit, however there are only two different co-formers with 2![[thin space (1/6-em)]](https://www.rsc.org/images/entities/char_2009.gif) :
:![[thin space (1/6-em)]](https://www.rsc.org/images/entities/char_2009.gif) 1 stoichiometry. Given the CSD refcode identifier, the SMILES string representation is extracted and split into the subsequent strings (one SMILES string for each molecule in the structure). A structure proceeds only if after removing the duplicate strings in each structure, only two different strings remain. In that way we incorporate within the co-crystals dataset only structures that belong to different molecular stoichiometries.
1 stoichiometry. Given the CSD refcode identifier, the SMILES string representation is extracted and split into the subsequent strings (one SMILES string for each molecule in the structure). A structure proceeds only if after removing the duplicate strings in each structure, only two different strings remain. In that way we incorporate within the co-crystals dataset only structures that belong to different molecular stoichiometries.
(v) Neither of the two different molecules in the extracted structure should be a solvent or single atom, as listed in the appendix Table S2.†
This process resulted in a dataset of 7479 molecular pairs. The dataset was further reduced after removing the datapoints that exist in the validation set giving a training dataset of 7075 molecular pairs consisting of 4343 different single molecules.
| Dataset name | Dataset description | Year | Number or data | Ref. |
|---|---|---|---|---|
| 1. Artemisinin dataset | Artemisinin + co-formers | 2010 | 75 (73 negatives + 2 positives) | 18 |
| 2. MEPS dataset | 18 APIs against different co-formers | 2014 | 432 (300 negatives + 132 positives) | 19 |
| 3. H-bond synthons dataset | 20 APIs + 34 co-formers (always the same) | 2017 | 680 (408 negatives + 272 positives) | 11 |
| 4. Propyphenazone dataset | Propyphenazone + co-formers | 2017 | 89 (81 negatives + 8 positives) | 20 |
| 5. Phenolic acids dataset | Phenolic acids as co-formers | 2018 | 225 (58 negatives + 167 positives) | 13 |
| 6. Dicarboxylic acids dataset | Dicarboxylic acids as co-formers | 2019 | 710 (104 negatives + 606 positives) | 12 |
| 7. (des)loratadine dataset | Desloratadine & loratadine + co-formers | 2020 | 82 (17 negatives + 65 positives) | 21 |
| 8. Linezolid dataset | Linezolid + co-formers | 2021 | 19 (9 negatives and 10 positives) | 22 |
| 9. Pyrene dataset | Pyrene + co-formers with electronic similarity to TCNQ | 2021 | 6 (4 negatives + 2 positives) | 2 |
| 10. Praziquantel dataset | Praziquantel + co-formers | 2021 | 30 (18 negatives + 12 positives) | 23 |
| 11. MOP dataset | 2-Amino-4,6-dimethoxypyrimidine (MOP) + 63 co-formers | 2021 | 63 (22 negative + 41 positives) | 24 |
2.2 Data representation
In machine learning for chemistry applications, molecules are translated into a numerical vector of a fixed size, namely the molecular representation or molecular fingerprint. A molecular fingerprint can be either fixed or learned, depending on whether the algorithm will always return the same vector for a molecule (Morgan fingerprint, molecular descriptors) or will learn a task-specific, database dependant vector (neural fingerprint, message passing fingerprint).25,262.2.1.1 Molecular descriptors. The first case study was on the use of molecular descriptors extracted from a freely available library, namely Mordred.27 Mordred can calculate more than 1800 numerical representations of molecular properties and/or structural features using predefined algorithmic rules. The disadvantage of this approach is that the library is not further updated and as a result many packages start deprecating, which might result in NaN (Not a Number) values. In this work the NaN values have been replaced with 0 s.
2.2.1.2 Morgan fingerprint. Morgan Fingerprint (MF) or else extended connectivity fingerprint (ECFP) is generated by assigning unique identifiers, i.e., Morgan identifiers, to all the substructures within a defined radius around all heavy atoms in a molecule.28 These identifiers are afterwards hashed to a vector with a fixed length. In this work we used the MF of radius 2 with lengths 2048 and 4096 extracted from RDKit library.29
2.2.2.1 Using pre-trained graph neural networks with transfer learning. Graph neural networks (GNNs) have found many applications in chemistry data as molecules can be easily represented as graphs with the atoms being the nodes and the bonds being the edges. GNNs learn parametrized mappings from graph-structured objects to continuous feature vectors and have achieved state-of-the art performance in a wide variety of problems for property prediction or materials classification. In this work, we used a pre-trained GNN model released by Hu et al.31 to generate the representation of our molecules on the co-crystal pairs. The selected model was pretrained in a self-supervised way with attribute masking, according to which the node/edge attributes, i.e., atoms or bonds, of molecules in a large unlabelled dataset are masked and then the GNN tries to predict those attributes based on the neighbourhood structure. This learnt representation was further used as the input to molecular set-transformer, as an alternative fingerprint. More details about the GNN architecture are provided in the ESI on Section 1.4.1 and Fig. S5.†
2.2.2.2 Using natural language processing (NLP) based models and transfer learning. One NLP-based pretrained model, namely ChemBERTa32 was tested for encoding the molecular SMILES in a learned vector. The vital part for processing text-based chemical representations for deep learning models is the tokenization, i.e., how to break SMILES strings into a sequence of standard units, known as tokens. The tokens are supposed to contain the essential structural information that can reliably and consistently characterize the molecules. ChemBERTA is a RoBERTa-like transformer model that learns molecular fingerprints through semi-supervised pre-training of the sequence-to-sequence language model, using masked-language modelling of a large corpus of 10 million SMILES strings from PubChem. The raw SMILES were tokenized using a Byte-Pair Encoder (BPE) from the Hugging face tokenizers library. More details about the ChemBERTa architecture are provided in the ESI on Section 1.4.2.†
2.3 Molecular set transformer
Traditional ML approaches usually operate on fixed dimensional vectors or matrices. However, there are several problems that demand the input to be order invariant, i.e., a set. Deep learning tasks defined on sets usually require learning functions to be permutation invariant. To deal with this issue in our previous work,2 we designed an One Class Classifier by using DeepSVDD network and replacing the convolutional autoencoder with a Set Transformer adapted from the work of Lee et al.33 The main architectural differences to our previous workflow is that the feed forward neural network, i.e., DeepSVDD, was completely removed, and that the loss function of Set Transformer has been replaced by bidirectional reconstruction loss, such that the model will behave as an attention-based autoencoder.In its simplest form the autoencoder has two components: an encoder and a decoder. The encoder takes an input and transforms it into a latent representation which is usually a more compact representation than the original datapoint. On the other hand, the decoder is trying to reconstruct the original input from the latent dimension. Mathematically, for a given datapoint x, the encoder compresses the information to a vector z, and the decoder decompresses the data into a reconstructed sample ![[x with combining circumflex]](https://www.rsc.org/images/entities/i_char_0078_0302.gif) . To learn these transformations, neural networks are used as computational and optimizable building blocks for the encoder and decoder. The encoder and decoder are then optimized according to a loss, which is a low reconstruction error (‖x −
. To learn these transformations, neural networks are used as computational and optimizable building blocks for the encoder and decoder. The encoder and decoder are then optimized according to a loss, which is a low reconstruction error (‖x − ![[x with combining circumflex]](https://www.rsc.org/images/entities/i_char_0078_0302.gif) ‖).34 Molecular set transformer captures the input in a permutation invariant way. However, to ensure that the output is order invariant as well, a permutation invariant training technique was applied by integrating a bidirectional reconstruction loss function to the original model.35
‖).34 Molecular set transformer captures the input in a permutation invariant way. However, to ensure that the output is order invariant as well, a permutation invariant training technique was applied by integrating a bidirectional reconstruction loss function to the original model.35
The way the molecular set transformer extracts the features is key for capturing the complexity of the problem. Molecular set transformer ‘looks’ in all the features across a single molecule as well as in all the features of the pairing molecule. In that way the latent dimension holds information for the relation between the features for each molecular pair. Molecular set transformer uses a learnable pooling operation, instead of a fixed pooling operation such as mean, to combine the set input such that most of the information is preserved after compressing the data. The pooling operation is the dot-product attention with SoftMax (i.e., the self-attention mechanism). In this way, a richer representation of the input data is ensured, that captures higher-order interactions which are important for co-crystal design.
2.4 Hyperparameter tuning
As the performance of the neural network is highly dependent on the choice of the hyperparameters, i.e., algorithm network variables, the hyperparameters were tuned using Weights and Biases software.36 The model was trained on all ‘positive’ co-crystal data, excluding those molecular pairs that belong to the validation sets. The training was performed without labels and with a different set of parameters each time, having as the final goal to minimize the bidirectional reconstruction loss. After the identification of the optimal set of parameters for each model, the models were retrained using the selected hyperparameters and used for the evaluation on the external validation datasets.2.5 Evaluation metrics
The evaluation of the molecular set transformer inspired models is performed in the external datasets containing experimental results from co-crystal screening data (Table 2). The datasets are balanced between the two classes of co-crystal and not observing a co-crystal, with 1317 positives and 1094 negatives assigned as 1 and 0 respectively (Table 1). The evaluation metrics used are described below.| Model | AUC | Specificity | F1 |
|---|---|---|---|
| a 1023 dimensions. b 2048 dimensions. c 600 dimensions. d 354 dimensions. | |||
| Molecular set transformer + GNNc | 0.76 ± 0.001 | 0.69 ± 0.004 | 0.73 ± 0.005 |
| Molecular set transformer + ECFP4 (4096)b | 0.75 ± 0.005 | 0.71 ± 0.006 | 0.72 ± 0.005 |
| Molecular set transformer + Mordred descriptorsa | 0.74 ± 0.007 | 0.68 ± 0.005 | 0.7 ± 0.005 |
| Molecular set transformer + ECFP4 (2048)b | 0.73 ± 0.004 | 0.71 ± 0.005 | 0.71 ± 0.005 |
| Molecular set transformer + ChemBERTad | 0.66 ± 0.005 | 0.65 ± 0.005 | 0.63 ± 0.005 |
| Isolation forest44 + ECFP4 (2048)b | 0.65 | 0.58 | 0.64 |
| kNN45+ ECFP4 (2048)b | 0.62 | 0.56 | 0.61 |
The Area Under Curve (AUC) is defined as the probability that a classifier will rank a randomly chosen positive instance higher than a randomly chosen negative one. When a model scores all the positive data higher than the negatives the AUC score is 1. A random classifier has an AUC value of 0.5, whereas if the AUC values is less than 0.5 the performance is worse than random, i.e., the negative points are scored higher than the positives. AUC was used for evaluating the models as a metric that is independent from the selection of a certain division threshold to separate the positive from the negative samples and is only affected by the ranking of the samples. Other methods developed for co-crystal screening also report the AUC of their models in external validation data, as such this metric was suitable for comparison with other workflows.
The F1 score is defined as the harmonic mean of precision and recall, where TP stands for true positives, TN for true negatives, FP for false positives, and FN for false negatives predicted by the classifier:
Specificity or else True Negative Rate (TNR) is an indicator of how correctly the model is predicting the negative class:
2.6 Adding an uncertainty aware component
Machine learning techniques can be used as a powerful and cost-effective strategy to learn from existing datasets and perform predictions on new unseen data. The standard approach is to train the network to minimize a prediction loss. However, the resultant model remains ignorant to its prediction confidence. Herein, we demonstrate the use of Monte Carlo Dropout Ensembling as a Bayesian approximation technique to provide uncertainty estimates on the network's scores.Dropout is a well-established technique for training neural networks by stochastically setting the weight of each node in the network to zero with probability p at every training step. Dropout was initially introduced as a way to avoid overfitting; however, it has been applied is several other works as a strategy to approximate Bayesian inference.37–39
3 Results
3.1 Co-crystal space exploration
In order to get insights from the existing co-crystals in the CSD, we initially categorize them in terms of the type of bonding that connects the molecules in the crystal structure. The three main bonding types involve hydrogen bonding, halogen bonding and weak interactions (π–π stacking). A two-dimensional visualization including all the existing co-crystals in the CSD was created using a new crystal invariant, namely Pointwise Distance Distribution (PDD), previously introduced by Widdowson et al.40,41 PDD was used to represent the co-crystal structure derived from the Crystallographic Information File (CIF). The distance between all the existing co-crystals was measured using the Earth Mover's Distance (EMD) between the PDD invariants and the TMAP algorithm was used to draw the co-crystals tree map (Fig. 3). TMAP outputs a Minimum Spanning Tree of the crystal dataset by joining all crystal structures into a connected tree without cycles by minimizing the total length, where each edge is measured by EMD between PDD invariants. Hence any crystal is always connected to its nearest neighbour.42 More details regarding the PDD invariant can be found in the ESI on Section 1.2 and Fig. S2–S4.† As shown in Fig. 3, the structures are being color-coded based on the interactions group they belong to. It can be seen that the co-crystal space is dominated by molecules connected via hydrogen-bonds.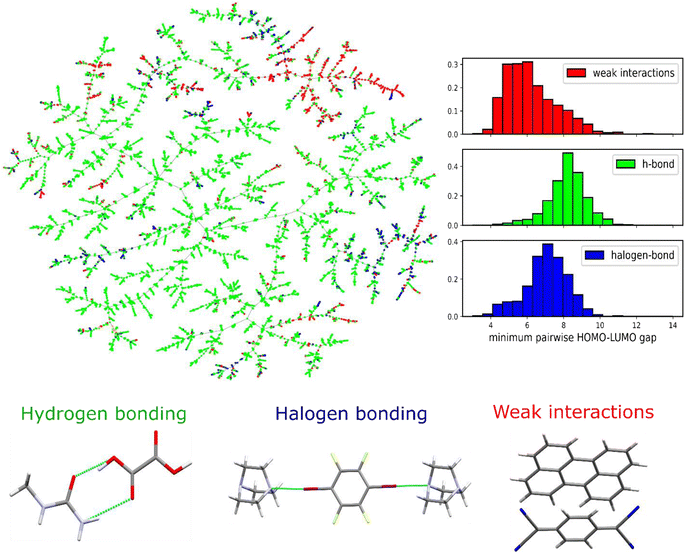 | ||
| Fig. 3 TMAP of the co-crystal space based on the Pointwise Distance Distribution (PDD) of the crystal structures.41 The co-crystals are color coded based on the main interactions in between the two different molecules. Hydrogen bonding is the dominating interaction, whereas the interesting electronic properties arise in the area of the weak interactions where the pairwise HOMO–LUMO difference enables charge transfer interactions. | ||
For getting a further insight regarding the electronic characteristics of the molecular pairs that form the co-crystals, the HOMO–LUMO gap between the two molecules was calculated using PM6 semiempirical method.43 The calculation was performed by taking the minimum HOMO–LUMO difference between the two isolated co-formers as min(LUMOmol2–HOMOmol1, LUMOmol1–HOMOmol2). Apparently, the HOMO–LUMO gap is smaller for the weakly bounded molecular pairs, as the majority of the co-crystals is this area form charge transfer complexes showing semi-conducting properties. Furthermore, it was also observed that the HOMO–LUMO gap of the weakly bound molecular pairs is lower than that of the single molecule semiconductors, as shown in the ESI Fig. S1.† It is postulated that co-crystallization might be a powerful technique for designing organic electronic materials with a smaller bandgap of their constituent single-component structures.
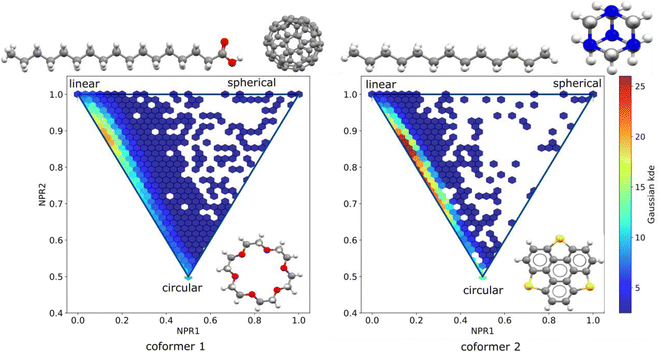
Further on, the shape of the individual molecules that form the co-crystal pairs is also investigated. Molecular pairs are sorted such that the first co-former has larger molecular weight than the second co-former. In the PMI plots presented in Fig. 4 we visualize the shape distribution of the two sets of co-formers.
It can be seen that the molecules used the first co-former (known as API for the pharmaceutical co-crystals) cover a wider area on the plot indicating that the molecules are more shape-diverse than those used as second co-formers (or known as excipients for the pharmaceutical co-crystals case). The frequency of the molecules appearing as first and second co-formers was counted, with the top ten molecules of each category are being visualized in Fig. 5.
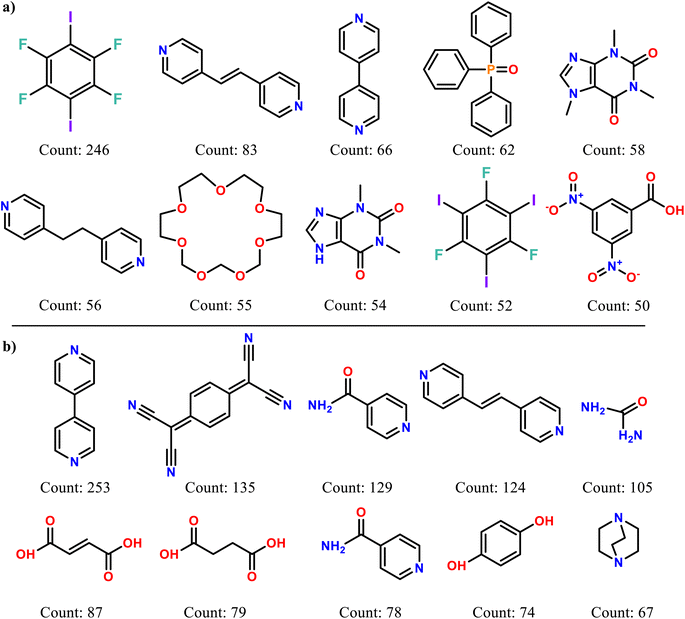 | ||
| Fig. 5 The ten most popular molecules appear as (a) the first co-former and (b) the second co-former and their frequency of appearance on the CSD co-crystals dataset. | ||
3.2 Model comparison
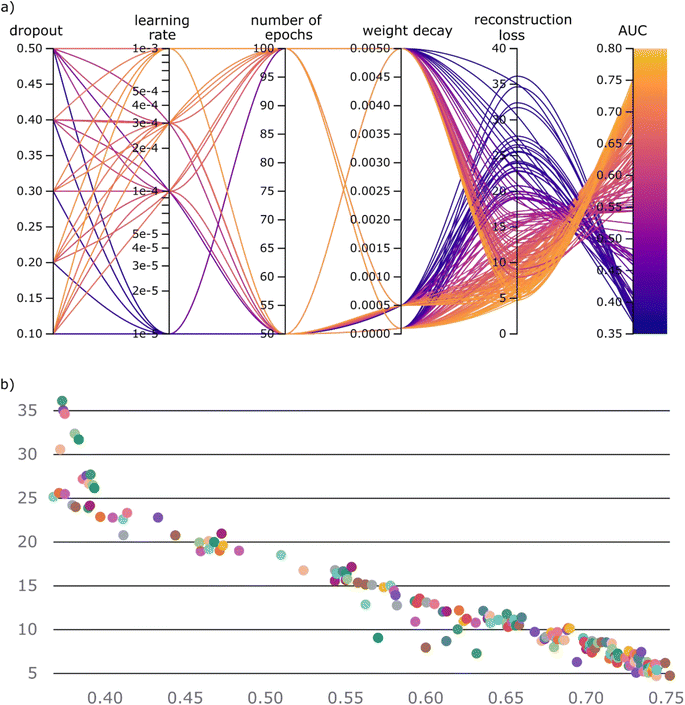
As we have established the one-class approach, based on set-transformer, for dealing with the co-crystallization problem, what remains is to identify the most effective representation of our molecules. Herein, we compare four different representation strategies that make use of the 2D molecular structure. Based on each molecular pair's representation method, we developed four different workflows. In addition, two traditional one class classification algorithms, i.e., kNN and Iforest with the Morgan fingerprint as the molecular representation, were trained and tested on the same data as the molecular set transformer (Table 2).The four different models based on the diverse representation techniques were trained on the ‘positive’ co-crystal data. A dataset collection containing 11 different experimental co-crystal screening datasets was used for the validation and comparison of the models. It should be highlighted that for fair comparisons all the overlapping molecular pairs between the training and the validation datasets were removed from the training set, such that the models haven't previously ‘seen’ any of the molecular pairs they are validated on. As there are no labels on the training data, the training task of all the models is to minimize the reconstruction loss of the autoencoder, which is the building block of the molecular set transformer. We explored the relation between the network parameters and the final accuracy on the external data by performing grid search on the learning rate, the batch size, the weight decay, the number of epochs and the dropout rate. The range of the hyperparameters is presented in the ESI Table S3.† All the hyperparameter contributions for the GNN-based model are plotted on the parallel coordinates plot as shown in Fig. 6a. The parallel coordinate plots for the tested models can be found in the ESI, Fig. S6–S8.† The range of the hyperparameters, the reconstruction loss of the network and the total validation accuracy on the ‘unseen’ from the network data, i.e., test data, are shown in the parallel axes.
The parallel co-ordinate plots of the other three models are summarized in the ESI, Fig. S3–S5.† A visual inspection of the relations among the parallel coordinates reveals that there is a strong correlation between the reconstruction loss and the validation accuracy (Fig. 6b).
After the selection of the best performing hyperparameters, the models were retrained, and their performance on the unseen data is reported in Table 2. The performance measures include the Area Under the Curve (AUC), sensitivity and F1-score.
The validation dataset is balanced so the standard metrics can be used to evaluate the performance of the different models. Finding an accuracy of 75% is a significant result considering the fact that the validation data are not extremely reliable especially concerning the negative cases. The experimental validation of the reported successful or unsuccessful co-crystals was not always performed with a detailed crystal structure determination process, but with IR or PXRDs observations. There are several cases that a molecular pair was reported as unable to form a crystal structure and afterwards trying different conditions from a different researcher gave a successful result (see Methods, external validation datasets).
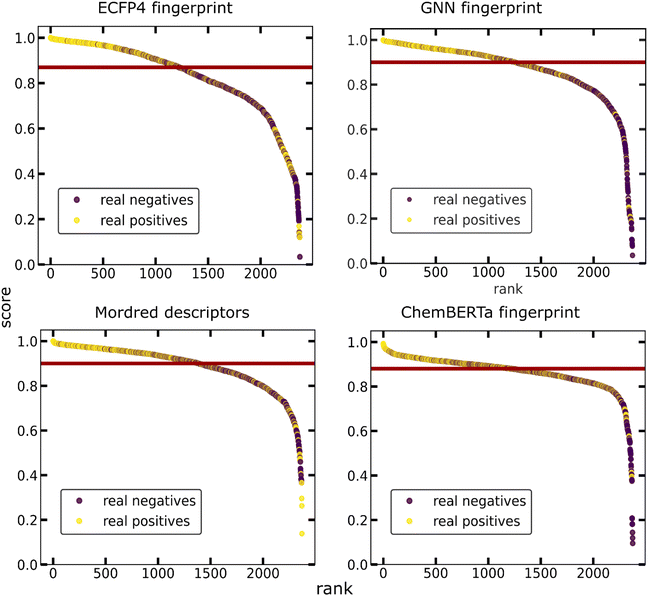
From the above, it can be concluded that the molecular set transformer using either Morgan (ECFP4) or GNN fingerprints perform well with unseen data. Fig. 7 shows the probability ranking of the list of co-formers on the validation data. The scores distribution between the true positives and true negatives for each model as well as the confusion matrices are presented in the Appendix Fig. S11 and S12† respectively. We can see that in all models the true positive data points tend to stack on the top of the ranking scatterplot and getting scores close to 1. The experimentally observed hits are significantly enriched at the top, indicating that virtual screening is a promising tool for focusing experimental efforts and reducing the number of experiments required to identify successful molecular pairs. The selection of the ‘best’ representation is dependent on the domain of application. Numerous studies have shown that GNN fingerprint could yield more promising results, whereas other studies claim that there is not much difference.46 We should also consider the fact that a GNN representation is not as easily interpretable as the molecular descriptors of the Morgan fingerprint.
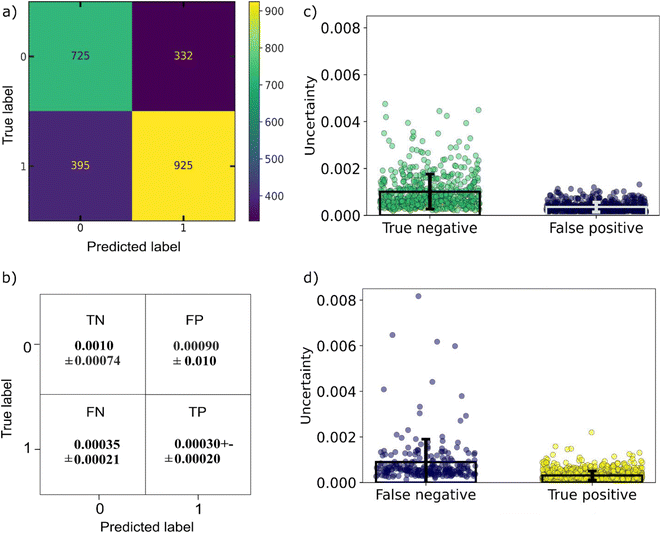
For developing an ML-based co-crystal screening tool which could be beneficial for selecting the next pair to be synthesized experimentally, we need to incorporate two important considerations of an experimental planning strategy, (i) exploitation, i.e., the need for a quick win where we can immediately identify a successful co-crystal among the top ranking percentile and (ii) exploration, i.e., investigating those cases which seem to differ the most from the data the ML model has been trained on. This could be achieved by incorporating uncertainty consideration to the model. Looking ahead on the uncertainty of the predictions, the points with higher uncertainties either contain one co-former which belong to a category of molecules not known for forming co-crystals, e.g., mannitol sugar or co-former combinations that have not be seen in co-crystals, e.g., acid–acid molecular pairs. It can be seen that the points predicted as negatives from the model have the higher uncertainties that were misclassified as negatives (false negatives) tend to have higher uncertainty in comparison to the true positives (Fig. 8). Points with uncertainties above 0.005 are worth being reinvestigated especially if they contain molecules that are known to form co-crystals. As ML models can only give reliable predictions on their domain of expertise, i.e., training data, having an indication about the uncertainty of each prediction is very important as points with low scores but high uncertainty might also be interesting synthetic targets. Nevertheless, our model is a one class classifier that has been trained only in the positive class, it is expected that it is going to show the lowest uncertainty for those points regarded as inliers (positive) from the model, whereas the points seen as outliers (negative class) tend to get high uncertainty scores.
3.3 Interpretability of the predictions
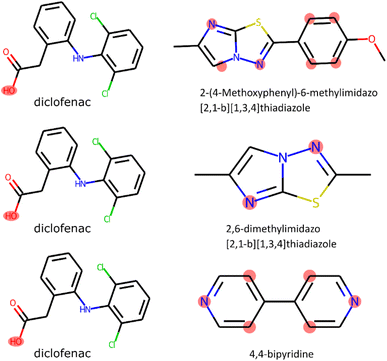
As the key goal is to generate both predictive models and to gain physical insights for the co-crystallization driving forces, an explainable AI technique was applied. Shapley additive explanations (SHAP) is implemented for rationalizing the scoring of each molecular pair by using feature weights represented as Shapley values from game theory.47 SHAP is a model-agnostic method where sensitivity analysis is used to investigate the influence of systematic feature values changes on the model output. SHAP-generated explanations can be categorized as global, i.e., summarizing the relevance of input features in the model or local, i.e., based on individual predictions.Of course, the choice of the molecular ‘representation model’ is an important factor governing the explainability and performance of the AI model as it determines the content and type of the obtained interpretability, i.e., physicochemical properties, functional groups. The features of the input vector are randomly set on and off, thereby examining feature influence in the final scoring. In that way we can get better insights about which features played an important role in the ranking. The advantage of using Shapley values is that we can get local interpretations, meaning that for any single pair or subset of molecular pairs we can ‘see’ which where the molecular characteristics that played an important role. Shapley local explanations can also be directly used to highlight the important functional groups, when molecules are represented as bit strings (Morgan fingerprint). We used the RDKit functionality48 to map the important bit vectors detected by the SHAP library to the molecular structure, following the same approach to Rodríguez-Pérez et al.49 In Fig. 9, we present some example pairs in which the molecular bits that have the highest contribution towards a high scoring are highlighted.
3.4 Benchmarking with current available methods
The importance of developing accurate and time-efficient co-crystal screening models is showcased by the number of approaches that have been developed for this task in the past years.24,50,51 Most of these approaches are targeting pharmaceutical co-crystals, i.e., pre-screening co-formers against several APIs, due to the importance of making the API more soluble such that is can be delivered to the body more easily. To prove the effectiveness of our method, we compared our two best models, molecular set transformer using either GNN or Morgan fingerprints, with other screening approaches that are currently used and report their performance on publicly available data, see ESI Table S3.†The comparisons are performed against two physical modelling methods and two machine learning methods on single APIs versus the co-formers. As shown in Fig. 10, the evaluation metric is the AUC per each API. The two physical modelling methods are COSMO-RS52 and a method based on calculated gas phase molecular electrostatic potential surfaces (MEPS).19 The two ML models refer to a screening tool developed from Wang et al.14 and CCGnet50 developed from Jiang et al.
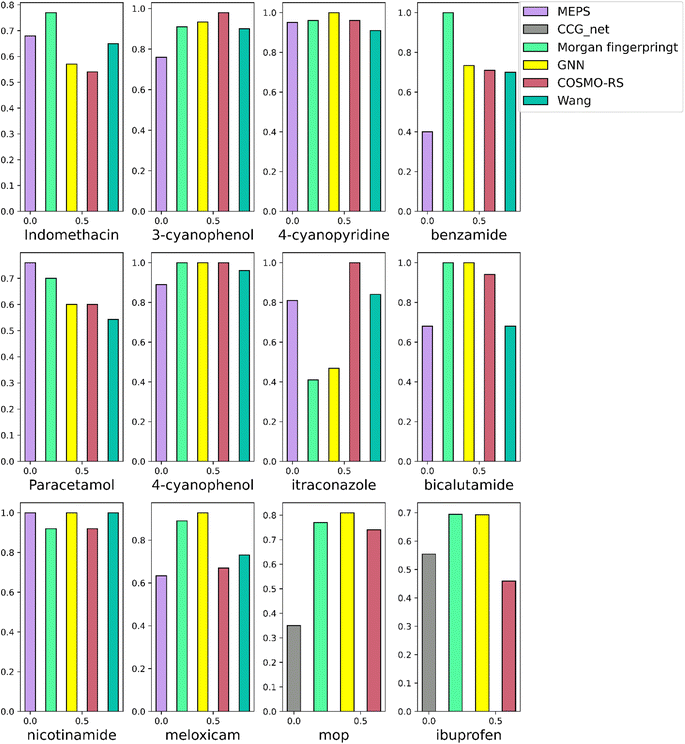 | ||
| Fig. 10 Head-to-head comparison of our best models on individual APIs with other models and methods reported in literature. | ||
COSMO-RS relies on the observation that if the enthalpy between an API-co-former mixture is more negative than the enthalpy of the pure components, then the formation of a co-crystal between the two components is highly possible. The method assesses the miscibility of two components in a super cooled liquid phase according to their excess enthalpy, ΔHex, which is the difference between enthalpy of the mixture and those of the pure components. The more negative the ΔHex the more likely the components are to form a stable structure.
On the other hand, MEPS is based on an electrostatic model that treats intermolecular interactions as point contacts between specific polar interaction sites on molecular surfaces. The MEPS of a molecule is calculated in the gas phase, and this is used to identify a discrete set of surface site interaction points (SSIPs), which are described by H-bond donor and H-bond acceptor parameters α and β. SSIPs identify conventional H-bond donor and acceptor sites as well as less polar sites that make weak electrostatic interactions, so they completely describe the surface properties of a molecule and can be used to calculate the total interaction of a molecule with its environment.19
Regarding the ML models that have been developed for co-crystal screening, they are based on supervised training of binary classifiers. A large-scale machine learning model, indicated as the Wang method, based on random forest and Morgan fingerprint have been previously tested on most of the twelve APIs shown in Fig. 10.
Another recent data-driven method, namely CCGnet combining 3D molecular structures and some important molecular fingerprints was tested on the MOP and ibuprofen external datasets (Fig. 10 grey bars) as these were the only two APIs that were not part in their training set and a reliable out-of-distribution evaluation score could be calculated. The accuracy in the two previously unseen from their model cases is smaller than the other ML models tested in this work.
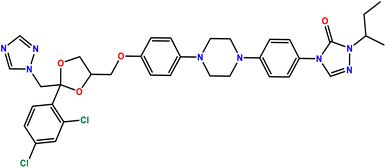
Note that the majority of methods we are comparing with are either based on theoretical models, or ML binary classifiers. Our methodology is only based on neural networks and only positive data was used due to the lack of reliable negative data points within our training set. It is noteworthy that the molecular set transformer was able to have comparable accuracy to computational chemistry models although it was based only on the molecular fingerprint. Both our models show the lowest performance for the itraconazole dataset which is the smallest dataset containing only 8 entries. Itraconazole (Fig. 11) is a large molecule not only containing many different functional groups but also an unusual N–N bonding into two of the aromatic rings. Although four itraconazole co-crystals are reported as a hit in the literature extracted dataset, there is only one itraconazole co-crystal deposited in the CSD, i.e., itraconazole:succinic acid (CSD id: REWTUK). Moreover, there are very few examples of co-crystals with chemically similar molecules. As such, the performance of our models is limited by the fact that there not enough molecular pairs for training containing similar compounds.
3.5 Dataset of suggested experiments – ZINC20
To further demonstrate the applicability of the methodology, one of our best performing models, i.e., the Morgan fingerprint model, was used for predicting high-probability molecular pairs from a freely available database with purchasable molecules, namely ZINC20.53 We extracted all the neutral in-stock molecules getting a starting dataset of 6![[thin space (1/6-em)]](https://www.rsc.org/images/entities/char_2009.gif) 883
883![[thin space (1/6-em)]](https://www.rsc.org/images/entities/char_2009.gif) 326 molecules represented as SMILES strings. Out of them we selected only those that have Tanimoto similarity > 0.8 with the molecules that form all the known co-crystals in CSD. That process limited the dataset to 3119 single molecules.
326 molecules represented as SMILES strings. Out of them we selected only those that have Tanimoto similarity > 0.8 with the molecules that form all the known co-crystals in CSD. That process limited the dataset to 3119 single molecules.
Solubility and lipophilicity are key parameters that can dictate the success or failure rate of drug discovery and development. Successful drug compounds should have lipophilicity optimal values between 2 and 3 to achieve the optimal bioavailability resistance to metabolism solubility and toxicity. Their measurement is vital for both in vivo and in silico evaluation of drug properties. We followed similar approach to Zhao et al. using SwissADME54 for the calculation of the logP values as an indicator for lipophilicity.55 By limiting the selected molecules based on lipophilicity, the molecular dataset was reduced to 300 molecules that pass all these constraints.
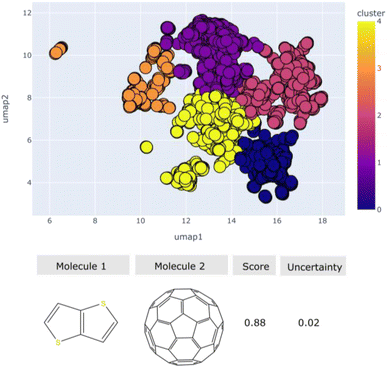
All the possible pairs between these molecules were generated and ranked based on our model. Those pairs that scored above 0.8 are plotted in a 2D map and unsupervised clustering was used to cluster them into similarity groups. The representation used is the fingerprint and the distance metric is the Tanimoto distance of the pairs. An interactive plot of the high scoring pairs is provided (https://zinc20.herokuapp.com/) as demonstrated in Fig. 12. The molecular pairs identified from the screening were projected into a two-dimensional map and were grouped into chemical families using the k-means clustering algorithm. By selecting one point in the interactive map a table is printed which displays the SMILES strings of the two molecules, the molecular diagrams as well as the score and uncertainty of each molecular combination. Overall, we identified ∼2000 high-scoring potential molecular pairs with low uncertainty, which cover a diverse set of shapes in the molecular space. These pairs could be good possible synthetic targets for achieving novel co-crystals.
4 Conclusions
In this work our primary goal was to develop a computational screening tool for prioritizing molecular pairs which can form stable multicomponent structures, namely co-crystals. To achieve this, we introduce molecular set transformer, an attention based neural network, which is capable of learning how to represent molecular sets. Our machine learning framework has three main parts: (1) data curation and representation, (2) a machine-learning algorithm with hyperparameter tuning and (3) validation on external literature data. The first part involves the extraction of all the available co-crystals from the Cambridge structural database and the testing of several representation techniques, both fixed (Mordred descriptors, Morgan fingerprint) and learned representations (GNN, ChemBERTa). We demonstrated that pre-trained models can be effectively used as ‘encoders’ for molecules to generate structural features. These features can then be used as input to the neural network to predict molecular pairs for co-crystallization. It was found that using pretrained models to encode the molecules, reduced the uncertainty on the ranking as the models were pretrained on a significantly larger corpus of molecules instead of only on molecules that form co-crystals.The second part refers to the design of the neural network by setting an effective training strategy. As opposed to the currently existing co-crystal screening approaches which rely on the extraction or generation of a negative dataset with molecular pairs that are highly unlikely to co-crystallize to train binary classifiers, our work illustrates the use of only the positive class. Molecular set transformer is trained on all the known positive data and is fine-tuned with the task to efficiently reconstruct the input pair. Each molecular pair is ‘seen’ as a set, as such the model is order invariant and can capture the bidirectionality of the problem.
Finally, the third part is about measuring the performance of our model on external datasets consisting of both positive and negative data. The benchmarking dataset was created by searching for experimental reports and is provided in this work as a well-curated validation dataset for further use in testing co-crystal screening methodologies. Our approach was compared to other ML and physical modelling methods, showing similar or better performance on well-known APIs. It is noteworthy that a model trained only in one class in an unsupervised manner performs equally or better than supervised binary classifiers.
Overall, this work is aiming towards contributing to the co-crystal design field by addressing the major challenges faced in current data-driven for materials discovery. The problems addressed herein are the lack of negative data, the effect that different molecular representations have in the model's performance, the uncertainty calibration of the model's predictions, the extrapolation on previously unseen data and the interpretability of the models. A solution to these problems is given by providing models that can evaluate diverse molecular pairs for their possibility to form co-crystals, not limited to pharmaceutical co-crystals but also co-crystals of electronic interest. The usefulness of the proposed approach is further demonstrated by ranking combinations from ZINC20 and providing an interactive map of high-ranking high-certainty combinations. Furthermore, the co-crystal screening tool is open source and could provide a ranking and an uncertainty estimate for any user provided molecular pair. In that way both positive and negative co-crystal datasets could be created and experimentally validated.
Data availability
We provide detailed instructions for the installation, training, and general usage of the open-source molecular set transformer on GitHub. In addition, pre-trained network weights for the models reported in this work are available for download. The following files are available with this publication: (1) GitHub repository with the source code, figures, and example co-crystal screening: https://github.com/lrcfmd/MolecularSetTransformer. (2) An interactive browser-based explorer with all the co-crystals deposited in CSD linked with WebCSD: https://csd-cocrystals.herokuapp.com/. (3) An online GUI for rapid in silico co-crystal screening: https://share.streamlit.io/katerinavr/streamlit/app.py. (4) An interactive plot of high scoring molecular pairs extracted from ZINC20 https://zinc20.herokuapp.com/ and (5) ESI† with the benchmarking datasets gathered from publicly available resources.Conflicts of interest
There are no conflicts to declare.Acknowledgements
We thank the Cambridge Crystallographic Data Centre for the provision of studentship funding to A. V. V. K. acknowledges EPSRC grant EP/R018472/1 and the Royal Academy of Engineering Industrial Fellowship IF2122\186. The authors thank the Leverhulme Trust for funding via the Leverhulme Research Centre for Functional Materials Design (RC-2015-036).References
- B. Rozemberczki, S. Bonner, A. Nikolov, M. Ughetto, S. Nilsson and E. Papa, Proceedings of the Thirty-First International Joint Conference on Artificial Intelligence, 2022, pp. 5530–5537 Search PubMed.
- A. Vriza, A. B. Canaj, R. Vismara, L. J. Kershaw Cook, T. D. Manning, M. W. Gaultois, P. A. Wood, V. Kurlin, N. Berry, M. S. Dyer and M. J. Rosseinsky, Chem. Sci., 2021, 12, 1702–1719 RSC.
- V. A. Nadtochenko, V. V. Gritsenko, O. A. D’yachenko, G. V. Shilov and A. P. Moravskii, Russ. Chem. Bull., 1996, 45(5), 1224–1225 CrossRef.
- Clarivate, https://clarivate.com/webofsciencegroup/solutions/web-of-science/, (accessed September 2, 2021).
- H. Alves, A. S. Molinari, H. Xie and A. F. Morpurgo, Nat. Mater., 2008, 7, 574–580 CrossRef CAS PubMed.
- J. R. Kirtley and J. Mannhart, Nat. Mater., 2008, 7, 520–521 CrossRef CAS PubMed.
- J. J. Dannenberg, J. Am. Chem. Soc., 1998, 120, 5604 CrossRef CAS.
- C. B. Aakeröy, N. C. Schultheiss, A. Rajbanshi, J. Desper and C. Moore, Cryst. Growth Des., 2009, 9, 432–441 CrossRef PubMed.
- C. A. Hunter, K. R. Lawson, J. Perkins and C. J. Urch, J. Chem. Soc., Perkin Trans. 2, 2001, 651–669 RSC.
- L. Fábián, Cryst. Growth Des., 2009, 9, 1436–1443 CrossRef.
- J. G. P. Wicker, L. M. Crowley, O. Robshaw, E. J. Little, S. P. Stokes, R. I. Cooper and S. E. Lawrence, CrystEngComm, 2017, 19, 5336–5340 RSC.
- M. Przybyłek, T. Jeliński, J. Słabuszewska, D. Ziółkowska, K. Mroczyńska and P. Cysewski, Cryst. Growth Des., 2019, 19, 3876–3887 CrossRef.
- M. Przybyłek and P. Cysewski, Cryst. Growth Des., 2018, 18, 3524–3534 CrossRef.
- D. Wang, Z. Yang, B. Zhu, X. Mei and X. Luo, Cryst. Growth Des., 2020, 20, 6610–6621 CrossRef CAS.
- J. Devogelaer, H. Meekes, P. Tinnemans, E. Vlieg and R. Gelder, Angew. Chem., Int. Ed., 2020, 59, 21711–21718 CrossRef CAS PubMed.
- C. R. Groom, I. J. Bruno, M. P. Lightfoot and S. C. Ward, Acta Crystallogr., Sect. B: Struct. Sci., Cryst. Eng. Mater., 2016, 72, 171–179 CrossRef CAS PubMed.
- C. B. Aakeröy and A. S. Sinha, in Co-crystals: Preparation, Characterization and Applications, The Royal Society of Chemistry, 2018, pp. 1–32 Search PubMed.
- S. Karki, T. Friić, L. Fábián and W. Jones, CrystEngComm, 2010, 12, 4038–4041 RSC.
- T. Grecu, C. A. Hunter, E. J. Gardiner and J. F. McCabe, Cryst. Growth Des., 2014, 14, 165–171 CrossRef CAS.
- L. K. Mapp, S. J. Coles and S. Aitipamula, Cryst. Growth Des., 2017, 17, 163–174 CrossRef CAS.
- N. Sarkar, J. Mitra, M. Vittengl, L. Berndt and C. B. Aakeröy, CrystEngComm, 2020, 22, 6776–6779 RSC.
- M. Khalaji, M. J. Potrzebowski and M. K. Dudek, Cryst. Growth Des., 2021, 21, 2301–2314 CrossRef CAS.
- J.-J. Devogelaer, M. D. Charpentier, A. Tijink, V. Dupray, G. Coquerel, K. Johnston, H. Meekes, P. Tinnemans, E. Vlieg, J. H. ter Horst and R. de Gelder, Cryst. Growth Des., 2021, 21, 3428–3437 CrossRef CAS PubMed.
- D. Wu, B. Zhang, Q. Yao, B. Hou, L. Zhou, C. Xie, J. Gong, H. Hao and W. Chen, Cryst. Growth Des., 2021, 21, 4531–4546 CrossRef CAS.
- K. Yang, K. Swanson, W. Jin, C. Coley, P. Eiden, H. Gao, A. Guzman-Perez, T. Hopper, B. Kelley, M. Mathea, A. Palmer, V. Settels, T. Jaakkola, K. Jensen and R. Barzilay, J. Chem. Inf. Model., 2019, 59, 3370–3388 CrossRef CAS PubMed.
- K. V. Chuang, L. M. Gunsalus and M. J. Keiser, J. Med. Chem., 2020, 63, 8705–8722 CrossRef CAS PubMed.
- H. Moriwaki, Y. S. Tian, N. Kawashita and T. Takagi, J. Cheminf., 2018, 10, 1–14 Search PubMed.
- E. J. Gardiner, J. D. Holliday, C. O'Dowd and P. Willett, Future Med. Chem., 2011, 3, 405–414 CrossRef CAS PubMed.
- G. Landrum, P. Tosco, B. Kelley, N. sriniker, R. Vianello, A. Ric, B. Cole, A. Savelyev, M. Swain, S. Turk, D. N. A. Vaucher, E. Kawashima, M. Wójcikowski, D. Probst, G. Godin, D. Cosgrove, A. Pahl, J. P., F. Berenger, J. L. strets123, N. O'Boyle, P. Fuller, J. H. Jensen, G. Sforna and D. Gavid, rdkit/rdkit: 2020_03_1 (Q1 2020) Release, https://zenodo.org/record/3732262, (accessed November 27, 2021).
- A. M. Dai, Q. v. Le, in Proceedings of the 28th International Conference on Neural Information Processing Systems - Volume 2 Adv. Neural Inf. Process. Syst., MIT Press, Cambridge, MA, USA, 2015, vol. 28, pp. 3079–3087 Search PubMed.
- W. Hu, B. Liu, J. Gomes, M. Zitnik, P. Liang, V. Pande and J. Leskovec, arXiv preprint arXiv:1905.12265 [cs.LG], 2016.
- S. Chithrananda, G. Grand and B. Ramsundar, arXiv preprint, arXiv:2010.09885, 2010.
- J. Lee, Y. Lee, J. Kim, A. R. Kosiorek, S. Choi and Y. W. Teh, Proceedings of Machine Learning Research, 2019, vol. 97, pp. 3744–3753 Search PubMed.
- I. Goodfellow, Y. Bengio and A. Courville, Deep Learning, MIT Press, 2016 Search PubMed.
- D. Yu, M. Kolbaek, Z. H. Tan and J. Jensen, in ICASSP, IEEE International Conference on Acoustics, Speech and Signal Processing - Proceedings, 2017, pp. 241–245 Search PubMed.
- L. Biewald, Weights & Biases, https://www.wandb.com Search PubMed.
- J. P. Janet, C. Duan, T. Yang, A. Nandy and H. J. Kulik, Chem. Sci., 2019, 10, 7913–7922 RSC.
- P. Schwaller, T. Laino, T. Gaudin, P. Bolgar, C. A. Hunter, C. Bekas and A. A. Lee, ACS Cent. Sci., 2019, 5, 1572–1583 CrossRef CAS PubMed.
- L. Hirschfeld, K. Swanson, K. Yang, R. Barzilay and C. W. Coley, J. Chem. Inf. Model., 2020, 60, 3770–3780 CrossRef CAS PubMed.
- D. Widdowson, M. M. Mosca, A. Pulido, A. I. Cooper and V. Kurlin, Match, 2021, 87, 529–559 CrossRef.
- D. Widdowson and V. Kurlin, Proceedings of NeurIPS, 2022 Search PubMed.
- D. Probst and J. L. Reymond, J. Cheminf., 2020, 12, 12 Search PubMed.
- T. Saito, Y. Kitagawa and Y. Takano, J. Phys. Chem. A, 2016, 120, 8750–8760 CrossRef CAS PubMed.
- F. T. Liu, K. M. Ting and Z. H. Zhou, in Proceedings - IEEE International Conference on Data Mining, ICDM, 2008, pp. 413–422 Search PubMed.
- S. Ramaswamy, R. Rastogi and K. Shim, Association for Computing Machinery (ACM), 2000, pp. 427–438 Search PubMed.
- D. Jiang, Z. Wu, C.-Y. Hsieh, G. Chen, B. Liao, Z. Wang, C. Shen, D. Cao, J. Wu and T. Hou, J. Cheminf., 2021, 13, 1–23 Search PubMed.
- S. M. Lundberg and S. I. Lee, in Advances in Neural Information Processing Systems, 2017, vol. 2017, pp. 4766–4775 Search PubMed.
- Using the new fingerprint bit rendering code, https://rdkit.blogspot.com/2018/10/using-new-fingerprint-bit-rendering-code.html.
- R. Rodríguez-Pérez and J. Bajorath, J. Med. Chem., 2020, 63, 8761–8777 CrossRef PubMed.
- Y. Jiang, Z. Yang, J. Guo, H. Li, Y. Liu, Y. Guo, M. Li and X. Pu, Nat. Commun., 2021, 12, 5950 CrossRef CAS PubMed.
- D. Wang, Z. Yang, B. Zhu, X. Mei and X. Luo, Cryst. Growth Des., 2020, 20, 6621 Search PubMed.
- Y. A. Abramov, C. Loschen and A. Klamt, J. Pharm. Sci., 2012, 101, 3687–3697 CrossRef CAS PubMed.
- J. J. Irwin, K. G. Tang, J. Young, C. Dandarchuluun, B. R. Wong, M. Khurelbaatar, Y. S. Moroz, J. Mayfield and R. A. Sayle, J. Chem. Inf. Model., 2020, 60, 6065–6073 CrossRef CAS PubMed.
- A. Daina, O. Michielin and V. Zoete, Sci. Rep., 2017, 7, 1–13 CrossRef PubMed.
- Z. W. Zhao, Ö. H. Omar, D. Padula, Y. Geng and A. Troisi, J. Phys. Chem. Lett., 2021, 12, 5009–5015 CrossRef CAS PubMed.
Footnote |
| † Electronic supplementary information (ESI) available: Dataset description; hyperparameters tuning; models description; additional results. See https://doi.org/10.1039/d2dd00068g |
| This journal is © The Royal Society of Chemistry 2022 |

