
 Open Access Article
 This Open Access Article is licensed under a
 Creative Commons Attribution 3.0 Unported Licence
Machine learning the quantum flux–flux correlation function for catalytic surface reactions†
Brenden G.
Pelkie
 and
Stéphanie
Valleau
*
and
Stéphanie
Valleau
*
Department of Chemical Engineering, University of Washington, Seattle, Washington 98195, USA. E-mail: stephanievalleau@gmail.com
First published on 3rd October 2022
Abstract
A dataset of fully quantum flux–flux correlation functions and reaction rate constants was constructed for organic heterogeneous catalytic surface reactions. Gaussian process regressors were successfully fitted to training data to predict previously unseen test set reaction rate constant products and Cauchy fits of the flux–flux correlation function. The optimal regressor prediction mean absolute percent errors were on the order of 1.0% for both test set reaction rate constant products and test set flux–flux correlation functions. The Gaussian process regressors were accurate both when looking at kinetics at new temperatures and reactivity of previously unseen reactions and provide a significant speedup respect to the computationally demanding time propagation of the flux–flux correlation function.
Introduction
Many theories have been developed to approximate quantum reaction rate constants or lower the cost of their computation.1,2 Indeed, the curse of dimensionality has impeded the calculation of quantum reaction rate constants dynamically: the cost scales exponentially with the degrees of freedom.3,4 To date, the largest fully quantum scattering calculations can only account for systems of approximately six atoms.5 In catalysis light-weight atoms such as hydrogen are often diffusing or reacting on metal surfaces. This occurs in e.g. selective hydrogenation, alkyne and alkene reduction, the water gas shift reaction, the Haber process, etc. Hence quantum effects such as tunneling must be accounted for when computing reaction rate constants. Optimal catalysts may enable a reduction of industrially produced toxic byproducts,6 the removal of carbon dioxide7 from the atmosphere and so forth. By understanding the type of reactant surface interactions,8 the reaction mechanisms,9 and the corresponding reaction rate constants, we can establish which factors lead to optimal reactivity.In recent years machine learning (ML) has successfully been employed to accelerate the evaluation of a variety of chemical and molecular properties.10 For kinetics, the main bottleneck has been the lack of large representative datasets of reaction rate constants. These are necessary to train machine learning algorithms to predict the reaction rate constant. Recently some kinetic datasets have been generated for non-catalytic systems,11–14 and contain activation energies,13 as well as quantum reaction rates for one dimensional systems.12 For catalytic surface reactions, Catalysis-Hub15 has become a great resource, yet activation energies and minimum energy paths are only available for few reactions. Nonetheless with these limited datasets, supervised machine learning algorithms have successfully been used16 to predict reactant and transition state partition functions,17,18 Gibbs free activation energies,19 activation energies,20 and quantum reaction rate constants12,21 for small systems. They have also been employed to accelerate the search for minimum energy paths.22–25 For catalytic systems, machine learning has been used in a variety of contexts26–28 such as predicting adsorption energies,29 but little has been carried out for reaction rate constants, due to the lack of training data.
In this work (Fig. 1), we generated a small set of exact quantum flux–flux correlation reaction rate constants30 for heterogenous catalytic surface reactions. With this dataset we trained Gaussian process regressors (GPRs) to predict the reaction rate constant and fits to the dynamic flux–flux correlation function. The predicted fits were also used to compute the reaction rate constant. We will describe our workflow and discuss the results in the following subsections.
 | ||
| Fig. 1 Flow chart of workflow. Panel (1) a dataset of reaction rate constants and flux–flux correlation functions was generated. Panel (2) with the dataset several Gaussian process regressors, GPR, were trained using a series of input features and kernels to identify the optimal set. Panel (3) with the optimal kernel and input features, X, previously unseen test set reaction rate constant products with the reactant partition function, log(kQR), and parameters for fits to the scaled flux–flux correlation functions, Cff(t)/Cff(0) were predicted. In panel 3, RE stands for reaction energy i.e. the difference between product and reactant zero point energies. | ||
Results and discussion
Dataset of quantum flux–flux correlation functions and reaction rate constants
A set of fourteen gas phase heterogeneous catalytic surface reactions was selected from Catalysis-Hub (Table 1).15| N react | Reaction | Catalyst | Surface | E a [kcal mol−1] |
|---|---|---|---|---|
| 1 | CH* + * → C* + H* | Rh | 111 | 33.5 |
| 2 | COH* + * → C* + OH* | Rh | 111 | 27.9 |
| 3 | CHOH* + * → CHO* + H* | Rh | 111 | 19.2 |
| 4 | CH3* + * → CH2* + H* | Rh | 211 | 10.3 |
| 5 | CH2OH* + * → CHOH* + H* | Pt | 111 | 27.0 |
| 6 | CH2* + * → CH* + H* | Ir | 111 | 2.6 |
| 7 | CH3* + * → CH2* + H* | Ir | 111 | 14.2 |
| 8 | CH3* + * → CH2* + H* | Pt | 111 | 24.7 |
| 9 | CHOH* + * → HCO* + H* | Ag | 111 | 14.7 |
| 10 | CHOH* + * → CH* + OH* | Ir | 111 | 12.3 |
| 11 | CHO* + * → CO* + H* | Pd | 111 | 2.9 |
| 12 | COH* + H* → CHOH* | Cu | 100 | 17.0 |
| 13 | CO* + H* → CHO* | Cu | 100 | 22.4 |
| 14 | CH* + H* → CH2* | Cu | 100 | 17.0 |
For these reactions, either a transition state geometry or a minimum energy path (MEP) were available, together with reactant and product geometries and energies. For reactions with missing MEPs, Eckart or skew normal functions were fitted to the energies of the reactants, products and transition states. The small size of the dataset was necessary due to the computational time required for the evaluation of the quantum reaction rate constants. Computing the single flux–flux correlation reaction rate constant for 55 one dimensional reactive pathways took six months of work. This calculation would take several months for a single path when expanding to two or three dimensional potential energy surfaces.
With the potential energy paths we defined the Hamiltonians, Ĥ, heavyside dividing surface operator, ĥ, flux operators,  time evolution operator, Û and Boltzmann operator e−βĤ in the canonical ensemble for each system using the sinc basis set discrete variable representation (DVR).31,32
In this representation, operators are defined by matrices with elements evaluated using a basis set of sinc functions, sinc(x) = sin(x)/x. Each function is centred at one point on a uniformly spaced set of NDVR grid points xj = xmin + Δx(j − 1). The grids were centred such that the maximum of the potential energy path was in position x = 0 and the edges of the grid at positions ±L. The products of the quantum reaction rate constant k(T) with the reactant partition function Qr(T) were then computed (eqn (1)) by integrating the quantum flux–flux correlation function (eqn (2)) Cff(t;T) numerically eqn (1)30
 | (1) |
 | (2) |
The upper bound of the integral in eqn (1) was determined by finding the time right before the wavefunction reaches the edges of the grid, for more information see ESI.† The cost of the calculations is determined by the size of the grid NDVR. Computing Cff(t;T) using eqn (2) is exact at any given time and does not require previous values in time. However, it requires the computation of the time evolution operator at each time step as well as the products with the flux and Boltzmann operators.
It is worth noting that the boundaries of the grid can lead to non-physical reflection in the dynamics of the flux–flux correlation function. To identify these and find the optimal grid parameters, calculations were carried out at fixed grid spacing and increasing grid width. This enabled the determination of the maximum physical time at which to truncate the integration of the flux–flux correlation function when computing the reaction rate constant and avoid unphysical barrier edge reflection. We also searched for and identified the minimum temperature for which a convergent Cff(t;T) function could be computed for each reaction. Details of the DVR parameters used for each temperature and reaction are provided in the ESI.†
For each reaction, four temperatures were randomly selected in the range [150–400] K. The entire dataset includes 14 fitted reaction minimum energy paths, 55 reaction rate constant products, 55 flux–flux correlation functions as a function of time, reaction energies and activation energies. It can be downloaded from Zenodo.33
Gaussian process regression of reaction rate constant and fit parameter for the flux–flux correlation function
Given the small size of our dataset we chose to use Gaussian process regression (GPR), a Bayesian non-parametric ML model, as our machine learning model (Fig. 2).16,34 With GPRs, given some input data X (training data set input features), a posterior distribution over functions, f(x) can be inferred. With this posterior one can make predictions, y* (targets) from new inputs, X* (test data set input features). Here we recall the related work of Nandi et al. where GPRs were trained to predict reaction rate constant corrections for bimolecular reactions.35,36 | ||
| Fig. 2 Panel 1: Gaussian process regressor prior distribution with zero mean and a kernel of choice. Panel 2: sample functions from the posterior, generated from the prior (Panel 1) based on the training data. Panel 3: mean of the trained GPR (black line) and prediction standard deviation (shaded area) respect to exact target function (blue line). | ||
Here our predictions or “targets” are the natural logarithm of the product of the reaction rate constant with the canonical reactant partition function k(T)QR(T) or a scale parameter for Cauchy fit to the ratio Cff(t;T)/Cff(0;T). We will discuss this second scale parameter target in more detail in the next subsection. The Gaussian process is defined as the prior for the regression function; it depends on a mean function and kernel or covariance function (Fig. 2, panel 1). The joint distribution of the training and test outputs is defined by using the prior. Then we can obtain the posterior distribution by conditioning the joint Gaussian prior distribution on the observations, X,y (Fig. 2, panels 2 and 3). The Gaussian process's prediction ability depends on the choice of kernel and estimation of optimal kernel parameters. In the next subsections we will discuss how the train and test datasets were obtained and how the kernel and kernel parameters were identified.
Train and test datasets
Two train and test datasets were generated from the full dataset to investigate the ability of Gaussian process regressors to predict kinetic quantities as a function of temperature (temperature-wise train test split) and for unseen reactions (reaction-wise train test split).In the first case the data was split by temperature to investigate whether a GPR could learn the quantum reaction rate constant or flux–flux correlation function targets at new temperatures. For each reaction, a row from the dataset was selected for the test set by randomly choosing one temperature. The rest of the dataset rows for that reaction were placed in the train set.
In the second case the data was split by reaction to analyse whether a trained GPR could predict the quantum reaction rate constant or flux–flux correlation function targets for an entirely new reaction. Here 4 reactions were chosen to be part of the test set and 10 of the train set. Specifically, reactions 2, 7, 8 and 12 were placed in the test set. Due to the small size of the overall dataset, this choice was done by hand to ensure that every metal catalyst present in the test set was represented in the training set. For silver and palladium (reactions 9 and 11) only one example was present. These were therefore added to the training set. The corresponding temperatures for each reaction can be found in Table S1† of the ESI.
As discussed earlier the target was either the natural logarithm of the product of the quantum reaction rate constant with the reactant canonical partition function, k(T)QR(T), or the scale parameter s for a Cauchy fit (eqn (3)) of the ratio Cff(t;T)/Cff(0;T). We had initially tried predicting exact Cff(t;T) values but the error was very large. Hence, we opted to scale Cff(t;T) by its value at time zero and to fit it to a Cauchy distribution function:
 | (3) |
Rescaling Cff(t;T) by Cff(0;T) was found to be necessary to improve the prediction accuracy. While this requires future users to solve for eqn (2) at time zero, it avoids the need to solve it at all subsequent times and hence reduces the cost to that of e.g. the Quantum Instanton approximation.37
We note that it was possible to use a Cauchy distribution here as there was no reflection or recrossing in the dynamics for any of the reactions. For other reactions, one would need to fit to a function which includes a negative contribution.
Input features
Coulomb matrix (CM) and encoded bond (EB) input features were generated from reactant and product geometries with the MolML software package.38 From these, a difference input feature was computed. Indeed difference input features have been successful in the context of machine learning kinetics.16,39 Many other input feature representations could be considered, for instance graph input features or machine learned input features. While it is beyond the scope of this work, we leave this to future work. To account for organic-metal atom interactions we considered the 6 atoms which moved the most after aligning reactant and product geometries. This number was chosen to ensure that at least one metal atom was included in the representation.When training and testing GPR reaction rate constant product predictors, inverse temperature,1/T, and reaction energies (RE) were included as input features. The combined input features for the train and test set were scaled using the min–max (0,1) scaler fit to the train set implemented in the scikit-learn software package.40 The target was not scaled or normalized. The same input features were used when training and testing GPRs to predict the Cauchy scale parameter (eqn (3)).
Search for optimal kernel and molecular input features for GPR fitting of the reaction rate constant products
A search was carried out for the optimal geometric input features and GPR kernel combination. The optimal set was identified by comparing the train set mean absolute error (MAE) scores. We investigated both the use of single kernels (Matérn, radial basis function, pairwise with linear metric, rational quadratic and white noise) and sums of two single kernels.41 For the temperature-wise split, it was found (Table 2 and ESI Table S2†) that Coulomb input features with min–max scaling together with a Matérn kernel summed to a pairwise linear kernel lead to the lowest MAE 9.92 × 10⁻¹¹ in units of the natural logarithm of inverse atomic units or time, log[1/au]. This corresponds to a MAPE of 2.41 × 10⁻¹⁰%. For the reaction-wise split, the optimal input features were the min–max scaled Coulomb input features together with 1/T and reaction energies and the optimal kernel was the sum of two Matérn kernels with an MAE of 5.69 × 10⁻¹⁰, corresponding to a MAPE of 1.43 × 10⁻⁹% (Table S3†). With these optimal kernels and input features, the trained models predicted the test set with errors ten orders of magnitude larger than those for the train set. To address this issue of overfitting, we adjusted the value of the noise term α added to the diagonal of the covariance matrix during fitting. This term can be used as a regularization parameter to prevent overfitting.34,42 Due to the small size of our data set a reasonable validation set was lacking for hyperparameter optimization. Hence, the optimal value of α was selected by comparing the train and test set errors for a range of values between 10−10 and 100 and choosing the value which led to the smallest gap between train and test errors; α = 0.5. Varying α over this range did not significantly impact the log marginal likelihood of the fit or the test set error for any of the models. All models were then retrained with α set to 0.5 and results are presented from these retrained models.| GPR model | Data split | Target | Fit | Prediction |
|---|---|---|---|---|
| Train set MAPE | Test set MAPE | |||
| Input features: rescaled CM difference, 1/T & RE Kernel: Matérn + pairwise | Temperature-wise | log(k(T)QR(T)) | 2.61 × 10⁻¹ | 9.98 × 10⁻¹ |
| Input features: rescaled CM difference, 1/T & RE Kernel: Matérn + Matérn | Reaction-wise | log(k(T)QR(T)) | 2.21 × 10⁻¹ | 3.38 × 101 |
| Input features: rescaled CM difference, 1/T & RE Kernel: Matérn + rational quadratic | Temperature-wise | Scale parameter for Cauchy fit of Cff(t;T)/Cff(0;T) | 1.93 × 10⁻² | 1.04 × 100 |
| Input features: rescaled CM difference, 1/T & RE Kernel: Matérn + rational quadratic | Reaction-wise | Scale parameter for Cauchy fit of Cff(t;T)/Cff(0;T) | 1.53 × 10⁻² | 2.82 × 101 |
GPR prediction of reaction rate constant products
The optimal GPR models listed in Table 2 were used to predict reaction rate constant products for previously unseen temperatures and reactions. For temperature-wise split test set values, the GPR had a high prediction accuracy with a MAPE of 0.998%. As we can see in Fig. 3 the predicted values (y-axis) closely follow the exact values (x-axis). The highest accuracy was in the temperature range T ∈ [250–350] K which is where there was a higher density of points in the training set (see ESI Fig. S4†). On the other hand, in the case of reaction-wise split test values, the MAPE was significantly larger at 33.8%. In Fig. 4 we compare the predicted and exact k(T)QR(T) for the decomposition of activated CH3* on a Pt(111) surface (reaction (8) of Table 1). | ||
| Fig. 3 Pairwise plot of the predicted test set values of log(k(T)QR(T)); the product of the quantum reaction rate constant k(T) with the reactant canonical partition function QR(T) for temperature-wise split train and test sets. The predicted values are in strong agreement with the test set with a test set MAPE of 0.998%. | ||
 | ||
| Fig. 4 Predicted value of reaction rate constant product as a function of 1/T for the reaction of CH3* + * → CH2* + H* on Pt(111), taken from the test set (Table 1 – reaction (8)). We see that the standard deviation of the trained GPR posterior predictor is quite large, however the predicted values are within one standard deviation from the exact results. | ||
We find the Gaussian process regressor standard deviation to be large, however the predicted mean values are within one standard deviation from the exact values.
We believe these larger errors on reaction-wise split test data are due to the small size of the training dataset. To improve on this prediction error, in section “Computation of k(T)QR(T), from a predicted fit of Cff(t;T)”, we look at training a GPR to predict a fit to the Cff(t;T) and integrating it to compute a k(T)QR(T) value.
Search for optimal kernel for GPR fitting of scale parameter of Cauchy fit of flux–flux correlation function
For the GPRs of Cauchy distribution Cff(t;T)/Cff(t;0) fit scale parameters, s (eqn (3)), we used the same input features found optimal when fitting GPRs to predict log(k(T)QR(T)); i.e. Coulomb matrix input features together with the inverse temperature and reaction energy.All input features were min–max scaled. We then searched for the optimal kernel and found that (Table 2 and S4†) for temperature-wise splitting the best was the sum of a Matérn kernel with a rational quadratic kernel.
Here the training set MAPE was 1.32 × 10⁻¹¹%. For reaction-wise splitting the optimal kernel was a Matérn kernel summed to a rational quadratic kernel and the train set MAPE was 3.36 × 10⁻¹¹% in atomic units of time. Again, models were then retrained with the regularization parameter α set to 0.5.
GPR prediction of Cauchy fit flux–flux correlation functions
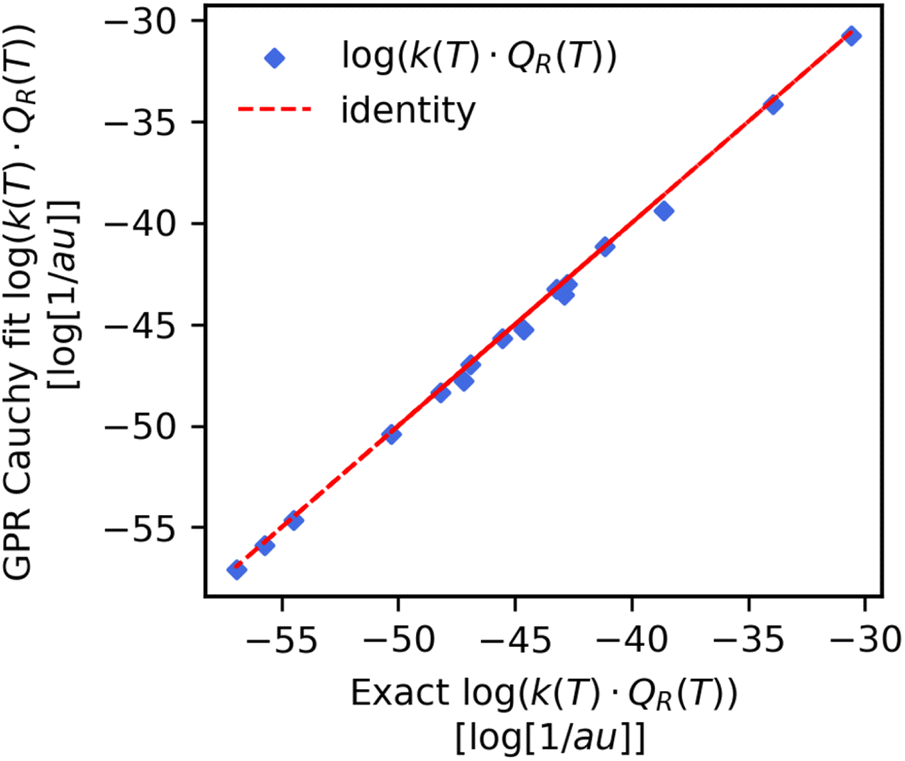
We used the GPRs of the Cauchy fit scale parameter to obtain a “predicted” Cauchy fit of the scaled flux–flux correlation function. We found that these “predicted” fits closely followed the original fits of the exact scaled flux–flux correlation functions for both the temperature-wise split and reaction-wise split test data. In Fig. 5 we show the pairwise correlation between the unscaled predicted fits (y-axis) and unscaled test set fits (x-axis) for the reaction wise split. The predictions are in strong agreement with the exact values. We note a series of segments in the predicted values of Cff(t;T)/Cff(t;0). Each segment can be associated with one or at most two reactions. | ||
| Fig. 5 Plot of test set time series values from Cauchy fits of the flux–flux correlation function, normalized by its value at time zero (x-axis) respect to the time series values from predicted fits using GPRs (y-axis). Both axes are in log scale to emphasize data points. The predicted fits are in strong agreement with the exact Cauchy fits. | ||
We also see accurate predictions of the flux–flux correlation function (Fig. 7, panel a) for reaction 8 at 300 K. The predicted values closely follow the exact values in time for this previously unseen test set reaction.
Computation of k(T)QR(T) from a predicted fit of Cff(t;T)
From our GPR Cauchy scale parameter predicted Cff(t;T) data we computed the reaction rate constant products by using trapezium integration for both the temperature wise and reaction wise split test set values. The results are shown in the last two rows of Table 3 and also in the pairwise plot (Fig. 6). We note a very large improvement in the mean absolute percent error (MAPE) for the reaction-wise split dataset. While the MAPE was on the order of 101 when predicting the product directly (Table 2) it is now two orders of magnitude smaller and equal to 0.82%. This implies that the error on the integral of the fitted Cff(t;T) is smaller than the error of the GPR predictor of the reaction rate constant product. If we look at the prediction of the reaction rate constant product for reaction (8) from the test set (Fig. 7, panel b). we find a significant improvement respect to Fig. 4. The predicted values now closely follow the exact as a function of temperature.| Computed quantity | Method | Error metric | % Error |
|---|---|---|---|
|
Cauchy curve fit with GPR predicted scale parameter for temperature-wise split data | 〈MAPE(Cexactff(t;T), CGPRCauchyff(t;T))〉rx | 9.77 × 10⁻¹ |

|
Cauchy curve fit with GPR predicted scale parameter for reaction-wise split data | 〈MAPE(Cexactff(t;T), CGPRCauchyff(t;T))〉rx | 9.76 × 10⁻² |
| log(k(T)QR(T)) | Trapezium integral of predicted Cff(t) Cauchy fit for temperature-wise split data | MAPE(log(kQR)exact, log(kQR)GPRCauchy) | 6.78 × 10⁻¹ |
| log(k(T)QR(T)) | Trapezium integral of predicted Cff(t) Cauchy fit for reaction-wise split data | MAPE(log(kQR)exact, log(kQR)GPRCauchy) | 8.21 × 10⁻¹ |
 | ||
| Fig. 6 Pairwise plot of the exact (x-axis) respect to the integrated Cauchy GPR fit (y-axis) product of the reaction rate constant with the reactant partition function. Data was obtained for the reaction split previously unseen reaction. The MAPE = 0.82% is two orders of magnitude smaller than what was found when predicting the product directly for the same data (see Table 2). | ||
 | ||
| Fig. 7 Panel (a) predicted Cauchy fit of the flux–flux correlation function (dashed blue line) for the reaction of CH3* → CH2* + H on Pt(111) (reaction (8) in Table 1) at 300 K. Panel (b) comparison of the exact reaction rate constant products (grey circles and dashed line) with numerically integrated values obtained from the GPR Cauchy predicted scale parameter fit (blue diamonds and solid line). We see a large improvement on predicted test set reaction rate constant values respect to what we had found when predicting the rate constant product directly (Table 2). | ||
With these last results we believe GPRs can predict kinetics not only as a function of temperature, but also for previously unseen reactions.
Conclusions
Gaussian process regressors were trained on our home built set of exact flux–flux correlation functions and quantum reaction rate constant products for heterogeneous surface reactions.33 We investigated the GPRs' ability to predict both the product of the reaction rate constant with the reactant partition function and the flux–flux correlation function in time, rescaled respect to its initial value. Two previously unseen test sets were used to determine prediction ability, one contained previously seen reactions at new temperatures and the other previously unseen reactions at new temperatures. GPRs were accurate in predicting reaction rate constant products at new temperatures with a small MAPE on the order of 100. When looking at reaction-wise split however, the error was larger and on the order of 101. We were able to reduce the prediction error by considering a different GPR target – the scale parameter of a Cauchy distribution function fit to the flux–flux correlation function. The resulting trapezium integrated reaction rate constants had an MAPE error of 0.82% which was two orders of magnitude smaller for that same reaction wise split test set. The cost of our predictors is low when looking at predicting the fully quantum k(T)QR(T) directly. All that is needed in input is a reaction energy, temperature and the geometries of reactants and products. No information on minimum energy paths is required. However, it is important to recall that these quantities depend on the specific catalyst. When considering the prediction of the Cauchy fit for the flux–flux correlation function, one also needs the value of the flux–flux correlation function at time zero. While this comes with a cost it remains orders of magnitude smaller than the full computation of the flux–flux correlation function. We trust that this work will help in the prediction of fully quantum kinetic quantities.Data availability
The flux–flux correlation function and reaction rate constant dataset can be found on Zenodo.33 All code needed to reproduce these results can be found at https://github.com/brendenpelkie/learning_fluxflux_kinetics.Conflicts of interest
There are no conflicts to declare.Acknowledgements
The authors would like to acknowledge Evan Komp for useful discussions on this work. The authors also acknowledge the Hyak supercomputer system at the University of Washington for support of this research.References
- E. Pollak and P. Talkner, Chaos, 2005, 15, 026116 CrossRef.
- P. Hänggi, P. Talkner and M. Borkovec, Rev. Mod. Phys., 1990, 62, 251–341 CrossRef.
- J. Li, B. Zhao, D. Xie and H. Guo, J. Phys. Chem. Lett., 2020, 11, 8844–8860 CrossRef CAS PubMed.
- D. Sheppard, R. Terrell and G. Henkelman, J. Chem. Phys., 2008, 128, 134106 CrossRef PubMed.
- B. Zhao and H. Guo, Wiley Interdiscip. Rev.: Comput. Mol. Sci., 2017, 7, 1–14 Search PubMed.
- Y. D. Shahamat, M. Farzadkia, S. Nasseri, A. H. Mahvi, M. Gholami and A. Esrafili, J. Environ. Health Sci. Eng., 2014, 12, 1–12 CrossRef PubMed.
- P. Frontera, A. Macario, M. Ferraro and P. Antonucci, Catalysts, 2017, 7, 59 CrossRef.
- A. A. Latimer, A. R. Kulkarni, H. Aljama, J. H. Montoya, J. S. Yoo, C. Tsai, F. Abild-Pedersen, F. Studt and J. K. Nørskov, Nat. Mater., 2017, 16, 225–229 CrossRef CAS.
- H. Peng, M. T. Tang, X. Liu, P. S. Lamoureux, M. Bajdich and F. Abild-Pedersen, Energy Environ. Sci., 2021, 14, 473–482 RSC.
- C. W. Coley, N. S. Eyke and K. F. Jensen, Angew. Chem., Int. Ed., 2020, 59, 23414–23436 CrossRef CAS.
- E. Komp and S. Valleau, Machine Learning Quantum Reaction Rate Constants (1.0.0) [Data set], DOI:10.5281/zenodo.5510392.
- E. Komp and S. Valleau, J. Phys. Chem. A, 2020, 124, 8607–8613 CrossRef CAS PubMed.
- C. A. Grambow, L. Pattanaik and W. H. Green, Sci. Data, 2020, 7, 1–8 CrossRef PubMed.
- G. F. von Rudorff, S. N. Heinen, M. Bragato and O. A. von Lilienfeld, Mach. Learn.: Sci. Technol., 2020, 1, 045026 Search PubMed.
- K. T. Winther, M. J. Hoffmann, J. R. Boes, O. Mamun, M. Bajdich and T. Bligaard, Sci. Data, 2019, 6, 1–10 CrossRef PubMed.
- E. Komp, N. Janulaitis and S. Valleau, Phys. Chem. Chem. Phys., 2022, 24, 2692–2705 RSC.
- E. Komp and S. Valleau, Low cost prediction of molecular and transition state partition functions via machine learning (1.0.0) [Data set], DOI:10.5281/ZENODO.6326560.
- E. Komp and S. Valleau, Chem. Sci., 2022, 13, 7900–7906 RSC.
- K. Jorner, A. Tomberg, C. Bauer, C. Sköld and P.-O. Norrby, Nat. Rev. Chem., 2021, 5, 240–255 CrossRef CAS.
- T. Lewis-Atwell, P. A. Townsend and M. N. Grayson, Wiley Interdiscip Rev Comput Mol Sci, 2021, 1–31 Search PubMed.
- P. L. Houston, A. Nandi and J. M. Bowman, J. Phys. Chem. Lett., 2019, 10, 5250–5258 CrossRef CAS.
- R. Meyer, K. S. Schmuck and A. W. Hauser, J. Chem. Theory Comput., 2019, 1–17 Search PubMed.
- A. A. Peterson, J. Chem. Phys., 2016, 145, 074106 CrossRef PubMed.
- O. P. Koistinen, V. Ásgeirsson, A. Vehtari and H. Jónsson, J. Chem. Theory Comput., 2019, 15, 6738–6751 CrossRef CAS PubMed.
- O. P. Koistinen, V. Ásgeirsson, A. Vehtari and H. Jónsson, J. Chem. Theory Comput., 2020, 16, 499–509 CrossRef.
- P. Schlexer Lamoureux, K. T. Winther, J. A. Garrido Torres, V. Streibel, M. Zhao, M. Bajdich, F. Abild-Pedersen and T. Bligaard, ChemCatChem, 2019, 11, 3581–3601 CrossRef CAS.
- T. Toyao, Z. Maeno, S. Takakusagi, T. Kamachi, I. Takigawa and K. I. Shimizu, ACS Catal., 2020, 10, 2260–2297 CrossRef CAS.
- B. Meyer, B. Sawatlon, S. Heinen, O. A. Von Lilienfeld and C. Corminboeuf, Chem. Sci., 2018, 9, 7069–7077 RSC.
- A. J. Chowdhury, W. Yang, E. Walker, O. Mamun, A. Heyden and G. A. Terejanu, J. Phys. Chem. C, 2018, 122, 28142–28150 CrossRef CAS.
- W. H. Miller, S. D. Schwartz and J. W. Tromp, J. Chem. Phys., 1983, 79, 4889–4898 CrossRef CAS.
- J. C. Light, I. P. Hamilton and J. V. Lill, J. Chem. Phys., 1985, 82, 1400–1409 CrossRef CAS.
- D. T. Colbert and W. H. Miller, J. Chem. Phys., 1992, 96, 1982–1991 CrossRef CAS.
- B. G. Pelkie and S. Valleau, Machine learning the quantum flux–flux correlation function for catalytic surface reactions (1.0.0) [Data set].
- C. K. Williams and C. E. Rasmussen, Gaussian processes for machine learning, MIT press, Cambridge, MA, 2006, vol. 2 Search PubMed.
- P. L. Houston, A. Nandi and J. M. Bowman, J. Phys. Chem. Lett., 2019, 10, 5250–5258 CrossRef CAS.
- A. Nandi, J. M. Bowman and P. Houston, J. Phys. Chem. A, 2020, 124, 5746–5755 CrossRef CAS.
- W. H. Miller, Y. Zhao, M. Ceotto and S. Yang, J. Chem. Phys., 2003, 119, 1329–1342 CrossRef CAS.
- C. R. Collins, G. J. Gordon, O. A. Von Lilienfeld and D. J. Yaron, J. Chem. Phys., 2018, 148, 241718 CrossRef.
- S. Gallarati, R. Fabregat, R. Laplaza, S. Bhattacharjee, M. D. Wodrich and C. Corminboeuf, Chem. Sci., 2021, 12, 6879–6889 RSC.
- F. Pedregosa, G. Varoquaux, A. Gramfort, V. Michel, B. Thirion, O. Grisel, M. Blondel, P. Prettenhofer, R. Weiss, V. Dubourg, J. Vanderplas, A. Passos, D. Cournapeau, M. Brucher, M. Perrot and É. Duchesnay, J. Mach. Learn. Res., 2011, 12, 2825–2830 Search PubMed.
- C. E. Rasmussen and C. Williams, Cambridge, MA, 2006, 32, 68.
- A. Nandi, J. M. Bowman and P. Houston, J. Phys. Chem. A, 2020, 124, 5746–5755 CrossRef CAS PubMed.
Footnote |
| † Electronic supplementary information (ESI) available. See DOI: https://doi.org/10.1039/d2dd00051b |
| This journal is © The Royal Society of Chemistry 2022 |