
 Open Access Article
 This Open Access Article is licensed under a
 Creative Commons Attribution 3.0 Unported Licence
Nanoscale chemical characterization of biomolecules using tip-enhanced Raman spectroscopy†
Sébastien
Bonhommeau
 *,
Gary S.
Cooney
and
Yuhan
Huang
*,
Gary S.
Cooney
and
Yuhan
Huang
Univ. Bordeaux, CNRS, Bordeaux INP, ISM, UMR 5255, F-33400 Talence, France. E-mail: sebastien.bonhommeau@u-bordeaux.fr
First published on 11th March 2022
Abstract
Nanoscale chemical and structural characterization of single biomolecules and assemblies is of paramount importance for applications in biology and medicine. It aims to describe the molecular structure of biomolecules and their interaction with unprecedented spatial resolution to better comprehend underlying molecular mechanisms of biological processes involved in cell activity and diseases. Tip-enhanced Raman scattering (TERS) spectroscopy appears particularly appealing to reach these objectives. This state-of-the-art TERS technique is as versatile as it is ultrasensitive. To perform a successful TERS experiment, special care and a thorough methodology for the preparation of the TERS system, the TERS probe tip, and sample are needed. Intense efforts have been deployed to characterize nucleic acids, proteins and peptides, lipid membranes, and more complex systems such as cells and viruses using TERS. Although the vast majority of studies have first been performed in dry conditions, they have allowed for several scientific breakthroughs. These include DNA and RNA sequencing, and the determination of relationships between protein structure and biological function by the use of increasingly exploitative chemometric tools for spectral data analysis. The nanoscale determination of the secondary structure of amyloid fibrils, protofibrils and oligomers implicated in neurodegenerative diseases could, for instance, be connected with the toxicity of these species, amyloid formation pathways, and their interaction with phospholipids. Single particles of different viral strains could be distinguished from one another by comparison of their protein and lipid contents. In addition, TERS has allowed for the evermore accurate description of the molecular organization of lipid membranes. Very recent advances also demonstrated the possibility to carry out TERS in aqueous medium, which opens thrilling perspectives for the TERS technique in biological, biomedical, and potential clinical applications.
 Sébastien Bonhommeau | Sébastien Bonhommeau is Associate Professor in Physical Chemistry with particular emphasis in Spectroscopy at the University of Bordeaux (UBx), France. He received his PhD at Paul Sabatier University in Toulouse, France (2006). He performed a two-year postdoctoral appointment at the synchrotron BESSY II in Berlin, Germany (2006–2008) and a one-year stay in Toulouse as Assistant Professor (2008–2009). As Associate Professor, he was awarded a CNRS/UBx chair of excellence (2009–2014) and the instrumentation prize of the French Physical Chemistry Division (2020). He has made important contributions in molecular magnetism and in the nanoscale chemical and structural characterization of biomolecules using TERS. |
 Gary S. Cooney | Gary S. Cooney earned his bachelor's degree in Medicinal Chemistry from Trinity College Dublin, Ireland (2018). He pursued the Advanced Spectroscopy in Chemistry (ASC) Erasmus Mundus Master's program obtaining his MSc from University Leipzig, Germany and University of Lille, France (2021). He is currently pursuing his PhD at the University of Bordeaux under the supervision of Dr Bonhommeau. His main research interests are the nanoscale chemical and structural characterization of membranes using TERS, and the development of complementary multivariate analysis methods. |
 Yuhan Huang | Yuhan Huang obtained her MSc in 2020 at Hong Kong Baptist University where she completed a dissertation on the qualitative analysis of amyloid-β peptides implicated in Alzheimer's disease under the supervision of Prof. Li Hung Wing. In 2021, she joined Dr Bonhommeau's group at the University of Bordeaux for her PhD studies. Her work is mainly focused on the nanoscale chemical characterization and imaging of amyloid aggregates using TERS. |
Key learning points(1) Tip-enhanced Raman spectroscopy (TERS) can provide nanoscale information on the chemical composition and the structure of biomolecules, as well as their orientation on surfaces.(2) The TERS system, the TERS probe tip and the selected sample can be adapted to a wide range of applications in air and in liquid environments. (3) TERS is able to identify DNA and RNA nucleobases and backbone structure, amino acid residues (especially aromatic ones), protein/peptide secondary structures, haem groups, and lipid markers with nanoscale spatial resolution. (4) Recent advances in TERS has allowed for the demonstration of proof-of-principle DNA and RNA sequencing, the characterization of amyloid protein/peptide assemblies with different morphologies and toxicities, and provided explanations on certain biological mechanisms. (5) TERS investigations on virus particles, lipid membranes, and cells have become more and more sophisticated with an increasing interest for applications in aqueous medium. |
1. Introduction
The fine characterization of biomolecules is crucial to better understand their biological activity and, in turn, develop biomedical devices or medical treatments alleviating potential malfunctions. Many characterization techniques focus on the description of the conformation, chemical composition, and structure of biomolecules either in dry conditions or in a liquid environment. Among them, infrared (IR) absorption and Raman scattering vibrational spectroscopies have been exploited to provide label-free molecular characterization contrary to widespread fluorescence imaging techniques that often require the attachment of a fluorescent tag to the studied biomolecule. These spectroscopic techniques are complementary with both advantages and drawbacks. Due to distinct selection rules, certain vibrational modes can appear in IR absorption spectra but not in Raman spectra and vice versa, although many vibrational modes can be observed in both spectra. As the Raman scattering cross-section is typically 8 orders of magnitude lower than the IR absorption cross-section, IR absorption measurements have often been privileged over Raman ones. However, the interpretation of IR absorption spectra may become difficult for biomolecules in aqueous media. For example, the intense IR band assigned to the H2O scissoring vibration overlaps with the 1500–1700 cm−1 spectral region where amide I and amide II bands, that are of prime importance for the study of protein structures, appear. This issue is globally suppressed in Raman spectra because of the low Raman intensity of OH vibrational modes. Like any far-field optical microscopic technique, IR and Raman microspectroscopies present a lateral spatial optical resolution (SOR) limited by diffraction to half the excitation wavelength (λ). This is in agreement with the Rayleigh criterion, which provides the smallest resolvable distance d = 0.61λ/NA between two point objects, where NA is the numerical aperture of the microscope objective lens. This reduced resolution impedes the precise study of nanoscale biosystems using conventional vibrational imaging techniques, especially since the small quantity of irradiated matter leads to very weak IR or Raman signals. To solve this problem, nano-IR and tip-enhanced Raman scattering (TERS) spectroscopies have been developed. For a detailed comparison of these two near-field optical techniques and of their applications, the reader is referred to a recent review on the topic.1 Herein, we will focus on the TERS characterization of biomolecules.TERS combines scanning probe microscopy (SPM), such as atomic force microscopy (AFM) and scanning tunnelling microscopy (STM), with surface-enhanced Raman scattering (SERS) spectroscopy.2–4 In SPM, the fine monitoring of the axial z-motion of a probe tip allows for nanoscale imaging of the surface topography (height) in the XY sample plane. Fig. 1A depicts the case of AFM in which a height image is obtained by measurement of the vertical deflection of a laser on the tip cantilever. The shape and size of the SPM probe governs the nanoscale SOR. In SERS,5 the Raman signal is enhanced by several orders of magnitude via the excitation of the localized surface plasmon‡ resonance (LSPR) of a metal nanoparticle at a nanometre distance from the probed analyte (Fig. 1B). This LSPR depends on the size, the shape, the composition, and the surrounding dielectric medium of the nanoparticle. Silver (Ag) and gold (Au) are most frequently used as nanoparticle metals for SERS applications because of the low imaginary part of their dielectric function in the UV-visible-near IR range leading to higher signal enhancements compared to other plasmonic metals (e.g. Al, Pd and Pt). In water (n = 1.33), the LSPR wavenumber is expected to be red-shifted with respect to its value in air (n = 1) owing to the change in refractive index n. The SERS enhancement is also particularly high at the junction between two (Ag or Au) noble metal nanoparticles separated by a nanoscale distance (<1–2 nm typically), thus forming a “hotspot”. In TERS, a metal SPM probe (also called the TERS tip) is the active plasmonic nanostructure. In addition to its plasmonic properties, the TERS tip also plays the role of a “lightning rod” and a “nano-antenna”. As a “lightning rod”, a tapered tip can undergo an accumulation of surface charges at the apex under non-resonant light excitation. As a “nano-antenna”, it allows for the interconversion between local and propagative electromagnetic fields under resonant light irradiation. Plasmonic, “lightning-rod”, and “nano-antenna” effects of a TERS tip result in the detection of the enhanced Raman signal, which originates from the nanoscale “hotspot” created below the tip at the sample surface.2–4 Due to the nanoscale size of the probed region in TERS, a single point measurement does not reflect the composition and structure of large heterogeneous samples. Nanoscale chemical imaging of the sample surface over hundreds of nanometres is thus necessary. For this purpose, TERS imaging is employed. In this case, the “hotspot” is moved along the sample with nanoscale steps to build its chemical and structural map with nanoscale SOR.
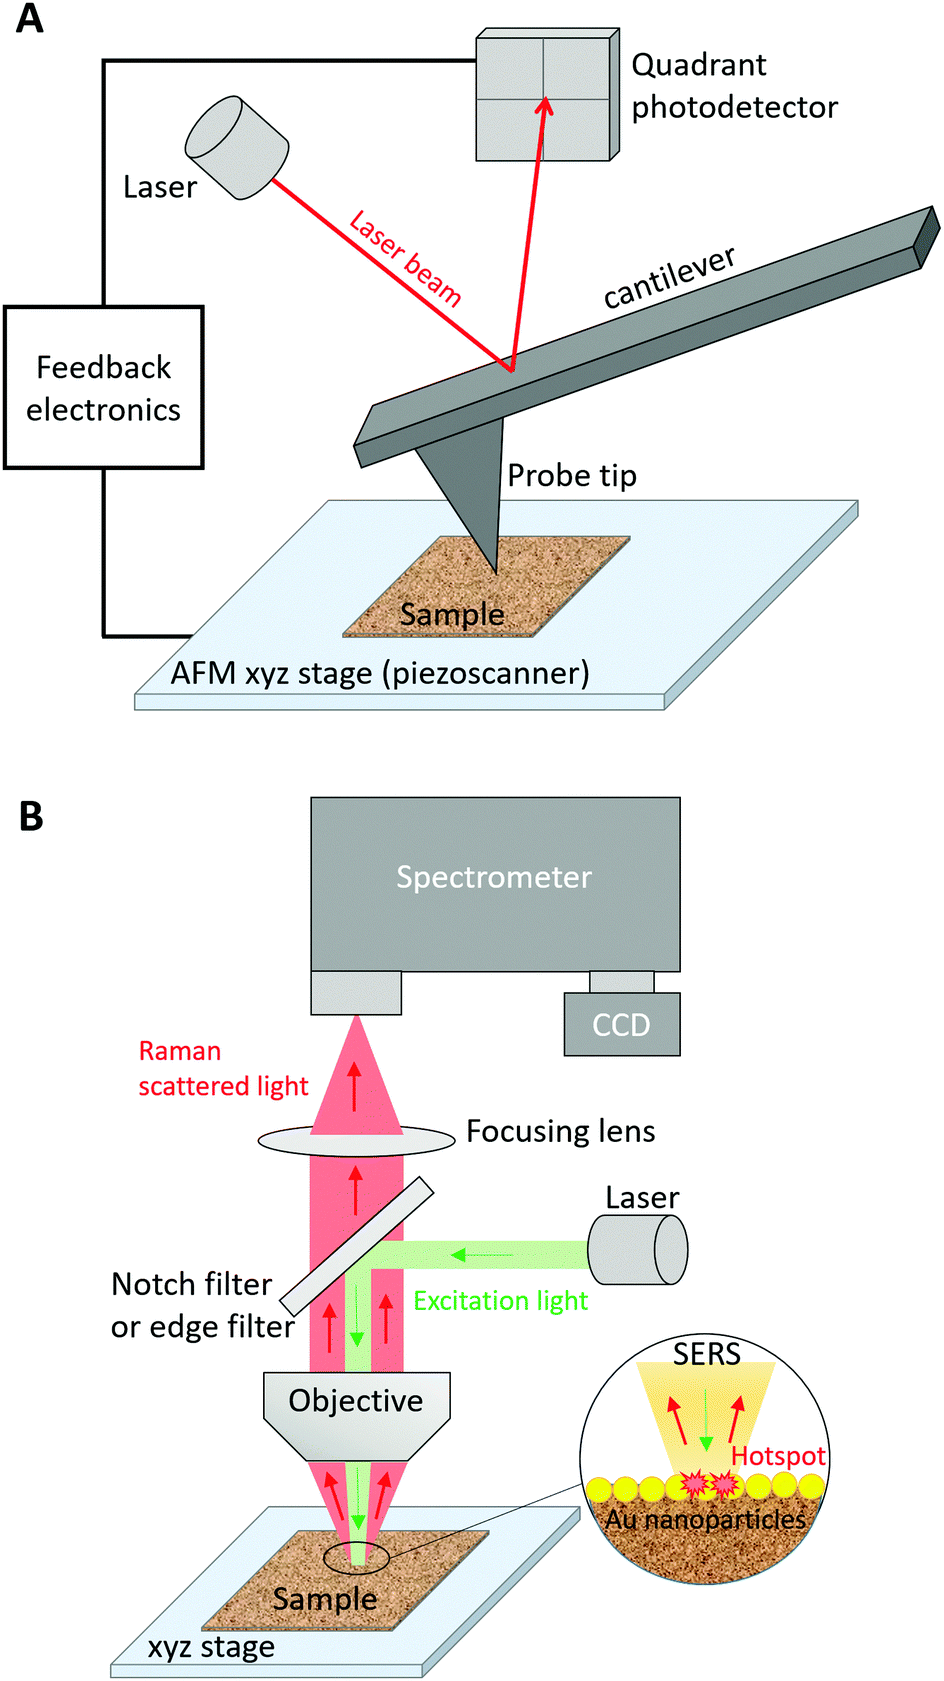 | ||
| Fig. 1 (A) Schematic representation of an AFM system; (B) schematic representation of a Raman spectrometer. In a SERS configuration, the LSPR of metal (Au here) nanoparticles in contact with the sample is excited resonantly. | ||
Although Raman, SERS and TERS are all inelastic scattering processes, they show different selection rules that may lead to dissimilar spectral signatures (with distinct band position and intensity), in particular as a function of the molecular orientation and excitation light polarization.6,7 In TERS, chemical groups with vibrational modes oriented in the plane parallel to the TERS tip axis are typically associated with the most intense bands. On the contrary, weak bands tend to be observed for chemical groups with vibrational modes oriented in the plane perpendicular to the tip axis.8 Vibrational modes associated with atomic motions perpendicular to a SERS substrate are also preferentially enhanced.5,6 Despite this, SERS and TERS spectra of biomolecules adsorbed on a surface, such as poly-cytosine for example,7,9 may show different relative band intensities regardless. In contrast, wavenumbers corresponding to specific chemical functional groups are essentially identical in TERS, SERS, and Raman spectra, even if metal-sample interactions may entail the appearance of additional bands in SERS and TERS spectra with respect to their Raman counterpart. This beneficial property has been widely exploited to interpret TERS spectra of biomolecules.2,4 The present review will not insist on the description of all the vibrational modes reported in TERS spectra and their comparison with Raman and SERS data. Such a thorough analysis is already available in the literature.2
This review aims at describing technical details that are relevant for the investigation of biomolecules and the major discoveries related to the TERS characterization (and sometimes the TERS mapping) of nucleic acids, proteins and peptides, lipid membranes and complex biosystems such as viruses and bacteria. Finally, future challenges to improve our understanding of biomolecules will be discussed.
2. Technical details
2.1 TERS instruments
 | ||
| Fig. 2 Direct bottom (A), total internal reflection bottom (B), side (C), and top (D) illumination configurations in TERS instruments. Green and red arrows indicate the excitation light and the scattered light, respectively. | ||
2.2 TERS tips
Most strategies for the manufacturing of TERS tips use Ag and Au metals as raw materials.2–4 As the LSPR of Au tips is generally red-shifted with respect to the LSPR of Ag ones, they are often more suitable for TERS experiments in the red or the near IR range while Ag tips are more relevant in the green-yellow range. They also show better chemical stability than their Ag counterparts. The lifetime of unprotected Ag tips is limited to a few hours, or up to one day. This short lifetime is due to the alteration of the tip LSPR by Ag oxidation and sulfurization under ambient conditions. The chemical stability of Ag tips can be improved by deposition of a thin (1–2 nm) protective capping layer of SiO2 or Al2O3 materials for example, although this creates an insulating gap between the sample and the noble metal and thus reduces the TERS enhancement. Contrary to Ag tips, unprotected Au tips can be used for weeks at a time. Their main drawback lies in their lower TERS electromagnetic enhancement relative to Ag tips in the visible range owing to the higher imaginary part of the dielectric function of gold. For the study of weak Raman scatterers, silver is often preferred to gold.The manufacturing of TERS tips is based on noble metal (Au and Ag mainly) deposition techniques, electrochemical etching, nanofabrication and metal nanoparticle coatings.2 The ideal preparation method should allow for the production of cheap and robust probes with high fabrication yield and reproducibility foremost. High electromagnetic enhancement, high SOR (down to the nanometre or below), but also plasmonic properties that could be tuned in a large spectral range constitute the optimal characteristics for TERS tips. In practice however, traditional TERS tips involving the metallization of commercial AFM probes, or the electrochemical etching of noble metal wires are still preferred to characterise biomolecules. This is due to the cost, specific expertise, and long fabrication times that are often required for more sophisticated preparation methods. Despite some tip-to-tip performance variably using these metallization and etching methods, they can provide relatively cheap and efficient TERS probes with SOR down to the sub-nanometre scale.13
The morphology of the metal at the tip apex is crucial to reach a high SOR. The SOR typically improves with decreasing curvature radius of the tip apex. The light confinement is therefore increased, and the size of the near-field region is reduced. The presence of atomic-scale metal features at the tip end can even lead to a sub-nanometre SOR.13 However, nanoscale SOR requires tip-sample distances of a few nanometres that can be controlled through the SPM feedback mechanism. The apparent SOR degrades as tip-sample distance increases due to the enlarged size of the near-field region. In brief, the SOR is mainly governed by two factors: (1) the dimensions of the metal nanostructure at the tip end and (2) the nanoscale tip-sample distance. The high SOR achieved in TERS allows for the fine chemical characterization of large biomolecules and biomaterials that are heterogeneous at the nanoscale (Table S1 in ESI†). Each sample area, as small as 1 nm2, can thus present a TERS spectrum that is different from other neighbouring regions due to their distinct chemical groups and/or molecular orientations. Two different adjacent molecules of a compactly assembled network can be distinguished from each other for example.11 This chemical and structural sensitivity is at the origin of the dissimilar line shapes of TERS and unenhanced Raman spectra.
2.3 Sample preparation
Samples can be deposited on various substrates depending on the type of SPM technique included in the TERS system. In STM, it is mandatory to have a substrate made of a conductive material, particularly Au, Ag, or Cu. An optically opaque substrate can also be used (e.g. clean Au-coated Si/SiO2 wafers, Au or Ag single crystals).8,11,14–17 Gold is often preferred due to its chemical stability and the additional electromagnetic enhancement (>106) that it can generate. It has been established that the resonant excitation of a TERS tip induces a dipole at the tip apex. When the tip-substrate distance falls below 1–2 nm typically, mirror charges accumulate at the surface of the substrate, which forms an image dipole. The coupled system between these two dipoles results in an additional enhancement. This coupled system depends on the plasmonic properties of the tip and substrate materials, and can show plasmon resonances that differ from the LSPR of the TERS tip alone. As it requires a very small gap (∼1 nm) between the tip and the substrate, it is referred to as “gap mode”.3,14 Gold substrates lead to the most efficient coupling with Au and Ag tips, although other metals (e.g. Ag, Cu, Al, Pd, Pt, Ni, Cr, Ti, Mo and W) have been tested.14 The high electromagnetic enhancement in “gap mode” can allow the reduced photon collection in side- and top-illumination configurations to be largely compensated. However, to optimally exploit the “gap-mode” enhancement, the sample thickness should be limited to 2 nm at maximum. This latter constraint limits the applicability of “gap-mode” TERS in biology although single biomolecules and nanoscale biomaterials can be characterized.11,12,15–17 The sample deposition onto metal STM substrates is typically based on direct solution drop-casting, microcontact printing of a biomolecule-impregnated stamp (followed by rinsing and drying in a flow of argon or nitrogen gas), or on transferring Langmuir–Blodgett films.2,15,16In AFM, an insulating material is perfectly suitable as substrate, although gold films have also been employed in “gap-mode” configuration.9,12,18–46 Generally, properly clean glass coverslips and freshly cleaved mica slides are selected. The hydrophilicity of glass substrates can be increased to favour the dispersion of liquid samples at their surface and sometimes certain molecular orientations.10 This can be achieved by means of UV-ozone treatment or by molecular functionalization. An increased hydrophobicity of glass or mica substrates via silanization or the use of cationic bridges on negatively charged mica, can also allow for a convenient separation and immobilization of long macromolecules.22 In any case, the concentration, the pH, the temperature and the buffer composition of sample solutions are crucial to obtain well-separated and stretched structures, and/or to minimize their aggregation after deposition. The solution containing biomolecules is deposited by drop-casting or spin-coating onto the clean (and possibly modified) AFM substrate, and finally dried under a flow of argon or nitrogen gas.
More details on the sample preparation for each type of biomolecules and biomaterials described in Sections 3–6 are given in Table S2 in ESI.†
2.4 TERS spectra acquisition
Many TERS experiments on biomolecules are single point measurements. The TERS tip is placed at a fixed position in a sample area preliminarily mapped by SPM imaging. Since biomolecules exhibit very low Raman scattering cross-sections, the spectral acquisition time needs to be relatively long (5–15 s). The collected signal is composed of two contributions; namely, the enhanced molecular Raman bands of the nanoscale sample region excited in the near field, and the far-field Raman background from the sample area irradiated by the entire incident laser spot. These single point TERS experiments were performed largely due to technical limitations related to the stability of TERS instruments and tips.Progressive advances in TERS instrumentation and tip manufacturing has allowed however, the development of TERS imaging with similar acquisition times.11,12 In this case, the area of interest is first scanned by SPM, and a grid of points is defined on the SPM image. During the image acquisition, single point measurements are successively performed while the SPM feedback is preserved. Each point measurement is linked to a pixel, and imaging proceeds by raster scanning of the whole point grid. A practical way to perform TERS imaging consists in moving accurately the SPM stage by means of piezo scanners and keeping the TERS tip fixed, to avoid any tip-laser misalignment (Section 2.6). For TERS imaging, the integration time per pixel can be shortened if the TERS system has an electron multiplying CCD (EMCCD) detector with efficient photon counting. This type of detector is especially advantageous when acquisition times lower than 1 s are sufficient to observe TERS bands above the noise level. This is the case for biomolecules that can be resonantly excited in the visible range (e.g. cytochrome c, Section 4.3) and for highly enhancing TERS tips. In fact, the size of a TERS image, i.e. the number of image pixels, should be selected by considering not only the detector performances but also the efficiency and lifetime of the TERS tip.
2.5 Practical issues in TERS
2.6 Experimental protocol for TERS imaging measurements
For clarity, a side-illumination AFM system with a sample stage moving in the X and Y directions, and a fixed tip (with a single degree of freedom along the vertical Z direction) is considered in this section, but the described experimental procedure could be adapted to other SPM configurations. Four main steps can be identified:(1) the preparation of a convenient sample (Section 2.3).
(2) the preparation of a fresh TERS tip (Section 2.2), and its mounting on the AFM probe holder that is connected afterward to the AFM head.
(3) the alignment of the TERS system which can be decomposed into seven successive tasks:
(i) the verification of the correct calibration of the Raman spectrometer and its convenient alignment with the detection optics, via checking the wavenumber and intensity of a Si reference sample,
(ii) the visual alignment of the AFM tip and the sample,
(iii) the automatic alignment of the AFM laser on the tip cantilever,
(iv) the coarse alignment of the TERS tip apex with the laser spot in the white-light field visualized on a video camera, by adjusting manually the X and Y positioning of the sample stage,
(v) the fine alignment of the TERS tip apex with the laser spot involving the use of two objective piezo scanners (ideally), to map the light scattered by the tip and locate the image pixel with maximal scattered signal (i.e. the “hotspot”),
(vi) the landing of the TERS tip on the sample surface and the realization of height AFM image of the area of interest (generally in tapping mode for biomolecules),
(vii) single point measurement on the sample (Section 2.4) to check whether a TERS signal appear (if not, slightly readjust the tip-laser alignment, or change the TERS tip). The AFM feedback is maintained during the entire tip-laser alignment procedure.
(4) TERS mapping (with adequate acquisition time and image dimensions) by tip raster scanning of the sample by the piezo scanners of the AFM stage (Section 2.4). If the TERS tip is damaged or contaminated during operations, it must be changed (Section 2.5).
The main steps to perform nanoscale chemical imaging using TERS are schematically summarized in Fig. 3. More details can be found in the literature.48
 | ||
| Fig. 3 Schematic representation of the main steps to perform a TERS imaging experiment. | ||
2.7 TERS data processing
The traditional methodology to process TERS spectra has long been based on picking marker bands of interest, and comparing their wavenumbers with Raman and SERS reference data from the literature for interpretation purposes. The advent of TERS imaging of complex biological systems, for which TERS spectra contain a plethora of bands, made this approach inappropriate (albeit not obsolete) for two main reasons: (i) the large amount of spectra collected per TERS map that renders the peak-picking procedure very time-consuming and (ii) the potential omission of valuable information when restraining interpretations to specific vibrational modes. In order to process numerous spectra of TERS maps, chemometric methods, based on a spectral unmixing algorithm (SUA), principal component analysis (PCA), hierarchical cluster analysis (HCA), multivariate curve resolution (MCR), partial least-squares-discriminant analysis (PLS-DA), and linear discriminant analysis (LDA) have been proposed by several research groups.12,18–26 These methods are based on unsupervised learning algorithms that search for correlations between spectra of an unlabelled dataset. They have allowed for TERS spectra to be classified and the spatial distribution of various contributions associated with specific biomolecules (proteins, amino acids, lipids, and carbohydrates) and chemical groups (e.g. OH, CH3, CH2, C![[double bond, length as m-dash]](https://www.rsc.org/images/entities/char_e001.gif) O) to be determined with nanoscale SOR. They significantly improved the understanding of the investigated systems. However, multivariate analysis of TERS spectra can be quite challenging with these classical data processing methods due to the high variability of TERS band intensities as a function of the molecular orientation and the metal nanostructures at the TERS tip apex. Many chemometric methods are not convenient for certain datasets. This explains why distinct methods have been used by authors probing similar biomolecules and biomaterials. More systematic processing of TERS spectra would require the development of novel sophisticated algorithms. These have to take into account intensity and wavenumber ranges to define at least TERS bands relevant to describe the sample composition and structure, for example. In any case, the multivariate analysis of TERS spectra will always require the proper control of all experimental conditions to rule out any possible sample degradation or contamination that can affect the quality of the processed dataset.
O) to be determined with nanoscale SOR. They significantly improved the understanding of the investigated systems. However, multivariate analysis of TERS spectra can be quite challenging with these classical data processing methods due to the high variability of TERS band intensities as a function of the molecular orientation and the metal nanostructures at the TERS tip apex. Many chemometric methods are not convenient for certain datasets. This explains why distinct methods have been used by authors probing similar biomolecules and biomaterials. More systematic processing of TERS spectra would require the development of novel sophisticated algorithms. These have to take into account intensity and wavenumber ranges to define at least TERS bands relevant to describe the sample composition and structure, for example. In any case, the multivariate analysis of TERS spectra will always require the proper control of all experimental conditions to rule out any possible sample degradation or contamination that can affect the quality of the processed dataset.
3. TERS of nucleic acids
Deoxyribonucleic acid (DNA) and ribonucleic acid (RNA) are the two main nucleic acid macromolecules in living organisms. DNA carries the genetic information encoded by two purine (adenine A and guanine G) and two pyrimidine (cytosine C and thymine T) nucleobases. RNA acts as an intermediate support for genetic information and controls synthesis of many proteins. It can also be involved in the catalysis of biological reactions. RNA is composed of four nucleobases (adenine, guanine, and cytosine like DNA, and uracil U). In DNA and RNA, nucleobases are bound to a sugar-phosphate backbone forming single-stranded (ss) or double-stranded (ds) structures. In particular, dsDNA can adopt three different double-helical conformations depending on the local environment: (i) the native right-handed B form, (ii) the right-handed A form thicker than the B form, and (iii) the left-handed Z form. The molecular sensitivity of TERS has thus been exploited to describe the composition and conformation of DNA and RNA structures.3.1 Chemical characterization
After preliminary studies on adenine monolayers and single crystals,2 adenine, cytosine, and uracil homopolymers were characterized by TERS as benchmark samples.9,27 These were used to identify the specific Raman signature of nucleobases (e.g. TERS bands assigned to ring breathing vibrations in the 600–800 cm−1 range),2 deoxyribose, and phosphate groups (e.g. TERS bands assigned to O–P–O and PO2− stretching vibrations in the 800–1300 cm−1 range)2 in calf thymus ssDNA immobilized on a mica substrate.27 Subsequent investigations of dsDNA22 confirmed these first assignments and proved, in combination with AFM measurements, the occurrence of a substrate-induced conformational transition from the B form to the A form.22 This structural change was linked to the strength of chemical interactions between DNA strands and the substrate. For B-form DNA deposited on silanized mica, the strong DNA-surface bonding prevented any B-to-A conformational transition. However, for B-form DNA immobilized on mica by divalent cation (Mg2+ and Mn2+) bridges between the negatively charged mica surface and phosphate groups of the DNA backbone, a partial conformational transition to the A form was revealed by intensity, wavenumber and band breadth changes of TERS bands assigned to phosphate groups. This local conformation modification was mainly observed at the ends of DNA strands and was associated with a weaker DNA-cation bonding with respect to its DNA-silane counterpart. Finally, TERS was also used to probe dsDNA damage, and especially the presence of deadly lesions called double-strand breaks following ultraviolet C (UVC) exposure.21 Double-strand breaks appeared as bond cleavages at DNA deoxyribose units. These were related to the preferential attack of CO bonds of the DNA backbone by UVC-induced free radicals (HO˙ and H˙), leading to structures with terminal CH3 groups on deoxyribose rings and/or OH terminated phosphate groups that showed typical TERS signatures.213.2 DNA and RNA sequencing
One major challenge in the TERS technique lies in its ability to perform single-molecule detection with nanoscale SOR. In this context, TERS was proposed a decade ago as a promising tool to achieve label-free DNA and RNA nucleobase sequencing, by probing first a cytosine ssRNA homopolymer.9 A robust TERS sequencing methodology for RNA is of particular interest, since standard techniques relying on RNA isolation, reverse transcription and amplification before sequencing are quite time-consuming and error-prone. The pioneering study on the cytosine homopolymer9 had the merit of considering the different factors that can affect TERS signals, such as the molecular orientation, tiny tip-sample distance changes from one position on the strand to the next, and electromagnetic-field gradients. It was however unable to demonstrate the possibility to distinguish distinct neighbour purine and pyrimidine nucleobases that are known to have quite different Raman cross-sections, with the highest observed for adenine and the lowest for thymine. Furthermore, the 10–20 nm SOR was quite large compared with the 0.34 nm distance between two adjacent nucleobases on a DNA strand. Several other TERS experiments were thus conducted to clarify and improve TERS performances for base sequencing. The fingerprint of the 4 nucleobases was detected on calf thymus ssDNA and other DNA specimens with SOR down to ∼8 nm.2,27 In these examples, the SOR remained inadequate to decipher chemical information with single-molecule resolution.The first demonstration of the single-base sensitivity of TERS was not realized by investigating DNA or RNA strands, but rather a molecular network composed of adenine and thymine thermally evaporated onto a clean Ag substrate.11 In this case, unusual marker bands at ∼680 cm−1 for adenine and ∼880 cm−1 for thymine were observed. This is due to TERS selection rules and possible molecular interactions with the tip and the Ag substrate. Nevertheless, single adenine and thymine bases could be clearly discriminated thanks to the unprecedented 0.9 nm lateral SOR that was reached.11 At this point, it is notable that: (i) this value was much lower than the typical 10–30 nm curvature radius of TERS tip apexes probably due to the presence of some atomic-scale metal feature13 at the tip end that drastically increased the electromagnetic field confinement and improved the resulting SOR; (ii) this value was low enough to achieve single base detection because the distance between two adjacent nucleobases was close to the SOR.
To date, only one research group reported proof-of-principle TERS-based label-free DNA and RNA sequencing. This was achieved by collecting TERS spectra along a phage ssDNA28 and a CRISPR-associated protein 9 ssRNA29 molecule with 0.5 nm steps (Fig. 4A–C). The procedure was quite challenging for several reasons: (i) it required the preparation of Mg2+-bridged linear (uncoiled) DNA or RNA strands on Au substrate to exploit the high electromagnetic enhancement in “gap-mode” configuration while the TERS tip is in contact with the sample, (ii) the TERS tip must show atomic-scale features to allow for single-molecule detection, (iii) short pixel integration times were necessary to limit the tip-sample drift that could be large for long-time contact with the sample at ambient temperature, (iv) the TERS technique may generate some sample heating and lead to thermally induced spectral shifts of TERS bands at ambient conditions, and (v) the confined electromagnetic field could excite several nucleobases. Using an in-house coefficient correlation method, a comparison of the real DNA and RNA sequences with those deduced from TERS revealed however a sequencing accuracy of ∼90%. This demonstrated single-base resolution despite different TERS signatures for nucleobases observed in the DNA and the RNA specimens.28,29 Albeit in its infancy, this TERS-based sequencing method can be potentially applied to the study of other biopolymers, such as polysaccharides and polypeptides.
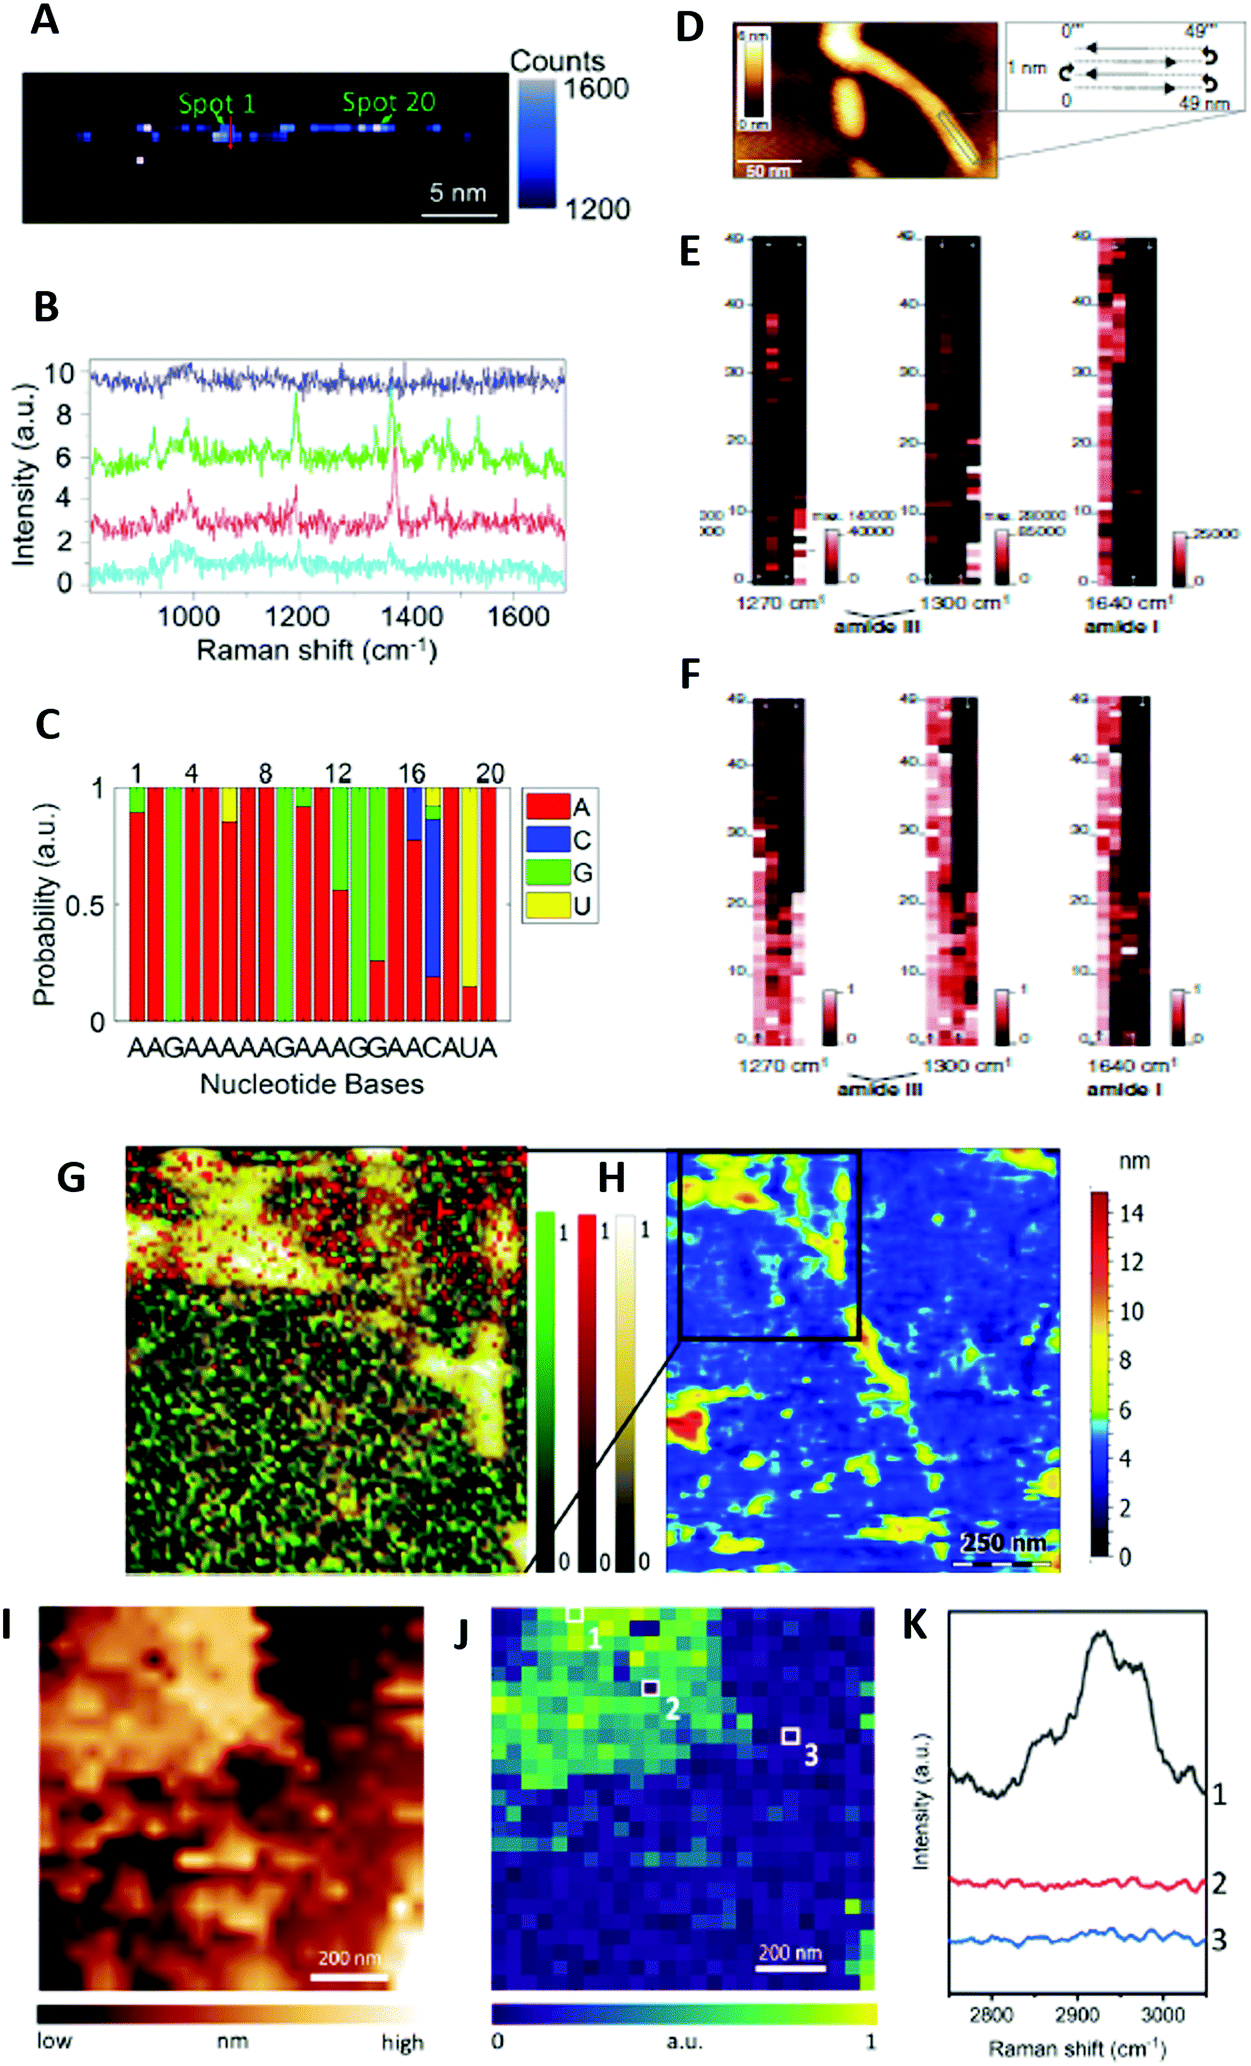 | ||
| Fig. 4 (A–C) TERS of RNA: (A) TERS image plotting the integral intensity of the TERS peak at 1370 cm−1 attributed to A, G, U and C nucleobases (0.5 nm scanning step size); (B) four TERS spectra along the red arrow drawn in panel A; (C) measured sequence from spot 1 to spot 20 along the strand drawn in panel A, with the most probable bases labelled at the bottom. This sequence is globally consistent with the genuine RNA sequence AAGAAAAAGAAAGGAUCCUA, except at spots 16 and 18 where an A nucleobase is identified instead of U and C, respectively. Adapted with permission from Z. He et al., ACS Photonics, 2021, 8, 424–430. Copyright (2021) American Chemical Society. (D–F) TERS of an insulin amyloid fibril: (D) AFM topography image of a fibril; (E) TERS maps of the region indicated in panel D from fitted amide I and amide III band intensities, with pixel brightness proportional to band intensity (1 nm scanning step size); (F) corresponding TERS maps obtained from a SUA analysis. Adapted with permission from T. Deckert Gaudig et al., Sci. Rep., 2016, 6, 33575. Copyright (2016) Springer Nature Group. This work is licensed under the Creative Commons Attribution 4.0 International Licence (https://creativecommons.org/licenses/by/4.0/). (G and H) TERS of Aβ1–42 aggregates: (G) distribution of TERS spectra indicating the presence of mainly unstructured coils/turns (green), antiparallel β-sheet (red) and parallel β-sheet (yellow) secondary structures in a representative sample, containing various Aβ1–42 aggregates (∼6 nm scanning step size). The distributions of normalised values of the Pearson correlation coefficients between three marker TERS spectra are represented and superimposed on the AFM topography image. (H) Overview AFM topography of the same sample. Adapted with permission from E. Lipiec et al., Angew. Chem., Int. Ed., 2021, 60, 4545–4550. Copyright (2021) Wiley-VCH GmbH. (I–K) TERS of a DPPC supported lipid monolayer: (I) STM topography image of a DPPC monolayer region; (J) TERS image of the C–H stretching intensity measured in the area shown in panel I (40 nm scanning step size); TERS spectra measured at locations 1–3 marked in panel J. No TERS signal is observed at position 3 (outside the DPPC monolayer) and position 2 that corresponds to a nanoscale hole in the DPPC monolayer. Adapted with permission from Y. Pandey et al., Angew. Chem., Int. Ed., 2021, 60, 19041–19046. Copyright (2021) Wiley-VCH GmbH. | ||
4. TERS of proteins and peptides
Peptides are amino acid polymers in which monomer units are linked together by amide bonds between carboxyl and amine functional groups of two amino acids. In contrast, proteins are large biomolecules comprising of at least one polypeptide chain that has typically undergone post-translational modifications§ and folding into a three-dimensional structure. They are responsible for vital biological processes and pathways in living organisms. Their activity is determined by their folding and performed by specific binding to form functional complexes. In TERS, the spectral characterization of proteins/peptides focuses on the determination of their primary structure (i.e. their amino acid sequence) and secondary structure that reflects the protein folding, into β sheets and α helices for instance, or their structural disorder.4.1 Protein primary structure: probing amino acid residues
Aromatic amino acid residues (histidine His, phenylalanine Phe, tryptophan Trp and tyrosine Tyr) lead to the most intense and frequent TERS bands owing to the high Raman scattering cross-sections of ring vibrational modes in their aromatic side chains. The presence of Phe and Tyr residues is typically revealed by ring breathing modes centred at ∼1000 cm−1 and ∼850 cm−1, respectively.2 The unambiguous identification of His and Trp can be harder in the presence of multiple amino acids and thus require the study of several vibrational modes.2,18 Note that the molecular orientation of the aromatic ring is crucial to observe corresponding TERS marker bands that can simply vanish when the tip axis is perpendicular to the ring plane. Non-aromatic proline (Pro), cysteine (Cys) and methionine (Met) amino acid residues can also be tied to specific vibrational modes, namely the Pro ring stretching vibration at ∼900 cm−1 and C–S stretching vibrations of Cys/Met at ∼670 cm−1 and ∼770 cm−1.30–32 Other amino acid residues are far more difficult to recognize reliably in TERS spectra of proteins where many bands are often observed, although a few reports tentatively assigned TERS bands to some of them.18It is important to mention that the TERS signature is strongly sensitive to the excitation laser fluence. SERS experiments on Trp amino acids revealed indeed a two-step formation of Trp radical anions, through resonant plasmonic excitation of an Au nanoparticle near Trp molecules and subsequent electron capture by free Trp molecules.49 This generated species showing an increased SERS signal with respect to pristine Trp amino acid residues.49 This molecular mechanism could be viewed as a chemical enhancement process. Some light-induced formation of radicals (potentially very different from the probe molecule) in the vicinity of plasmonic nanostructures was also observed in TERS configuration.17
4.2 Protein secondary structure: probing conformations
The secondary protein structure is characterized by several amide bands, such as amide I, amide II, and amide III bands respectively observed in the 1600–1700 cm−1, 1500–1580 cm−1 and 1200–1340 cm−1 spectral ranges.2,12,18 These bands differ by the functional chemical groups involved in the corresponding molecular vibration, with mainly CO stretching for amide I bands, N–H bending and C–N stretching only for amide II bands and mostly for amide III bands.12 However, amide II bands are little studied because their Raman intensity is expected to be weak with respect to amide I and amide III bands and aromatic amino acids may contribute in the same spectral region.2 Most TERS investigations on proteins have therefore focused on the interpretation of amide I and amide III bands, which can be complicated by the absence of amide I bands in TERS spectra.24 In order to clarify the reasons for this missing band, two explanations have been proposed:
(i) By comparing SERS and TERS spectra of native insulin and insulin fibrils with SERS spectra of homopolymer peptides, amide I bands were found to be frequently silent for Phe, Tyr, Pro and His amino acid residues with bulky side chains.33 This hinted that these bulky peptide regions may prevent any close contact between the amide bond and the plasmonic metal surface, thus decreasing the enhancement of this bond. However, this argument cannot explain the recurrent absence of the amide I band in a few TERS studies on proteins24 because it would imply a systematic unfavourable positioning of the bulky side chains for all TERS measurements, which is quite unlikely.
(ii) By increasing progressively the excitation laser fluence irradiating a TERS tip, the disappearance of amide I bands of various peptides and proteins was noted at the highest laser powers. This behaviour was connected with the appearance of peptide/protein fragments similar to those observed by electron transfer dissociation in gas-phase mass spectrometry, where the peptide/protein captures a low-energy (1–2 eV) electron and forms a reactive radical that dissociates. Thus, it suggested the occurrence of a charge-driven process involving the creation of hot carriers in the plasmonic “hotspot” beneath the tip, which should induce the cleavage of peptide backbone bonds.17 However, this non-thermal mechanism alone would not explain the non-systematic presence of amide I bands on certain samples under fixed low laser power irradiations.34
It can be finally mentioned that the Raman intensity of amide I bands can be quite sensitive to the polarization of the excitation light.50 For example, very low intensities of amide I bands assigned to antiparallel β-sheets were observed in a traditional Raman experimental configuration with orthogonal exciting and scattered electric field vectors.50 This was related to the different amide I Raman tensor components in X, Y and Z directions, where X is perpendicular to the β-sheet plane, Z is parallel to the axis of the polypeptide chain, and Y is perpendicular to this axis and in the β-sheet plane. This orientation dependence of amide I bands, together with the distance of amide groups from the TERS tip or their light-induced cleavage should explain the possible absence of amide I bands in TERS spectra of proteins and peptides.
4.3 Haemoproteins
Haemoproteins are metalloproteins containing a haem group that confers them functionality and peptide chains axially bound to the central metal ion of the haem. Several haemoproteins have been studied by TERS, such as cytochrome c (Cc)10,35,36 and haemoglobin (HGb),37,38 for which the TERS signature of some aromatic amino acid residues could be detected.10,35,37 Remarkably, the description of TERS bands assigned to porphyrin¶ vibrational modes allowed for the determination of the oxidation, spin, and ligation states of the central metal ion, that can both affect the haemoprotein activity. More precisely, for Cc, clear TERS marker bands associated with the ferric six-coordinated low-spin (FeIII-6cLS) state were observed in molecular Cc layers10,35 as well as in whole mitochondria.36![[thin space (1/6-em)]](https://www.rsc.org/images/entities/char_2009.gif) || Other ferric and ferrous species in the HS or LS state have also been reported.35,36 Nevertheless, the study of FeIII-6cLS Cc molecules was especially interesting since this state is potentially implicated in cell apoptotic processes. Regarding HGb, both ferric and ferrous haem groups were discerned by TERS in HGb nanocrystals.37 The TERS fingerprint of HGb haem groups was also detected inside hybrid protein nanofibers grown from self-assembly of HGb and human serum albumin (HSA).38 In this case, many porphyrin vibrational modes were reported and the presence of ferric and ferrous centres was demonstrated. As HSA does not contain any haem group, the TERS technique was able to distinguish HGb-rich/HSA-poor and HGb-poor/HSA-rich regions from one another. This is promising for the verification of proper HGb-HSA fibre formation with nanoscale resolution, and ultimately extends the method to other hybrid fibres of interest for biomedical applications.
|| Other ferric and ferrous species in the HS or LS state have also been reported.35,36 Nevertheless, the study of FeIII-6cLS Cc molecules was especially interesting since this state is potentially implicated in cell apoptotic processes. Regarding HGb, both ferric and ferrous haem groups were discerned by TERS in HGb nanocrystals.37 The TERS fingerprint of HGb haem groups was also detected inside hybrid protein nanofibers grown from self-assembly of HGb and human serum albumin (HSA).38 In this case, many porphyrin vibrational modes were reported and the presence of ferric and ferrous centres was demonstrated. As HSA does not contain any haem group, the TERS technique was able to distinguish HGb-rich/HSA-poor and HGb-poor/HSA-rich regions from one another. This is promising for the verification of proper HGb-HSA fibre formation with nanoscale resolution, and ultimately extends the method to other hybrid fibres of interest for biomedical applications.
4.4 Amyloid fibrils
Amyloid fibrils are β-sheet rich protein assemblies with a typical cross-β structure that are prone to form deleterious deposits implicated in various neurodegenerative disorders, such as Alzheimer's disease (AD). Despite many experimental studies, their molecular structure and aggregation mechanisms at the surface of neuronal membranes remain unclear. In TERS, initial research efforts have concentrated on the characterization of amyloid fibrils formed from insulin that is a widely used model protein for the investigation of amyloid formation. Later, amyloid species of interest in AD were examined. This included amyloid-β peptide (Aβ) fibrils at the origin of extracellular amyloid plaques and hyperphosphorylated Tau protein filaments leading to intracellular neurofibrillary tangles.** The detailed analysis of amide III bands revealed that Aβ1–42 and L34T fibrils exhibited parallel β-sheet secondary structures. In contrast, oG37C oligomers clearly showed dominant antiparallel β-sheet secondary structures.34 This conformation difference for various aggregates was corroborated by TERS mapping in a liquid medium at each stage of the fibril maturation process (Fig. 4G and H).12 In this case, the HCA method was used for the efficient analysis of TERS spectra. Changes of the amide I and amide III bands indicated (i) the occurrence of a secondary structure rearrangement from antiparallel β-sheets in protofibrils to parallel β-sheets in mature Aβ1–42 fibrils, and (ii) the presence of mostly unstructured oligomers, showing however, spectral features in line with some antiparallel β-sheet secondary structures.12 In comparison to former TERS mapping experiments in air,24 richer spectral signatures were observed in the liquid medium. However, in dry conditions, the spatial distribution of β-sheets and turns/random coils in Aβ1–42 fibrils, protofibrils and oligomers could be determined by analysing amide III bands.24 While disordered conformations were found to be homogeneously distributed, a linear β-sheet distribution along fibrils but a disordered β-sheet distribution of oligomers and protofibrils were reported. These results point to a slow fibrillogenesis involving the aggregation of monomers into metastable oligomers that rearrange themselves into ordered β-sheets as early as the oligomeric or protofibrillar stage.24
O ester bands were discerned in TERS spectra of K18 + POPC/PIP2 fibrils, which proved the insertion of PIP2 phospholipids within these fibrils. Note that the inclusion of lipid molecules in amyloid fibrils was already reported for fibrils grown on a lipid interface by aggregation of human islet amyloid polypeptide monomers.32 The comparative TERS characterization of K18-based fibrils clearly demonstrated the importance of investigating Tau amyloid fibrils or filaments formed from aggregating agents that can be potentially implicated in human tauopathies, such as AD.
4.5 TERS for ligand-receptor recognition
The specific interaction between a ligand and a protein receptor plays a key role in many biological processes as diverse as the intercellular communication and intracellular signalling. In this context, the TERS fingerprint of peptide-functionalized Au nanoparticles binding with integrin receptors immobilized on surfaces and in cancer cell membranes was determined.25 When the same peptide ligand was attached to the nanoparticles, its interaction with different integrin receptors yields distinct TERS signatures.25 Reciprocally, when different peptide ligands were attached to the nanoparticles, their interaction with the same integrin receptor also lead to distinct TERS signatures.23 These experiments showed that TERS could probe the binding specificity of peptide–integrin systems in intact cell membranes, and more generally drug specificity in the frame of cancer therapy.5. TERS of lipid membranes
Lipid membranes are crucial model systems to better comprehend not only the structure–property relationship inside biological cells but also their interaction with other biomolecules such as proteins. Early TERS characterization on dry phospholipid mixtures revealed the possibility to identify most of the chemical groups of lipids, including ester and phosphate ones,40 albeit not in all experimental conditions.15,16,40 CH stretching and bending vibrations were however more frequently observed than the other vibrations.15,16,40 Therefore, even though CO ester bands could be used as reliable lipid markers,32,39 CH stretching ones were preferentially selected for TERS mapping purposes owing to the intensity of the corresponding TERS bands and their high wavenumber in a spectral region devoid of other spectral contributions.15,16 The very recent TERS imaging of dipalmitoylphosphatidylcholine (DPPC) monolayers on Au substrate was the first clear demonstration of direct correlation of the TERS and topography maps obtained, moreover, without resorting to deuterium labelling of the DPPC lipid molecule (Fig. 4I–K).16 The presence of nanoscale holes in the lipid monolayer was detected with 20 nm SOR. The analysis of the intensity ratio of TERS bands centred at 2850 and 2930 cm−1 in the CH stretch region‡‡ provided information on local variations of the molecular packing order. It evidenced the disruption of the lipid packing order around the holes and spatial variations in the relative orientation of the DPPC monolayer.16 This study has opened fascinating perspectives for the nanoscale chemical imaging of biological membranes using TERS.
6. TERS of complex systems
6.1 Viruses
Viruses are infectious agents that cause numerous diseases such as influenza, Ebola, and COVID-19. They are generally composed of either RNA or DNA enfolded in a protein capsid. Their sub-microscopic size makes them difficult to characterize with conventional diffraction-limited optical spectroscopies, but is adequate for TERS. The TERS technique allowed the composition of DNA and RNA viruses to be described. In two DNA virus strains (the avipoxvirus and the adeno-associated virus)41 and in the tobacco mosaic RNA virus,42 the spectral fingerprint of (DNA or RNA) nucleobases, nucleic acids backbone and (essentially aromatic) amino acid residues of the viral capsid could be identified. Moreover, amide bands reflecting the protein secondary structure could be discerned. TERS was also employed to distinguish viruses with different protein and lipid surface compositions following two distinct approaches. The discrimination of the Porcine teschovirus (PTV) and the varicella zoster virus (VZV) was performed using a chemometric method via the normalization of measured TERS spectra, their background correction and their classification.26 These spectra revealed the presence of a bare protein capsid for PTV virions but that of a capsid surrounded by a proteinaceous tegument and a lipid layer for VZV virions.26 In contrast, the recent discrimination of the H1N1 virus and the coxsackievirus B3 (CB3) was carried out by spectral acquisition during AFM scanning of single viral particles to obtain averaged characteristic TERS spectra for each particle.43 The TERS signatures of a given (H1N1 or CB3) strain were all very similar.43 However, TERS fingerprints of H1N1 and CB3 viruses were markedly different, which was in agreement with their structural dissimilarity. H1N1 virions possess protein capsids surrounded by a lipid bilayer incorporating spike proteins, in contrast to CB3 virions, which have naked protein capsids. The main advantages of this approach lay (i) in the relatively fast sample imaging (5–10 s acquisition time to collect a TERS spectrum averaged over a scanned area of a few tens or hundreds of nanometres on a viral particle) with respect to traditional TERS techniques (∼10 s integration time per pixel), and (ii) in the determination of a reproducible TERS spectrum that is not sensitive to local chemical/structural heterogeneities for each single viral particle. These points would be essential for future clinical applications of TERS.6.2 Cells
Cells are the biological units of all living organisms. They are composed of a membrane containing cytoplasm and many biomolecules such as proteins and nucleic acids. In eukaryotic cells, such as human/animal cells, DNA molecules are enclosed in a nucleus. In prokaryotic cells, such as bacteria that are often unicellular microscopic organisms, DNA is free in the cytoplasm. Note that the Gram-positive bacteria are also enveloped in an additional peptidoglycan layer, which forms a cell wall.O stretching and cholesterol vibrational modes were used as lipid markers.19 This work was the first to demonstrate the possible localization of proteins and lipids with nanoscale accuracy on a cell membrane without cell labelling.
7. Conclusions
Since the advent of TERS in the early 2000's, major technical advances have allowed this challenging technique to become more accessible to a broad audience even though it remains mostly exploited by experts in spectroscopy and/or optics. TERS instruments integrate technologies that render possible reliable nanoscale chemical and structural imaging of biomolecules and biomaterials, even under controlled environment rare cases.11,12 TERS has allowed nucleic acids, proteins, and lipids to be characterized by distinct spectral fingerprint regions. The effective characterization of the molecules constitute the building blocks for the thorough analysis of complex biosystems, such as cells and viruses (Table S1 in ESI†). Nevertheless, many technical hurdles still need to be overcome to really make TERS imaging ubiquitous and more user-friendly for applications in biology.Regarding TERS in air, several biomedical applications such as DNA/RNA sequencing28,29 and whole virus identification26,43 appear very promising. However, specific sample preparation and special TERS tips with atomic-scale features are necessary for DNA/RNA sequencing, which renders the current method difficult for large-scale use as a diagnostic tool. Furthermore, as admitted by the inventors themselves,28,29 TERS signals are quite low and more performant data analysis methods to decipher the genetic information hidden inside Raman spectra with poor signal-to-noise ratio should be developed. Traditional chemometric methods for multivariate analysis of TERS spectra matrices may not be adequate for this purpose. Data processing with novel and effective mathematical and statistical tools would be even more crucial for sequencing other biopolymers such as polysaccharides or polypeptides for which monomer units can have low Raman scattering cross-sections. Concerning the identification of viruses,26,43 it would be very interesting to discriminate TERS signatures of virions associated with distinct strains which have similar bare or lipid-surrounded capsid structures. In fact, more types of viruses should be investigated to compare their TERS signatures and assess the discrimination power of TERS for accurate virus identification.
Regarding the development of TERS imaging in aqueous medium,12 or even in physiologic medium, the main objective would be to investigate molecular mechanisms of biological processes such as the interaction between proteins and cell membranes with nanoscale SOR. This implies not only the nanoscale chemical and structural characterization of lipid microdomains (and even glycolipoprotein lipid rafts) in membranes but also the determination of target lipids as a function of the membrane composition. In the frame of neurodegenerative diseases, a fine study of the interaction between amyloid fibrils and biological membranes would allow a better understanding of the role of fibril polymorphism in the amyloidogenesis, for example. So far, the vast majority of TERS studies have been performed in dry conditions, which can be sufficient as preliminary characterisation of single biomolecules, but is not adequate to probe their biological activity. Several research groups worldwide made and are making efforts to adapt TERS to the liquid environment for applications in biology and catalysis. This also implies the manufacturing of TERS tips allowing for multiple sample scanning in liquid without delamination of the tip metal layer. Several recent reports suggested that noble metal coatings (with additional adhesion and/or capping layers)12,47,48 on commercial AFM probes can be used to fabricate efficient and robust TERS tips for AFM-based TERS systems. These recent progresses are very encouraging for the development of the technique for biological applications.
Given recent scientific progresses in TERS and the efforts deployed by more and more research groups worldwide, fascinating applications in biology with potential impacts in clinical medicine should emerge in the next decade.
Author contributions
Sébastien Bonhommeau, Gary S. Cooney, and Yuhan Huang: visualization, writing – original draft, writing – review & editing.Conflicts of interest
There are no conflicts to declare.Acknowledgements
This work was supported by the ANR project AQUATERS (No. ANR-20-CE29-0004) and the University of Bordeaux.Notes and references
- D. Kurouski, A. Dazzi, R. Zenobi and A. Centrone, Chem. Soc. Rev., 2020, 49, 3315–3347 RSC.
- S. Bonhommeau and S. Lecomte, ChemPhysChem, 2018, 19, 8–18 CrossRef CAS PubMed.
- J. Stadler, T. Schmid and R. Zenobi, Nanoscale, 2012, 4, 1856–1870 RSC.
- T. Schmid, L. Opilik, C. Blum and R. Zenobi, Angew. Chem., Int. Ed., 2013, 52, 5940–5954 CrossRef CAS PubMed.
- J. N. Anker, W. P. Hall, O. Lyandres, N. C. Shah, J. Zhao and R. P. Van Duyne, Nat. Mater., 2008, 7, 442–453 CrossRef CAS PubMed.
- M. Moskovits, D. P. DiLella and K. J. Maynard, Langmuir, 1988, 4, 67–76 CrossRef CAS.
- L. He, M. Langlet, P. Bouvier, C. Calers, C.-M. Pradier and V. Stambouli, J. Phys. Chem. C, 2014, 118, 25658–25670 CrossRef CAS.
- N. Martín Sabanés, T. Ohto, D. Andrienko, Y. Nagata and K. F. Domke, Angew. Chem., Int. Ed., 2017, 56, 9796–9801 CrossRef PubMed.
- E. Bailo and V. Deckert, Angew. Chem., Int. Ed., 2008, 47, 1658–1661 CrossRef CAS PubMed.
- D. Talaga, A. Bremner, T. Buffeteau, R. A. L. Vallée, S. Lecomte and S. Bonhommeau, J. Phys. Chem. Lett., 2020, 11, 3835–3840 CrossRef CAS PubMed.
- R. Zhang, X. Zhang, H. Wang, Y. Zhang, S. Jiang, C. Hu, Y. Zhang, Y. Luo and Z. Dong, Angew. Chem., Int. Ed., 2017, 56, 5561–5564 CrossRef CAS PubMed.
- E. Lipiec, J. Kaderli, J. Kobierski, R. Riek, K. Skirlińska-Nosek, K. Sofińska, M. Szymoński and R. Zenobi, Angew. Chem., Int. Ed., 2021, 60, 4545–4550 CrossRef CAS PubMed.
- S. Trautmann, J. Aizpurua, I. Götz, A. Undisz, J. Dellith, H. Schneidewind, M. Rettenmayr and V. Deckert, Nanoscale, 2017, 9, 391–401 RSC.
- J. Stadler, B. Oswald, T. Schmid and R. Zenobi, J. Raman Spectrosc., 2013, 44, 227–233 CrossRef CAS.
- L. Opilik, T. Bauer, T. Schmid, J. Stadler and R. Zenobi, Phys. Chem. Chem. Phys., 2011, 13, 9978–9981 RSC.
- Y. Pandey, N. Kumar, G. Goubert and R. Zenobi, Angew. Chem., Int. Ed., 2021, 60, 19041–19046 CrossRef CAS PubMed.
- J. Szczerbiński, J. B. Metternich, G. Goubert and R. Zenobi, Small, 2020, 16, 1905197 CrossRef PubMed.
- T. Deckert-Gaudig, D. Kurouski, M. A. B. Hedegaard, P. Singh, I. K. Lednev and V. Deckert, Sci. Rep., 2016, 6, 33575 CrossRef CAS PubMed.
- M. Richter, M. Hedegaard, T. Deckert-Gaudig, P. Lampen and V. Deckert, Small, 2011, 7, 209–214 CrossRef CAS PubMed.
- G. Rusciano, G. Zito, R. Isticato, T. Sirec, E. Ricca, E. Bailo and A. Sasso, ACS Nano, 2014, 8, 12300–12309 CrossRef CAS PubMed.
- E. Lipiec, R. Sekine, J. Bielecki, W. M. Kwiatek and B. R. Wood, Angew. Chem., Int. Ed., 2014, 53, 169–172 CrossRef CAS PubMed.
- E. Lipiec, A. Japaridze, J. Szczerbiński, G. Dietler and R. Zenobi, Small, 2016, 12, 4821–4829 CrossRef CAS PubMed.
- L. Xiao, K. A. Bailey, H. Wang and Z. D. Schultz, Anal. Chem., 2017, 89, 9091–9099 CrossRef CAS PubMed.
- E. Lipiec, D. Perez-Guaita, J. Kaderli, B. R. Wood and R. Zenobi, Angew. Chem., Int. Ed., 2018, 57, 8519–8524 CrossRef CAS PubMed.
- L. Xiao, H. Wang and Z. D. Schultz, Anal. Chem., 2016, 88, 6547–6553 CrossRef CAS PubMed.
- K. Olschewski, E. Kämmer, S. Stöckel, T. Bocklitz, T. Deckert-Gaudig, R. Zell, D. Cialla-May, K. Weber, V. Deckert and J. Popp, Nanoscale, 2015, 7, 4545–4552 RSC.
- R. Treffer, X. Lin, E. Bailo, T. Deckert-Gaudig and V. Deckert, Beilstein J. Nanotechnol., 2011, 2, 628–637 CrossRef CAS PubMed.
- Z. He, Z. Han, M. Kizer, R. J. Linhardt, X. Wang, A. M. Sinyukov, J. Wang, V. Deckert, A. V. Sokolov, J. Hu and M. O. Scully, J. Am. Chem. Soc., 2019, 141, 753–757 CrossRef CAS PubMed.
- Z. He, W. Qiu, M. E. Kizer, J. Wang, W. Chen, A. V. Sokolov, X. Wang, J. Hu and M. O. Scully, ACS Photonics, 2021, 8, 424–430 CrossRef CAS.
- D. Kurouski, T. Deckert-Gaudig, V. Deckert and I. K. Lednev, J. Am. Chem. Soc., 2012, 134, 13323–13329 CrossRef CAS PubMed.
- D. Kurouski, T. Deckert-Gaudig, V. Deckert and I. K. Lednev, Biophys. J., 2014, 106, 263–271 CrossRef CAS PubMed.
- C. C. vandenAkker, T. Deckert-Gaudig, M. Schleeger, K. P. Velikov, V. Deckert, M. Bonn and G. H. Koenderink, Small, 2015, 11, 4131–4139 CrossRef CAS PubMed.
- D. Kurouski, T. Postiglione, T. Deckert-Gaudig, V. Deckert and I. K. Lednev, Analyst, 2013, 138, 1665–1673 RSC.
- S. Bonhommeau, D. Talaga, J. Hunel, C. Cullin and S. Lecomte, Angew. Chem., Int. Ed., 2017, 56, 1771–1774 CrossRef CAS PubMed.
- B.-S. Yeo, S. Mädler, T. Schmid, W. Zhang and R. Zenobi, J. Phys. Chem. C, 2008, 112, 4867–4873 CrossRef CAS.
- R. Böhme, M. Mkandawire, U. Krause-Buchholz, P. Rösch, G. Rödel, J. Popp and V. Deckert, Chem. Commun., 2011, 47, 11453–11455 RSC.
- B. R. Wood, M. Asghari-Khiavi, E. Bailo, D. McNaughton and V. Deckert, Nano Lett., 2012, 12, 1555–1560 CrossRef CAS PubMed.
- C. Helbing, T. Deckert-Gaudig, I. Firkowska-Boden, G. Wei, V. Deckert and K. D. Jandt, ACS Nano, 2018, 12, 1211–1219 CrossRef CAS PubMed.
- D. Talaga, W. Smeralda, L. Lescos, J. Hunel, N. Lepejova-Caudy, C. Cullin, S. Bonhommeau and S. Lecomte, Angew. Chem., Int. Ed., 2018, 57, 15738–15742 CrossRef CAS PubMed.
- R. Böhme, M. Richter, D. Cialla, P. Rösch, V. Deckert and J. Popp, J. Raman Spectrosc., 2009, 40, 1452–1457 CrossRef.
- P. Hermann, A. Hermelink, V. Lausch, G. Holland, L. Möller, N. Bannert and D. Naumann, Analyst, 2011, 136, 1148–1152 RSC.
- D. Cialla, T. Deckert-Gaudig, C. Budich, M. Laue, R. Möller, D. Naumann, V. Deckert and J. Popp, J. Raman Spectrosc., 2009, 40, 240–243 CrossRef CAS.
- V. Deckert, T. Deckert-Gaudig, D. Cialla-May, J. Popp, R. Zell, S. Deinhard-Emmer, A. V. Sokolov, Z. Yi and M. O. Scully, Proc. Natl. Acad. Sci. U. S. A., 2020, 117, 27820–27824 CrossRef CAS PubMed.
- U. Neugebauer, P. Rösch, M. Schmitt, J. Popp, C. Julien, A. Rasmussen, C. Budich and V. Deckert, ChemPhysChem, 2006, 7, 1428–1430 CrossRef CAS PubMed.
- T. Deckert-Gaudig, R. Böhme, E. Freier, A. Sebesta, T. Merkendorf, J. Popp, K. Gerwert and V. Deckert, J. Biophotonics, 2012, 5, 582–591 CrossRef PubMed.
- M. Watkins-Mariani, T. Deckert-Gaudig and V. Deckert, Anal. Bioanal. Chem., 2014, 406, 6993–7002 CrossRef CAS PubMed.
- Y. P. Huang, S. C. Huang, X. J. Wang, N. Bodappa, C. Y. Li, H. Yin, H. S. Su, M. Meng, H. Zang, B. Ren, Z. L. Yang, R. Zenobi, Z. Q. Tian and J. F. Li, Angew. Chem., Int. Ed., 2018, 57, 7523–7527 CrossRef CAS PubMed.
- N. Kumar, B. M. Weckhuysen, A. J. Wain and A. J. Pollard, Nat. Protoc., 2019, 14, 1169–1193 CrossRef CAS PubMed.
- S. Sloan-Dennison, C. M. Zoltowski, P. Z. El-Khoury and Z. D. Schultz, J. Phys. Chem. C, 2020, 124, 9548–9558 CrossRef CAS PubMed.
- M. Tsuboi, Y. Kubo, K. Akahane, J. M. Benevides and G. J. Thomas Jr, J. Raman Spectrosc., 2006, 37, 240–247 CrossRef CAS.
Footnotes |
| † Electronic supplementary information (ESI) available. See DOI: 10.1039/d1cs01039e |
| ‡ Surface plasmons are quantum quasi-particles associated with elementary excitations of plasma charge density oscillations at the interface between a metal and a dielectric material. |
| § A post-translational modification is a covalent and often enzymatic modification of a protein after its biosynthesis or during its life in a cell. |
| ¶ A haem group is composed of a central metal ion (iron for cytochrome c and haemoglobin) surrounded by an equatorial porphyrin ligand. |
| || The role of cytochrome c (Cc) is to transfer electrons between Cc reductase and Cc oxidase enzyme complexes that are both embedded in the mitochondrial membrane. The detection of Cc on mitochondria was thus expected. |
| ** L34T and oG37C mutants were synthesized by replacing the leucine (L) amino acid residue by threonine (T) at position 34 of the Aβ1–42 peptide and the glycine (G) residue by cysteine (C) at position 37. |
| †† Tau has the major physiological role to stabilize microtubules in neurons. The K18 region corresponds to the crucial microtubule-binding domain of Tau. In AD, the abnormal phosphorylation of Tau produces microtubule disorganization by reducing the binding capacity of Tau. This results in the formation of Tau neurofibrillary tangles. |
| ‡‡ TERS bands centred at 2850 and 2930 cm−1 are related to the methylene symmetric stretch of lipid chains and the Fermi resonance linked to the terminal methyl symmetric stretch and the CH bending mode, respectively. |
| §§ Bacteriorhodopsin is a small protein that acts as a proton pump using light energy to produce a proton gradient across the cell membrane. |
| This journal is © The Royal Society of Chemistry 2022 |