
 Open Access Article
 This Open Access Article is licensed under a
 Creative Commons Attribution 3.0 Unported Licence
Competition between ultralong organic phosphorescence and thermally activated delayed fluorescence in dichloro derivatives of 9-benzoylcarbazole†
Amir
Sidat
,
Federico J.
Hernández
 ,
Ljiljana
Stojanović
,
Alston J.
Misquitta
and
Rachel
Crespo-Otero
*
,
Ljiljana
Stojanović
,
Alston J.
Misquitta
and
Rachel
Crespo-Otero
*
School of Physical and Chemical Sciences, Queen Mary University of London, London, UK. E-mail: r.crespo-otero@qmul.ac.uk
First published on 24th November 2022
Abstract
Optoelectronic materials based on metal-free organic molecules represent a promising alternative to traditional inorganic devices. Significant attention has been devoted to the development of the third generation of OLEDs which are based on the temperature-activated delayed fluorescence (TADF) mechanism. In the last few years, several materials displaying ultra-long organic phosphorescence (UOP) have been designed using strategies such as crystal engineering and halogen functionalisation. Both TADF and UOP are controlled by the population of triplet states and the energy gaps between the singlet and triplet manifolds. In this paper, we explore the competition between TADF and UOP in the molecular crystals of three dichloro derivatives of 9H-carbazol-3-yl(phenyl)methanone. We investigate the excited state mechanisms in solution and the crystalline phase and address the effects of exciton transport and temperature on the rates of direct and reverse intersystem crossing under the Marcus–Levich–Jortner model. We also analyse how the presence of isomeric impurities and the stabilisation of charge transfer states affect these processes. Our simulations explain the different mechanisms observed for the three derivatives and highlight the role of intramolecular rotation and crystal packing in determining the energy gaps. This work contributes to a better understanding of the connection between chemical and crystalline structures that will enable the design of efficient materials.
1 Introduction
Solid-state organic phosphorescence can be exploited to achieve high quantum efficiencies and ultralong emission lifetimes allowing for applications in organic light-emitting diodes (OLEDs), anti-counterfeiting, photovoltaic cells, solid-state lasers and molecular sensing.1–3 However, the design of phosphorescence metal-free organic materials is challenging because of the small spin–orbit coupling (SOC) which limits the efficiency of intersystem crossing (ISC).4 Different strategies can be implemented to enhance SOCs in metal-free organic molecules including crystal engineering, halogenation (heavy atom effect) and incorporation of carbonyl groups (n–π* transitions, El Sayed rule).5The realisation of room temperature phosphorescence (RTP) of metal-free crystals has opened up new avenues for engineering efficient solid-state devices displaying long-lived excited states.6 The spin-forbidden nature of phosphorescence results in emission times of the order of ms that can be extended even further to the order of seconds in the systems that show ultralong organic phosphorescence (UOP), a type of persistent emission.7–9 Some of the mechanisms associated with UOP are the stabilisation of H-aggregates, halogen–halogen interactions and the formation of charge transfer states in the presence of isomeric impurities.10 Thermally activated delayed fluorescence (TADF) is the working mechanism for the third generation of OLEDs.11 Like RTP, TADF is controlled by the population of triplet states and the energy gaps to the singlet manifold and consequently is a competing process. Understanding the mechanism that modulates the lifetime across systems and the role of the crystal structure and intermolecular interactions is essential to propose design principles, thus aiding with computational screening.12
In recent experimental work, Huang et al. investigated double chlorinated derivatives of (9H-carbazol-9-yl)(phenyl)methanone (Fig. 1, 24CPhCz: (9H-carbazol-9-yl) (2,4dichlorophenyl) methanone, 34CPhCz: (9H-carbazol-9-yl) (3,4-dichlorophenyl) methanone, and 35CPhCz: (9H-carbazol-9-yl) (3,5-dichlorophenyl) methanone).12,13 In solution, these compounds exhibit near-identical photoluminescence spectra. This suggests that, despite their different substitution patterns, the position of the halogen atom does not change the electronic structure appreciably across the series. In contrast, the excited state deactivation mechanisms registered for this series in their crystal form are markedly different. 24CPhCz exhibits UOP, 34CPhCz UOP and TADF and 35CPhCz only shows TADF.13 This drastic crystallization-induced effect has been interpreted as originated by the presence or absence of intermolecular interactions between moieties of carbazole.13 However, the excited state mechanisms triggered by light and their differences in the crystals have not been understood yet.
 | ||
| Fig. 1 Dichloro derivatives of (9H-carbazol-9-yl)(phenyl)methanone investigated in this work. | ||
In this paper, we examine the excited state mechanisms underlying the UOP and TADF to untangle the role of competing factors including intermolecular interactions and crystal packing. We first analyse the absorption and emission spectra in the solution and the crystal and compare our results to the experiment. We analyse the crystal packing by obtaining all the different dimers present in the crystal structure and studying their structural conformation, the molecular regions of higher interaction, their H/J-aggregate classification and their exciton coupling values. We then examine the excited state mechanisms by computing the potential energy surfaces and the SOCs for the critical points on the PES. We also calculate the rate coefficients for emission, ISC and rISC to gain a qualitative estimate of the emission lifetimes. This work provides a better understanding of the role of 3D structure and intermolecular interactions in the competition between UOP and TADF mechanisms impacting the design of new efficient organic materials.
2 Computational details
We modelled the excited states of 24CPhCz, 34CPhCz and 35CPhCz in vacuum, solution and crystal. We optimised these three systems in the ground electronic state (S0) and the excited states S1, S2, T1 and T2 in vacuum. Absorption energies in a solution of dichloromethane (ε = 8.93) were computed using the integral equation formalism variant of the polarizable continuum model (IEFPCM). These calculations were performed at the TD-ωB97X-D/6-311++G(d,p) level of theory with Gaussian 16.14 Charge transfer states (CT) were optimised in a solution of DCM with TD-ωB97X-D/6-311++G(d,p) using the Constrained DFT (CDFT) method as implemented in Q-Chem.15 While TD-ωB97XD can describe CT states, CDFT allows us to obtain pure diabatic CT states facilitating the process of state characterisation and geometry optimisation. We also performed single point computations using the resolution of identity coupled cluster (RI-CC2) and ADC(2) methods with the TZVP basis set, as implemented in Turbomole.16 All oscillator strengths reported are computed at the same level of theory as their corresponding energy, denoted by the symbol f.The crystal structures of 24CPhCz (CCDC: 1875547), 34CPhCz (CCDC: 1875548) and 35CPhCz (CCDC: 1875549) were optimised with periodic DFT using the PBE-D2 functional as implemented in Quantum Espresso.17 A Monkhorst–Pack k-point grid was chosen to match the unit cell parameters of each system (2 × 1 × 2, 2 × 2 × 1 and 2 × 1 × 1 respectively) with a basis set cutoff of 50 Ry.
The excited states in the molecular crystals were simulated using cluster models applying the ONIOM(QM:QM') embedding formalism (OEC) implemented in fromage.18,19 The QM region included either one or two molecules with the energies evaluated at the TD-ωB97X-D/6-311++G(d,p) level of theory with electrostatic embedding. For the models with monomers in the QM region, the geometries were obtained at the same level of theory, while for the dimers the geometries were optimised with TD-ωB97X-D/6-31G(d). The QM' regions were modelled using the density functional tight-binding formalism as implemented in the DFTB+ package.20 For the monomers, the QM' regions included 13 to 15 molecules. For the dimers, 19 to 22 molecules were considered. The QM regions were embedded in restrained electrostatic potential (RESP) charges obtained at the high level of theory, and PBE/6-31G(d) charges for the low level of theory. For 24CPhCz, the effect of the long-range electrostatic interactions was addressed using the ONIOM Ewald Embedded Cluster model (OEEC).18 To estimate the volume available for each molecule in the crystal phase, we compute the Voronoi volumes, as implemented in fromage.19
The radiative rate coefficients for fluorescence and phosphorescence were obtained by using Fermi's golden rule, which describes the transition rate between an initial “i” and final “f” state as:21
 | (1) |
![[small mu, Greek, circumflex]](https://www.rsc.org/images/entities/i_char_e0b3.gif) is the electric transition dipole moment operator. To the best of our knowledge, the experimental refractive indexes of these crystals have not been reported yet, we therefore used the value reported for pure carbazole crystals, η = 1.8.22 For fluorescence, 〈Ψi||Ψf〉 = 〈S1||S0〉 was computed with Gaussian 16. In the case of phosphorescence, the Dalton program23 was used to approximate 〈Ψi||Ψf〉 = 〈T1||S0〉 in the gas phase using multi-configurational quadratic response theory. This approach overcomes the convergence issues found when using first-order perturbation theory where the probability of phosphorescence is borrowed from spin-allowed transitions.24,25
is the electric transition dipole moment operator. To the best of our knowledge, the experimental refractive indexes of these crystals have not been reported yet, we therefore used the value reported for pure carbazole crystals, η = 1.8.22 For fluorescence, 〈Ψi||Ψf〉 = 〈S1||S0〉 was computed with Gaussian 16. In the case of phosphorescence, the Dalton program23 was used to approximate 〈Ψi||Ψf〉 = 〈T1||S0〉 in the gas phase using multi-configurational quadratic response theory. This approach overcomes the convergence issues found when using first-order perturbation theory where the probability of phosphorescence is borrowed from spin-allowed transitions.24,25
The rate constants for the nonradiative electron transfer processes ISC, reverse ISC (rISC) and exciton transfer were estimated under the semiclassical derivation for electron transfer processes in the nonadiabatic limit as:
 | (2) |
Exciton transfer was modelled considering eqn (2) in the limit of high temperatures as:
 | (3) |
For the exciton coupling process, the energy gap between the initial i and the final f states ΔEif was obtained following Englman & Jortner's formulation of unimolecular radiationless transitions.26 The strong coupling case was considered with ΔEif = (ΔEadif + λif)2/4λif, where ΔEadif is the adiabatic energy separation at the minimum of the two potential energy surfaces. We considered ΔEadif = 0 as the exciton hopping occurs within a homodimer (donor and acceptor are chemically identical), and we neglect any energy difference caused by the environment. The coupling terms Hif are the exciton couplings (Jif) that were evaluated using the diabatisation scheme devised by Troisi and Aragó,27 as implemented in fromage. A more detailed explanation of the algorithm used is provided in ref. 27 and its implementation in fromage is described in reference 19.
As we are interested in the exciton transport associated with one molecule going from S1 to S0 and a neighbouring molecule evolving in the opposite direction, the total reorganisation energy (λ) is obtained as the sum of both reorganisation processes:
| λ = λS0→S1 + λS1→S0 | (4) |
= ES1(Rmin![[thin space (1/6-em)]](https://www.rsc.org/images/entities/char_2009.gif) S0) − ES1(RminS1) +ES0(RminS1) − ES0(RminS0), S0) − ES1(RminS1) +ES0(RminS1) − ES0(RminS0), | (5) |
S0) and ES1(RminS1) are the excited state energies at the S0 and S1 minima respectively, while ES0(RminS0) and ES0(RminS1) are the ground state energies at the S0 and S1 minima respectively.
For (r)ISC, we used eqn (2) to investigate the dependence of k(r)ISC with temperature under the Marcus–Levich–Jortner (MLJ) model as implemented in ref. 28. In the MLJ model, the high-frequency modes (ħωk ≫ kBT) with appreciable Huang–Rhys (HR) factors are considered as quantum promoting modes of the ET process and grouped into an effective quantum vibrational mode as explained in Section S1. The MLJ model thus accounts for vibronic couplings between the electronic states considered in the ET process, which can accelerate the transfer process. This can be particularly important at low temperatures. The HR factors were obtained using the DUSHIN code.29
The reorganization energy λif was approximated as λif ≈ ETf(RminSi) − ETf(RminTf) for ISC, where ETf(RminSi) means the electronic energy of the Tf state at the minimum energy geometry for the Si state and ETf(RminTf) is electronic energy of the Tf state at the minimum energy geometry for Tf. For rISC, λif ≈ ESf(RminTi) − ESf(RminSf). This approximation was successfully used in previous works.30,31 The SOC matrix elements for ISC and rISC are |Hif|2 = |Si|HSO|Tf|2 and |Hif|2 = |Ti|HSO|Sf|2, where Si/Tf, and Ti/Sf are the states involved with the ISC and rISC processes, respectively. The SOC matrix elements were computed at the TD-ωB97XD/6-311++G(d,p) level of theory adopting the Breit–Pauli spin–orbit Hamiltonian with effective charge approximation as implemented in the PySOC package.32
To obtain the strength of the intermolecular interactions between dimers found in the crystals, we use symmetry-adapted perturbation theory (SAPT) which avoids the basis-set superposition error and provides a physically motivated breakdown of the interaction energy into its components (electrostatics, exchange, induction and dispersion).33 We opt for the SAPT0 scheme,34 which does not include intramolecular correlation, but has a good balance of accuracy versus computational cost, particularly when used in the frozen-core approximation as implemented in Psi4.35
The overlap between HOMO–LUMO was evaluated numerically as:
 | (6) |
3 Results and discussion
The spectroscopy of these amides significantly differs in solution and the solid state.13 In this section, we analyse the absorption and emission transitions and how they are modified when going from solution to the crystal. We also investigate the differences in the potential energy surfaces across the systems and the mechanisms behind ISC and rISC.3.1 In solution
In solution the three systems display very similar absorption spectra (Table S1, ESI†). The absorption spectrum for 24CPhCz was simulated in solution (Fig. S1, ESI†) using the nuclear-ensemble method as implemented in the Newton-X software.37,38 The first two bands centered at 4.0, 4.1 eV in DCM can be assigned to S0 → S1 (n–π*) and S0 → S2 (n–π*) transitions, respectively, whilst the most energetic band at 4.5 eV is a combination of at least four transitions between S0 → S3–6 (π–π*).13 In the crystal, we can assign electronic transitions similarly (see Table S2, ESI†). The absorption energies are overestimated by ≈0.4–0.6 eV with the TD-ωB97XD/6-311++G(d,p) level of theory. Absorption energies predicted with ADC(2)/TZVP and CC2/TZVP methods also show similar deviations from experimental values (Table S1, ESI†).In solution, the first bright transition (S0 → S1) shows a charge transfer (CT) character, which is subtle for 24CPhCz and significant for 34CPhCz and 35CPhCz. Electron densities and natural bond charges show that electron density moves from Cz to carbonyl and the phenyl fragments in the relaxation to S1min. For example, in the case of 24CPhCz, during the excitation from S0 to S1 0.17 e− migrates from Cz to the other fragments (Table S7, ESI†). In the relaxation to S1min, the phenyl ring rotates, becoming perpendicular to the Cz ring. The dihedral between the plane along the Cz moiety and the plane along phenyl moiety changes from 15° to 95°. In the relaxation from S0min to S1min, 0.58 e− are transferred from Cz to phenyl and carbonyl (Table S7, ESI†). The difference of electron densities for 24CPhCz at the S1min (Fig. 2) shows CT nature of the state. The calculated emission energy is 2.63 eV (Table 1), in agreement with the experimental broadband measured in DCM solution around 2.3 eV.13 Similar CT bands were found at 2.75 eV and 2.68 eV in DCM for 34CPhCz and 35CPhCz respectively, in good agreement with the experimental bands around 2.29 and 2.11 eV (see Table 1, Table S3 and Fig. S4, ESI†).13 The predicted phosphorescence transitions in DCM (Table 1) are similar along the series. Both triplet states considered, T1 and T2, have ππ* character with the electron density localised in the Cz ring in the former and the phenyl ring in the latter (Fig. 2 and Fig. S4, ESI†).
 | ||
| Fig. 2 Transition densities of 24CPhCz with respect to the ground state. An isovalue of 0.002 is used, with negative isovalues represented in blue and positive in red. | ||
| Transition | 24CPhCz | 34CPhCz | 35CPhCz |
|---|---|---|---|
| Solution (DCM) | |||
| S1 → S0 (CT/ππ* Cz → Ph) | 2.63 (2.30) | 2.75 (2.29) | 2.68 (2.11) |
| T1 → S0 (ππ*/LOC Cz) | 2.31 (2.78) | 2.34 (2.79) | 2.33 (2.79) |
| T2 → S0 (ππ*/LOC Ph) | 2.98 (2.97) | 2.80 (2.97) | 2.78 (2.98) |
| Crystal | |||
| S1 → S0 (CT/ππ* Cz → Ph) | 3.00 (2.98) | 3.01 (2.73) | 2.68 (2.54) |
| T1 → S0 (ππ*/LOC Cz) | 2.34 (2.33) | 2.39 (2.31) | 2.33 |
| T2 → S0 (ππ*/LOC Ph) | 2.96 (2.9) | 2.92 | 2.93 |
To further confirm the charge-transfer nature of S1, we obtained the diabatic CT states using constrained DFT (CDFT, Section 2). We considered two diabatic CT states by either restricting the positive charge on Cz and the negative on the phenyl and carbonyl moieties (CT-1) or vice versa (CT-2) at different critical points in the potential energy surfaces (Fig. 3). In CT-1, Cz acts as an electron donor, whereas in CT-2 as an electron acceptor. The adiabatic S1 state is much closer in energy to the diabatic state CT-1 than to CT-2 at the Franck–Condon (FC) and S1min geometries, and at the CT-1min geometry, both have similar energies. The only exception is found for 24CPhCz at the FC geometry for which CT-2 is slightly more stable than CT-1. Our analysis confirms that S1 has a strong CT character with Cz acting as an electron donor.
 | ||
| Fig. 3 Energies of S0, S1, CT-1 and CT-2 states computed at the critical points of the PES in solution of DCM. The states CT-1 and CT-2 are computed using constrained DFT as explained in Section 2. | ||
3.2 Crystalline phase
The natural population analysis shows that the CT character of S1 in the crystal and solution are similar for the three systems (Fig. 2 and Table S8, ESI†). The donor character of Cz in hybrid crystals is already known and it has been exploited to boost ultralong organic phosphorescence and TADF in purely organic crystals at room temperature.39,40 Both ISC and rISC processes benefit from an increased CT character of S1 as the energy gap between S1 and low-lying triplet states Tn is reduced. Thus, the driving forces of (r)ISC are enhanced in the crystalline phase, increasing the rate constant due to the less negative energy in the numerator of the exponential function in eqn (3).
For 24CPhCz and 34CPhCz, phosphorescence from T1 is found at 2.34 and 2.39 eV respectively, in excellent agreement with the reported experimental values (Table 1). These energies are also similar to the T1 → S0 energy measured in pure carbazole crystals.40 The T1 → S0 transition densities for the three systems show that the density is localized in the Cz sub-unit, indicating Cz as the chromophore of phosphorescence from T1 (Fig. 2). The vibrational progression observed in the phosphorescence spectra measured for 24CPhCz and 34CPhCz resemble that observed in pure Cz crystals, supporting the idea that phosphorescence from T1 comes from the Cz sub-unit.40,41
Vibrational coupling for the T1 → S0 transition in the crystal can be estimated from the Huang–Rhys (HR) factors projected over the ground state normal modes (Fig. 4). The ground state vibrational frequencies were scaled using the experimental frequencies reported for pure Cz in n-heptane at 10 K, as explained in section S6.42 A scaling factor of 0.955 is obtained with ωB97X-D/6-311++G(d,p), in very good agreement with the reported value using ωB97X-D/6-311G(d,p).43 The HR factors obtained for the three systems are very similar to those obtained for pure Cz. The two highest values are registered for modes with frequencies of 750 and 1630 cm−1, in agreement with the two most prominent vibrations observed for Cz with spectrally resolved phosphorescence experiments in n-heptane at 10 K (dashed lines in Fig. 4).42 These vibrations correspond to the ring breathing mode of the indole ring and the in-plane C–C stretching of Cz moiety, respectively. This is in line with the similarities observed between the vibrational fingerprint found in the experimental phosphorescence spectra of these systems and pure Cz.
 | ||
| Fig. 4 Huang–Rhys factors vs the normal modes frequencies of S0 computed for Pure Cz (black), 24CPhCz (red), 34CPhCz (blue) and 35CPhCz (green). The grey dashed lines mark the vibrational modes which exhibit most activity in the phosphorescence spectrum of pure Cz in n-heptane at 10 K.42 | ||
For crystalline 24CPhCz, in Table 1 we see a phosphorescence band from T2 at 2.96 eV. In good agreement with experiment, 24CPhCz crystals show a phosphorescence side-band at 2.9 eV with a lifetime ≈267 ms, shorter than registered from T1.13 The shorter lifetime along with the separation from the T1 emission band and the lower intensity suggest that emission from 2.9 eV must come from a higher triplet state, such as T2, in agreement with our calculations. This non-Kasha emission has also been observed for an analogue series of crystals based on halogenated benzoyldibenzothiophene,41 and proposed for pure Cz crystals.31 This evidence of population in T2 is a remarkable finding because recent studies suggest that excited triplet states play a critical role as intermediate states in the rISC process.44,45 We show in the next sections that the T2 state might be directly involved in the dynamics of the rISC process.
| Dimer | Energy (eV) | f | J (meV) | Type | k (s−1) | ||
|---|---|---|---|---|---|---|---|
| S1 | S2 | S1 | S2 | ||||
| 24-A | 4.25 | 4.34 | 0.20 | 0.16 | 16.28 | Cz–Cz (J) | 8.54 × 10⁵ |
| 24-B | 4.31 | 4.36 | 0.15 | 0.23 | 7.87 | Cz–Ph (J) | 1.99 × 10⁵ |
| 24-C | 4.29 | 4.31 | 0.46 | 0.00 | 7.90 | Ph–Ph (J) | 2.01 × 10⁵ |
| 24-F | 4.32 | 4.36 | 0.00 | 0.30 | 19.55 | Cz–Ph (H) | 1.23 × 10⁶ |
| 34-A | 4.16 | 4.19 | 0.38 | 0.00 | 17.35 | Ph–Ph (J) | 2.86 × 10⁶ |
| 34-B | 4.15 | 4.23 | 0.17 | 0.14 | 8.25 | Cz–Cz (J) | 6.48 × 10⁵ |
| 34-F | 4.15 | 4.17 | 0.00 | 0.24 | 12.60 | Cz–Ph (H) | 1.51 × 10⁶ |
| 35-A | 4.32 | 4.37 | 0.31 | 0.13 | 15.26 | Cz–Ph (J) | 1.35 × 10⁵ |
| 35-B | 4.34 | 4.36 | 0.00 | 0.33 | 8.95 | Ph–Ph (H) | 1.35 × 10⁵ |
| 35-D | 4.34 | 4.37 | 0.08 | 0.29 | 15.70 | Cz–Ph (H) | 1.43 × 10⁵ |
| 35-F | 4.31 | 4.35 | 0.08 | 0.23 | 11.68 | Cz–Ph (H) | 1.35 × 10⁵ |
| 35-J | 4.31 | 4.33 | 0.00 | 0.32 | 10.60 | Cz–Cz (H) | 1.35 × 10⁵ |
We identified 9, 10 and 11 different dimers for 24CPhCz, 34CPhCz and 35CPhCz respectively. The most common contacts involve Cz–Ph interactions, followed by Cz–Cz and then Ph–Ph (Table S9, ESI†). For the dimers with larger exciton couplings, we also calculated the SAPT0 energies (Table S10, ESI†). The strongest interactions in the ground state are found for dimers 34-A (Ph–Ph, −52.1 kJ mol−1), 35-A (Cz–Ph, −50.6 kJ mol−1), 34-B (Cz–Cz, −38.2 kJ mol−1), 24-F (Cz–Ph, −39.5 kJ mol−1) and 24-A (Cz–Cz, −35.2 kJ mol−1).
Considering the ground state interaction energies of the most stable complexes per system, their strengths follow the order 34CPhCz > 35CPhCz > 24CPhCz). The main intermolecular interactions are C–H⋯π, π⋯π, C–H⋯O and C–H⋯Cl. The most stable Cz–Cz dimers for each system were found in 34-B (−38.2 kJ mol−1), 24-A (−35.2 kJ mol−1) and 35-J (−10.6 kJ mol−1).
While the complexes for 34-B, 24-A have similar interaction energies, 35-J is significantly less stable in agreement with the longer intermolecular distances. As such, 35-J is unlikely to contribute significantly to the crystal packing. Two C–H⋯π contacts are found for 24-A (3.08 Å and 2.64 Å) and 34-B (3.00 Å and 2.78 Å) while 35-J displays C–H⋯O contacts at 3.37 Å and 4.49 Å. For 35CPhCz, the complex with two C–H⋯π interactions and Cz–Cz closer contacts is 35-E, at intermolecular distances of 3.37 Å. Our analysis shows that the closer intermolecular interactions in general are found for 24CPhCz and 34CPhCz, which is in line with the analysis Huang of et al.13 Additionally, the effect of dimerisation on the excited state of the monomers is related to the exciton couplings, that follow the order J(24CPhCz): 19.55 meV (24-F) > J(34CPhCz): 17.35 meV (34-A) > J(35CPhCz): 15.70 meV (35-D) (Fig. 5). The complexes 24-F and 34-A feature effective π⋯π interactions, 24-F is additionally stabilised by C–H⋯Cl close contacts at 2.78 Å. Due to the features of the intermolecular interactions described before, the available Voronoi volumes for the molecule to relax are 24CPhCz < 34CPhCz < 35CPhCz (356, 393 and 404 Å3 respectively). This has implications for the geometry relaxation in S1 allowed in the crystals as we discuss in Section 3.2.4.1.
 | ||
| Fig. 5 Dimers with higher exciton couplings for 24PhCz, 34CPhCz and 35CPhCz. Distances in Å. | ||
The dimers were assigned as H/J-aggregates using the spectroscopic classification based on the oscillator strengths (f). H-aggregates are obtained when fS2 > fS1 and J-aggregates when fS1 > fS2. This definition of H/J-aggregates is more accurate than Kasha's definition based on Coulombic interactions between the transition dipole moments (TDM) of the monomers.49 According to these criteria, 24CPhCz has 57% of H-aggregates, 34CPhCz 25% and 35CPhCz 62%. We should point out that for some dimers, both oscillator strengths significantly deviate from 0, e.g. 24-A, 24-B and 34-B. This indicates a significant role of exchange and higher order interactions in the exciton couplings. After optimisation, we found that the T1 state for H-aggregated or π-stacked dimers are barely stabilised for dimers from 24CPhCz and 34CPhCz and only slightly destabilised for dimers from 35CPhCz. This is in contrast with a previous interpretation stating that the presence of H-aggregates or π-stacking and Cz–Cz interactions were responsible for the stabilisation of triplet states. Additionally, for the dimer with largest exciton coupling (24-F, J = 19.55 meV), the SOC constant for the S1 → T1 transition decreases from 3.4 to 3.2 cm−1 and in the S1 → T2 transition it increases from 7.3 to 7.4 cm−1. The system with largest exciton coupling is expected to differ most from the monomer case, yet there does not appear to be a significant effect for the dimers and excited states studied here.
The total reorganization energies λ obtained with eqn (5) for the exciton transfer in the S1 state are 1.58, 1.47 and 1.75 eV for 24CPhCz, 34CPhCz and 35CPhCz respectively. In these systems, the excited state relaxation from the FC region to S1min involves the torsion around the carbonyl bond. Because of the charge transfer nature of S1, these reorganisation energies are larger than the ones for carbazole and other organic molecules.50 The theoretical barriers for exciton hopping, estimated as λ/4, are 0.395, 0.367 and 0.437 eV for 24CPhCz, 34CPhCz and 35CPhCz respectively. The exciton couplings of all the dimers considered are one or two orders smaller than the corresponding barriers (see Table 2). As a consequence, the exciton rates for these systems are in the order of 105–106 s−1 which are significantly smaller than those found in carbazole and aromatic molecules such as anthracene.31,47 Thus, exciton transport in S1 is not expected to compete with vibrational cooling (usually occurring within ps).
Overall, our analysis does not show a significant effect of dimerisation or exciton transport on the properties of these crystals that could explain the observed differences in their emissive behaviour. In the next sections, we explore the light-activated mechanisms in the three considered systems to find out the reasons behind their distinctive behaviour.
 | ||
| Fig. 6 Linear interpolated pathway between the S0 geometry and excited state equilibrium geometries in 24CPhCz. | ||
Once the excited system reaches S1min, the system can radiatively decay to the ground state through prompt fluorescence or other competing nonradiative pathways including IC and ISC. ISC to T2 and T1 is energetically allowed. The ISC rate constants for the S1–T2 transition predicted for 24CPhCz, 34CPhCz and 35CPhCz at 300 K using eqn (2) are 1.10 × 10¹⁰ s−1, 7.22 × 10⁹ s−1 and 1.41 × 10¹⁰ s−1 respectively (Table 3). These kISC rate constants are orders of magnitude higher than the values obtained for pure Cz,31 Cz-based crystal compounds with donor–acceptor configuration,40 or containing halogen substitution.51 These faster rates are in line with those observed in aromatic ketones.52,53 A recent report shows that the addition of a second halogen can boost ISC in Cz-based systems due to an increase in SOCs.51
| 24CPhCz | 34CPhCz | 35CPhCz | |
|---|---|---|---|
| Fluorescence | |||
| k f (s−1) | 4.54 × 10⁷ | 4.70 × 10⁷ | 2.26 × 10⁷ |
| S1–T1 | |||
| k ISC (s−1) | 1.07 × 10⁹ | 1.43 × 10⁹ | 1.36 × 10⁸ |
| λ ISC (eV) | 0.60 | 0.47 | 0.44 |
| SOCISC (cm−1) | 3.4 | 2.4 | 1.0 |
| S1–T2 | |||
| k ISC (s−1) | 1.10 × 10¹⁰ | 7.22 × 10⁹ | 1.41 × 10¹⁰ |
| λ ISC (eV) | 0.57 | 0.34 | 0.50 |
| SOCISC (cm−1) | 7.3 | 5.9 | 6.6 |
First-order SOCs amongst S1 and the three lowest triplet states at the S1 minimum have values between 1 and 7.3 cm−1 (Table 3 and Fig. S15, ESI†). According to the generalised El-Sayed rules, neither small nor large SOCs are expected for these systems at S1min.54 Large SOCs are disfavoured as S1 and T1 are both ππ* states with CT character, whereas T2 is ππ* localised in the carbonyl and phenyl moieties (Fig. 2). Some nπ* character is observed in the C![[double bond, length as m-dash]](https://www.rsc.org/images/entities/char_e001.gif) O group for the three states considered though. SOCs between S1–T1 and especially between S1–T2 are considerably higher than the analogue values obtained for the molecule without halogenation (PhCz),55 and for similar Cz-based systems with single halogen substitution.51
O group for the three states considered though. SOCs between S1–T1 and especially between S1–T2 are considerably higher than the analogue values obtained for the molecule without halogenation (PhCz),55 and for similar Cz-based systems with single halogen substitution.51
Larger spin–orbit couplings and smaller singlet–triplet (ΔEST) energy gaps facilitate intersystem crossings (eqn (3)). Following the formulation of Englman and Jortner,26 two limiting cases can be considered: the weak and strong coupling limits. The weak coupling limit is commonly applied to radiationless transitions between states whose potential energy surfaces do not intersect (nested states) and tend to have similar electronic characteristics. Alternatively, in the strong coupling limit, for a pair of states with a relatively large displacement, the states can intersect provided the crossing is allowed by symmetry. In this case, the energy gap can be described as an activation energy in the exponential function of eqn (3).
For the molecules considered here, the interaction between S1 (1CT) and T2 (3LE) can be described in the strong coupling limit because both states intersect in the proximity of S1min (Fig. 6, and Fig. S10, ESI†). S1 (1CT) and T1 (3CT) have a similar character at S1min which might indicate weaker coupling of the states in the S1min region. However, T1 (3CT) and T2 (3LE) are nearly degenerate in the region between S1min and T2min, consequently, both states are expected to mix in this region (Fig. 6 and Fig. S10, ESI†). This is in line with previous research in aromatic ketones that indicated a significant coupling between T1 and T2 states with a T2/T1 crossing near the S1/T2 crossing region.53 Because of the T2/T1 mixing, we also consider the S1–T1 interaction in the strong coupling limit. The values of ΔES1–T1 are 0.043, 0.042 and 0.024 eV at the S1min, whereas ΔES1–T2 = 4.4 × 10⁻⁵, 0.014 and 0.022 eV for 24CPhCz, 34CPhCz and 35CPhCz, respectively. The smaller ΔES1–T2 gaps and the higher SOCS1–T2 values result in larger ISC rates for S1 → T2 transition (Table 3).
Once in the triplet manifold, the system can decay through phosphorescence or nonradiative mechanisms. Experimentally, long lifetimes and ultralong phosphorescence have also been reported for 24CPhCz and 34CPhCz (1.06 and 0.77 s, respectively).13 Provided a significant population of the triplets, reverse intersystem crossing is possible (rISCT2/1→S1) resulting in TADF as has been observed for 34CPhCz and 35CPhCz. In the next section, we will analyse how these mechanisms behave with the temperature.
3.2.4.1 Temperature dependence. We consider the behaviour of k(r)ISC with the temperature using the Marcus–Levich–Jortner model (eqn (2)). Due to their exothermicity, forward ISC rate constants are less affected by changes in temperature. While rISC rate constants have a strong dependence on the temperature. A change of several orders of magnitude is predicted for krISC when the temperature increases from 150 to 300 K (Fig. 7), as expected for an endothermic process. Higher thermal energies facilitate overcoming the energy gaps with a direct impact on TADF, which results in a stronger emission at higher temperatures.
 | ||
| Fig. 7 Temperature dependence of rISC rate constant (krISC for the transition T2–S1, computed with MLJ model as explained in Section 2). Note that krISC(T) is rescaled by using the phosphorescence rate constant (k24CPhCzp) of 24CPhCz determined experimentally at room temperature in ref. 13. The grey dashed line corresponds to krISC(T)/k24CPhCzp(298 K) = 1. Points above this line are rate constants larger than the experimentally determined phosphorescence rate constant for 24CPhCz. | ||
Our analysis is based on the comparison of the values of krISC with respect to the experimental phosphorescence rate of 24CPhCz at 298 K (τT1 = 1.06 s).13 The rate constants for 24CPhCz are found below the grey line in Fig. 7, indicating that TADF is unlikely to be observed as the rISC rate is lower than the rate of phospherescence over the temperature range 150–300 K. In the case of 35CPhCz, rISC could compete with phosphorescence at low temperatures and becomes more important over 200 K (Fig. 7). Above 200 K, a less efficient phosphorescence mechanism in comparison to rISC suggests that triplet states keep converting back into S1 until radiative (fluorescence) or nonradiative deactivation occurs. For 34CPhCz no TADF is predicted at low temperatures but a competition between TADF and phosphorescence is expected when T > 250 K.
In line with the experiments, the calculated rISC probability (35CPhCz > 34CPhCz > 24CPhCz) can be understood in terms of ΔEST in the strong coupling limit. The values of ΔES1–T2 are 0.60, 0.52 and 0.40 eV (T2min), whereas ΔES1–T1 = 0.92, 0.76 and 0.68 eV (T1min) for 24CPhCz, 34CPhCz and 35CPhCz respectively. These ΔEST are larger than those commonly found in TADF systems (typically ≤0.2 eV).56 However, if other triplet deactivation mechanisms are slow enough, rISC may happen at slow rates. For instance, Sn4+-Porphyrin complexes show appreciable TADF at 300 and 400 K with a ΔEST = 0.24 eV.57 The corresponding krISC values were experimentally determined as 5.0 × 101 s−1 and 5.5 × 10² s−1 respectively, which are in line with the rates we obtained.
The authors have proposed that the reason why TADF is observed with such a small krISC is because kp = 7.1 × 100 s−1 is even smaller.57 The greater values of ΔES1–T1 in our systems suggest that rISC is not likely to occur directly from T1min. Hence, the reverse process is assisted by T2 which has lower ΔEST gaps and much higher SOCs values (compare values at T2min and T1min in Fig. 6 and Fig. S10, ESI†). Previous works indicate a relevant role of the intermediate T2 state to explain the rISC mechanism in organic systems.44,45,58–61
Gibson et al. proposed a three-states model that considers both ICT1→T2 and rISCT2→S1.58 The mixing between T1 and T2 is promoted by large nonadiabatic couplings. Within this spin-vibronic model, they found that higher ΔET1–T2 values increase the rISC probability because the process is dominated by the energy gap between S1 and T2 (ΔES1–T2 is lower if ΔET1–T2 is bigger). Though a higher ΔET1–T2 can decrease the mixing between the two states, the spin-allowed nonadiabatic coupling, commonly stronger than the spin–orbit coupling, appears to be less affected by the changes in the energy gap.58 In our series, the adiabatic energy gaps  are 0.33, 0.27 and 0.35 eV for 24CPhCz, 34CPhCz and 35CPhCz, respectively. IC between T2 and T1 is expected to play a role in determining the population of T2 after thermal equilibrium. Because of the small energy separation for a large region of the PES and the presence of a crossing region in the proximity of T2min, a significant mixing between T1 and T2 is expected (Fig. 6 and Fig. S6, ESI†).58 At high temperature, the system will have enough energy to populate the region of small energy gap between T2 and T1. At low temperatures, the extra excitation energy might take longer to dissipate allowing molecules vibrationally excited in T1 to populate T2. Simulating all these processes in the crystal environment is extremely challenging. While the assumption that krIC(T1 → T2) ≫ krISC(T2 → S1) might not hold for all the temperatures, our calculations indicate that rISC from T2 to S1 has a significant role in determining the competition between TADF and UOP. As we discussed in Section 3.2.1, the experiments suggest a significant population of T2 at least for 24CPhCz in the solid state with phosphorescence recorded at 2.9 eV, which can be assigned to non-Kasha emission from T2 predicted at 2.96 eV and analogous to the bands found in solution (Table 1).
Because the transitions between the HOMO and LUMO orbitals (Fig. 8) are relevant for these excited states, the trend in ΔES1–T2/1 can be understood in terms of the HOMO–LUMO overlaps. In Fig. 9, we show the correlation between ΔEST and the orbital overlap degree (![[scr O, script letter O]](https://www.rsc.org/images/entities/char_e52e.gif) H–L). ΔEST decreases for smaller values of H–L (and higher orbital separation, Fig. S18a, ESI†). Because S1 is a CT state dominated by HOMO–LUMO transitions, a smaller orbital overlap reduces the exchange electron energy and thus ΔEST (Fig. S18b, ESI†).62 The decrease in the HOMO–LUMO overlap along the series correlates with an increase of the dihedral angle between the Cz and Ph moieties (θCCzNCαCPh, Fig. 9b) in the S1 minimum. The values of θCCzNCαCPh are 48°, 52° and 62° for 24CPhCz, 34CPhCz and 35CPhCz respectively. HOMO–LUMO gaps and larger dihedrals between the donor and acceptor are also in line with ultrafast ISC rates reported for donor–acceptor organic systems mediated by CT states.63 In the ground state, the values of θCCzNCαCPh in solution are 19°, 36° and 31°. These values are very close to the ones obtained in the solid state (15°, 30° and 28°). In contrast, in the S1 minimum, the values of θCCzNCαCPh in solution are close to 90° for the three systems. Additionally, the volumetric index, that is the fraction between the Voronoi and the VdW volumes, are 1.34, 1.48 and 1.53 for 24CPhCz, 34CPhCz and 35CPhCz respectively, indicating the volume available for relaxation in the crystal environment. Therefore, there is a clear relationship between the crystal packing, which control the ΔEST gap, and the photo-relaxation mechanisms.
H–L). ΔEST decreases for smaller values of H–L (and higher orbital separation, Fig. S18a, ESI†). Because S1 is a CT state dominated by HOMO–LUMO transitions, a smaller orbital overlap reduces the exchange electron energy and thus ΔEST (Fig. S18b, ESI†).62 The decrease in the HOMO–LUMO overlap along the series correlates with an increase of the dihedral angle between the Cz and Ph moieties (θCCzNCαCPh, Fig. 9b) in the S1 minimum. The values of θCCzNCαCPh are 48°, 52° and 62° for 24CPhCz, 34CPhCz and 35CPhCz respectively. HOMO–LUMO gaps and larger dihedrals between the donor and acceptor are also in line with ultrafast ISC rates reported for donor–acceptor organic systems mediated by CT states.63 In the ground state, the values of θCCzNCαCPh in solution are 19°, 36° and 31°. These values are very close to the ones obtained in the solid state (15°, 30° and 28°). In contrast, in the S1 minimum, the values of θCCzNCαCPh in solution are close to 90° for the three systems. Additionally, the volumetric index, that is the fraction between the Voronoi and the VdW volumes, are 1.34, 1.48 and 1.53 for 24CPhCz, 34CPhCz and 35CPhCz respectively, indicating the volume available for relaxation in the crystal environment. Therefore, there is a clear relationship between the crystal packing, which control the ΔEST gap, and the photo-relaxation mechanisms.
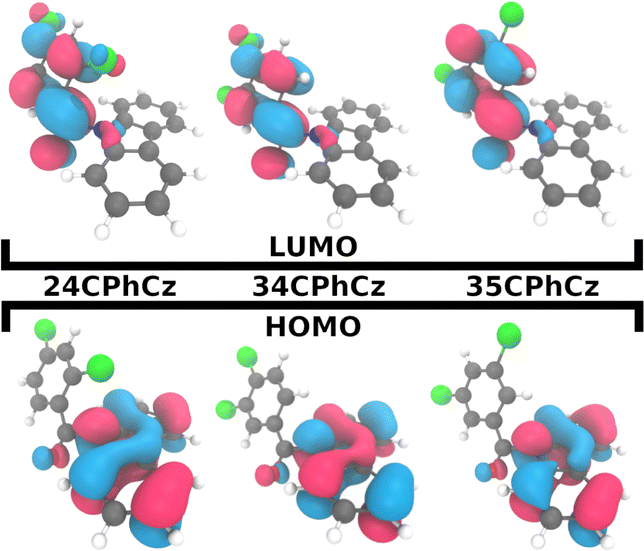 | ||
| Fig. 8 HOMO and LUMO orbitals for the three systems. | ||
 | ||
| Fig. 9 (a) Singlet–triplet energy gap, computed in the strong coupling limit (ΔEST), between S1–T1 (green) S1–T2 (pink) as a function of the HOMO–LUMO overlap (H–L, eqn (6)). (b) H–Lversus the dihedral between the planes along Cz and Ph moieties, θCCzNCαCPh (shown in panel b). | ||
3.3 Role of impurities
It has been reported that the presence of isomeric defects can significantly impact emission in materials displaying TADF and RTP.64 In this section, we speculate about the possible role of isomeric impurities in these crystals and how they can stabilise charge-transfer states.Charge-transfer states play a significant role in electron transport in optoelectronic organic materials. The generation of intermediate CT states via exciplex formation at the guest(donor)-host(acceptor) heterojunction has been proposed to explain high efficiencies in TADF and long persistence luminescence.57,65,66 Exciton formation is followed by charge transport across the host and hole trapping in the guest. The process ends with charge recombination at the guest-host heterojunctions, where delayed luminescence occurs.65 Two photoinduced mechanisms have been proposed, where charge separation can then occur after the excitation of either the guest (Type I) or the host (Type II). Charge recombination can occur within the same donor–acceptor pair that produced the charge separation (geminate recombination), or at a different pair (bulk recombination).
Exciplex formation can facilitate ISC or rISC mediated by charge-transfer states, producing charge recombination from both singlet (fluorescence) and triplet (phosphorescence) excited states (1CT and 3CT respectively).66 This mechanism has been considered by Liu et al. to explain how ultralong organic phosphorescence originates from impurities found in commercial Cz crystals.64 1H-benzo[f]indole (Bd), is an isomeric impurity (guest) that replaces the Cz moiety (host).64 It is commonly found in commercial samples of carbazole derived systems. Their experiments showed that lab-synthesized crystals exhibit low phosphorescence efficiencies with shorter lifetimes than the commercial equivalent. Bd can act as a donor species generating charge traps and activating UOP at room temperature. Therefore, single-crystals of pure Cz and Cz-derivatives can be seen as a special case of host-guest trace doping systems, where the host and the guest are structurally related (isomers). The authors considered the same mechanism to explain both fluorescence and phosphorescence of Cz in solution and in the solid state, observing a distinctive emission red-shift in all cases.10 A similar mechanism explains the ultralong phosphorescence in commercial boric acid, for which luminescence is completely absent when pure lab-synthesised boric acid is irradiated under UV light.67
In previous work, we investigated the effect of Bd impurities in Cz crystal on its excited state mechanisms. We found that Cz doped with Bd shows red-shifted fluorescence with the emission localised on the impurity.31 More importantly, we showed that CTBd→Cz states in both singlet and triplet manifolds are energetically accessible for dimers between Cz and Bd but not for pure Cz–Cz dimers (CTCz→Cz).31 The access to CTBd→Cz states produces two complementary effects: the excitation stays alive for longer times and the probability of ISC is increased. UOP and delayed fluorescence benefit from longer excitation lifetimes. Additionally, ISC can be boosted by the presence of CT states due to lower ΔE1CT−3CT values, increasing phosphorescence quantum yields.
Liu et al. also analysed the UOP mechanism in crystals of (9H-carbazol-9-yl)(4-chlorophenyl)methanone (CPhCz) synthesised with pure and commercial Cz finding a similar effect of impurities as observed in Cz.64 The molecules studied in this paper are derivatives of CPhCz with an additional Cl atom. This suggests that CT states could also play an effect in the excited state mechanisms in these crystals. We, therefore, analysed the effects of impurities on 24CPhCz, 34CPhCz and 35CPhCz crystals.
The impurities were added to the crystals by replacing one of the molecules with the Bd analogue and reoptimising as explained in Section 2. The resulting absorption and emission energies are shown in Table 4 from which we can see that fluorescence redshifts are predicted for 34CPhBd and 35CPhBd. Thus, if the Bd-impurities are considered as the fluorophores, we obtain computed values of 3.06, 2.51 and 2.53 eV for 24PhBd, 34PhBd and 35PhBd respectively (Table 4.) The agreement with the reported experimental values (2.98, 2.73 and 2.54 eV for 24PhCz, 34PhCz and 35PhCz respectively, Table 1) is improved (compared to computed values of the pure systems from Table 1 of 3.00, 3.01 and 2.68 eV). However, the phosphorescence energies predicted for all the crystals (1.44, 1.30 and 1.27 eV for 24PhBd, 34PhBd and 35PhBd respectively are too far from the experimental observations (2.33 and 2.31 eV for 24PhCz and 34PhCz respectively, Table 1), reinforcing the prediction made in Section 3.2.1 that the phosphorescence mainly comes from the Cz subunit.
| Transition | 24CPhBd | 34CPhBd | 35CPhBd |
|---|---|---|---|
| S0 → S1 | 3.99 | 4.02 | 4.10 |
| S1 → S0 | 3.06 | 2.51 | 2.53 |
| T1 → S0 | 1.44 | 1.30 | 1.27 |
We compared the energy alignments of the frontier orbitals of the pure and doped crystals, with the experimental values reported for Cz/Bd and CPhCz/Bd systems (Fig. 10b and c).64 The energies of HOMO and LUMO for the crystals were approximated to the energy of the last occupied Kohn-Sham orbital of the neutral molecule and the anion, respectively. The RO-B3LYP/6-311++G(d,p) level of theory was used for this purpose because it provides a better agreement with the experimental results and a consistent comparison with results obtained from previous work. For instance, for Cz/Bd, we obtain EHOMO-Cz = −5.6, ELUMO-Cz = −1.9, EHOMO-Bd = −5.1 ELUMO-Bd = −1.8 eV, which are in excellent agreement with the reported experimental values (EHOMO-Cz = −5.5, ELUMO-Cz = −2.0, EHOMO-Bd = −5.1 and ELUMO-Bd = −1.8 eV).64 The Cz/Bd systems were optimised as explained in ref. 31.
 | ||
| Fig. 10 (a) Proposed mechanism for long persistent luminescence. The Type I mechanism involves excitation of an electron in the guest's (Bd) HOMO orbital (labelled in pink), while the Type II mechanism begins with excitation of an electron in the host's (Cz) HOMO orbital (labelled in blue). The curved coloured arrows refer to the diffusion of Cz radical anions through the crystal. The black arrows refer to the recombination process. Frontier orbital energies for Cz/Bd (b), CPhCz/Bd (c) and 24/34/35/CPhCz/Bd (d) crystals. The values of Cz/Bd and CPhCz/Bd systems are taken from ref. 64. | ||
The alignments of the frontier orbitals of pure and doped crystals are qualitatively similar to the alignments reported for Cz/Bd and CPhCz/Bd (Fig. 10b–d).64 This suggests that Bd impurities present in 24/34/35CPhCz crystals could trigger the charge separation/recombination mechanisms depicted in Fig. 10(a), as proposed for the other two systems (Cz and CPhCz).31,64 To gain further insight on the CT states, we selected the most frequent dimer present in 24CPhCz and 35CPhCz crystals and replaced it with one molecule of the corresponding Bd analogue. We then reoptimised these dimers in the crystal as explained in Section 2, using CDFT to optimise the geometries of CT states in the singlet and triplet manifolds (1CT and 3CT respectively).
We now focus on the analysis of the most frequent dimer found in 35CPhCz crystals (dimer 35-C, shown in Fig. 11a). The energy profiles based on different excited state minima for the pure and doped dimers are shown in Fig. 11. The energy profiles for the three systems are shown in Fig. S10 (ESI†).
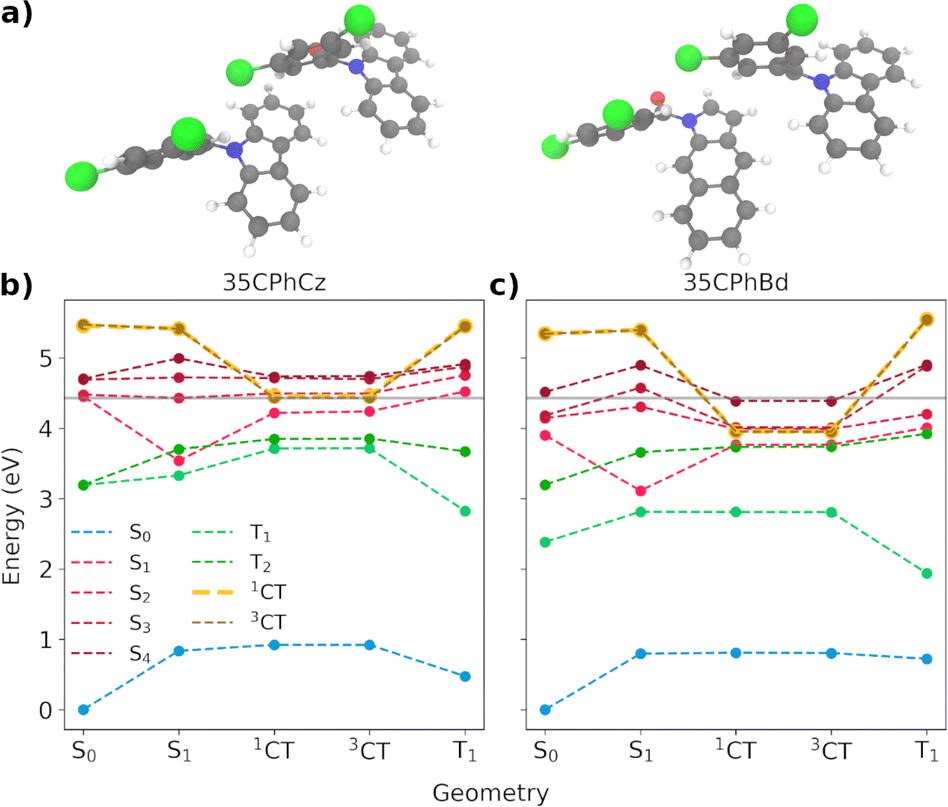 | ||
| Fig. 11 (a) 35-C molecular dimer for the pure (35CPhCz)2 and impurified (35CPhCz-35CPhBd) systems. (b and c) Energy profiles for singlet and triplet states including the 35Cz− 35Bd+ (1CT and 3CT) states computed at the critical points for dimer 35-C embedded in the crystal environment using the OEC model. The grey line signals the energy of the S1 FC region energy of the pure dimer. | ||
Because of the high level of localisation of the excitation, similar deactivation pathways to those discussed based on the molecule-centred mechanism (Section 3.2.4) are found for the dimeric states. However, we need to consider the formation of the CT states and their role in the overall mechanism. Crossing geometries between the singlet and triplet manifold are expected to be found close to the S1 minimum (Fig. 11 and S21, ESI†). After the excitation to one of the excited states between S1–S4, vibrational relaxation will stabilise the excitation in S1. For all the pure dimers, S1 is localised on one of the Cz monomers. In the doped dimers, the excitation for the Franck–Condon and S1 minima are localised on the Bd subunit (Fig. S24 and S25, ESI†). Once in S1, radiative and nonradiative processes will be activated, facilitated by the crossing between the states. The values of the SOCs between T2 and S1 at the S1 minimum are 7.4, 5.4 and 6.1 cm−1 in the pure dimers for 24CPhCz, 34CPhCz and 35CPhCz, which are very similar to the ones obtained for the monomers (Table 3). The SOCs for the doped dimers are smaller with values of 0.8, 0.9 and 0.6 cm−1 respectively, which can make the population of the triplets more difficult (Table S22, ESI†).
As in the case of pure Cz,31 the access to CT states from the S1 minima requires extra energy for the pure crystalline systems in both the singlet and triplet manifolds (Fig. 11(b) and S21, ESI†).31 The energy of the CT states resides well above the Franck–Condon region, to where the excitation initially takes place. Though higher excitation energies or higher temperatures may allow access to the CT states, their high energy would make other deactivation processes or even recombination the most likely ones. Because of the alignment of the energy levels between the molecules and the impurities, the energy of the charge transfer states decreases with respect to the pure systems. We have observed this for all the doped dimers. This is in line with our previous work exploring the Cz crystal.31 Our calculations show that the possible presence of isomeric impurities can be associated with the formation of charge-transfer heterojunctions in these crystals, resulting in long-lived excited states. Spin statistics dictates a 3:1 ratio of triplet to singlet states, such that recombination is more likely to generate triplets. However, once in the triplet state, the dynamics will be determined by the shape of the potential energy surface and the corresponding energy gaps (Fig. 6). In line with this, TADF or UOP will be witnessed. Our modelling of the temperature dependence of these mechanisms seems to explain why 24PhCz only displays UOP in contrast with TADF for 35PhCz (Section 3.3.2.2).
4 Conclusions
In this paper, we explore the competition between different processes determining the excited-state dynamics of three dichloro derivatives of 9-benzoylcarbazole. Our calculations in solution help assign the second phosphorescence band to non-Kasha phosphorescence from T2 from the phenyl moiety. Phosphorescence from T1 can be associated with the carbazole unit in line with the vibrational progression observed in the experimental spectra of 24CPhCz and 34CPhCz.Our analysis of the crystal packing and the excited state PES shows that the differences in emissive behaviour are determined by the volumes available to the molecules for relaxing in the S1 state. We detected the main intermolecular interactions stabilising the crystal structures. However, our calculations indicate significant reorganisation energies for relaxation in S1, driving localisation of the excitations with the hopping rates smaller than those found in analogous organics crystals including carbazole. The excited state mechanism is therefore determined by the ability of the crystal structure to allow larger or smaller geometry deformations during the excited state relaxation. The strength of intermolecular interactions controls the volume available for the molecules to relax in the crystal following the order: 24CPhCz < 34CPhCz < 35CPhCz. As a consequence, the angle θCCzNCαCPh stabilises at 48° in S1 for 24CPhCz, 52° and 62° for 34CPhCz and 35CPhCz respectively. This is in contrast with the values close to 90° found in solution thus indicating the important role of crystal packing and how it can control photo-relaxation in the condensed phase.
We evaluated the possible effect of the formation of charge transfer states at the junctions between the molecules and impurities in the excited state dynamics of these systems. Similarly to what we found in Cz crystals, the presence of impurities stabilizes CT states in contrast with the pure systems opening up the possibility of electron transport. This mechanism could contribute to maintaining the excited states alive for longer times and the UOP observed. In the case of the systems which show more effective rISC, the excited states will go back to the singlet manifold resulting in TADF, this is the case of 34CPhCz and 35CPhCz.
Our calculations shed light on the excited state relaxation processes in RTP materials and how the shape of the potential energy surfaces determines the competition with TADF. Inter- and intra-molecular charge transfer have a relevant role in the excited state dynamics of these systems. It also highlights the role of crystal packing and how the restrictions imposed in the crystal phase can determine the emissive response.
Conflicts of interest
There are no conflicts to declare.Acknowledgements
This research has been supported by the Leverhulme Trust (RPG-2019-122) and EPSRC (EP/N50953X/1, EP/R513106/1). We utilized Queen Mary's Apocrita HPC facility, supported by QMUL Research-IT and the ARCHER UK National Supercomputing Service (EP/L000202/1) via the Materials Chemistry Consortium and the Molecular Modelling Hub for computational resources, MMM Hub, which is partially funded by EPSRC (EP/T022213/1). The authors acknowledge the support from the School of Physical and Chemical Sciences at the Queen Mary University of London.References
- S. Hirata, Adv. Opt. Mater., 2017, 5, 1700116 CrossRef.
- H. Sasabe and J. Kido, J. Mater. Chem. C, 2013, 1, 1699–1707 RSC.
- K. Y. Zhang, Q. Yu, H. Wei, S. Liu, Q. Zhao and W. Huang, Chem. Rev., 2018, 118, 1770–1839 CrossRef CAS PubMed.
- J. Yang, X. Zhen, B. Wang, X. Gao, Z. Ren, J. Wang, Y. Xie, J. Li, Q. Peng, K. Pu and Z. Li, Nat. Commun., 2018, 9, 840 CrossRef PubMed.
- S. Mukherjee and P. Thilagar, Chem. Commun., 2015, 51, 10988–11003 RSC.
- A. Forni, E. Lucenti, C. Botta and E. Cariati, J. Mater. Chem. C, 2018, 6, 4603–4626 RSC.
- Z. An, C. Zheng, Y. Tao, R. Chen, H. Shi, T. Chen, Z. Wang, H. Li, R. Deng, X. Liu and W. Huang, Nat. Mater., 2015, 14, 685–690 CrossRef CAS PubMed.
- S. Cai, H. Shi, D. Tian, H. Ma, Z. Cheng, Q. Wu, M. Gu, L. Huang, Z. An, Q. Peng and W. Huang, Adv. Funct. Mater., 2018, 28, 1–7 Search PubMed.
- E. Lucenti, A. Forni, C. Botta, L. Carlucci, C. Giannini, D. Marinotto, A. Previtali, S. Righetto and E. Cariati, J. Phys. Chem. Lett., 2017, 8, 1894–1898 CrossRef CAS PubMed.
- C. Chen, K. C. Chong, Y. Pan, G. Qi, S. Xu and B. Liu, ACS Mater. Lett., 2021, 3, 1081–1087 CrossRef CAS.
- J. Eng and T. J. Penfold, Chem. Rec., 2020, 1–27 Search PubMed.
- S. Cai, H. Shi, J. Li, L. Gu, Y. Ni, Z. Cheng, S. Wang, W.-W. Xiong, L. Li, Z. An and W. Huang, Adv. Mater., 2017, 29, 1701244 CrossRef PubMed.
- N. Gan, X. Wang, H. Ma, A. Lv, H. Wang, Q. Wang, M. Gu, S. Cai, Y. Zhang, L. Fu, M. Zhang, C. Dong, W. Yao, H. Shi, Z. An and W. Huang, Angew. Chem., Int. Ed., 2019, 58, 14140–14145 CrossRef CAS PubMed.
- M. J. Frisch, G. W. Trucks, H. B. Schlegel, G. E. Scuseria, M. A. Robb, J. R. Cheeseman, G. Scalmani, V. Barone, G. A. Petersson, H. Nakatsuji, X. Li, M. Caricato, A. V. Marenich, J. Bloino, B. G. Janesko, R. Gomperts, B. Mennucci, H. P. Hratchian, J. V. Ortiz, A. F. Izmaylov, J. L. Sonnenberg, D. Williams-Young, F. Ding, F. Lipparini, F. Egidi, J. Goings, B. Peng, A. Petrone, T. Henderson, D. Ranasinghe, V. G. Zakrzewski, J. Gao, N. Rega, G. Zheng, W. Liang, M. Hada, M. Ehara, K. Toyota, R. Fukuda, J. Hasegawa, M. Ishida, T. Nakajima, Y. Honda, O. Kitao, H. Nakai, T. Vreven, K. Throssell, J. A. Montgomery, Jr., J. E. Peralta, F. Ogliaro, M. J. Bearpark, J. J. Heyd, E. N. Brothers, K. N. Kudin, V. N. Staroverov, T. A. Keith, R. Kobayashi, J. Normand, K. Raghavachari, A. P. Rendell, J. C. Burant, S. S. Iyengar, J. Tomasi, M. Cossi, J. M. Millam, M. Klene, C. Adamo, R. Cammi, J. W. Ochterski, R. L. Martin, K. Morokuma, O. Farkas, J. B. Foresman and D. J. Fox, Gaussian 16 Revision C.01, Gaussian Inc., Wallingford CT, 2016 Search PubMed.
- Y. Shao, Z. Gan, E. Epifanovsky, A. T. Gilbert, M. Wormit, J. Kussmann, A. W. Lange, A. Behn, J. Deng, X. Feng, D. Ghosh, M. Goldey, P. R. Horn, L. D. Jacobson, I. Kaliman, R. Z. Khaliullin, T. Kuś, A. Landau, J. Liu, E. I. Proynov, Y. M. Rhee, R. M. Richard, M. A. Rohrdanz, R. P. Steele, E. J. Sundstrom, H. L. Woodcock, P. M. Zimmerman, D. Zuev, B. Albrecht, E. Alguire, B. Austin, G. J. O. Beran, Y. A. Bernard, E. Berquist, K. Brandhorst, K. B. Bravaya, S. T. Brown, D. Casanova, C.-M. Chang, Y. Chen, S. H. Chien, K. D. Closser, D. L. Crittenden, M. Diedenhofen, R. A. DiStasio, H. Do, A. D. Dutoi, R. G. Edgar, S. Fatehi, L. Fusti-Molnar, A. Ghysels, A. Golubeva-Zadorozhnaya, J. Gomes, M. W. Hanson-Heine, P. H. Harbach, A. W. Hauser, E. G. Hohenstein, Z. C. Holden, T.-C. Jagau, H. Ji, B. Kaduk, K. Khistyaev, J. Kim, J. Kim, R. A. King, P. Klunzinger, D. Kosenkov, T. Kowalczyk, C. M. Krauter, K. U. Lao, A. D. Laurent, K. V. Lawler, S. V. Levchenko, C. Y. Lin, F. Liu, E. Livshits, R. C. Lochan, A. Luenser, P. Manohar, S. F. Manzer, S.-P. Mao, N. Mardirossian, A. V. Marenich, S. A. Maurer, N. J. Mayhall, E. Neuscamman, C. M. Oana, R. Olivares-Amaya, D. P. O'Neill, J. A. Parkhill, T. M. Perrine, R. Peverati, A. Prociuk, D. R. Rehn, E. Rosta, N. J. Russ, S. M. Sharada, S. Sharma, D. W. Small, A. Sodt, T. Stein, D. Stück, Y.-C. Su, A. J. Thom, T. Tsuchimochi, V. Vanovschi, L. Vogt, O. Vydrov, T. Wang, M. A. Watson, J. Wenzel, A. White, C. F. Williams, J. Yang, S. Yeganeh, S. R. Yost, Z.-Q. You, I. Y. Zhang, X. Zhang, Y. Zhao, B. R. Brooks, G. K. Chan, D. M. Chipman, C. J. Cramer, W. A. Goddard, M. S. Gordon, W. J. Hehre, A. Klamt, H. F. Schaefer, M. W. Schmidt, C. D. Sherrill, D. G. Truhlar, A. Warshel, X. Xu, A. Aspuru-Guzik, R. Baer, A. T. Bell, N. A. Besley, J.-D. Chai, A. Dreuw, B. D. Dunietz, T. R. Furlani, S. R. Gwaltney, C.-P. Hsu, Y. Jung, J. Kong, D. S. Lambrecht, W. Liang, C. Ochsenfeld, V. A. Rassolov, L. V. Slipchenko, J. E. Subotnik, T. Van Voorhis, J. M. Herbert, A. I. Krylov, P. M. Gill and M. Head-Gordon, Molecular Physics, 2015, 113, 184–215 CrossRef CAS.
- TURBOMOLE V7.4 2019, a development of University of Karlsruhe and Forschungszentrum Karlsruhe GmbH, 1989–2007, TURBOMOLE GmbH, since 2007, available from https://www.turbomole.com.
- P. Giannozzi, S. Baroni, N. Bonini, M. Calandra, R. Car, C. Cavazzoni, D. Ceresoli, G. L. Chiarotti, M. Cococcioni, I. Dabo, A. Dal Corso, S. De Gironcoli, S. Fabris, G. Fratesi, R. Gebauer, U. Gerstmann, C. Gougoussis, A. Kokalj, M. Lazzeri, L. Martin-Samos, N. Marzari, F. Mauri, R. Mazzarello, S. Paolini, A. Pasquarello, L. Paulatto, C. Sbraccia, S. Scandolo, G. Sclauzero, A. P. Seitsonen, A. Smogunov, P. Umari and R. M. Wentzcovitch, J. Phys.: Condens. Matter, 2009, 21, 395502 CrossRef PubMed.
- M. Rivera, M. Dommett and R. Crespo-Otero, J. Chem. Theory Comput., 2019, 15, 2504–2516 CrossRef CAS PubMed.
- M. Rivera, M. Dommett, A. Sidat, W. Rahim and R. Crespo-Otero, J. Comput. Chem., 2020, 41, 1045–1058 CrossRef CAS PubMed.
- B. Aradi, B. Hourahine and T. Frauenheim, J. Phys. Chem. A, 2007, 111, 5678–5684 CrossRef CAS PubMed.
- G. C. Schatz and M. A. Ratner, Quantum Mechanics in Chemistry, 1998 Search PubMed.
- W. J. Kusto and J. W. Rohleder, Mol. Cryst. Liq. Cryst., 1979, 55, 151–161 CrossRef CAS.
- K. Aidas, C. Angeli, K. L. Bak, V. Bakken, R. Bast, L. Boman, O. Christiansen, R. Cimiraglia, S. Coriani, P. Dahle, E. K. Dalskov, U. Ekström, T. Enevoldsen, J. J. Eriksen, P. Ettenhuber, B. Fernández, L. Ferrighi, H. Fliegl, L. Frediani, K. Hald, A. Halkier, C. Hättig, H. Heiberg, T. Helgaker, A. C. Hennum, H. Hettema, E. Hjertenæs, S. Høst, I.-M. Høyvik, M. F. Iozzi, B. Jansík, H. J. A. Jensen, D. Jonsson, P. Jørgensen, J. Kauczor, S. Kirpekar, T. Kjærgaard, W. Klopper, S. Knecht, R. Kobayashi, H. Koch, J. Kongsted, A. Krapp, K. Kristensen, A. Ligabue, O. B. Lutnæs, J. I. Melo, K. V. Mikkelsen, R. H. Myhre, C. Neiss, C. B. Nielsen, P. Norman, J. Olsen, J. M. H. Olsen, A. Osted, M. J. Packer, F. Pawlowski, T. B. Pedersen, P. F. Provasi, S. Reine, Z. Rinkevicius, T. A. Ruden, K. Ruud, V. V. Rybkin, P. Sałek, C. C. M. Samson, A. S. de Merás, T. Saue, S. P. A. Sauer, B. Schimmelpfennig, K. Sneskov, A. H. Steindal, K. O. Sylvester-Hvid, P. R. Taylor, A. M. Teale, E. I. Tellgren, D. P. Tew, A. J. Thorvaldsen, L. Thøgersen, O. Vahtras, M. A. Watson, D. J. D. Wilson, M. Ziolkowski and H. Ågren, WIREs Comput. Mol. Sci., 2014, 4, 269–284 CrossRef CAS PubMed.
- H. Ågren, O. Vahtras and B. Minaev, Adv. Quantum Chem., 1996, 27, 71–162 CrossRef.
- B. Minaev, G. Baryshnikov and H. Agren, Phys. Chem. Chem. Phys., 2014, 16, 1719–1758 RSC.
- R. Englman and J. Jortner, Mol. Phys., 1970, 18, 145–164 CrossRef CAS.
- J. Aragó and A. Troisi, Phys. Rev. Lett., 2015, 114, 1–5 CrossRef PubMed.
- R. P. Fornari, J. Aragó and A. Troisi, J. Chem. Phys., 2015, 142, 184105 CrossRef PubMed.
- J. R. Reimers, J. Chem. Phys., 2001, 115, 9103–9109 CrossRef CAS.
- R. Liu, X. Gao, M. Barbatti, J. Jiang and G. Zhang, J. Phys. Chem. Lett., 2019, 10, 1388–1393 CrossRef CAS PubMed.
- F. J. Hernández and R. Crespo-Otero, J. Mater. Chem. C, 2021, 9, 11882–11892 RSC.
- X. Gao, S. Bai, D. Fazzi, T. Niehaus, M. Barbatti and W. Thiel, J. Chem. Theory Comput., 2017, 13, 515–524 CrossRef CAS PubMed.
- B. Jeziorski, R. Moszynski and K. Szalewicz, Chem. Rev., 1994, 94, 1887–1930 CrossRef CAS.
- R. Bukowski, J. Sadlej, B. Jeziorski, P. Jankowski, K. Szalewicz, S. A. Kucharski, H. L. Williams and B. M. Rice, J. Chem. Phys., 1999, 110, 3785–3803 CrossRef CAS.
- D. G. Smith, L. A. Burns, D. A. Sirianni, D. R. Nascimento, A. Kumar, A. M. James, J. B. Schriber, T. Zhang, B. Zhang, A. S. Abbott, E. J. Berquist, M. H. Lechner, L. A. Cunha, A. G. Heide, J. M. Waldrop, T. Y. Takeshita, A. Alenaizan, D. Neuhauser, R. A. King, A. C. Simmonett, J. M. Turney, H. F. Schaefer, F. A. Evangelista, A. E. Deprince, T. D. Crawford, K. Patkowski and C. D. Sherrill, J. Chem. Theory Comput., 2018, 14, 3504–3511 CrossRef CAS PubMed.
- T. Lu and F. Chen, J. Comput. Chem., 2012, 33, 580–592 CrossRef CAS PubMed.
- R. Crespo-Otero and M. Barbatti, Theor. Chem. Acc., 2012, 131, 1237 Search PubMed.
- M. Barbatti, M. Ruckenbauer, F. Plasser, J. Pittner, G. Granucci, M. Persico and H. Lischka, WIREs Computational Molecular Science, 2014, 4, 26–33 Search PubMed.
- K. Lee and D. Kim, J. Phys. Chem. C, 2016, 120, 28330–28336 CrossRef CAS.
- W. Zhao, T. S. Cheung, N. Jiang, W. Huang, J. W. Lam, X. Zhang, Z. He and B. Z. Tang, Nat. Commun., 2019, 10, 1595 CrossRef PubMed.
- Z. He, W. Zhao, J. W. Lam, Q. Peng, H. Ma, G. Liang, Z. Shuai and B. Z. Tang, Nat. Commun., 2017, 8, 1–7 CrossRef CAS PubMed.
- H. Haink and J. Huber, J. Mol. Spectrosc., 1976, 60, 31–42 CrossRef CAS.
- R. D. Johnson III, NIST Computational Chemistry Comparison and Benchmark Database, 2020, https://cccbdb.nist.gov/ Search PubMed.
- H. Noda, X. K. Chen, H. Nakanotani, T. Hosokai, M. Miyajima, N. Notsuka, Y. Kashima, J. L. Brédas and C. Adachi, Nat. Mater., 2019, 18, 1084–1090 CrossRef CAS PubMed.
- N. Aizawa, Y. Harabuchi, S. Maeda and Y. J. Pu, Nat. Commun., 2020, 11, 3909 CrossRef CAS PubMed.
- S. R. Yost, E. Hontz, S. Yeganeh and T. Van Voorhis, J. Phys. Chem. C, 2012, 116, 17369–17377 CrossRef CAS.
- J. Aragó and A. Troisi, Adv. Funct. Mater., 2016, 26, 2316–2325 CrossRef.
- M. Dommett, M. Rivera, M. T. Smith and R. Crespo-Otero, J. Mater. Chem. C, 2020, 8, 2558–2568 RSC.
- M. Kasha, H. R. Rawls and M. Ashraf El-Bayoumi, Pure Appl. Chem., 1965, 11, 371–392 CAS.
- M. Rivera, L. Stojanović and R. Crespo-Otero, J. Phys. Chem. A, 2021, 125, 1012–1024 CrossRef CAS PubMed.
- B. Li, Y. Gong, L. Wang, H. Lin, Q. Li, F. Guo, Z. Li, Q. Peng, Z. Shuai, L. Zhao and Y. Zhang, J. Phys. Chem. Lett., 2019, 10, 7141–7147 CrossRef CAS PubMed.
- R. Katoh, M. Kotani, Y. Hirata and T. Okada, Chem. Phys. Lett., 1997, 264, 631–635 CrossRef CAS.
- W.-H. Fang, Acc. Chem. Res., 2008, 41, 452–457 CrossRef CAS PubMed.
- C. M. Marian, Annu. Rev. Phys. Chem., 2021, 72, 617–640 CrossRef CAS PubMed.
- H. Ma, Q. Peng, Z. An, W. Huang and Z. Shuai, J. Am. Chem. Soc., 2019, 141, 1010–1015 CrossRef CAS PubMed.
- T. J. Penfold, F. B. Dias and A. P. Monkman, Chem. Commun., 2018, 54, 3926–3935 RSC.
- A. Endo, M. Ogasawara, A. Takahashi, D. Yokoyama, Y. Kato and C. Adachi, Adv. Mater., 2009, 21, 4802–4806 CrossRef CAS PubMed.
- J. Gibson and T. J. Penfold, Phys. Chem. Chem. Phys., 2017, 19, 8428–8434 RSC.
- P. Pander, R. Motyka, P. Zassowski, M. K. Etherington, D. Varsano, T. J. Da Silva, M. J. Caldas, P. Data and A. P. Monkman, J. Phys. Chem. C, 2018, 122, 23934–23942 CrossRef CAS.
- P. K. Samanta, D. Kim, V. Coropceanu and J. L. Brédas, J. Am. Chem. Soc., 2017, 139, 4042–4051 CrossRef CAS PubMed.
- X. K. Chen, S. F. Zhang, J. X. Fan and A. M. Ren, J. Phys. Chem. C, 2015, 119, 9728–9733 CrossRef CAS.
- T. J. Penfold, J. Phys. Chem. C, 2015, 119, 13535–13544 CrossRef CAS.
- M. Lv, X. Wang, D. Wang, X. Li, Y. Liu, H. Pan, S. Zhang, J. Xu and J. Chen, Phys. Chem. Chem. Phys., 2021, 23, 25455–25466 RSC.
- C. Chen, Z. Chi, K. C. Chong, A. S. Batsanov, Z. Yang, Z. Mao, Z. Yang and B. Liu, Nat. Mater., 2020, 4–10 Search PubMed.
- R. Kabe and C. Adachi, Nature, 2017, 550, 384–387 CrossRef CAS PubMed.
- N. Nishimura, Z. Lin, K. Jinnai, R. Kabe and C. Adachi, Adv. Funct. Mater., 2020, 30, 2000795 CrossRef CAS.
- Z. Wu, J. C. Roldao, F. Rauch, A. Friedrich, M. Ferger, F. Würthner, J. Gierschner and T. B. Marder, Angew. Chem., Int. Ed., 2022, 61, e202200599 CAS.
Footnote |
| † Electronic supplementary information (ESI) available. See DOI: https://doi.org/10.1039/d2cp04802g |
| This journal is © the Owner Societies 2022 |