 Open Access Article
Creative Commons Attribution 3.0 Unported Licence
Structural investigation of sulfobetaines and phospholipid monolayers at the air–water interface†
Naomi
Elstone‡
 *ab,
Thomas
Arnold
 bcde,
Maximilian W. A.
Skoda
 e,
Simon E.
Lewis
 ab,
Peixun
Li
 e,
Gavin
Hazell§
 b and
Karen J.
Edler¶
 ab
ab
aCentre for Sustainable & Circular Technologies, University of Bath, Claverton Down, Bath, BA2 7AY, UK. E-mail: Naomi.Elstone@york.ac.uk
bDepartment of Chemistry, University of Bath, Claverton Down, Bath, BA2 7AY, UK
cEuropean Spallation Source ERIC, P.O. Box 176, SE-221 00 Lund, Sweden
dDiamond Light Source, Harwell Science and Innovation Campus, Didcot, OX11 0DE, UK
eISIS Neutron Source Facility, Harwell Science and Innovation Campus, Didcot, OX11 0DE, UK
First published on 6th September 2022
Abstract
Mixtures of sulfobetaine based lipids with phosphocholine phospholipids are of interest in order to study the interactions between zwitterionic surfactants and the phospholipids present in cell membranes. In this study we have investigated the structure of mixed monolayers of sulfobetaines and phosphocholine phospholipids. The sulfobetaine used has a single 18-carbon tail, and is referred to as SB3-18, and the phospholipid used is DMPC. Surface pressure–area isotherms of the samples were used to determine whether any phase transitions were present during the compression of the monolayers. Neutron and X-ray reflectometry were then used to investigate the structure of these monolayers perpendicular to the interface. We found that the average headgroup and tail layer thickness was reasonably consistent across all mixtures, with a variation of less than 3 Å reported in the total thickness of the monolayers at each surface pressure. However, by selective deuteration of the two components of the monolayers, it was found that the two components have different tail layer thicknesses. For the mixture with equal compositions of DMPC and SB3-18 or with a higher composition of DMPC the tail tilts were found to be constant, resulting in a greater tail layer thickness for SB3-18 due to its longer tail. For the mixture higher in SB3-18 this was not the case, the tail tilt angle for the two components was found to be different and DMPC was found to have a greater tail layer thickness than SB3-18 as a result.
1 Introduction
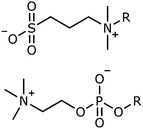
Sulfobetaines are zwitterionic amphiphiles with the opposite headgroup charge distribution to many phospholipids, such as phosphocholine lipids, found in cell membranes.Sulfobetaine (SB) headgroups consist of a terminal sulfonate group attached to a quaternary ammonium group with a hydrocarbon linker, in this study a propylene linker has been used, Fig. 1. (The notation SBn-c is used to describe such systems, where n is the number of carbon atoms in the hydrocarbon linker and c is the number of carbon atoms in the hydrocarbon tail, R in Fig. 1.) Phosphocholine (PC) groups consist of a terminal quaternary ammonium group linked to a phosphate group by an ethylene hydrocarbon linker.
PC lipids are the main component of lipid bilayers found in cells and as such monolayers, bilayers and vesicles of PC lipids have been widely used as simple models for cell membranes. These models have been used to investigate the interactions of cell membranes with drugs, as the level of insertion of these compounds can give an indication into whether the drugs are likely to be transported into the cell, and so be efficacious.1,2
Phospholipids have also been considered for use as delivery vectors and for other medical applications as they are intrinsically non-toxic to cells.3 However, the cost of the extraction of phospholipids as pure compounds is high and their synthesis is non-trivial.4 Despite these disadvantages much research has been carried out into these compounds, including detailed studies using neutron and X-ray reflectivity.5–11
Sulfobetaines are similarly non-toxic and so they have also been used in a range of medical applications, such as in commercial eye drop formulations, which facilitate the stabilisation of human eye tear protein, to decrease dry eye.12 They have also been found to stabilise enzymes such as β-lactamase, have been used to aid the stabilisation of iron oxide nanoparticles for use as MRI contrast agents and as drug delivery vehicles either to facilitate the formation of emulsions, for example for delivery of vitamin E, or as vesicles.13,14 In addition, their anti-microbial and anti-fungal properties, due the their zwitterionic nature, are likely to cause drug formulations to be longer lasting without the addition of further preservatives reducing cost and complexity.15 Tiecco et al.16 found that sulfobetaine micelles can have biocidal activity upon Saccharomyces cerevisiae cells, which are used as model cells for yeasts and fungi. They believe this is caused by the pseudocationic behavior of the micelles which has been observed in other zwitterionic systems.16 The degree of toxicity was found to vary significantly depending on the length of the linker between the charged regions of the sulfobetaine headgroup; with longer linkers leading to a reduction in the biocidal activity. It has also been observed that sulfobetaines with chain lengths greater than 12 carbons have antimicrobial activity against both Gram-positive and Gram-negative bacteria. The efficacy of sulfobetaine surfactants against Gram-positive bacteria is greater than that against Gram-negative bacteria.17
Structural studies of sulfobetaines are much more limited than for their phospholipid counterparts. We have previously shown that sulfobetaines with appropriately long tail lengths can form monolayers on the surface of water, and have investigated their structures using X-ray and neutron reflectivity.18 Pressure–area isotherms were measured for both single and dichain sulfobetaine monolayers, showing shapes similar to their PC analogues. For example, the di-chain molecules show a plateau region at 8 mN m−1 similar to that observed for Dipalmitoylphosphatidylcholine, DPPC.19 The Brewster angle microscopy, BAM, images of these monolayers at pressures through this transition point show different domain morphologies. The sulfobetaines give dendritic phases while those of DPPC and DMPC are more globular with characteristically multi-lobed with rounded edges, suggesting a difference in the structure of the monolayers.18,19 While BAM can be used to determine the thickness of the monolayer, this has not been determined for the sulfobetaine.20 Instead the structure of these monolayers has been investigated using reflectivity, with the sulfobetaines having a chain tilt that is significantly lower (i.e. the tails lie more towards the plane of the air–water interface) than that of DPPC. We postulated that these observed variations are caused by the difference in relative head group size between the two classes of compound.18,19
We are now interested in the interactions between sulfobetaines and phospholipids since this may enhance our understanding of the interactions of sulfobetaines with cell membranes and also because of the potential applications of these mixed systems. For example, they may be of use for designing vesicles as templates for biomineralisation or drug delivery systems. By using different ratios of PC and SB lipids it should be possible to control the overall surface charge of their aggregate structures which could be of use in controlling delivery and stability.
To facilitate the development of such applications it is important to understand how the interactions of the two headgroups affects the properties of the mixed monolayers. Aikawa et al.21 have directly investigated this, using DPPC and a sulfobetaine analogue which (unlike our molecule) is structurally identical to DPPC outside of the headgroup (i.e. they include the carboxylate linkers to the saturated hydrocarbon tails). They investigated their systems using differential scanning calorimetry, DSC, and by analysing pressure–area isotherms. Surface pressure–area isotherms showed a negative deviation in the extrapolated area-per molecule while DSC was used to determine the excess free-energy of mixing, which showed a minimum for the 1![[thin space (1/6-em)]](https://www.rsc.org/images/entities/char_2009.gif) :
:![[thin space (1/6-em)]](https://www.rsc.org/images/entities/char_2009.gif) 1 mixture. Thus it was concluded that their sulfobetaines and phospholipids show a favorable interaction with each other, which will result in homogenous mixtures of alternating lipids in monolayers at 1
1 mixture. Thus it was concluded that their sulfobetaines and phospholipids show a favorable interaction with each other, which will result in homogenous mixtures of alternating lipids in monolayers at 1![[thin space (1/6-em)]](https://www.rsc.org/images/entities/char_2009.gif) :
:![[thin space (1/6-em)]](https://www.rsc.org/images/entities/char_2009.gif) 1 molar ratios.22
1 molar ratios.22
In this study we build upon our earlier structural study to investigate the structure of monolayers at the air–water interface composed of mixtures of dimyristoylphosphatidylcholine, (DMPC) and the single chained sulfobetaine 3-(dimethyloctadecylammonio) propane-1-sulfonate, (SB3-18) as a simple model sulfobetaine, which is more like those generally used industrially, which are cheaper and simpler to synthesise than their double tailed equivalents. This is particularly relevant since our use of neutron reflectometry (NR) requires the synthesis of deuterated molecules, something that is not trivial for the di-chain version of these molecules. We used the octadecyl carbon tail as it was the shortest sulfobetaine chain which forms stable monolayers with repeatable isotherms.
Our choice of phospholipid, DMPC, is based on the aim of choosing a lipid with biological relevance that has been well characterised in the literature and has a tail thickness in a monolayer reasonably close to that of our sulfobetaine.22 This occurs despite the tail length of DMPC being significantly shorter than that of SB3-18. The similar tail thickness is caused by differences in the tail tilt, DMPC has a tail tilt that is much lower than SB3-18. In order to allow for direct comparison with experiments carried out by us previously on pure sulfobetaine monolayers, all experiments were carried out a room temperature, 22 °C. This is slightly below the phase transition temperature of DMPC which is 23.9 °C but as discussed later we show that the monolayer is in the liquid expanded, LE, phase at this temperature under the conditions used.22,23
Analysis of Langmuir isotherms has historically been the main method for exploring mixed monolayers of insoluble lipids, although some work has been carried out using BAM, which allows the visualisation of mixed phases which can occur upon compression. However, again, this gives limited structural information on the DMPC and SB3-18 mixed monolayers at room temperature as no lateral inhomogeneities are observed upon monolayer compression.11,18 Investigations have been carried out using Grazing Incidence X-ray diffraction, GIXD, in combination with X-Ray reflectivity, XRR, to investigate DPPC systems mixed with sterols, cholesterol and glycosphingolipids.9,24,25 This technique was not used for this system as GIXD requires the tails to be organised into a crystalline structure which is not the case at low surface pressures or when the sample is in the liquid expanded or gaseous phases, as observed for our monolayers at room temperature.
The use of NR allows one to obtain various different data sets arising from different scattering contrasts for the system under investigation. Such a methodology has been used to investigate many different mixed monolayers such as those of antibiotics and eicosanoic acid.26 In this case selective deuteration of the different components of the monolayer means that we may obtain information about the structure of each component within the mixture separately.
2 Materials and methods
2.1 Materials
In this study we investigated the differences in the structures of pure and mixed monolayers of 3-[N,N-dimethyl-N-octadecylammonio]propane-1-sulfonate (SB3-18) and 1,2-dimyristoyl-sn-glycero-3-phosphocholine (DMPC). Both of these compounds were used in the hydrogenated and partially deuterated forms. Hydrogenated (h-) SB3-18 was purchased from Sigma Aldrich at purity levels of 96% or higher. Hydrogenated and deuterated L-DMPC were purchased from Avanti, both chemicals have >99% purity and deuterated (d-)DMPC has a deuteration level of 99%. The deuterated SB3-18 was synthesized using 1-bromooctadecane-d37, purity <99.8% deuteration <98%, provided by the ISIS Deuteration Facility using the procedure previously published by Hazell et al.18 Chemicals required for the synthesis, excluding the 1-bromooctadecane, were purchased from Sigma-Aldrich and used without further purification. Further details of the synthesis are reported in the ESI.†Ultra-pure water used in these studies was purified to a resistivity of 18.2 MΩ cm using an Elga Pure Lab.
2.2 Langmuir trough studies
Pressure–area isotherms were carried out using a Nima Technology Langmuir trough (20 × 40 cm). The surface pressure sensor used the Wilhelmy plate method to measure surface tension using a 1 cm wide filter-paper plate.The lipid solutions were prepared at a concentration of 0.5 mg mL−1 in chloroform. For the mixed monolayers these chloroform solutions were mixed to prepare samples with 3![[thin space (1/6-em)]](https://www.rsc.org/images/entities/char_2009.gif) :
:![[thin space (1/6-em)]](https://www.rsc.org/images/entities/char_2009.gif) 1, 1
1, 1![[thin space (1/6-em)]](https://www.rsc.org/images/entities/char_2009.gif) :
:![[thin space (1/6-em)]](https://www.rsc.org/images/entities/char_2009.gif) 1 and 1
1 and 1![[thin space (1/6-em)]](https://www.rsc.org/images/entities/char_2009.gif) :
:![[thin space (1/6-em)]](https://www.rsc.org/images/entities/char_2009.gif) 3 molar ratios of the two compounds. Lipid monolayers were spread onto pure water subphases to create the monolayers, and 10 minutes was allowed for chloroform evaporation prior to the start of measurements. Prior to the collection of all data (including NR, XRR and isotherm measurements) the monolayers were compressed and expanded to a surface pressure below the collapse point to ensure that the lipids reached equilibrium.
3 molar ratios of the two compounds. Lipid monolayers were spread onto pure water subphases to create the monolayers, and 10 minutes was allowed for chloroform evaporation prior to the start of measurements. Prior to the collection of all data (including NR, XRR and isotherm measurements) the monolayers were compressed and expanded to a surface pressure below the collapse point to ensure that the lipids reached equilibrium.
Pressure–area isotherms were collected at room temperature using a double barrier compression system with a compression rate of 20 cm2 min−1. The results reported are the average of two or three repeated isotherms.
From the isotherms we have extracted the following parameters to characterise the monolayers. Firstly, the limiting area and the collapse pressure and area (each determined from the data in Fig. 2) are indicative of the strength of the interactions between molecules. Secondly, the compression modulus is a useful tool for determining the behavior of a monolayer, as it gives an indication of the film stiffness and so the nature of the monolayer. It can be calculated using eqn (1), where Cs is the compressional modulus, A is the area per molecule and π is the surface pressure.21,27
 | (1) |
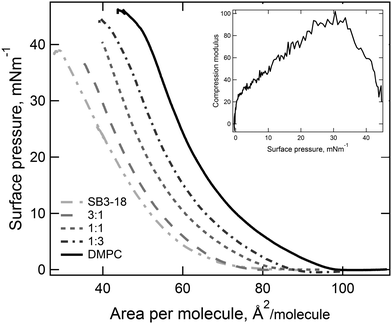 | ||
Fig. 2 Pressure–area isotherm recorded for mixtures of DMPC![[thin space (1/6-em)]](https://www.rsc.org/images/entities/char_2009.gif) : :![[thin space (1/6-em)]](https://www.rsc.org/images/entities/char_2009.gif) SB3-18, error bars excluded for clarity and the compressional modulus determined for the 1 SB3-18, error bars excluded for clarity and the compressional modulus determined for the 1![[thin space (1/6-em)]](https://www.rsc.org/images/entities/char_2009.gif) : :![[thin space (1/6-em)]](https://www.rsc.org/images/entities/char_2009.gif) 3 SB3-18 3 SB3-18![[thin space (1/6-em)]](https://www.rsc.org/images/entities/char_2009.gif) : :![[thin space (1/6-em)]](https://www.rsc.org/images/entities/char_2009.gif) DMPC pressure–area isotherm. DMPC pressure–area isotherm. | ||
2.3 Reflectivity
XRR, data was collected using the I07 beamline at the Diamond Light Source using the double crystal deflector (DCD) for reflectivity from liquid interfaces and a Nima Langmuir trough at controlled temperature under a helium atmosphere to minimise beam damage.28 The position of the trough was also shifted horizontally between each measurement to minimise beam damage to the monolayer. Reflectivity data is reported as a function of the momentum transfer, Q. | (2) |
Four data sets were collected using different attenuation regimes to cover the desired Q range between 0.018 and 0.8 Å−1 and normalised to the critical edge and by the incident flux (measured separately) as a function of the incident angle. The XRR measurements were carried out at a beam energy of 12.5 keV and data was collected from a region of interest containing the reflected beam on a Pilatus 100k detector, a second offset region of interest was simultaneously recorded in order to be able to approximately subtract the background.28,29 Measurements of the monolayers at the air–water interface were taken at surface pressures 15 mN m−1 and 35 mN m−1 to investigate the effect of compression upon the monolayer structure. Due to the metastable nature of monolayers we carried out measurements at fixed surface pressure, as if measurements were carried out a fixed surface area the lipids may reorganise at the interface. The surface pressure may change during a measurement if only the area of the trough was controlled. By controlling the surface pressure, we are able to ensure that the monolayers are stable over the full measurement time of 10–15 minutes (this was tested by repetition of the measurements) and that the data are therefore comparable for different experiments.
NR data was collected on the INTER beamline on Target Station 2 at the ISIS Pulsed Neutron and Muon Source (Didcot, UK).30 Measurements used a single detector and fixed grazing incidence angles of 0.8° and 2.3°, the neutrons used had a wavelength, λ, between 1.5–15 Å. Absolute reflectivity was calibrated with respect to the direct beam and the reflectivity curve recorded from a clean D2O surface.30 A minimum of two contrasts were measured for each sample, one on D2O and one on Air Contrast Matched Water, ACMW, all measurements were carried out in air.
Although some small differences between different samples are unavoidable, in order to minimise differences between measurements, where possible, identical samples and methodologies were used for both neutron and X-ray reflectivity measurements. In particular, both deuterated and hydrogenated samples were measured using XRR, with no significant differences seen in the data seen between the two samples.
Variation in the interactions between the headgroups and the different subphases need to be considered. These molecules are small and so the number of hydrogens versus deuteriums in the headgroups is small when compared to macromolecules. In addition the headgroups have no exchangeable protons and so isotopic effects observed for other widely studied systems, such as proteins, will be negligible.31 D2O and H2O may interact differently with the headgroups. However we expect this to be small compared to the interactions between the headgroups which are ionic and therefore have a much greater magnitude than isotopic effects.
We have used a two-layer slab model to interpret our reflectometry data. Such models have been widely used in the literature for phospholipid monolayers. Data were fitted using the Motofit package within the Igor Pro (Wavemetrics) platform which uses the Abeles matrix method to calculate the reflectivity profile from the scattering length density (SLD) thickness and roughness of each layer. This software allows multiple contrasts to be co-refined to find the best model to fit the data.32,33
Differences between XRR and NR data can make co-refinement of the data challenging. The larger number of data points and nature of the error present in X-ray data compared to that in the NR data can lead to a greater weighting being applied to XRR data. To mitigate this a semi-manual approach has been used where multiple fitting iterations were carried out and constraints were applied as required to attain the best fit to all data sets while reflecting the physical reality of the monolayer as discussed later. Co-refinement of different contrasts in neutron samples and between neutron and X-ray measurements leads to greater constraint within the model used. Due to the many parameters which need to be defined when fitting reflectivity data, greater constraints result in fits which are more likely to be physically accurate.
When fitting our reflectivity data, we must define the X-ray and neutron scattering length densities (SLDs) for the lipid headgroups and tails, the two layers which define the model. These are calculated, using eqn (3), from the molecular volume of the relevant parts of the phospholipids and sulfobetaines which have been previously determined and are reported in Table 1.34
 | (3) |
| Sample | MVhead, Å3 | MVtail, Å3 | MVtotal, Å3 |
|---|---|---|---|
| DMPC | 319 | 782 | 1101 |
| SB3-18 | 181 | 510 | 691 |
Despite an extensive number of publications in this area, MV values for DMPC are quite inconsistent throughout the literature. In part this is because the volumes are dependent upon the phase of the molecules, something that is often overlooked.37 Knoll et al.38 found that the total MV of DMPC-d54 varied between 1085–1144 Å3. In this work we have chosen to use the partial molecular volume for DMPC reported by Nagle et al.34 since these measurements were carried out in the gel phase, where the lipid is fully hydrated, as will be the case for a DMPC monolayer in the liquid expanded (LE) phase on a water subphase.
The calculated SLDs are then used to determine an average SLD to use for the mixed systems, determined using eqn (4). It is assumed that the SLDs of the heads and tails do not vary37 during the experiments reported here, since these samples are assumed to be in the LE phase throughout compression. This assumption is justified in the results and discussion section below.
| SLDmix = XDMPCSLDDMPC+ (1 − XDMPC)SLDSB3-18 | (4) |
Tail thickness is constrained by the area per molecule obtained from pressure–area isotherms, using eqn (5), which relates scattering length (b), SLD and thickness of the layer (T) to the area per molecule, APM. The calculated APM was constrained to within 10% of the experimentally determined values obtained from surface pressure–area isotherms for these systems.22
 | (5) |
Headgroup hydration was also constrained to a value which ensured that the number of heads and tails present in the monolayer was equal for the fitted parameters. The solvent penetration, ϕs, is calculated using the following relationship:39,40
 | (6) |
Since the systems under investigation here are mixtures, we have allowed the interfacial roughness to be a fitted variable. The meaningfulness of this roughness parameter will be discussed in the context of the results below.
The X-ray SLD of water is taken as 9.45 × 10⁻⁶ Å−2, while for the neutron SLD for D2O is 6.36 × 10⁻⁶ Å−2 and for air contrast matched water, ACMW, it is 0 Å−2. The roughness of the water was assumed to be approximately equal to the well-established (capillary wave) roughness of 3 Å, although some variation is allowed to account for differences due to the presence of the lipids.41
It should be noted that, as with all fitting of reflectometry data, some of the variables may be correlated. For example, the division between head and tail thickness is usually correlated so that a reduction in one thickness results in an increase in the other. These correlations can be reduced by increasing the amount of data used in co-refinement, i.e. by increasing the number of neutron contrasts measured and by constraining the models used to fit the data. Nonetheless, there will always be some uncertainty in these parameters and the associated trends.42
3 Results and discussion
3.1 Langmuir monolayers
By compressing insoluble monolayers, the structure of the lipids contained within it can be changed. By measuring the variation in the surface pressure, Fig. 2, an indication of the structure of the lipids within the monolayer at any given surface pressure can be obtained. The pressure–area isotherms recorded for the pure samples are consistent with those reported in the literature under the same conditions.18,22 For the mixtures of SB3-18 and DMPC no plateau regions are present, which would have indicated a liquid expanded–liquid condensed (LE–LC) phase transition, suggesting that the monolayer is in a single phase throughout compression. By analysis of the pressure–area isotherms, Fig. 2, further parameters can be extracted which can give a greater indication as to the structure of the monolayers and allow for comparison between different systems. This analysis also gives a further indication as to the phase of the monolayer, as shown by the compression modulus. The maximum compression modulus, calculated using eqn (1) and reported in Table 2, indicates that monolayers containing SB3-18 have mostly LE character, as the compression modulus is ≤100 mN m−1.43 Although the exact boundaries between LE and LC from compression modulus are widely debated and the boundary varies between 50 and 200 mN m−1 depending upon the criteria used to define the boundary.44,45 The higher compression modulus for the pure DMPC monolayer meant that the nature of the phase present required further consideration, as it may indicate that the monolayer has some LC character.46 The high compression modulus may be caused by the fact that at 22 °C the monolayer is just below the lipid transition temperature of 23.9 °C. However, pressure–area isotherms, carried out by Johnson et al.22 at 22 °C showed no plateau and those carried out by Kewalramani et al.47 at 15 °C only saw a plateau in the isotherm at 30 mN m−1 which is not seen in our data shown in Fig. 2. Pressure–area isotherms have been carried out for DMPC at a range of temperatures, and analysis of the compression moduli of these isotherms, indicate that the transition from LE to LC is seen below 17 °C.46 As this transition is observed at below 17 °C we can assume that at higher temperatures the monolayer is in the LE phase.| Sample | Collapse point (mN m−1) | Collapse area (Å2) | Limiting area (Å2) | Compression modulus (mN m−1) |
|---|---|---|---|---|
| DMPC | 45 ± 1 | 45 | 77 | 115 ± 4 |
3![[thin space (1/6-em)]](https://www.rsc.org/images/entities/char_2009.gif) : :![[thin space (1/6-em)]](https://www.rsc.org/images/entities/char_2009.gif) 1 1 |
44 ± 3 | 39 | 70 | 100 ± 3 |
1![[thin space (1/6-em)]](https://www.rsc.org/images/entities/char_2009.gif) : :![[thin space (1/6-em)]](https://www.rsc.org/images/entities/char_2009.gif) 1 1 |
43 ± 2 | 37 | 66 | 93 ± 3 |
1![[thin space (1/6-em)]](https://www.rsc.org/images/entities/char_2009.gif) : :![[thin space (1/6-em)]](https://www.rsc.org/images/entities/char_2009.gif) 3 3 |
41 ± 5 | 33 | 61 | 78 ± 1 |
| SB3-18 | 37 ± 2 | 35 | 69 | 57 ± 4 |
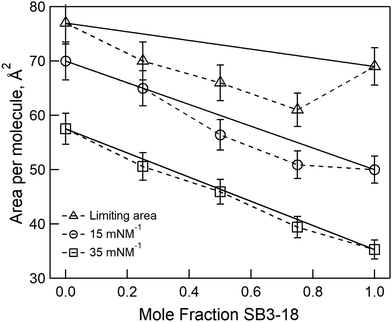
By plotting the limiting area per molecule against the composition of the monolayer the nature of the mixing between the two components can be assessed. In Fig. 3, the expected results for ideal mixing are shown (the solid line), with a small negative deviation from this seen for the limiting area. We can therefore assume slightly non-ideal mixing with the interactions between the different components of the monolayer being more favourable than those between the two molecules of the same type. However, we also plotted the area per molecule at the two surface pressures used for reflectivity experiments and found the extent of this deviation is even smaller, the ΔGmix values have been calculated at 15 and 35 mN m−1 and are included in Table S2 (ESI†). Therefore, in order to simplify our analysis of the reflectivity data, we assume ideal mixing with no compaction of the monolayer compared to the pure components.
3.2 Reflectometry
To further reinforce the assumption of that ideal mixing is present some initial analysis of the XRR data for the pure and mixed systems was carried out. The XRR data for the mixtures at 15 mN m−1 is shown in Fig. 4 along with the position of the minimum of the interference fringe in the XRR data as a rough guide to the film thickness. For an ideally mixed system where the interactions between the different molecules are equal in magnitude to those between present in the pure systems, we might expect a gradual transition in structure between that of the two pure components. This is not observed in Fig. 4. However, what we actually care about is the variation of molecular volume versus composition, since it is this that we use to calculate SLDs for the mixtures. We can obtain this by combining the XRR data and the pressure–area isotherms. The molecular volume is simply the product of the isotherm derived area per molecule and the overall layer thickness derived from the XRR fringe spacings. The results of this are plotted in Fig. 4. From this we can conclude that the molecular volume at each composition studied can be approximated to the linear average of the pure volumes and, therefore, that the individual component volumes do not change significantly when mixed nor when compressed to 15 or 35 mN m−1. We have thus used the average molecular volumes of the mixture components to calculate the scattering length densities used in fitting the reflectivity data.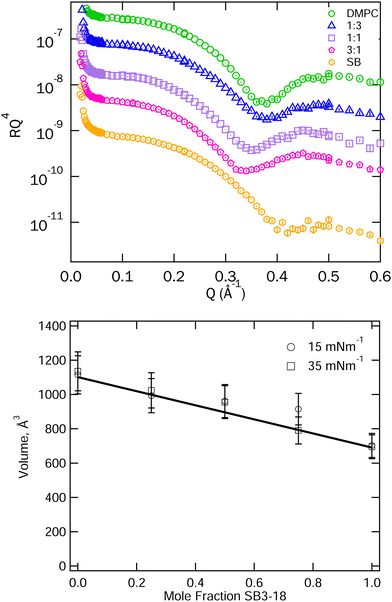 | ||
| Fig. 4 Top: XRR data for SB3-18 and DMPC and their mixtures on water at 15 mN m−1, data are shifted vertically to allow clearer visualisation. Error bars are shown but are largely within the symbols on the graph. Peak positions are included in Fig. S2 (ESI†). Bottom: Total molecular volumes derived from the isotherm area per molecule and the position of the first fringe in the XRR data. The solid line represents the average of the molecular volumes for the pure components. | ||
We can now compare the data obtained for the pure monolayers with that previously published in the literature. Johnson et al.22 published fits of DMPC measured with NR at 10 and 30 mN m−1 and at 22 °C. If we use their fit parameters to calculate the reflectivity of all of the X-ray and neutron contrasts measured by us (15 and 35 mN m−1), we find a significant deviation from our measured data, see Fig. 5 (further details of this are reported in Table S3, ESI†). In this case it seems that the neutron data gives acceptable fits but the corresponding calculated fit to the XRR data is clearly inadequate.
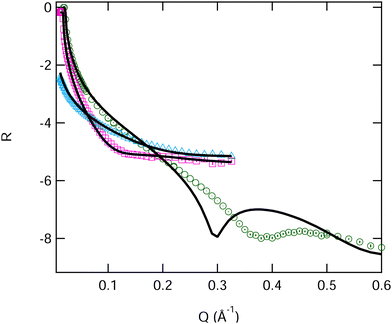 | ||
| Fig. 5 Fitted reflectivity data DMPC at 15 mN m−1 surface pressure on water. Two NR contrasts, blue ACMW and pink D2O, and an XRR contrast, in green. Uncertainties in the experimental data are shown on the graph but are largely within the size of the symbols. Fits are from the values reported by Johnson et al.22 | ||
There may be experimental reasons for these differences, the surface pressure difference between the two measurements for example, however it seems unlikely that this can explain such a large deviation for the X-ray fit, which is clearly from a thinner film than the calculation would predict (i.e. because the interference fringe is at higher Q). Importantly we found that a simple reduction of the tail layer thickness did not improve the overall fit, because while this improves the fit to the X-ray data it worsens the fits to the neutron data. We were therefore forced to consider both head and tail thickness to obtain a good fit to both X-ray and neutron data for DMPC and all of its mixtures with SB3-18. We thus constrained the fits to the area per molecules found from the pressure–area isotherm and extracted physical parameters for the heads and tails of the lipid monolayers, as shown in Tables 3, 4, Fig. 6 and Table S3 (ESI†). The fringe positions from the XRR data, give an indication of the total thickness of the monolayer, with the fits shown below being within error of these. These are comparable to those obtained using BAM measurements previously.20 As expected, the monolayers containing DMPC have significantly larger overall layer thicknesses than those found for the pure SB3-18 monolayer.
| Sample | Headgroup SLD (×10−6 Å−2) | t (Å) | σ (Å) | %H2O | Tail SLD (×10−6 Å−2) | t (Å) | σ (Å) | ||
|---|---|---|---|---|---|---|---|---|---|
| XRR | NR | XRR | NR | ||||||
| DMPC | 14.4 | 1.9 | 5.1 ± 0.5 | 5.3 ± 0.8 | 11 ± 8 | 7.6 | 6.8 | 11.2 ± 1.0 | 3.5 ± 0.2 |
3![[thin space (1/6-em)]](https://www.rsc.org/images/entities/char_2009.gif) : :![[thin space (1/6-em)]](https://www.rsc.org/images/entities/char_2009.gif) 1 1 |
14.3 | 1.7 | 4.9 ± 0.4 | 4.6 ± 0.3 | 4 ± 3 | 7.7 | 6.9 | 10.9 ± 0.5 | 4.6 ± 0.3 |
1![[thin space (1/6-em)]](https://www.rsc.org/images/entities/char_2009.gif) : :![[thin space (1/6-em)]](https://www.rsc.org/images/entities/char_2009.gif) 1 1 |
14.2 | 1.4 | 5.3 ± 1.0 | 4.5 ± 0.3 | 14 ± 7 | 7.8 | 7.0 | 11.4 ± 0.4 | 4.8 ± 0.3 |
1![[thin space (1/6-em)]](https://www.rsc.org/images/entities/char_2009.gif) : :![[thin space (1/6-em)]](https://www.rsc.org/images/entities/char_2009.gif) 3 3 |
14.0 | 1.2 | 5.0 ± 0.4 | 4.3 ± 0.6 | 7 ± 5 | 7.9 | 7.1 | 11.3 ± 1.0 | 4.9 ± 0.7 |
| SB3-18 | 13.9 | 1.0 | 4.3 ± 0.2 | 4.9 ± 0.5 | 15 ± 5 | 8.0 | 7.2 | 10.2 ± 0.4 | 4.0 ± 0.3 |
| Sample | Headgroup SLD (×10−6 Å−2) | t (Å) | σ (Å) | %H2O | Tail SLD (×10−6 Å−2) | t (Å) | σ (Å) | ||
|---|---|---|---|---|---|---|---|---|---|
| XRR | NR | XRR | NR | ||||||
| DMPC | 14.4 | 1.9 | 7.2 ± 0.4 | 5.0 ± 0.8 | 20 ± 7 | 7.6 | 6.8 | 13.6 ± 0.8 | 4.8 ± 0.4 |
3![[thin space (1/6-em)]](https://www.rsc.org/images/entities/char_2009.gif) : :![[thin space (1/6-em)]](https://www.rsc.org/images/entities/char_2009.gif) 1 1 |
14.3 | 1.7 | 6.2 ± 0.5 | 5.1 ± 0.5 | 4 ± 5 | 7.7 | 6.9 | 14.0 ± 0.6 | 5.0 ± 0.3 |
1![[thin space (1/6-em)]](https://www.rsc.org/images/entities/char_2009.gif) : :![[thin space (1/6-em)]](https://www.rsc.org/images/entities/char_2009.gif) 1 1 |
14.2 | 1.4 | 5.2 ± 0.5 | 4.9 ± 0.4 | 4 ± 5 | 7.8 | 7.0 | 14.0 ± 0.4 | 5.0 ± 0.4 |
1![[thin space (1/6-em)]](https://www.rsc.org/images/entities/char_2009.gif) : :![[thin space (1/6-em)]](https://www.rsc.org/images/entities/char_2009.gif) 3 3 |
14.0 | 1.2 | 6.0 ± 0.3 | 5.0 ± 0.3 | 2 ± 3 | 7.9 | 7.1 | 14.6 ± 0.6 | 5.7 ± 0.3 |
| SB3-18 | 13.9 | 1.0 | 5.2 ± 0.8 | 4.8 ± 0.6 | 0 ± 5 | 8.0 | 7.2 | 14.5 ± 0.5 | 5.9 ± 0.8 |
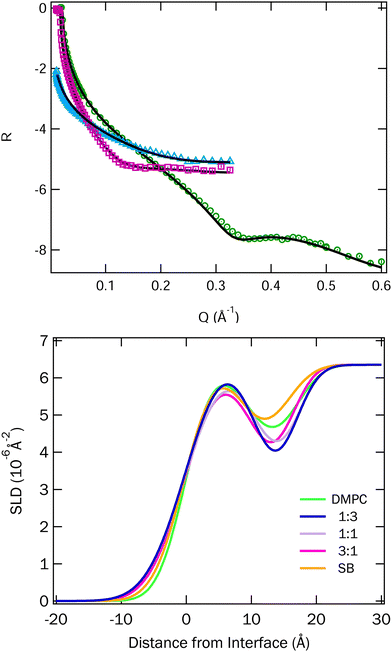 | ||
Fig. 6 Top: Fitted data for the 1![[thin space (1/6-em)]](https://www.rsc.org/images/entities/char_2009.gif) : :![[thin space (1/6-em)]](https://www.rsc.org/images/entities/char_2009.gif) 1 mixture of DMPC and SB3-18 at 15 mN m−1. Two NR contrasts, blue ACMW and pink D2O, and an XRR contrast, in green. Fits for other mixtures and surface pressures can be found in Fig. S3 and S4 (ESI†). Bottom: SLD profiles for the mixtures of DMPC and SB3-18 at 15 mN m−1, on D2O, which were corefined with the ACMW and XRR data, all SLD profiles can be found in Fig. S5 and S6 (ESI†). 1 mixture of DMPC and SB3-18 at 15 mN m−1. Two NR contrasts, blue ACMW and pink D2O, and an XRR contrast, in green. Fits for other mixtures and surface pressures can be found in Fig. S3 and S4 (ESI†). Bottom: SLD profiles for the mixtures of DMPC and SB3-18 at 15 mN m−1, on D2O, which were corefined with the ACMW and XRR data, all SLD profiles can be found in Fig. S5 and S6 (ESI†). | ||
Surprisingly our fits suggest a thinner head layer than we might expect based on the literature, but attempts to fit the data with thicker headgroup layers did not lead to good fits. We believe that the results obtained can be explained when the differences between X-ray and neutron scattering are considered. Phospholipid headgroups contain electron rich elements, and as such often the contrast resolution of the heads is better for XRR than for NR (although this does depend on the available molecular deuteration). In the current case the combination of both XRR and two NR contrasts gives us improved resolution between the heads and tails of the lipids and thereby suggests that the headgroup thickness that is notably less than that found by NR alone. We will discuss this point further below.
We can also compare the parameters of our current fits of SB3-18 with those previously determined by Hazell et al.18 The current fit suggests a slightly higher tail thickness and a thinner, less hydrated headgroup layer. While the parameters from Hazell et al. give an acceptable fit to the new data, and the sum of the head and tail thicknesses are within the error of our new fits, we believe the new fits are an improvement since there is better agreement to the area per molecule determined from the pressure–area isotherms.
The fitted thickness of the headgroup layer, shown in Table 3, is also quite thin and may indicate that the headgroups do not penetrate very far into the subphase and are instead likely to be lying close to parallel to it. A similar effect has been reported for DPPC bilayers investigated using neutron diffraction, which found that the headgroups lie parallel to the surface of the bilayer.48 Measurements of DPPC monolayers using surface potential measurements, which allow the tilt angle of the headgroup to be determined, have reported a headgroup tilt angle of 88° relative to the surface normal, indicating that the headgroups lie almost parallel to the interface.49 In all cases for the fitting of the headgroup layer the roughness is significant, the cause of this high level of roughness cannot be fully determined using this methodology but may be caused by the repulsion of the like charged regions within the monolayer causing offsetting of the headgroups. Alternative methods for modelling data where a diffuse layer is present, such as microslicing, can be considered, given the normal limitations of the slab models, where a roughness less than 20% of the total thickness is conventionally used. However, these methods do not allow us to apply the necessary constraints discussed in the materials and method section. Use of the two-slab model also allows us to directly compare the results obtained with existing literature, where this is ubiquitously used for lipid and surfactant monolayers, while generating a SLD profile which should reflect the structure present.
There are significantly less data available for comparison when considering the mixed systems. The study by Aikawa et al.21 gives no information on structural changes caused by interactions between the PC & SB head groups and we are not aware of any other published studies of comparable systems.
The fitted SLD profiles extracted from the fits for the data for the DMPC and SB3-18 mixtures at 15 mN m−1 on D2O are shown in Fig. 6 and the SLD profiles for all data at 15 and 35 mN m−1 are shown in Fig. S5 and S6 (ESI†).
In order to highlight the similarities and differences between the structures, we highlight the SLD profiles on D2O here, as it most clearly shows both the head and tail group contributions. The data and corresponding fits are shown in Fig. S3 and S4 in the ESI.†
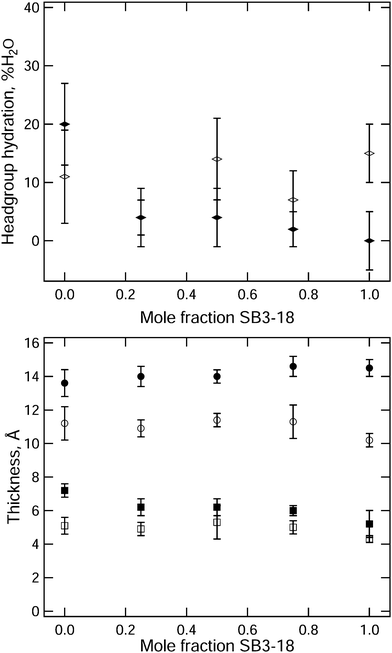
The headgroup hydration and thickness of the head and tail regions in the monolayers for the various samples have been plotted against the mole fraction of SB3-18, in Fig. 7. At 15 mN m−1 the variation in the layer thickness between the different samples is small, with a slight increase in both head and tail layer thickness being seen as the composition of SB3-18 increased up to 1![[thin space (1/6-em)]](https://www.rsc.org/images/entities/char_2009.gif) :
:![[thin space (1/6-em)]](https://www.rsc.org/images/entities/char_2009.gif) 3 DMPC
3 DMPC![[thin space (1/6-em)]](https://www.rsc.org/images/entities/char_2009.gif) :
:![[thin space (1/6-em)]](https://www.rsc.org/images/entities/char_2009.gif) SB3-18, after which a decrease in layer thickness is seen. This is reflected by the variation in the XRR fringe position variation in Fig. S2 (ESI†). Potential causes for these variations are discussed later. The variation in headgroup hydration does not follow the same trend, but due to the high degree of error conclusions cannot be reliably drawn from this data. Increasing the surface pressure of the monolayer, and hence decreasing the area per molecule, causes an increase in the tail layer thickness, around 4 Å in total, and a general decrease in the headgroup hydration from around 10% to below 5%. The changes are similar for all the mixtures except for the pure DMPC monolayer which shows possibly anomalous behaviour and will be discussed in more detail below.
SB3-18, after which a decrease in layer thickness is seen. This is reflected by the variation in the XRR fringe position variation in Fig. S2 (ESI†). Potential causes for these variations are discussed later. The variation in headgroup hydration does not follow the same trend, but due to the high degree of error conclusions cannot be reliably drawn from this data. Increasing the surface pressure of the monolayer, and hence decreasing the area per molecule, causes an increase in the tail layer thickness, around 4 Å in total, and a general decrease in the headgroup hydration from around 10% to below 5%. The changes are similar for all the mixtures except for the pure DMPC monolayer which shows possibly anomalous behaviour and will be discussed in more detail below.
The general increases in layer thickness and decrease in headgroup hydration are what would be expected as the surface pressure is increased; as the lipids move closer the tail interactions cause them to stand up more perpendicular to the interface while the proximity of the headgroups to one another forces water out from between the headgroups. In contrast for the DMPC monolayer a notable increase in the headgroup hydration is observed when the surface pressure is increased to 35 mN m−1. This behavior was not reported in the study by Johnson et al. where a slight decrease in hydration was suggested (details are in Table S3, ESI†). However, the absolute hydration reported by these authors is substantially higher than we report here (70–57% as compared to 10–20%). This parameter is likely to be highly correlated with the headgroup thickness; a thicker layer could appear more solvated for the same NR curve. When Vaknin et al.50 used both XRR and NR for measurements of DPPC at a higher surface pressure of 42 mN m−1, they reported a solvation of 4 ± 2.5 water molecules per headgroup which is equivalent to 20% hydration and comparable to our results. They also found a thicker headgroup layer (9.3 Å) at 42 mN m−1 than we find at 35 mN m−1 but this is not inconsistent with the trend with surface pressure we have observed (5.1 Å at 15 mN m−1, and 7.2 Å at 35 mN m−1). Such behaviour might suggest that at higher pressure the PC headgroup penetrates further into the subphase, so that it can be more effectively hydrated than at lower surface pressures when the interaction between headgroups is weaker.
In the mixed monolayers an increase in the thickness of the headgroup layer similar to that of DMPC is observed, but there is no equivalent increase in the headgroup hydration. This suggests that favourable interaction between the PC and SB3 headgroups is retained at higher surface pressures. For all samples the fitted roughness is higher than we would expect from capillary waves41 and for the headgroups is significantly larger than we might expect for such a thin layer, as discussed earlier. To investigate this further we also performed some NR measurements involving the selective deuteration of each component within the monolayer. Two contrasts were measured, one containing deuterated DMPC with the hydrogenated SB3-18 and vice versa. The data from the 3![[thin space (1/6-em)]](https://www.rsc.org/images/entities/char_2009.gif) :
:![[thin space (1/6-em)]](https://www.rsc.org/images/entities/char_2009.gif) 1, 1
1, 1![[thin space (1/6-em)]](https://www.rsc.org/images/entities/char_2009.gif) :
:![[thin space (1/6-em)]](https://www.rsc.org/images/entities/char_2009.gif) 1 and 1
1 and 1![[thin space (1/6-em)]](https://www.rsc.org/images/entities/char_2009.gif) :
:![[thin space (1/6-em)]](https://www.rsc.org/images/entities/char_2009.gif) 3 compositions for these measurements are shown in Fig. 8 and Fig. S7, S10 (ESI†).
3 compositions for these measurements are shown in Fig. 8 and Fig. S7, S10 (ESI†).
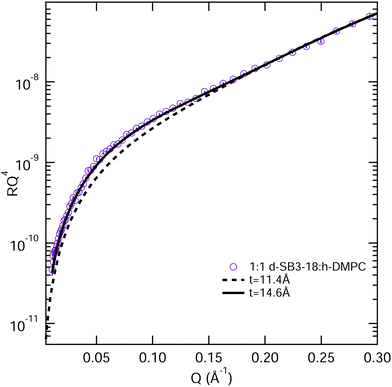 | ||
Fig. 8 Models for the fitting of the NR data from a monolayer consisting of a 1![[thin space (1/6-em)]](https://www.rsc.org/images/entities/char_2009.gif) : :![[thin space (1/6-em)]](https://www.rsc.org/images/entities/char_2009.gif) 1 mixture of deuterated SB3-18 and hydrogenated DMPC at 15 mN m−1, the t values are tail thickness, 11.4 Å is the value reported for the mixture in Table 3 and 14.6 Å is the tail thickness for SB3-18, if the chain tilt is consistent across the monolayer, error bars on the NR data are shown but are within the symbol size. 1 mixture of deuterated SB3-18 and hydrogenated DMPC at 15 mN m−1, the t values are tail thickness, 11.4 Å is the value reported for the mixture in Table 3 and 14.6 Å is the tail thickness for SB3-18, if the chain tilt is consistent across the monolayer, error bars on the NR data are shown but are within the symbol size. | ||
Fig. 8 shows the 1![[thin space (1/6-em)]](https://www.rsc.org/images/entities/char_2009.gif) :
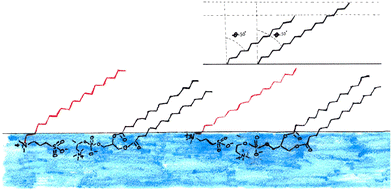
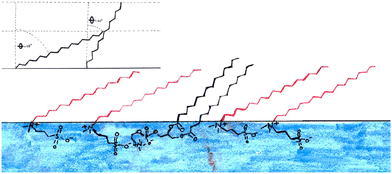
:![[thin space (1/6-em)]](https://www.rsc.org/images/entities/char_2009.gif) 1 mixture at 15 mN m−1 together with the calculated reflectivity for a tail layer thickness of 11.4 Å, as determined from the fully deuterated monolayers and the XRR data. This 11.4 Å is effectively the average tail thickness as seen by those contrasts, but it does not fit the partially deuterated data well. To understand this, we note that the partially deuterated systems may appear to be different from the fully deuterated monolayer because for a given tilt angle the two molecule types will have different effective thicknesses (see Fig. 9). If we make the assumption that the molecules have a fixed tilt angle and that the tails are fully extended, we can calculate different effective thicknesses for the two alternative contrasts. Thus, we calculated the tilt angle for the tails using the layer thickness (determined for the all deuterated monolayer) and the average tail length of the monolayer, using the Tanford equation,51eqn (7), where n is the number of carbons in the tail, for the length of a hydrocarbon tail, lt.
1 mixture at 15 mN m−1 together with the calculated reflectivity for a tail layer thickness of 11.4 Å, as determined from the fully deuterated monolayers and the XRR data. This 11.4 Å is effectively the average tail thickness as seen by those contrasts, but it does not fit the partially deuterated data well. To understand this, we note that the partially deuterated systems may appear to be different from the fully deuterated monolayer because for a given tilt angle the two molecule types will have different effective thicknesses (see Fig. 9). If we make the assumption that the molecules have a fixed tilt angle and that the tails are fully extended, we can calculate different effective thicknesses for the two alternative contrasts. Thus, we calculated the tilt angle for the tails using the layer thickness (determined for the all deuterated monolayer) and the average tail length of the monolayer, using the Tanford equation,51eqn (7), where n is the number of carbons in the tail, for the length of a hydrocarbon tail, lt.
| lt = 1.54 + 1.265n | (7) |
This indicates that there is a strong interaction between the two molecules causing them to adopt the same conformation, as sketched in Fig. 9. The presence of interactions between the headgroups is consistent with the work carried out by Aikawa et al.21 as discussed in the introduction. Importantly the difference in the chain lengths suggested here could explain the apparently high roughness in the all deuterated monolayers, since our simple 2-layer model cannot account for the excess tails that ‘stick-out’ above the more densely packed tails (see Fig. 9). This gradual transition of SLD is therefore interpreted as roughness in our model. The effect may be the same at both sides of the tail layer and as such would affect the roughness of both the head and tail layer. An alternative method to interpret this finding would be to use a 3-layer model instead to account for this rather than effectively convoluting this with the roughness. While it is possible to fit the data in this way, an example is shown in Fig. S7 (ESI†), it is not our preferred method. Throughout our analysis we have deliberately tried to use the simplest, most highly constrained model possible in order to fit the data. The information content in reflectivity data is inherently limited making meaningful analysis of complex two-component system such as this difficult. It is always possible to add layers to a model with associated increase in fitted parameters. However, as can be seen in the SLD profile in Fig. S7 (ESI†), this doesn't give any significant change compared to the 2-layer model, i.e. the structure we obtain is essentially the same but the model includes a large number of extra parameters Our interpretation of the third layer in such a model, which has a thickness of 2 Å and a roughness of 7.8 Å, is indicative a very diffuse layer, and is essentially consistent with the conclusion drawn from our 2-layer model.
The same tail tilt methodology can be used for the 3![[thin space (1/6-em)]](https://www.rsc.org/images/entities/char_2009.gif) :
:![[thin space (1/6-em)]](https://www.rsc.org/images/entities/char_2009.gif) 1 mixture higher in DMPC content. In this case, the tail tilt using the average tail length of the two components and the layer thickness from the fully deuterated monolayer (Table 3), is 55.8°. Again, if we assume that both components have this tilt angle and calculate the corresponding thickness of each of the partially deuterated monolayers we get tail thicknesses of 12.8 Å for deuterated SB3-18 with hydrogenated DMPC and 10.0 Å for the deuterated DMPC with hydrogenated SB3-18. These thicknesses were found to fit the data very well, as shown in Fig. S8 (ESI†).
1 mixture higher in DMPC content. In this case, the tail tilt using the average tail length of the two components and the layer thickness from the fully deuterated monolayer (Table 3), is 55.8°. Again, if we assume that both components have this tilt angle and calculate the corresponding thickness of each of the partially deuterated monolayers we get tail thicknesses of 12.8 Å for deuterated SB3-18 with hydrogenated DMPC and 10.0 Å for the deuterated DMPC with hydrogenated SB3-18. These thicknesses were found to fit the data very well, as shown in Fig. S8 (ESI†).
Interestingly the results for the 1![[thin space (1/6-em)]](https://www.rsc.org/images/entities/char_2009.gif) :
:![[thin space (1/6-em)]](https://www.rsc.org/images/entities/char_2009.gif) 3 DMPC
3 DMPC![[thin space (1/6-em)]](https://www.rsc.org/images/entities/char_2009.gif) :
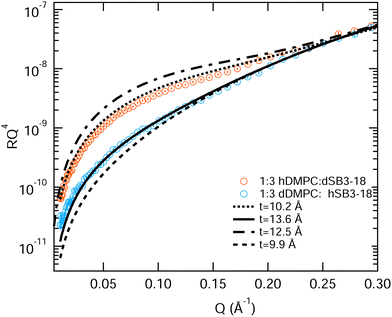
:![[thin space (1/6-em)]](https://www.rsc.org/images/entities/char_2009.gif) SB3-18 partially deuterated mixture cannot be fitted in the same way, nor do they fit the average thickness determined for the fully deuterated monolayer shown in Table 3. Unlike the previous two mixtures, fitting these contrasts with an increased tail layer thickness for the d-SB3-18 monolayer (12.5 Å) and a reduced thickness for the d-DMPC monolayer (9.9 Å) does not give a good fit, see Fig. 10. In order to achieve an acceptable fit for this data a tail layer thickness for the monolayer containing d-SB3-18 is thinner than expected (10.2 Å) and for the d-DMPC monolayer it is thicker than expected (13.6 Å). For the d-SB3-18 sample the data can be acceptably fitted to that of the pure SB3-18 parameters extracted in Table 3, a thickness of 10.4 Å, although a better fit would be achieved with a slightly lower value. Meanwhile, the d-DMPC requires a much greater tail thickness in order to achieve a good fit, but this is still below the maximum value calculated using the Tanford equation, eqn (7). This result is further reinforced by the XRR fringe positions shown in Fig. S2 (ESI†) where an increase in the overall thickness with SB3-18 content of the mixture occurs.
SB3-18 partially deuterated mixture cannot be fitted in the same way, nor do they fit the average thickness determined for the fully deuterated monolayer shown in Table 3. Unlike the previous two mixtures, fitting these contrasts with an increased tail layer thickness for the d-SB3-18 monolayer (12.5 Å) and a reduced thickness for the d-DMPC monolayer (9.9 Å) does not give a good fit, see Fig. 10. In order to achieve an acceptable fit for this data a tail layer thickness for the monolayer containing d-SB3-18 is thinner than expected (10.2 Å) and for the d-DMPC monolayer it is thicker than expected (13.6 Å). For the d-SB3-18 sample the data can be acceptably fitted to that of the pure SB3-18 parameters extracted in Table 3, a thickness of 10.4 Å, although a better fit would be achieved with a slightly lower value. Meanwhile, the d-DMPC requires a much greater tail thickness in order to achieve a good fit, but this is still below the maximum value calculated using the Tanford equation, eqn (7). This result is further reinforced by the XRR fringe positions shown in Fig. S2 (ESI†) where an increase in the overall thickness with SB3-18 content of the mixture occurs.
These data would suggest that at this surface pressure the DMPC has a much lower tail tilt (40°) than the sulfobetaine (68°) in the mixed monolayer, this is illustrated in Fig. 11. If this is the case, the DMPC in this mixed monolayer stands closer to perpendicular to the interface than in the pure DMPC monolayer. It is not clear how such a scenario could occur since the molecular arrangement illustrated in Fig. 11 is counter-intuitive (i.e. it would not maximize the van der Waals interactions between the molecule tails) while the favourable head interactions would be expected to cause similar behaviour to that observed in the other mixtures.
4 Further discussion and conclusions
The premise of this work was to investigate how sulfobetaine and phosphocholine lipids interact in a monolayer and the likely repercussions of this on the interactions of sulfobetaines with cells and the possibility of using mixed systems for drug delivery. Previous work found that sulfobetaines and phospholipids with the same tail structures interact preferentially with each other, as determined using DSC.21We have confirmed that the interactions between sulfobetaines and phospholipids are favourable, and that the presence of sulfobetaine in a DMPC monolayer does not substantially affect its structure. When DMPC is the main component of a monolayers, we believe that the tail tilt is constant for the two components of the monolayer, which results in an apparently rough monolayer as the tails for the sulfobetaine extend further than the DMPC tails. This indicates that there is a strong interaction between the two molecules leading to them adopting the same conformations.
When the concentration of SB3-18 is higher than that of DMPC the tail tilt angle does not seem to be constant across the monolayer. We would still expect the headgroups of the different components to be interacting at this concentration and it is not clear why the layer thickness is not as expected. This is an interesting effect which would require further investigation to fully understand. Surface potential measurements could be used to determine the variation in the headgroup tilt.49 Headgroup structure will have a significant effect upon the tail structure, with the headgroups being the only source of strong interactions between the two compounds. However, the contribution of the two components of the monolayer would not be simple to separate and so some computational simulations are likely to be needed in conjunction with these measurements. An important implication is that these higher SB3-18 content mixtures may be less useful as potential vehicles for drug delivery as the different conformations of the two components may make the structures less stable. It would be interesting to investigate mixed monolayers with dichain sulfobetaines to see if the same effect is observed.
Increasing the surface pressure of a pure DMPC monolayer was found to increase both the thickness and the hydration of the headgroup. This is consistent with the only other published study using both XRR and NR techniques.50 Conversely once the sulfobetaine was included into the monolayer, increasing the surface pressure resulted in an increase in the thicknesses but an apparent decrease in the headgroup hydration, although this is not a large effect relative to the error in this parameter. We believe that this is due to the favourable interaction between the headgroups which means that the PC headgroups do not require extra hydration in this system to remain stable at higher surface pressures.
The structures of the mixed monolayers with lower SB3-18 content indicate that sulfobetaines may be applicable for the delivery of compounds into cells as they fit well into the monolayer. A large body of work has been carried out investigating the use of phospholipids in drug delivery applications.52 Sulfobetaines may also be useful for this application as they have the opposite charge distribution to phospholipids so will allow a wider variety of compounds to be coupled.
The structure of the mixed monolayers also provides a possible explanation for the low toxicity of sulfobetaines to cells. As they do not strongly affect the structure of the monolayer, so although they may be incorporated into the cell membrane, they are unlikely to destabilize it. For shorter sulfobetaines, which are more widely used in commercial applications, the tails would not affect the thickness of the monolayer and so are likely to have even less effect on cell membranes than SB3-18.
Further studies would be required to see whether this effect can be seen in other non-toxic surfactants. If this similar behavior is identified, this method, using simple studies of mixed PC-surfactant monolayers may be useful to determine whether surfactants are likely to make good delivery systems that are non-toxic to cells.
Conflicts of interest
There are no conflicts to declare.Acknowledgements
N. E. gratefully acknowledges PhD studentship funding via the EPSRC Centre for Doctoral Training in Sustainable & Circular Technologies, grant number: EP/L016354/1. We also thank the ISIS Pulsed Neutron and Muon Source for allocation of experimental beamtime on INTER under project RB1610351 (https://doi.org/10.5286/ISIS.E.RB1610351) and the Diamond Light Source for the allocation of experimental beamtime on I07 under project SI11542-1. Thanks are extended to I07 and Inter beamline staff as well as members of the Edler group for their assistance in the collection of NR and XRR data. We are also thankful to Piexun Li at the ISIS deuteration facility for the provision of deuterated compounds used to synthesize the surfactants within this study. Data supporting this article have been made freely available via the University of Bath Research Data Archive system at DOI: 10.15125/BATH-00917.Notes and references
- G. P. Borissevitch, M. Tabak and O. N. Oliveira, Biochim. Biophys. Acta, Biomembr., 1996, 1278, 12–18 CrossRef.
- J. Cladera, P. O'Shea, J. Hadgraft and C. Valenta, J. Pharm. Sci., 2003, 92, 1018–1027 CrossRef CAS.
- L. P. Cavalcanti and I. L. Torriani, Eur. Biophys. J., 2006, 36, 67–71 CrossRef CAS PubMed.
- P. Kingsley and G. Feigenson, Chem. Phys. Lipids, 1979, 24, 135–147 CrossRef CAS.
- K.-B. Chen, C.-H. Chang, Y.-M. Yang and J.-R. Maa, Colloids Surf., A, 2003, 216, 45–53 CrossRef CAS.
- J. M. Crane, G. Putz and S. B. Hall, Biophys. J., 1999, 77, 3134–3143 CrossRef CAS.
- T. Hasegawa, J. Pharm. Soc. Jpn., 2000, 120, 91–103 CrossRef CAS PubMed.
- G. Ma and H. C. Allen, Langmuir, 2006, 22, 5341–5349 CrossRef CAS PubMed.
- J.-C. Wu, T.-L. Lin, C.-P. Yang, U.-S. Jeng, H.-Y. Lee and M.-C. Shih, Colloids Surf., A, 2006, 284–285, 103–108 CrossRef.
- A. J. García-Sáez, S. Chiantia and P. Schwille, J. Biol. Chem., 2007, 282, 33537–33544 CrossRef.
- G. Lawrie, K. Gunton, G. Barnes and I. Gentle, Colloids Surf., A, 2000, 168, 13–25 CrossRef CAS.
- E. A. Wright, K. A. P. Payne, T. A. Jowitt, M. Howard, P. B. Morgan, C. Maldonado-Codina and C. B. Dobson, Eye & Contact Lens: Science & Clinical Practice, 2012, 38, 36–42 Search PubMed.
- Y. Chiu and H. Hwang, J. Dispersion Sci. Technol., 1999, 20, 1295–1318 CrossRef CAS.
- D. Kim, M. K. Chae, H. J. Joo, I.-H. Jeong, J.-H. Cho and C. Lee, Langmuir, 2012, 28, 9634–9639 CrossRef CAS.
- L. Y. Zhou, Y. H. Zhu, X. Y. Wang, C. Shen, X. W. Wei, T. Xu and Z. Y. He, Comput. Struct. Biotechnol. J., 2020, 18, 1980–1999 CrossRef CAS PubMed.
- M. Tiecco, L. Roscini, L. Corte, C. Colabella, R. Germani and G. Cardinali, Langmuir, 2016, 32, 1101–1110 CrossRef CAS PubMed.
- D. Wieczorek, D. Gwiazdowska, K. Staszak, Y.-L. Chen and T.-L. Shen, J. Surfactants Deterg., 2016, 19, 813–822 CrossRef CAS.
- G. Hazell, A. P. Gee, T. Arnold, K. J. Edler and S. E. Lewis, J. Colloid Interface Sci., 2016, 474, 190–198 CrossRef CAS.
- C. Stefaniu, G. Brezesinski and H. Möhwald, Soft Matter, 2012, 8, 7952 RSC.
- I. Budziak, M. Arczewska, M. Sachadyn-Król, A. Matwijczuk, A. Waśko, M. Gagoś, K. Terpiłowski and D. M. Kamiński, Biochim. Biophys. Acta, Biomembr., 2018, 1860, 2166–2174 CrossRef CAS PubMed.
- T. Aikawa, K. Yokota, T. Kondo and M. Yuasa, Langmuir, 2016, 32, 10483–10490 CrossRef CAS.
- S. J. Johnson, T. M. Bayerl, W. Weihan, H. Noack, J. Penfold, R. K. Thomas, D. Kanellas, A. R. Rennie and E. Sackmann, Biophys. J., 1991, 60, 1017–1025 CrossRef CAS PubMed.
- S. Mabrey and J. M. Sturtevant, Proc. Natl. Acad. Sci. U. S. A., 1976, 73, 3862–3866 CrossRef CAS PubMed.
- K. Hąc-Wydro, M. Flasiński, M. Broniatowski, P. Dynarowicz-Łątka and J. Majewski, J. Colloid Interface Sci., 2011, 364, 133–139 CrossRef PubMed.
- E. B. Watkins, S. L. Frey, E. Y. Chi, K. D. Cao, T. Pacuszka, J. Majewski and K. Y. C. Lee, Biophys. J., 2018, 114, 1103–1115 CrossRef CAS.
- A. Eaglesham and T. M. Herrington, J. Colloid Interface Sci., 1995, 171, 1–7 CrossRef CAS.
- S. R. Carino, R. S. Duran, R. H. Baney, L. A. Gower, L. He and P. K. Sheth, J. Am. Chem. Soc., 2001, 123, 2103–2104 CrossRef CAS PubMed.
- T. Arnold, C. Nicklin, J. Rawle, J. Sutter, T. Bates, B. Nutter, G. McIntyre and M. Burt, IUCr, J. Synchrotron Radiat., 2012, 19, 408–416 CrossRef CAS.
- M. Basham, J. Filik, M. T. Wharmby, P. C. Y. Chang, B. E. Kassaby, M. Gerring, J. Aishima, K. Levik, B. C. A. Pulford, I. Sikharulidze, D. Sneddon, M. Webber, S. S. Dhesi, F. Maccherozzi, O. Svensson, S. Brockhauser, G. Náray and A. W. Ashton, J. Synchrotron Radiat., 2015, 22, 853–858 CrossRef.
- J. Webster, S. Holt and R. Dalgliesh, Phys. B, 2006, 385-386, 1164–1166 CrossRef CAS.
- M. Tehei, D. Madern, C. Pfister and G. Zaccai, Proc. Natl. Acad. Sci. U. S. A., 2001, 98, 14356–14361 CrossRef CAS PubMed.
- A. Nelson, J. Appl. Cryst., 2006, 39, 273–276 CrossRef CAS.
- A. Nelson, J. Phys.: Conf. Ser., 2010, 251, 012094 CrossRef.
- J. F. Nagle and S. Tristram-Nagle, Biochim. Biophys. Acta, Biomembr., 2000, 1469, 159–195 CrossRef CAS.
- J. Holdaway, PhD thesis, University of Bath, 2013.
- J. R. Lu, E. A. Simister, R. K. Thomas and J. Penfold, J. Phys. Chem., 1993, 97, 6024–6033 CrossRef CAS.
- R. A. Campbell, Y. Saaka, Y. Shao, Y. Gerelli, R. Cubitt, E. Nazaruk, D. Matyszewska and M. J. Lawrence, J. Colloid Interface Sci., 2018, 531, 98–108 CrossRef CAS PubMed.
- W. Knoll, J. Haas, H. B. Stuhrmann, H.-H. Füldner, H. Vogel and E. Sackmann, IUCr, J. Appl. Crystallogr., 1981, 14, 191–202 CrossRef CAS.
- L. Braun, M. Uhlig, R. von Klitzing and R. A. Campbell, Adv. Colloid Interface Sci., 2017, 247, 130–148 CrossRef CAS PubMed.
- A. Sanchez-Fernandez, G. L. Moody, L. C. Murfin, T. Arnold, A. J. Jackson, S. M. King, S. E. Lewis and K. J. Edler, Soft Matter, 2018, 14, 5525–5536 RSC.
- J. Daillant, L. Bosio, J. J. Benattar and J. Meunier, Europhys. Lett., 1989, 8, 453–458 CrossRef CAS.
- A. R. McCluskey, A. Sanchez-Fernandez, K. J. Edler, S. C. Parker, A. J. Jackson, R. A. Campbell and T. Arnold, Phys. Chem. Chem. Phys., 2019, 21, 6133–6141 RSC.
- M. Flasiński, P. Wydro and M. Broniatowski, J. Colloid Interface Sci., 2014, 418, 20–30 CrossRef.
- I. Rey Gómez-Serranillos, J. Miñones Jr., P. Dynarowicz-Łątka, E. Iribarnegaray and M. Casas, Phys. Chem. Chem. Phys., 2004, 6, 1580–1586 RSC.
- E. J. Grasso, R. G. Oliveira and B. Maggio, J. Colloid Interface Sci., 2016, 464, 264–276 CrossRef CAS.
- A. Blume, ChemTexts, 2018, 4, 3 CrossRef.
- S. Kewalramani, H. Hlaing, B. M. Ocko, I. Kuzmenko and M. Fukuto, J. Phys. Chem. Lett., 2010, 1, 489–495 CrossRef CAS.
- G. Büldt, H. Gally, J. Seelig and G. Zaccai, J. Mol. Biol., 1979, 134, 673–691 CrossRef.
- F. Gambinossi, B. Mecheri, M. Nocentini, M. Puggelli and G. Caminati, Biophys. Chem., 2004, 110, 101–117 CrossRef CAS PubMed.
- D. Vaknin, K. Kjaer, J. Als-Nielsen and M. Lösche, Biophys. J., 1991, 59, 1325–1332 CrossRef CAS PubMed.
- C. Tanford, The Hydrophobic Effect: Formation of Micelles and Biological Membranes, John Wiley & Sons, Inc., 1st edn, 1973 Search PubMed.
- B. Mishra, B. B. Patel and S. Tiwari, Nanomedicine, 2010, 6, 9–24 CrossRef CAS PubMed.
Footnotes |
| † Electronic supplementary information (ESI) available. See DOI: https://doi.org/10.1039/d2cp02695c |
| ‡ Present address: Department of Chemistry, University of York, York, YO10 5DD, UK. |
| § Present address: Department of Physical Sciences, University of Chester, Chester, UK. |
| ¶ Present address: Department of Chemistry, Lund University, Naturvetarvägen 14/Sölvegatan 39 A, 223 62 Lund, Sweden. |
| This journal is © the Owner Societies 2022 |

