 Open Access Article
Creative Commons Attribution 3.0 Unported Licence
Construction and performance of OLED devices prepared from liquid-crystalline TADF materials†
Alfiya F.
Suleymanova
 a,
Marsel Z.
Shafikov
 b,
Xinrui
Chen
c,
Yafei
Wang
 *c,
Rafal
Czerwieniec
 *b and
Duncan W.
Bruce
 *a
*a
aDepartment of Chemistry, University of York, Heslington, YORK YO10 5DD, UK. E-mail: duncan.bruce@york.ac.uk; Tel: (+44) 1904 324085
bInstitut für Physikalische Chemie, Universität Regensburg, Universitätsstrasse 31, 93053 Regensburg, Germany. E-mail: rafal.czerwieniec@chemie.uni-regensburg.de; Tel: (+49) 941 943 4463
cSchool of Materials Science & Engineering, Changzhou University, Changzhou 213164, P. R. China. E-mail: qiji830404@hotmail.com
First published on 29th August 2022
Abstract
The device performance is reported for three compounds which show both thermally activated delayed fluorescence and liquid crystallinity, and use the donor 3,6-bis(3,4-didodecyloxyphenyl)carbazole. Two of the compounds, whose photophysics were reported previously, are based on a terephthalonitrile acceptor. A third and new compound is based on an isophthalonitrile acceptor and shows a more temperature-accessible mesophase and enhanced solution emission quantum yield. Two of the compounds show device external quantum efficiencies of between 2–3% and exhibit very small efficiency roll off. The responses are evaluated in terms of the specific nature of the materials.
Introduction
Luminescent liquid-crystalline (LC) materials are of great interest due to their unique combination of properties, as they self-organise into anisotropic structures and are able to produce circularly and linearly polarised light that is attractive for use in optical devices.1–7 Also, liquid crystals forming columnar phases have been recognised as an attractive class of photoconductors due to their anisotropic charge-transporting ability.8–11Recently, there has been increasing interest in thermally activated delayed fluorescent (TADF) materials showing up to 100% of internal quantum efficiency without the need for a heavy transition metal such as iridium.12–14 This is due to the design of molecules with a minimised energy gap between the lowest excited singlet (S1) and triplet (T1) states, thereby promoting efficient reverse intersystem crossing (rISC) from the non-radiative triplet state to the radiative singlet state.15,16 Although TADF as a phenomenon has been known for many decades,17–19 it became very popular in application when Adachi and co-workers first demonstrated use of TADF molecules in organic light-emitting diodes (OLEDs).20–22 Today, these materials are used in many different areas such as time-resolved fluorescence imaging,23–27 organic photocatalysis,28–31 photodynamic therapy32–35 and in improving the efficiency of OLED devices.36,37
Constructing molecules exhibiting both LC and TADF properties is an interesting approach for potential application in OLED devices and, for example, there is a very recent report of LC properties in some disc-like, multi-resonant TADF materials.38 Some of us have previously reported LCs based on dihydroacridine donor and diphenylsulfone acceptor, which show external quantum efficiencies in devices of up to 15%,39 whereas in another, earlier study, we reported multifunctional materials based on carbazole-substituted terephthalonitriles (Fig. 1, 1, 2).40 In this latter work, modification of well-known donor–acceptor systems14 led to the combination of TADF and LC properties in one material, but the contribution of TADF to the overall emission was only 5–10% and the emission quantum yields of the materials were low. Nonetheless, we were keen to investigate the behaviour of these materials in device constructs, which we now report along with studies on a new LC TADF emitter (3) based on isophthalonitrile and a carbazole and showing increased quantum yield and TADF contribution.
Results and discussion
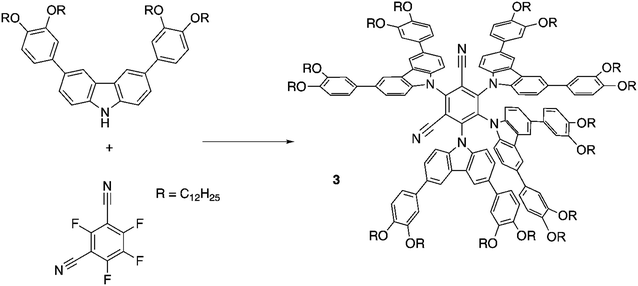
Compound 3, which is based on the well-known emitter 4CzIPN,20 was prepared following a slightly modified literature method by coupling commercially available tetrafluoroisophthalonitrile with the sodium salt of 3,6-bis(3,4-didocylocyphenyl)carbazole (Scheme 1). The carbazole was synthesised by using a method described earlier.40Liquid-crystalline properties
Polarised optical microscopy, differential scanning calorimetry (DSC) and small-angle X-ray scattering (SAXS) were used to determine the liquid-crystalline properties of 3. Starting at room temperature, optical microscopy showed the presence of soft solid whose viscosity gradually reduced until it cleared into the isotropic phase at 76 °C (DSC traces for three heat–cool scans are found as Fig. S3, ESI†). Then, on cooling, a liquid-crystalline texture, typical of a columnar hexagonal mesophase (Colh), appeared immediately at 75.9 °C (Fig. 2a). SAXS (Fig. 2b) shows only a single reflection at 2θ = 2.66° corresponding to a spacing of 33.17 Å and, while this is insufficient to identify the mesophase, when coupled with the optical texture and the presence of some homeotropic areas then we are confident in the phase assignment. Based on that assumption, the hexagonal lattice parameter is 38.3 Å and this distance varies between 38.9 and 37.7 Å over the temperature range 45.5 to 69.8 °C (smaller spacing at the highest temperature). Upon further cooling, the system does not crystallise, but rather appears to form a glass. DSC measurements confirm the clearing transition temperature obtained from optical observations and show evidence of a glass transition on cooling at ca. 35 °C, which reverses on heating. There is also a weak endothermic event on heating at 53.4 °C, which may correspond to the melting of a small portion of the material that crystallised (Fig. S3, ESI†). There being no apparent melting point observed it is assumed that the material obtained from solution is already in the columnar mesophase. Compared to compounds 1 and 2 which clear at 181 and 191 °C, respectively,40 compound 3 clears at a very much lower temperature, which is attributed to its lower symmetry, in turn leading to much less efficient packing in the solid state.41,42 The phase behaviour may, therefore, be summarised as shown below. The endothermic event is not ascribed as melting in the absence of confirmatory evidence.| g • 35 • Colh • 76 • Iso |
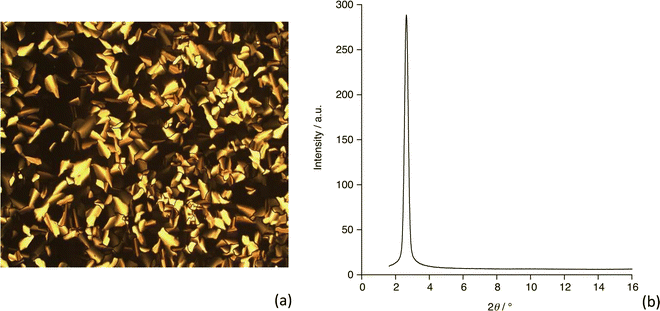 | ||
| Fig. 2 (a) Polarising optical microscopy image of 3 at 76 °C on cooling (magnification 20×) and (b) small-angle diffraction pattern recorded at 63.7 °C. | ||
Photophysical properties
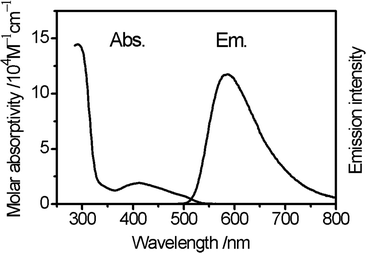
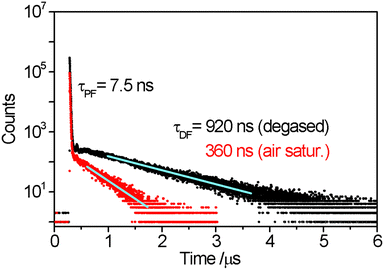
The optical properties of compound 3 are characteristic of purely organic TADF materials. The absorption spectrum measured for a dilute toluene solution features an intense band centred at about 300 nm and broader band at longer wavelength and about an order of magnitude less intense. The intense band is assigned to local π → π* transition within the carbazole derivatives. The broad nature and low intensity of the lower energy absorption band is characteristic of transitions of charge-transfer character, and is therefore assigned as transitions from the carbazole derivatives to the isophthalonitrile acceptor unit. It is noted that this band covers at least two transitions centred at about 410 nm and 500 nm (Fig. 3) indicating that the molecule has several different charge-transfer excited states. The emission spectrum of compound 3 in toluene has a broad, featureless shape with the maximum at about 590 nm which overlaps partially with the charge-transfer band of the absorption spectrum (Fig. 3). Such characteristics are all consistent with the emitting state(s) of the molecule also being charge transfer in character as expected for a donor–acceptor TADF material.Time-correlated single photon counting (TCSPC) measurements in degassed toluene solution at room temperature reveal that the emission decay kinetics consist of a fast process with a decay time of 7.5 ns and a slower process with a decay time of 920 ns (Fig. 4). When re-measured following air-equilibration, the fast process does not show a notable change in kinetics whereas the decay time of the slower process shortens to 360 ns. Sensitivity of the decay rate to oxygen indicates the involvement of the triplet state, which can decay via Dexter-type energy transfer to molecular oxygen. On this basis, the shorter-lived component of emission is assigned to the prompt fluorescence (S1 → S0) and the long-lived part to delayed fluorescent emission (also S1 → S0) following S1 → T1 intersystem crossing and the thermally activated reverse intersystem crossing (rISC) T1 → S1, i.e. via thermalisation of the S1 and T1 states. It is noted that the contribution of T1 → S0 phosphorescence to the longer component is improbable as in purely organic materials it is typically observed only at low temperatures and characterised with decay times in the range of milliseconds and above. The overall emission quantum yield of compound 3 in degassed toluene at room temperature is 11% which is a notable increase when compared to the previously reported terephthalonitrile-based analogues 1 and 2 (Table 1). The integrated contribution of the TADF to the total emission intensity is about 10% which is also an increase compared to compounds 1 and 2, revealing the relative superiority of the molecular design of 3 as a TADF material.
| λ em/nm | φ PL | τ PF/ns | τ DF/s | k PF /s−1 | k nr(S1) | k ISC | |
|---|---|---|---|---|---|---|---|
| a Data for 1 and 2 from ref. 39. b Values in parentheses represent percentile share of delayed emission intensity in the total quantum yield. c Calculated as kPF = φPF(S1)/τPF. d Calculated as knr(S1) = (1 − (φPF + φDF)/τPF, e.g., assuming that all non-radiative relaxation to the ground state occurs via the S1 → S0 pathway, thus representing the upper limit. e Calculated as kISC = φDF/τPF, e.g., assuming that all non-radiative relaxation to the ground state occurs via the S1 → S0 pathway, thus representing the lower limit. | |||||||
| 1 | 560 | 5 (5) | 6.9 | 3.5 | 0.6 × 10⁷ | 1.5 × 10⁸ | ≥3.6 × 10⁵ |
| 2 | 620 | 1.5 | 1.2 | ≤1 | 1.3 × 10⁷ | 8.2 × 10⁸ | |
| 3 | 585 | 11 (10) | 7.5 | 0.92 | 1.3 × 10⁷ | ≤1.2 × 10⁸ | ≥1.5 × 10⁶ |
Quantum chemical calculations
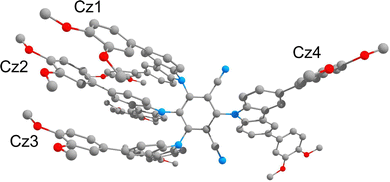
The electronic structure of 3 was computed at the M0643/def2-SVP44 theory level utilising Gaussian 09 code.45 Grimme's empirical dispersion correction (GD3)46 was invoked to account for π–π interactions between carbazole units, and a polarisable continuum model C-PCM47 with the parameters of toluene was included in the calculations to mimic the conditions of photophysical measurements. The molecular geometry of 3 was optimised in the singlet ground state (S0) and at the lowest excited triplet state (T1). The computations reveal that the π-conjugated systems of the three of the carbazole derivatives (Cz1, Cz2 and Cz3 in Fig. 5) in the molecule are stacked with interplanar distances of approximately 3.4–3.6 Å due to stabilising π–π interactions whereas, the carbazole derivative Cz4 is, of course, isolated (Fig. 5).In the ground state (S0), the planes of the carbazole groups stand oriented with respect to the plane of the isophthalonitrile acceptor at dihedral angles of 78.3° (Cz1), 78.3° (Cz2), 79.0° (Cz3) and 63.2° (Cz4). This separates the π systems of the carbazole derivatives (donors) and isophthalonitrile moiety (acceptor), which is a prerequisite for a small value for ΔE(S1–T1) and hence TADF behaviour. In the T1 state, upon relaxation of the molecular geometry, the dihedral angle between the planes of the carbazole derivatives and of the isophthalonitrile moiety change slightly to 77.9° (Cz1), 76.5° (Cz2), 78.0° (Cz3), and increase by a few degrees to 68.9° (Cz4).
According to TD-DFT calculations, conducted with a geometry optimised in the T1 state, the S1 and T1 states originate from HOMO → LUMO transitions. The HOMO (−5.175 eV) is localised on the π–π-stacked carbazole units with the major contribution of Cz2 (84%) and minor contribution of Cz1 (7%) and Cz3 (8%). In contrast, the LUMO (−2.920 eV) is localised primarily on the iso-phthalonitrile moiety (93%) and has just 7% of the electron density on the two nitrogen-phenyl bonds of Cz1 and Cz3 (Fig. 6 and Table S1 in the ESI†). Thus, states S1 and T1 have predominantly charge-transfer character allowing for a weak exchange interaction and consequently a small value of the energy gap between them (S1 = 1.632 eV and T1 = 1.618 eV). Indeed, the calculated value of the gap is just ΔE(S1–T1) = 110 cm−1 (13.7 meV), indicating that the S1 state can easily be populated at room temperature by thermal activation from T1 through the rISC process. It is noted that although the computed excited state energies are underestimated in comparison to the experimental data, it probably has only a weak effect on the energy gap between them. The small computed ΔE(S1–T1) gap value agrees well with our assignment of the slow component of the TCSPC decay profile to TADF. It is also worth noting that, according to the TD-DFT calculations, the higher-lying excited states S2/T2 (HOMO−1 → LUMO) and S3/T3 (HOMO−2 → LUMO) are also charge transfer in character, originating from different carbazole groups in the molecule (Fig. 6). This is consistent with the absorption spectrum, which features >1 charge-transfer bands at longer wavelengths.
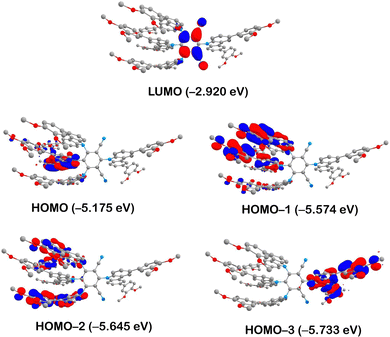 | ||
| Fig. 6 Iso-surface contour plots (iso-value = 0.03) of selected molecular orbitals of compound 3 calculated at T1 state geometry. Hydrogens are omitted for clarity. | ||
Comparing now compound 3 to the previously reported, isoelectronic compound 2 (Fig. 1), calculated at the same theory level, the latter has lower energies of both HOMO (−5.430 eV) and LUMO (−3.343 eV). The ΔE(HOMO–LUMO) energy gap, however, decreases from 3 (2.255 eV) to 2 (2.087 eV) as in 2 the relative stabilisation of the LUMO is greater than that of the HOMO. The larger ΔE(HOMO–LUMO) gap of 3 results in relatively higher-lying S1 and T1 states as manifest by the blue shift of the emission from 2 (λmax = 620 nm) to 3 (λmax = 585 nm) accompanied by an increase in quantum yield according to the energy gap law.48
Notably, the π–π-stacking keeps the three carbazole units in 3 at much larger dihedral angles with respect to the isophthalonitrile, as compared to the analogous phthalonitrile based compound 1 (Fig. 1) where the dihedral angle is about 55° (computed at the same level of theory – see ESI† for computational data). Consequently, compound 1 has a much larger value of ΔE(S1–T1) = 1270 cm−1 (0.158 meV), resulting in less efficient thermal population of emissive S1 states via rISC and more efficient, non-radiative T1 → S0 relaxation. Thus, a higher emission quantum yield for 3 is observed, despite the lower energy of the emitting state (Table 1) compared to 1.
The significantly higher ISC rate of 3, compared to 1 (Table 1), also agrees with the importance of molecular vibrations within the π–π-stacked carbazole units. Such vibrations, displacing the atoms out of the conjugation plane of the carbazole groups, admix the σπ* and σπ* character to the primary ππ * character of S1 and T1 states. This enhances the spin–orbit coupling of the two states which will enhance the rates of S1 ↔ T1 ISC/rISC.40,49
The discussions presented above reveal the overall advantageous molecular design of 3 as a TADF material when compared to 1 and 2.
Device performance
In order to evaluate the electroluminescent (EL) property of these liquid-crystalline TADF emitters, solution-processable OLEDs based on compounds 1, 2 and 3 were fabricated with a configuration of ITO/PEDOT:PSS (40 nm)/host:x wt% (x = 1, 3 and 6) dopant (70 nm)/DPEPO (9 nm)/TmPyPB (45 nm)/LiF (0.5 nm)/Al (120 nm). In this device, a 7![[thin space (1/6-em)]](https://www.rsc.org/images/entities/char_2009.gif) :
:![[thin space (1/6-em)]](https://www.rsc.org/images/entities/char_2009.gif) 3 blend of poly(9-vinylcarbazole) (PVK) and 1,3-bis[2-(4-tert-butylphenyl)-1,3,4-oxadiazo-5-yl]benzene (OXD-7) is used as the host. Poly(3,4-ethylenedioxythiophene):poly(styrenesulfonic acid) (PEDOT:PSS) is the hole-injection layer, while DPEPO and 1,3,5-tri(m-pyrid-3-yl-phenyl)benzene (TmPyPB) acted as the hole-blocking layer and electron-transport layer, respectively. LiF was the electron-injection material and Al served as the cathode. The device structure and molecular structures in the devices are shown in Fig. 7a and b, and the relevant EL data are summarised in Table 2.
3 blend of poly(9-vinylcarbazole) (PVK) and 1,3-bis[2-(4-tert-butylphenyl)-1,3,4-oxadiazo-5-yl]benzene (OXD-7) is used as the host. Poly(3,4-ethylenedioxythiophene):poly(styrenesulfonic acid) (PEDOT:PSS) is the hole-injection layer, while DPEPO and 1,3,5-tri(m-pyrid-3-yl-phenyl)benzene (TmPyPB) acted as the hole-blocking layer and electron-transport layer, respectively. LiF was the electron-injection material and Al served as the cathode. The device structure and molecular structures in the devices are shown in Fig. 7a and b, and the relevant EL data are summarised in Table 2.
| Compound | Dopant (wt%) | V on (V) | L max (cd m−2) | CEmax (cd A−1) | EQEmax (%) | CIE (x, y) | λ (nm) |
|---|---|---|---|---|---|---|---|
| 1 | 1 | 8.0 | 994.5 | 6.82 | 2.29 | (0.40, 0.54) | 552 |
| 1 | 3 | 6.8 | 2065 | 6.58 | 2.19 | (0.42, 0.53) | 558 |
| 1 | 6 | 11.6 | 1148 | 2.00 | 0.76 | (0.44, 0.52) | 564 |
| 2 | 1 | 8.4 | 274.5 | 1.13 | 0.66 | (0.53, 0.43) | 598 |
| 2 | 3 | 6.8 | 407.2 | 1.20 | 0.59 | (0.54, 0.41) | 606 |
| 2 | 6 | 8.8 | 222.9 | 0.40 | 0.26 | (0.56, 0.42) | 610 |
| 3 | 1 | 8.0 | 1387 | 7.69 | 2.97 | (0.48, 0.49) | 578 |
| 3 | 3 | 8.4 | 1704 | 6.52 | 2.60 | (0.49, 0.49) | 578 |
| 3 | 6 | 10.4 | 837.1 | 3.27 | 1.50 | (0.51, 0.48) | 588 |
As shown in the inset to Fig. 8a, all devices show broad EL spectra, similar to the PL profiles and, compared to compound 1, compounds 2 and 3 exhibit red-shifted EL spectra owing to the greater number of donor moieties leading to a stabilisation of the HOMO. This is most pronounced in compound 2 where, in addition, the cyano acceptor groups are conjugated leading to emission at about 604 ± 6 nm. However, there is an additional emission band at about 420 nm for the device fabricated using compound 2. This is assigned to the host matrix and implies incomplete energy transfer between host and emitter, suggesting inferior device performance.
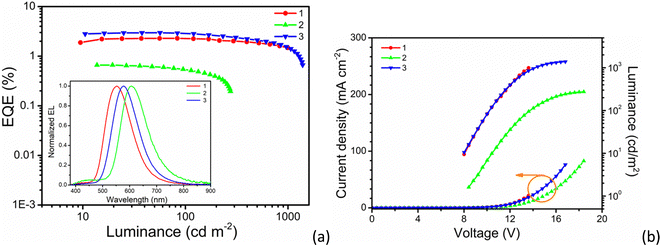 | ||
| Fig. 8 Device performance at 1 wt% dopant concentration: (a) EQE-luminance curves (inset: the EL spectra); (b) J–V–L curves. | ||
As seen from Table 2, the EL spectra have a clear red shift with the increasing dopant concentration, moving between 10 and 12 nm from 1 to 6% doping. This is interpreted as reflecting the LC nature of the materials and the driving force to self-organise leading to relatively strong intermolecular interactions. In addition, the devices exhibit a relatively high turn-on voltage of around 8 V (@ 1 cd m−2), which may be attributable to the rather high coverage of the periphery of the chromophore by flexible chains adversely affecting the carrier mobility (Fig. 8b). Thus, a passable device performance with an external quantum efficiency (EQE) of 2.97% is achieved for a device using compound 3 doped into the host at a concentration of 1 wt%, with a concomitant current efficiency of 7.69 cd A−1 and luminance of 1387 cd m−2. Compound 1 has a not dissimilar efficiency of 2.29% at 1 wt% dopant, whereas compound 2 shows a much poorer EQE of 0.66%, also doped at 1 wt%. As expected, the device performance decreases with the increased dopant concentration due to the concentration quenching. Impressively however, the devices based on compounds 1 and 3 display a very small efficiency roll-off (Fig. 8a) with EQEs of 2.85 and 2.24% at 100 cd m−2 and 2.1 and 1.8% at 500 cd m−2, respectively. These results demonstrate that both compounds 1 and 3 show very stable in the device.
Conclusion
By varying the isomerisation of a tetrakis(carbazoyl)benzenedinitrile from the terephthalonitrile (1 and 2) to an isophthalonitrile acceptor, a novel liquid-crystalline TADF emitter (3) was prepared. The liquid crystal clearing point of the new material is very significantly reduced compared to its isomers (1 and 2) making its mesophase somewhat more accessible. This is directly attributable to the lower symmetry, which compromises the ability of the compounds to self-organise effectively so destabilising the liquid crystal phase.Impressively, compound 3 showed enhanced emission quantum yield compared to compound 1 and 2, leading to it showing the best device performance with an acceptable EQEmax value in a liquid crystalline-based TADF OLED and, in particular, the very small efficiency roll-off is a very pleasing observation. Nonetheless, in order to avoid concentration quenching, the loading of the emitter in the host is kept low (1–2%), which precludes the expression of the liquid crystal properties. However, in the only other study of LC-TADF materials in devices, 20 wt% loading of the luminophore were achieved,39 which is a very encouraging observation and provides strong motivation to continue the development of LC-TADF emitters in order for the potentially advantageous properties, which include enhanced charge-transport, to be realised.
Conflicts of interest
There are no conflicts to declare.Acknowledgements
The authors would like to thank the University of York (AFS), the Universität Regensburg (MZS) and the German Research Foundation (DFG) (Project No. 389797483) for financial support and the Royal Society (IEC\NSFC\181139) and the National Natural Science Foundation of China (51911530197, 51773021) for an International Exchange Award (DWB & YW). DWB would like to thank Dongyang Chen and Eli Zysman-Coleman (University of St Andrews University, UK) for enlightening discussions.References
- G. Qian, X. Yang, X. Wang, J. D. Herod, D. W. Bruce, S. Wang, W. Zhu, P. Duan and Y. Wang, Adv. Opt. Mater., 2020, 8, 2000775 CrossRef CAS
.
- Y. Wang, J. Shi, J. Chen, W. Zhu and E. Baranoff, J. Mater. Chem. C, 2015, 3, 7993–8005 RSC
.
- Y. Liu, L. H. You, F. X. Lin, K. Fu, W. Z. Yuan, E.-Q. Chen, Z.-Q. Yu and B. Z. Tang, ACS Appl. Mater. Interfaces, 2019, 11, 3516–3523 CrossRef CAS
.
- Q. Yang, J.-C. Zhu, Z.-X. Li, X.-S. Chen, Y.-X. Jiang, Z.-W. Luo, P. Wang and H.-L. Xie, ACS Appl. Mater. Interfaces, 2021, 13, 26522–26532 CrossRef CAS PubMed
.
- Y. Feng, H. Yu, D. Xie, Y. Zhu, X. Zhong, C. Pan and G. Shao, Materials, 2019, 12, 1919 CrossRef CAS
.
- J. De, W.-Y. Yang, I. Bala, S. P. Gupta, R. A. K. Yadav, D. K. Dubey, A. Chowdhury, J.-H. Jou and S. K. Pal, ACS Appl. Mater. Interfaces, 2019, 11, 8291–8300 CrossRef CAS PubMed
.
- V. S. Sharma, A. S. Sharma, N. K. Agarwal, P. A. Shah and P. S. Shrivastav, Mol. Syst. Des. Eng., 2020, 5, 1691–1705 RSC
.
- D. Adam, P. Schuhmacher, J. Simmerer, L. Häussling, K. Siemensmeyer, K. H. Etzbachi, H. Ringsdorf and D. Haarer, Nature, 1994, 371, 141–143 CrossRef CAS
.
- F. Closs, K. Siemensmeyer, T. Frey and D. Funhoff, Liq. Cryst., 1993, 14, 629–634 CrossRef CAS
.
- A. Jankowiak, D. Pociecha, J. Szczytko, H. Monobe and P. Kaszyński, J. Am. Chem. Soc., 2012, 134, 2465–2468 CrossRef CAS
.
- H. Iino, J.-I. Hanna and D. Haarer, Phys. Rev. B: Condens. Matter Mater. Phys., 2005, 72, 193203 CrossRef
.
- Z. Yang, Z. Mao, Z. Xie, Y. Zhang, S. Liu, J. Zhao, J. Xu, Z. Chi and M. P. Aldred, Chem. Soc. Rev., 2017, 46, 915–1016 RSC
.
- Y. Liu, C. Li, Z. Ren, S. Yan and M. R. Bryce, Nat. Rev. Mater., 2018, 3, 18020 CrossRef CAS
.
- Y. Tao, K. Yuan, T. Chen, P. Xu, H. Li, R. Chen, C. Zheng, L. Zhang and W. Huang, Adv. Mater., 2014, 26, 7931–7958 CrossRef CAS PubMed
.
- Y. Im, M. Kim, Y. J. Cho, J.-A. Seo, K. S. Yook and J. Y. Lee, Chem. Mater., 2017, 29, 1946–1963 CrossRef CAS
.
- H. Yersin, R. Czerwieniec, M. Z. Shafikov and A. F. Suleymanova, Chem. Phys. Chem., 2017, 18, 3508–3535 CrossRef CAS PubMed
.
- C. A. Parker and C. G. Hatchard, Trans. Faraday Soc., 1961, 57, 1894–1904 RSC
.
- C. A. Parker and C. G. Hatchard, J. Phys. Chem., 1962, 66, 2506–2511 CrossRef CAS
.
- C. A. Parker and C. G. Hatchard, Trans. Faraday
Soc., 1963, 59, 284–295 RSC
.
- H. Uoyama, K. Goushi, K. Shizu, H. Nomura and C. Adachi, Nature, 2012, 492, 234–238 CrossRef CAS PubMed
.
- A. Endo, M. Ogasawara, A. Takahashi, D. Yokoyama, Y. Kato and C. Adachi, Adv. Mater., 2009, 21, 4802–4806 CrossRef CAS PubMed
.
- A. Endo, K. Sato, K. Yoshimura, T. Kai, A. Kawada, H. Miyazaki and C. Adachi, Appl. Phys. Lett., 2011, 98, 083302 CrossRef
.
- F. Ni, N. Li, L. Zhan and C. Yang, Adv. Opt. Mater., 2020, 8, 1902187 CrossRef CAS
.
- F. Ni, Z. Zhu, X. Tong, M. Xie, Q. Zhao, C. Zhong, Y. Zou and C. Yang, Chem. Sci., 2018, 9, 6150–6155 RSC
.
- F. Ni, Z. Zhu, X. Tong, W. Zeng, K. An, D. Wei, S. Gong, Q. Zhao, X. Zhou and C. Yang, Adv. Sci., 2019, 6, 1801729 CrossRef
.
- S. Qi, S. Kim, V.-N. Nguyen, Y. Kim, G. Niu, G. Kim, S.-J. Kim, S. Park and J. Yoon, ACS Appl. Mater. Interfaces, 2020, 12, 51293–51301 CrossRef CAS PubMed
.
- X. Xiong, F. Song, J. Wang, Y. Zhang, Y. Xue, L. Sun, N. Jiang, P. Gao, L. Tian and X. Peng, J. Am. Chem. Soc., 2014, 136, 9590–9597 CrossRef CAS PubMed
.
- M. A. Bryden and E. Zysman-Colman, Chem. Soc. Rev., 2021, 50, 7587–7680 RSC
.
- E. Speckmeier, T. G. Fischer and K. Zeitler, J. Am. Chem. Soc., 2018, 140, 15353–15365 CrossRef CAS PubMed
.
- J. Luo and J. Zhang, ACS Catal., 2016, 6, 873–877 CrossRef CAS
.
- Z.-J. Yu, W.-Y. Lou, H. Junge, A. Päpcke, H. Chen, L.-M. Xia, B. Xu, M.-M. Wang, X.-J. Wang, Q.-A. Wu, B.-Y. Lou, S. Lochbrunner, M. Beller and S.-P. Luo, Catal. Commun., 2019, 119, 11–15 CrossRef CAS
.
- S. Hu, B. Huang, Y. Pu, C. Xia, Q. Zhang, S. Guo, Y. Wang and X. Huang, J. Mater. Chem. B, 2021, 9, 5645–5655 RSC
.
- Z. Liu, W. Shi, G. Hong, W. Chen, B. Song, X. Peng, X. Xiong and F. Song, J. Controlled Release, 2019, 310, 1–10 CrossRef CAS PubMed
.
- J. Zhang, F. Fang, B. Liu, J. H. Tan, W. C. Chen, Z. Zhu, Y. Yuan, Y. Wan, X. Cui, S. Li, Q. X. Tong, J. Zhao, X. M. Meng and C. S. Lee, ACS Appl. Mater. Interfaces, 2019, 11, 41051–41061 CrossRef CAS PubMed
.
- Z. Liu, F. Song, W. Shi, G. Gurzadyan, H. Yin, B. Song, R. Liang and X. Peng, ACS Appl. Mater. Interfaces, 2019, 11, 15426–15435 CrossRef CAS PubMed
.
- Wisechip launches the world's first Hyperfluorescence™ OLED display – a 2.7 inch yellow PMOLED, https://www.kyulux.com/wisechip-launches-the-worlds-first-hyperfluorescence-oled-display-a-2-7-inch-yellow-pmoled/. Accessed 16-08-2022.
- J. M. Ha, S. H. Hur, A. Pathak, J.-E. Jeong and H. Y. Woo, NPG Asia Mater., 2021, 13, 53 CrossRef CAS
.
- D. Chen, F. T. Tenopala-Carmona, J. A. Knöller, A. Mischok, D. Hall, S. M. Suresh, T. Matulaitis, Y. Olivier, P. Nacke, F. Gießelmann, S. Laschat, M. C. Gather and E. Zysman-Colman, ChemRxiv, 2022 DOI:10.26434/chemrxiv-2022-dc4zm
.
- Y. Zhu, S. Zeng, B. Li, A. J. McEllin, J. Liao, Z. Fang, C. Xiao, D. W. Bruce, W. Zhu and Y. Wang, ACS Appl. Mater. Interfaces, 2022, 14, 15437–15447 CrossRef CAS
.
- A. F. Suleymanova, M. Z. Shafikov, A. C. Whitwood, R. Czerwieniec and D. W. Bruce, J. Mater. Chem. C, 2021, 9, 6528–6535 RSC
.
- E. Voisin, E. Johan Foster, M. Rakotomalala and V. E. Williams, Chem. Mater., 2009, 21, 3251–3261 CrossRef CAS
.
- E. J. Foster, J. Babuin, N. Nguyen and V. E. Williams, Chem. Commun., 2004, 2052–2053, 10.1039/B400998C
.
- Y. Zhao and D. G. Truhlar, Theor. Chem. Acc., 2008, 120, 215–241 Search PubMed
.
- F. Weigend and R. Ahlrichs, Phys. Chem. Chem. Phys., 2005, 7, 3297–3305 RSC
.
-
M. J. Frisch, G. W. Trucks, H. B. Schlegel, G. E. Scuseria, M. A. Robb, J. R. Cheeseman, G. Scalmani, V. Barone, B. Mennucci, G. A. Petersson, H. Nakatsuji, M. Caricato, X. Li, H. P. Hratchian, A. F. Izmaylov, J. Bloino, G. Zheng, J. L. Sonnenberg, M. Hada, M. Ehara, K. Toyota, R. Fukuda, J. Hasegawa, M. Ishida, T. Nakajima, Y. Honda, O. Kitao, H. Nakai, T. Vreven, J. A. Montgomery Jr., J. E. Peralta, F. Ogliaro, M. J. Bearpark, J. Heyd, E. N. Brothers, K. N. Kudin, V. N. Staroverov, R. Kobayashi, J. Normand, K. Raghavachari, A. P. Rendell, J. C. Burant, S. S. Iyengar, J. Tomasi, M. Cossi, N. Rega, N. J. Millam, M. Klene, J. E. Knox, J. B. Cross, V. Bakken, C. Adamo, J. Jaramillo, R. Gomperts, R. E. Stratmann, O. Yazyev, A. J. Austin, R. Cammi, C. Pomelli, J. W. Ochterski, R. L. Martin, K. Morokuma, V. G. Zakrzewski, G. A. Voth, P. Salvador, J. J. Dannenberg, S. Dapprich, A. D. Daniels, Ö. Farkas, J. B. Foresman, J. V. Ortiz, J. Cioslowski and D. J. Fox, Gaussian 09, Gaussian, Inc., Wallingford, CT, USA, 2009 Search PubMed
.
- S. Grimme, J. Antony, S. Ehrlich and H. Krieg, J. Chem. Phys., 2010, 132, 154104 CrossRef PubMed
.
- M. Cossi, N. Rega, G. Scalmani and V. Barone, J. Comput. Chem., 2003, 24, 669–681 CrossRef CAS PubMed
.
- R. Englman and J. Jortner, Mol. Phys., 1970, 18, 145–164 CrossRef CAS
.
- M. A. El-Sayed, J. Chem. Phys., 1963, 38, 2834–2838 CrossRef CAS
.
Footnote |
| † Electronic supplementary information (ESI) available. See DOI: https://doi.org/10.1039/d2cp02684h |
| This journal is © the Owner Societies 2022 |


