 Open Access Article
Creative Commons Attribution 3.0 Unported Licence
Electrode kinetics from a single experiment: multi-amplitude analysis in square-wave chronoamperometry†
Dariusz
Guziejewski
 *a,
Leon
Stojanov
b,
Zuzanna
Zwierzak
a,
Richard G.
Compton
 c and
Valentin
Mirceski
 *abd
*abd
aDepartment of Inorganic and Analytical Chemistry, University of Lodz, Tamka 12, 91-403, Lodz, Poland. E-mail: dguziejewski@uni.lodz.pl; valentin@pmf.ukim.mk
bInstitute of Chemistry, Faculty of Natural Sciences and Mathematics, “Ss Cyril and Methodius” University in Skopje, P.O. Box 162, 1000, Skopje, Republic of North Macedonia
cDepartment of Chemistry, Physical and Theoretical Chemistry Laboratory, Oxford University, South Parks Road, Oxford, OX1 3QZ, UK
dMacedonian Academy of Sciences and Arts, Bul. Krste Misirkov 2, 1000, Skopje, Republic of North Macedonia
First published on 3rd October 2022
Abstract
The recently introduced technique of square-wave chronoamperometry (SWCA) is studied under conditions of progressively increasing height of potential pulses (square-wave amplitude) within a single experiment. In multi-amplitude square-wave chronoamperometry (MA-SWCA) a potential modulation consisting of square-wave forward and reverse potential pulses is imposed on a constant mid-potential; the amplitude of pulses increases progressively during the experiment. This allows the fast and reliable estimation of kinetic parameters at a constant pulse frequency in a single experiment, based on the resulting feature known as the amplitude-based quasireversible maximum. The proposed methodology is tested by simulating the responses of a simple quasireversible electrode reaction of a dissolved redox couple and a surface confined electrode reaction. Compared with conventional square-wave voltammetry (SWV) and SWCA, MA-SWCA shows advantages in estimation of the standard rate constant in terms of simplicity, speed and efficiency for both studied electrode mechanisms.
1. Introduction
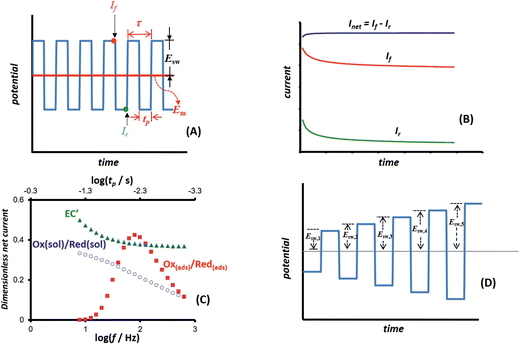
Square-wave chronoamperometry (SWCA)1 is a simplified form of square-wave voltammetry (SWV).2 The potential modulation (Fig. 1A) is a train of potential pulses of a height 2Esw (where Esw is the SW amplitude) imposed over a constant mid-potential (Em), whereas the current is measured at the end of each potential pulse, resulting in forward, backward (reverse) and differential (net) chronoamperometric current components (Fig. 1B). The technique, which has similarity with early works of Smit and Wijnen,3 is derived from SWV by replacing the underlying staircase potential of SWV with a constant mid-potential. In a quest for methodological advancing of voltammetric techniques4,5 in analytical, mechanistic and electrode kinetics contexts, SWCA has been introduced for the purpose of simplification of SWV and belongs to the group of recently introduced novel techniques derived from SWV.6–8While SWCA cannot be realistically applied for the initial mechanistic study of an unknown electrode reaction, it provides advantages for analytical application.9 Specifically, the net chronoamperometric current component gains a shape typical for a steady-state electrode process, regardless of the electrode dimensions (micro or macroscopic electrode) and the type of electrode reaction (surface confined or diffusion affected, Fig. 1B). Aiming to study electrode kinetics the main tool in hand is the duration of potential pulses (tp), or in terms of SWV, the SW frequency (f) defined as f = 1/τ = 1/(2tp), where τ = 2tp is the duration of a single potential cycle composed of two adjacent pulses (cf.Fig. 1A). The electrode reaction is commonly studied by varying the SW frequency; thus, the technique can be understood as an electrochemical faradaic spectroscopy, keeping in mind that the current measured at the end of each potential pulse extracts mainly the faradaic component of the response as common in the pulse voltammetry.10 The corresponding frequency spectrum of the current components is highly sensitive to the electrode kinetics and the type of the electrode mechanism, as exemplified in Fig. 1C, where the net current is presented as a function of the frequency for three different electrode mechanisms.
Beyond the basic form of the technique (Fig. 1A) it is easy to envisage a variant in which the duration of the potential pulses can progressively decrease (i.e., the SW frequency increases) in the course of a single SWCA experiment. Accordingly, a multi-frequency analysis has been proposed in our recent study,11 which enables inspection of the electrode reaction at different frequencies in a course of a single experiment, thus revealing the electrode kinetic parameters in a fast and efficient procedure. Such an approach, besides being useful in studying electrode kinetics in general, is expected to be beneficial for application with electrochemical sensors as well; for instance, affinity-based biosensors with “signalling-off” interrogation operate due to the variation of the electrode kinetics as a result of the analyte attachment to a redox-labelled, surface-immobilized probe.12,13 Here it is worth mentioning that other sophisticated methods for complete electrode characterization in a single experiment can be found in the works of merit of Bond et al. on Fourier transformed ac voltammetry14,15 as well as in other studies.16–19 Particularly appealing is the recent technique with non-triangular potential variation in cyclic voltammetry which enables conduction of a single experiment with a series of scan rates.20
In the present study we expand further the idea of multi-frequency analysis,11 testing the application of SWCA under conditions of a multi-amplitude variation in a single experiment (Fig. 1D). It is worth mentioning that the amplitude is a powerful tool in conventional SWV, as demonstrated in a series of studies over the last decades.21–23 Variation of the amplitude in SWV provides a means to measure the electrode kinetics at a constant scan rate of the voltammetric experiment, which is beneficial when complex electrode mechanisms are studied, the voltammetric response of which depends on several frequency-dependent parameters.24 Moreover, the experiments at a constant SW frequency are also beneficial as the effect of frequency-related uncompensated resistance is significantly reduced.25 Thus, a multi-amplitude variant of square-wave chronoamperometry (MA-SWCA) is proposed as shown in Fig. 1D, where the height of potential pulses progressively enhances during the experiment. Based on numerical simulations it will be demonstrated that the proposed technique provides an insight into the electrode kinetics of both quasireversible electrode reaction of a dissolved redox couple at a macroscopic planar electrode and the surface confined, diffusion free electrode reaction. The proposed approach replaces a series of repetitive experiments in SWV conducted at different amplitudes with a single experiment with MA-SWCA to provide an insight into the electrode kinetics. Such multiparameter analysis in a single experiment is of general importance in the context of electrochemical sensor application and solid electrode electrochemistry in general, where the electrode surface is a subject of constant variation in the process of cleaning and renewing the electrode surface, thus rigorously speaking, repeating the experiment under identical conditions is a priori impossible.
The applicability of the proposed methodology has been partly tested by experiments conducted with the [Fe(CN)6]4−/[Fe(CN)6]3− redox couple at a glassy carbon electrode (GCE) as a model for a quasireversible electrode reaction of a dissolved redox couple,26 and the azobenzene/hydrazobenzene couple immobilized on the mercury electrode surface, as a model for quasireversible surface confined electrode reaction.27
2. Details on electrode mechanisms and simulation procedure
A quasireversible one-electron electrode reaction is considered (eqn (1)). The redox couple consists of two chemically stable species dissolved in the electrolyte solution (sol) and the electrode reaction takes place at a macroscopic planar electrode.| Red(sol) ⇄ Ox(sol) + e− | (1) |
 . For the sake of simplicity, the diffusion coefficient (D) of both Red and Ox is assumed to be equal. All other details of the model are given in. ref. 2 For numerical simulations eqn (2) was applied, which was derived following the step function method.28
 | (2) |
Here,  is the dimensionless current, A is the electrode surface area,
  is the dimensionless electrode potential defined versus the formal potential of the electrode reaction (
 ),
),  is the numerical integration parameter, and m is the serial number of time increments. The time increment is defined as
  , which means that each potential pulse is divided into 25 equal time increments. In addition,
  is the electrode kinetic parameter, and other symbols have their common meaning.
A surface confined electrode reaction is described by the following equation:
| Red(ads) ⇄ Ox(ads) + ne− | (3) |
 | (4) |
 ,
,  is the dimensionless electrode kinetic parameter,
  is dimensionless potential, and n is the stoichiometric number of electrons in eqn (3).
All simulations under conditions of MA-SWCA are conducted at the mid-potential equal to the formal potential  (Ox/Red) by gradually increasing the amplitude, commonly from 10 to 300 mV. All simulations are performed by the commercial computer package MATHCAD 14 with a minimum hardware requirements of a Pentium 32-bit (x86) processor – 400 MHz and 256 MB of RAM.
3. Experimental
A multi-Autolab potentiostat model M101 controlled by the Nova software (v. 2.1.4, both Metrohm Autolab B.V.) was used to conduct all experiments. A hanging mercury drop electrode (HMDE; MTM Anko Instruments, Poland, surface area 0.00102 cm2) was the working electrode for the experiments with azobenzene, whereas a glassy carbon electrode was used for the experiments with the hexacyanoferrate redox system. In both cases Ag/AgCl (3 mol L−1 KCl) was used as a reference electrode and a platinum wire was used as a counter electrode. All experiments were conducted at room temperature.All chemicals were of analytical grade purity (Merck, Sigma-Aldrich or POCh), while solutions were prepared with deionized water obtained with Polwater DL-3 purification system. 1 mmol L−1 stock solution of azobenzene was prepared by dissolving in methanol. Britton–Robinson buffers at different pH values were used as supporting electrolytes for experiments with azobenzene. The stock solutions of K4[Fe(CN)6] and K3[Fe(CN)6] were prepared by dissolving in water, while 0.1 mol L−1 KNO3 solution was used as a supporting electrolyte.
As the MA-SWCA technique is not provided by the instrumentation, experiments were conducted by designing a series of subsequent double-step chronoamperometric protocols in Nova software in which the amplitude of the pulses was progressively increased from 2 to 200 mV for each potential cycle of a given duration (i.e., given frequency of the MA-SWCA experiment). In the chronoamperometric experiment the current sampling was conducted in the course of the whole duration of each potential pulse; specifically, each potential pulse consisted of 30 measurement current points, where the last one was used to construct the outcome of the experiment. Rigorously speaking, this way of sampling the current is not identical as in other pulse techniques that are already provided by the instrumentation, so scattering of experimental data relative to the theoretical expectations are plausible. However, for the purpose of this study, designing a series of subsequent double-step chronoamperometric protocols emulating the potential variation in MA-SWCA is sufficient. Conventional SWV with corresponding parameters was also applied in parallel to the chronoamperometric measurements. In azobenzene experiments accumulation of the redox probe at 0.0 V, followed by a 10 s quiescent period, was performed prior applying potential modulation in MA-SWCA or conventional SWV.
4. Results and discussion
4.1 Theoretical data
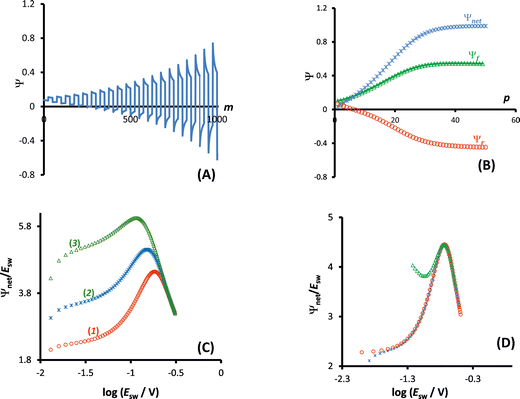
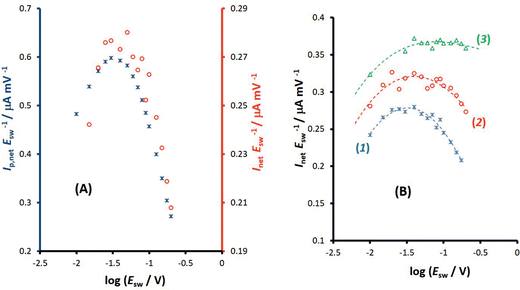
A typical chronoamperometric response, showing the current variation over the whole duration of potential pulses of the MA-SWCA virtual experiment is shown in Fig. 2A, where the dimensionless current is plotted as a function of the serial number (m) of time increments (i.e., time of the experiment). The simulations correspond to a typical quasireversible electrode reaction characterized with the electrode kinetic parameter κ = 0.1 and the anodic electron transfer coefficient α = 0.5. Note that from the theory of SWV2 the electrode kinetic parameter is defined as κ = ks/(Df)1/2, where ks is the standard rate constant. The electrode kinetic parameter together with the SW amplitude are the main parameters controlling the apparent electrochemical reversibility of a given electrode reaction. The increase of the current in each subsequent potential cycle (cf.Fig. 2A) is proportional to the enlargement of the height of potential pulses, i.e., the driving force of the electrode reaction. Extracting the currents from the end of each potential pulse, the forward, reverse and net chronoamperometric components can be constructed, being presented versus the serial number (p) of potential cycles, as shown in Fig. 2B. Each current component has a sigmoid shape, where the increasing part of the curve reflects the effect of the electrode kinetics. Clearly, replacing the serial number of potential cycles with the corresponding amplitude value, one can consider the outcome of the experiment in a voltammetric context, while the shape of the curves remains the same as in Fig. 2B. Thus, the upper plateau of the forward and net components (and the lower plateau of the reverse component) corresponds to the large amplitude values, when the electrode reaction is dominantly controlled by the diffusion rate.Following the methodology developed in our previous study,29 the most convenient way of presenting the data is in the form of amplitude normalized net current (Ψnet/Esw) as a function of the logarithm of the amplitude (Fig. 2C). The corresponding function has an approximately parabola-like shape, the maximum of which is sensitive to the electrode kinetics, as can be inferred from Fig. 2C. As the maximum is associated with the quasireversible kinetic region, the latter function is conveniently termed the amplitude-based quasireversible maximum.29 Let us note that for a given frequency and diffusion coefficient, the variation of κ presented in Fig. 2C corresponds to the variation of the standard rate constant. The parameter Ψnet/Esw can be understood as a primitive first derivation of the function Ψnetvs. Esw, reflecting the slope of the linear part of the function, which depends on the standard rate constant.29 Importantly, as shown in Fig. 2D, the amplitude-based quasireversible maximum can be obtained under conditions of both conventional SWCA and MA-SWCA. For the conventional SWCA the virtual experiment is repeated for each amplitude value, whereas in MA-SWCA the amplitude-based quasireversible maximum is measured by conduction of a single experiment. Including simulations with conventional SWV, Fig. 2D shows that the position of the maximum is identical for all three techniques, clearly revealing that kinetic measurements in a single experiment with MA-SWCA are reliable.
The outcome of the MA-SWCA experiment is predominantly controlled by the SW frequency and amplitude of the pulses regardless of the overall duration of the experiment, provided that  (Ox/Red). For instance, increasing the amplitude over the interval from 13 to 300 mV with an increment of 6 mV, where the total number of potential cycles is p = 50, the position of the maximum is located at the critical amplitude of (Esw)max = 150 mV (for κ = 0.1). Repeating the simulations by lowering the amplitude increment and thus increasing the total number of potential cycles to 100 and 500, the position of the maximum remains at the same critical amplitude of (Esw)max = 150 mV, clearly implying that chronoamperometric characteristics of the system dictated by the overall duration of the experiment are insignificant (Fig. S1, ESI†).
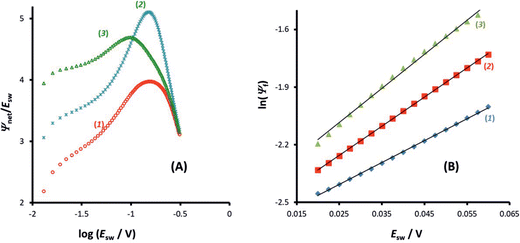
On the other hand, the position of the maximum is sensitive to the electron transfer coefficient (α), as shown in Fig. 3A. Thus, α has to be previously known in order to estimate the standard rate constant by means of the amplitude-based quasireversible maximum. A possible approach for estimation of α with the current technique is to consider the MA-SWCA experiment in a voltammetric context. Specifically, the forward current component (Ψf) can be analysed as a function of the SW amplitude in a Tafel-like analysis, as presented in Fig. 3B. The function ln(Ψf) vs. Esw has a linear part, the slope of which is sensitive to the electron transfer coefficient (Fig. 3B). The relationship between the slope value (m/V−1) and electron transfer coefficient α for amplitude values of 20 mV ≤ Esw ≤ 60 mV is represented by the following linear function: α = 0.062m − 0.426; R2 = 0.9817 (this equation is valid for transfer coefficient of 0.3 ≤ α ≤ 0.7 and other parameters as in Fig. 3). In Fig. 3B the slope values for α = 0.30 (1); 0.5 (2) and 0.70 (3) are 11.43; 15.15 and 17.76 V−1, respectively. These values slightly deviate from the values (11.68; 19.46 and 27.25 V−1) in the classical Tafel analysis (i.e., αF/(RT)) as the experiment is conducted with short potential pulses that do not allow steady-state conditions in the system at the end of the potential pulses.
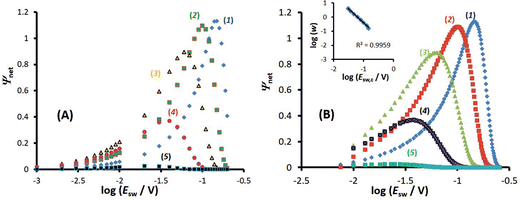
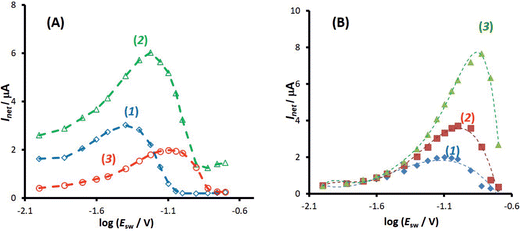
In addition, as implicit in the previous study,29 the electrode kinetics of surface confined electrode processes can be studied by variation of the SW amplitude in conventional SWV. A similar methodology can be applied in both conventional SWCA and MA-SWCA, as shown by the data summarized in Fig. 4. In conventional SWCA the experiment is repeated for different amplitudes, while the net current measured at the end of the experiment is plotted versus the logarithm of the amplitude (Fig. 4A). As known from the theory of SWV for surface confined processes, transposition of the electrode reaction through the quasireversible kinetic region is associated with a parabolic variation of the net peak-current, known as the quasi-reversible maximum.30 As previously mentioned, the apparent electrochemical reversibility of a given electrode reaction can be altered either by changing the SW frequency or by the amplitude. Thus, in SWCA conducted at a given frequency, the electrochemical reversibility is affected by the variation of the amplitude, giving rise to a well-defined, sharp, amplitude-based quasireversible maximum (Fig. 4A).
In MA-SWCA the amplitude-based quasi-reversible maximum can be measured in a single experiment, as shown in Fig. 4B. The position of the maxima for different values of the electrode kinetic parameter is identical as in conventional SWCA, confirming that MA-SWCA provides consistent data. The position of the maximum is markedly sensitive to the electrode kinetic parameter ω = ksur/f, i.e., to the standard rate constant ksur (s−1). As can be inferred from the inset of Fig. 4B the relation between the electrode kinetic parameter and the critical amplitude (Esw)max is exponential, and it can be transformed into a linear function in a “log–log” form as follows: log(ω) = −1.975![[thin space (1/6-em)]](https://www.rsc.org/images/entities/char_2009.gif) log(Esw/V)max − 2.398. The latter equation enables estimation of the electrode kinetic parameter ω = ksur/f (and thus the standard rate constant ksur) by measuring the critical amplitude by means of MA-SWCA experiment conducted for a given frequency.
log(Esw/V)max − 2.398. The latter equation enables estimation of the electrode kinetic parameter ω = ksur/f (and thus the standard rate constant ksur) by measuring the critical amplitude by means of MA-SWCA experiment conducted for a given frequency.
Importantly, the amplitude-based quasireversible maximum of surface electrode processes under conditions of MA-SWCA does not depend on the number of potential cycles (i.e., overall duration of the experiment) and slightly depends on the electron transfer coefficient. More specifically, for 0.35 ≤ α ≤ 0.65, the maximum is located at (Esw)max = 98 ± 2 mV for log(ω) = −0.4. Beyond this interval the position of the maximum is affected slightly by the electron transfer coefficient α, which is consistent with previous findings.29 This is a particularly important finding demonstrating that the position of the amplitude-based quasireversible maximum can be used for determination of the standard rate constant without previous knowledge of the electron transfer coefficient, considering that most frequently the electron transfer coefficient of surface electrode reactions is within the above given interval.
4.2 Experimental data
The one-electron electrode reaction of the redox couple [Fe(CN)6]3−/[Fe(CN)6]4− serves as a representative for a quasireversible process of a dissolved species uncomplicated with either adsorption or coupled chemical reactions. The experiments have been conducted in the presence of both [Fe(CN)6]3− and [Fe(CN)6]4− redox species at equal concentration of 0.25 mmol L−1. It should be however noted that the electrode reaction of hexacyanoferrate system is highly susceptible to the type of the electrode and the state of the electrode surface in particular when the carbon type electrode is used,26 as well as the concentration and composition of the supporting electrolyte, where the type of both cations31 and anions26 play a critical role in the electrode kinetics. In spite of the non-ideal behaviour of the hexacyanoferrate system, it is an attractive system for electrode characterization as it is readily available in pure form, stable in many solvents, providing reasonably well-defined electrochemical behaviour. Increasing the concentration of the supporting electrolyte (e.g., an aqueous electrolytes containing K+ ions) the kinetics of the electrode reaction increases from quasireversible to typical reversible behaviour at macroelectrodes.32 Most frequently, under experimental conditions of the current study (0.1 mol L−1 KNO3 aqueous solution at a glassy carbon macroelectrode) the electrode reaction is electrochemically quasireversible.24First, the features of the electrode reaction were briefly studied by conventional SWV. Over the frequency interval from 20 to 400 Hz, the SW net peak-current (Ip,net) is a linear function of the square root of the frequency, while the net peak potential is almost constant with an average value of 0.230 V, which is typical for the upper quasireversible region, close to the reversible voltammetric behaviour.2 The function Ip,netf−0.5vs. log(f−0.5), which corresponds to the expected theoretical relation of the dimensionless net peak-current (Ψp,net) vs. log(κ) (κ is the electrode kinetic parameter), increases steadily, confirming that the rate of the electrode reaction is within the quasireversible kinetic region.33 Studying the electrode reaction by varying the SW amplitude in conventional SWV a well-developed amplitude-based quasireversible maximum was obtained, shown in Fig. 5A (asterisks). Fitting the experimental results with the theoretical one, the standard rate constant of ks = 5.0 × 10⁻³ cm s−1 was estimated, assuming a common diffusion coefficient of D = 5 × 10⁻⁶ cm2 s−1 (Fig. S2, ESI†). In the fitting procedure the value of the anodic electron transfer coefficient was varied from 0.45 to 0.55, in agreement with literature data, which report the values of 0.53, 0.54 and 0.55 for KCl, NaCl and LiCl supporting electrolytes at boron-doped diamond electrode,34 and the values within the interval from 0.46 to 0.55 at Pt electrode.35 In our study the best fit was obtained for α = 0.55 and the correlation between the experimental and simulated data is linear, with regression coefficient R2 = 0.942, slope equal to 1, and intercept of 0.005. The estimated value of the standard rate constant is consisted with data obtained in our previous study, where values within the interval (1.6–3.1) × 10−3 cm s−1 were found.24 Referring to the common diffusion coefficient used in the simulations one should note that rigorously speaking the diffusion coefficients of the oxidised and reduced form of hexacyanoferrate are not equal (e.g., DOx = 7.26 × 10⁻⁶ cm2 s−1 and DRed = 6.67 × 10⁻⁶ cm2 s−1![[thin space (1/6-em)]](https://www.rsc.org/images/entities/char_2009.gif) 36). However, simulations have confirmed that these differences do not affect the accuracy of the estimation of the standard rate constant with amplitude-based quasireversible maximum when the electrode kinetics is within the upper part of the quasireversible region.
36). However, simulations have confirmed that these differences do not affect the accuracy of the estimation of the standard rate constant with amplitude-based quasireversible maximum when the electrode kinetics is within the upper part of the quasireversible region.
Importantly, Fig. 5A compares amplitude-based quasireversible maxima measured with conventional SWV and MA-SWCA for the frequency of f = 25 Hz, revealing that the position of the maximum is virtually identical in both techniques, which is in accordance with the theoretical prediction presented in Fig. 2D. Note that the experiment with MA-SWCA was conducted with the mid-potential  ([Fe(CN)6]3−/4−) = 0.233 V. Fitting of the experimental and theoretical data under conditions of MA-SWCA the standard rate constant was estimated to be ks = 3.0 × 10⁻³ cm s−1, which is independent on the value of the electron transfer coefficient within the interval 0.45 ≤ α ≤ 0.55 (Fig. S3, ESI†). Using the theoretical linear relationship between the critical amplitude (Esw)max/V and the dimensionless kinetic parameter κ: κ = −1.8286(Esw)max + 0.3687; R2 = 0.9946 (this equation is valid for 0.075 ≤ κ ≤ 0.325), the standard rate constant was estimated to be ks = 3.38 × 10⁻³ cm s−1 (assuming α = 0.5 and other parameters identical as in Fig. S2, ESI†). The system has been further studied by MA-SWCA for different frequencies and the data are summarized in Fig. 5B. Note that the chosen frequency values up to 100 Hz are not expected to cause an uncompensated resistance effect,25 implying that the accuracy of the measurement is not compromised. Increasing the frequency causes the amplitude-based quasireversible maximum to shift toward higher critical amplitudes, as the increasing frequency diminishes the electrode kinetic parameter, which support the theoretical data presented in Fig. 2C.
The second experimental system refers to the azobenzene/hydrazobenzene redox couple immobilized on the mercury electrode surface, which is typical diffusionless, surface confined electrode reaction.7Fig. 6A shows well defined experimental amplitude-based quasireversible maxima at different pH values, measured over the amplitude interval from 10 to 200 mV for the frequency of 25 Hz. Increasing the pH shifts the amplitude-based quasireversible maximum toward higher critical amplitudes implying lowering of the standard rate constant, which is in agreement with literature data.27 As the position of the amplitude-based quasireversible maximum under conditions of MA-SWCA does not depend on α for a surface electrode reaction for values in the range from 0.35 to 0.65, the fitting readily provides values for the surface standard rate constant of ksur = 15 s−1, 12 s−1, 6.6 s−1 and 2.7 s−1 for pH of 4, 5, 6 and 7, respectively.
To confirm theoretical predictions from Fig. 4B, where the position of the maximum depends on the electrode kinetic parameter, experimental amplitude-based quasireversible maxima have been measured at different frequencies in a buffer at pH = 7 (Fig. 6B). The measurements conducted at 25, 50 and 100 Hz are associated with critical amplitudes of (Esw)max = 80, 100 and 150 mV, respectively. Increasing the frequency causes the electrode kinetic parameter ω = ksur/f to decrease, thus shifting the maximum toward higher critical amplitudes, which is in agreement with the theoretical predictions. Using the regression equation for the relation between ω and (Esw)max derived from the simulations for n = 2,37 log(ω) = −3.104 log(Esw/V)max − 4.418 (R2 = 0.983), the estimated values of the electrode kinetic parameter for the frequency of f = 25, 50 and 100 Hz are ω = 0.097, 0.048 and 0.014, respectively. Thus, the estimated standard rate constant at pH = 7 is ksur = 2.07 s−1. The literature data for similar experimental conditions is ksur ≈ 5 s−1.38 Using the theoretical linear relationship between the real net current corresponding to the quasireversible maximum (Inet)max/A (i.e., the current at the critical amplitude (Esw)max) and the total surface concentration: Γ* = 1.802(Inet)max (this equation is valid for ω = 0.097, surface area of the electrode A = 0.00102 cm2, and other conditions identical as for Fig. 7), the total surface concentration at pH = 7 was estimated to be Γ* = 3.6 × 10⁻⁶ mol m−2.
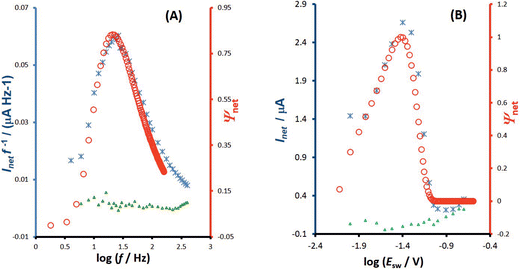 | ||
| Fig. 7 Azobenzene electrode reaction at HMDE in a BR buffer at pH = 5. Fitting of the experimental and theoretical data. (A) Multi-frequency analysis: frequency-based quasireversible maximum of experimental (asterisks, left ordinate) and theoretical data (circles, right ordinate), simulated for standard rate constant ks = 18 s−1 and amplitude of Esw = 25 mV. (B) Multi-amplitude analysis: amplitude-based quasireversible maximum of experimental (asterisks, left ordinate) and theoretical data (circles, right ordinate), simulated for standard rate constant ks = 12 s−1 and frequency of f = 25 Hz. The triangles in both panels refer to the blank experimental response. The other conditions of simulations for both panels are: electron transfer coefficient α = 0.5, number of electrons n = 2, temperature T = 298.15 K, and number of potential cycles is 100. The other experimental conditions are identical as for Fig. 4. | ||
For more accurate estimation of the standard rate constant the fitting of the experimental with theoretical data is recommended. The procedure is illustrated with the measurements at pH = 5, where a higher standard rate constant is expected compared to the medium at pH = 7. First, the electrode kinetics has been measured with the multi-frequency analysis, as described in our previous study.11Fig. 7A shows a typical frequency spectrum over the frequency interval from 4 to 400 Hz (asterisks) together with the blank response (triangles). The fitting procedure (circles) reveals the standard rate constant of ksur = 18 s−1 (the electron transfer coefficient is set to α = 0.5). Conducting the experiment under conditions of MA-SWCA, together with the fitting procedure, leads to the standard rate constant of ksur = 12 s−1 (Fig. 7B) confirming that MA-SWCA can reveal the kinetic data of the electrode reaction in a very fast and efficient procedure. These values are in close agreement with the data obtained by Laviron et al.,38 who found the value of 5.7 s−1 and 15 s−1 for cis and trans azobenzene isomer, respectively. In the present study an equimolar mixture of both isomers has been used; thus, the estimated value of 12 s−1, is in an excellent agreement with the data of Laviron et al.38
5. Conclusions
Multi-amplitude square-wave chronoamperometry is a novel technique for accessing electrode kinetics by conducting a single experiment in which the height of the potential pulses progressively increases. The outcome of the experiment can be considered in both chronoamperometric and voltammetric contexts, revealing the versatility of the proposed approach. The technique provides a means to identify the amplitude-based quasireversible maximum, which is a common feature of a plethora of electrode mechanisms under conditions of SWV, which is sensitive to the electrode kinetics. Importantly, the maximum can be constructed by conducting a single experiment in MA-SWCA, replacing a series of experiments needed in conventional SWV, thus reducing the error originating from the variation of the solid electrode surface by repeating the experiment. Another important feature is that the kinetic measurements are conducted at a constant frequency of the pulses, which is of particular importance when complex electrode mechanisms are studied, the response of which is dictated by a series of frequency-related kinetic parameters. For instance, assuming a quasireversible electrode mechanism coupled with a chemical reaction, variation of the frequency in multi-frequency analysis will simultaneously affect the kinetics of both electrode and chemical reactions, resulting in a complex behaviour. On the other hand, MA-SWCA has advantage over its analogous multi-frequency variant, as the variation of the amplitude at a constant frequency affects the electrode kinetics only. The proposed technique provides kinetic information of the electrode processes of both dissolved and immobilized redox couple. Yet, the precision of measurement of the amplitude-based quasireversible maximum for a kinetically controlled electrode reaction of a dissolved redox couple is higher for sluggish electrode reactions, which are associated with well-developed amplitude-based quasireversible maximum, the position of which can be precisely determined. For faster electrode reactions (ks > 10−2 cm s−1), one should prefer a multi-frequency variant over MA-SWCA, because the position of the maximum in multi-frequency experiment for rather fast electrode reactions is yet positioned at relatively low frequency values,11 thus avoiding the influence of uncompensated resistance and charging current. It should be noted that both techniques (MA-SWCA and MF-SWCA) have best performances when Em = 0 V vs. , which means that the formal potential should be previously known. Initial determination of the formal potential and examination of other basic experimental conditions (i.e., conditions of the electrode, electrolyte solution, etc.) must be studied by well-established techniques such as cyclic voltammetry and/or SWV prior to the application of MA-SWCA and MF-SWCA.
It is reasonable to assume that SWCA1 and its multi-frequency11 and multi-amplitude variants will find their applications in electrochemical sensors, replacing the simple and frequently applied chronoamperometric protocol at a constant potential. While SWCA generally provides a basis for improved analytical performances, its multi-frequency and multi-amplitude variants enable estimation of kinetic parameters from a single experiment, which is of critical importance for a range of electrochemical sensors (e.g., affinity-based electrochemical biosensors). Finally, it is plausible to envisage that the current methodology of SWCA will be further developing in a direction of simultaneous multi-frequency and multi-amplitude variations in a single experiment.
Author contributions
D. G. – conceptualization, data curation, formal analysis, methodology, project administration, resources, supervision, validation, writing – original draft, writing – review & editing; L. S. – formal analysis, investigation, methodology, resources, software, validation, visualization, writing – review & editing; Z. Z. – investigation, data curation; R. G. C. – writing – review & editing; V. M. – conceptualization, formal analysis, funding acquisition, methodology, software, supervision, writing – original draft, writing – review & editing.Conflicts of interest
There are no conflicts to declare.Acknowledgements
This research was funded in whole or in part by National Science Center, Poland: grant no. 2020/39/I/ST4/01854. For the purpose of Open Access, the author has applied a CC-BY public copyright licence to any Author Accepted Manuscript (AAM) version arising from this submission.References
- D. Jadresko, D. Guziejewski and V. Mirceski, ChemElectroChem, 2018, 5, 187 CrossRef CAS.
- V. Mirceski, K. Lovrić and Š. M. Lovrić, Square-Wave Voltammetry: theory and application, ed. F. Scholz, Springer-Verlag; Berlin Heidelberg, 2007 Search PubMed.
- W. M. Smit and M. D. Wijnen, Recl. Trav. Chim. Pays-Bas, 1960, 79, 5 CrossRef CAS.
- V. Mirceski, L. Stojanov and S. Skrzypek, Contrib., Sec. Nat. Math. Biotech. Sci., 2018, 39, 103 CAS.
- C. Batchelor-McAuley, E. Kätelhön, E. Barnes, R. Compton, E. Laborda and A. Molina, ChemistryOpen, 2015, 4, 224 CrossRef CAS PubMed.
- V. Mirceski, D. Guziejewski, L. Stojanov and R. Gulaboski, Anal. Chem., 2019, 91, 14904 CrossRef CAS.
- V. Mirceski, D. Guziejewski, M. Bozem and I. Bogeski, Electrochim. Acta, 2016, 213, 520 CrossRef CAS.
- V. Mirceski, L. Stojanov and R. Gulaboski, J. Electroanal. Chem., 2020, 872, 114384 CrossRef CAS.
- L. Stojanov, V. Jovanovski and V. Mirceski, Electroanalysis, 2021, 33, 1271 CrossRef CAS.
- A. Molina and J. González, Pulse Voltammetry in Physical Electrochemistry and Electroanalysis: theory and applications, Springer, New York, 2016 Search PubMed.
- L. Stojanov, D. Guziejewski, M. Puiu, C. Bala and V. Mirceski, Electrochem. Commun., 2021, 124, 106943 CrossRef CAS.
- M. Puiu, A. Idili, D. Moscone, F. Ricci and C. Bala, Chem. Commun., 2014, 50, 8962 RSC.
- M. Puiu and C. Bala, Curr. Opin. Electrochem., 2018, 12, 13 CrossRef CAS.
- H. Adamson, A. M. Bond and A. Parkin, Chem. Commun., 2017, 53, 9519 RSC.
- J. Li, C. L. Bentley, A. M. Bond and J. Zhang, Anal. Chem., 2016, 88, 2367 CrossRef CAS.
- A. M. Bond, T. L. E. Henderson and K. B. Oldham, J. Electroanal. Chem., 1985, 191, 75 CrossRef CAS.
- A. Neudeck, F. Marken and R. G. Compton, Electroanalysis, 1999, 11, 1149 CrossRef CAS.
- X. Huang, L. Wang and S. Liao, Anal. Chem., 2008, 15, 5666 CrossRef PubMed.
- A. Molina, J. González, E. Laborda and R. G. Compton, J. Electroanal. Chem., 2015, 756, 1 CrossRef CAS.
- Y. Uchida, E. Kätelhön and R. G. Compton, J. Electroanal. Chem., 2017, 801, 381 CrossRef CAS.
- S. J. M. Rosvall, M. Sharp and A. Bond, J. Electroanal. Chem., 2002, 536, 161 CrossRef CAS.
- P. Dauphin-Ducharme, N. Arroyo-Curras, M. Kurnik, G. Ortega, H. Li and K. Plaxco, Langmuir, 2017, 33, 4407 CrossRef CAS.
- D. Guziejewski, Electroanalysis, 2019, 31, 231 CrossRef CAS.
- V. Mirceski, D. Guziejewski and K. Lisichkov, Electrochim. Acta, 2013, 114, 667 CrossRef CAS.
- V. Mirceski and M. Lovrić, J. Electroanal. Chem., 2001, 497, 114 CrossRef CAS.
- M. Noel and P. N. Anantharaman, Analyst, 1985, 110, 1095 RSC.
- S. Wawrzonek and J. D. Fredrickson, J. Am. Chem. Soc., 1955, 77, 3985 CrossRef.
- R. S. Nicholson and M. L. Olmstead, in Electrochemistry: Calculations, Simulation and Instrumentation, ed. J. S. Mattson, H. B. Mark and H. C. MacDonald, Marcel Dekker, New York, 1972, pp. 120–137 Search PubMed.
- V. Mirceski, E. Laborda, D. Guziejewski and R. G. Compton, Anal. Chem., 2013, 85, 5586 CrossRef CAS.
- S. Komorsky-Lovrić and M. Lovrić, J. Electroanal. Chem., 1995, 384, 115 CrossRef.
- L. M. Peter, W. Durr, P. Bindra and H. Gerischer, J. Electroanal. Chem., 1976, 71, 31 CrossRef CAS.
- P. Bindra, H. Gerischer and L. M. Peter,, J. Electroanal. Chem., 1974, 57, 435 CrossRef CAS.
- B. A. Brookes and R. G. Compton, J. Phys. Chem. B, 1999, 103, 9020 CrossRef CAS.
- D. Y. Kim, J. Wang, J. Yang, H. W. Kim and G. M. Swain, J. Phys. Chem. C, 2011, 115, 10026 CrossRef CAS.
- P. H. Daum and C. G. Enke, Anal. Chem., 1969, 41, 653 CrossRef CAS.
- S. J. Konopka and B. McDuffie, Anal. Chem., 1970, 42, 1741 CrossRef CAS.
- J. L. Sadler and A. J. Bard, J. Am. Chem. Soc., 1968, 90, 1979 CrossRef CAS.
- E. Laviron and Y. Mugnier, J. Electroanal. Chem., 1980, 111, 337 CrossRef CAS.
Footnote |
| † Electronic supplementary information (ESI) available. See DOI: https://doi.org/10.1039/d2cp01888h |
| This journal is © the Owner Societies 2022 |

