
 Open Access Article
 This Open Access Article is licensed under a
 Creative Commons Attribution 3.0 Unported Licence
Drained and undrained heat capacity of swelling clays†
Tulio
Honorio
 *a and
Laurent
Brochard
b
*a and
Laurent
Brochard
b
aUniversité Paris-Saclay, CentraleSupélec, CNRS, LMPS - Laboratoire de Mécanique Paris-Saclay, 91190, Gif-sur-Yvette, France. E-mail: tulio.honorio-de-faria@ens-paris-saclay.fr; Fax: +33 (0) 1 81 87 51 02; Tel: +33 (0) 1 81 87 51 02
bLaboratoire Navier, Ecole des Ponts ParisTech, Univ Gustave Eiffel, CNRS, Marne-la-Vallée, France
First published on 24th May 2022
Abstract
In microporous materials, poromechanical drained (open pore) and undrained (close pore) conditions play a role in the thermo-mechanical properties, which can also be affected by specific ion effects. Heat capacity is a key property to understanding the thermo-hydro-mechanical behavior of clays. However, there is a lack of bottom-up approaches aiming at capturing the influence of confined water and ion effects on the heat capacity of clays. We perform molecular dynamics simulations to obtain the heat capacity of Na- and Ca-montmorillonite using classical and semi-classical approaches. The heat of adsorption is computed from Grand Canonical Monte Carlo (GCMC) simulations under ambient conditions. We provide the theoretical framework to compute the drained heat capacity using the undrained heat capacity and the heat of adsorption. The semi-classical approach is required to capture the heat capacity of the solid mineral but cannot properly capture that of the inter-layer electrolyte. A hybrid approach is proposed, which combines the semi-classical approach for the mineral and the classical approach for the electrolyte. The undrained and drained heat capacities of clays evolve linearly with the water content, which leads to the conclusion that the effects of the mixing of hydration states are not significant. Undrained heat capacity is almost independent of the counterion nature. In contrast, the overall trends of drained heat capacity plotted against the water content exhibit larger values for Na-Mmt than for Ca-Mmt. Our results are in agreement with experimental data for a variety of smectites.
1 Introduction
Clays are critical for a variety of environmental processes (including some natural hazards) as well as industrial applications, notably the ones related to energy production (e.g. oil and gas exploration and extraction, geothermal fields, and nuclear waste disposal).1 Other industrial uses of clays cover pharmaceutical, cosmetic, building materials, agriculture and food production.1–5 More recently, synthetic organic–inorganic composites made with clays are being used to enhance the thermal and mechanical properties of polymers.6,7 A fundamental understanding of clay thermal properties is needed to either predict the behavior of clay-rich rocks and soils or to design the properties of clayey materials.The thermal behavior of clays has been a subject of interest at least since the works of Le Chatelier.8 Heat transfer is related to a variety of problems including thermal stimulation and artificial freezing of soils, as well as temperature regimes affecting micro-climatological and agriculture research.5 Thermo-hydro-mechanical (THM) analysis of the stability of clay-rich soils and rocks requires precise knowledge of the heat capacities of clays.9 Watanabe et al.10 point out that the main factors to which the thermal response in THM analysis are more sensible are the permeability and heat capacity of the porous media. The heat capacity is the fundamental property governing the increase of temperature upon heating (e.g. ref. 11 and 12) and plays a role in the thermal pressurization of clayey materials.9,13 Similarly, THM analysis of other geomaterials such as concrete structures (calcium silicate hydrates, which are the main product of cement hydration, are phyllosilicates as clays) reveals a strong dependency of temperature and stresses development on the variations of heat capacities.14
However, despite the importance of heat capacity, few fundamental studies have investigated this property, even those studies are often restricted to macroscopic measurements. Skauge et al.15 measured the heat capacities of Na- and Ca-kaolinites, Na- and Ca-montmorillonite, illite, and attapulgite from 300 to 700 K using a differential scanning calorimeter. These authors found heat capacities at a constant pressure of 811 and 779 for J kg−1 K−1 for Na-Mmt and Ca-Mmt, respectively, and quite significant variations of the heat capacity with the temperature. Their measurements are also reported to be sensitive to moisture content. Garrite et al.16 report that changes in water content strongly affect the heat capacity of porous media and, in particular, bentonites. An increase of the specific heat capacity with water content is expected5,17–19 since the specific heat capacity of (bulk) water is more than three to four times the heat capacity of solid minerals in clays. Other authors provide pressure-constant heat capacity of bentonites and sepiolites (both with different contents of smectite, kaolinites, and illite)3,17 or of purified samples of smectites, beidellites, and illites20 measured from calorimetry.
Atomistic simulations have proven to be a powerful tool in the elucidation of the physical origins of the mechanical and transport properties of clays (e.g. ref. 21). Studies on other phyllosilicates using molecular simulations show both that the heat capacity of water decreases22,23 or increases23 with confinement in micropores. The heat capacity of confined water in micropores of silica, as reported by Etzler and co-workers,24–26 displays a non-monotonic evolution when plotted against pore size and temperature. These authors indicated structural transitions in adsorbed water as the cause of the pore size and temperature dependence of the heat capacity of water in micro- and meso-pores. The water confinement effect is generally neglected in macroscopic models which extrapolate calorimetric data as a function of water content, instead, assuming free water only.17 Indeed, the usual description of porous medium as a bulk fluid/solid mixture yields a simple mixing law for the total heat capacity.27 Moreover, confined water is reported to show anomalous thermal expansion in clay micropores.9 Also, molecular simulations allow assessing the heat capacity as a function of the composition of clay layers as well as the counterion nature. Important insights regarding the behavior of clays can be obtained from bottom-up studies. Adsorption phenomena, taking place at molecular scales, is proven to be fundamental in the thermo-mechanical behavior of clays.28,29 To the authors’ knowledge, no specific studies relating adsorption to the development of thermal properties of clays such as heat capacities have been proposed so far in the literature.
In poromechanics, drained and undrained conditions, referring, respectively, to open pore (the pore fluid can exchange with the environment) and close pore (the pore fluid cannot exchange with the environment) conditions, are known to affect the thermo-mechanical response of porous materials and can be linked to a timescale related to long-term and instantaneous behaviors, respectively (e.g. ref. 30). A theoretical background linking adsorption phenomena at the molecular scale and estimates of the heat capacity accounting for the chemical composition is still to be provided in the case of clays.
The motivation of this work relies on the lack of a bottom-up model capturing the influence of adsorption and counterion nature in the development of the heat capacity of clays. Here, the goal is to provide the heat capacity of swelling clays at the nanoscale as a function of hydration state and counterion nature. To do so, we perform molecular simulations of the clay layer mimicking drained geomechanical conditions. Na- and Ca-montmorillonites are chosen due to their abundance and industrial interest. This aspect is highlighted by the fact that montmorillonite is a well-studied system in molecular simulations (e.g. ref. 31–36). The heat capacity is computed using classical and semi-classical methods. We discuss the obtained heat capacity of hydrated clays and confined water within clay micropores. From the GCMC simulation, we also compute the heat of adsorption. Both drained and undrained conditions are considered. The theoretical framework required to compute the drained heat capacity as a function of the undrained heat capacity and the heat of adsorption is provided. Based on previous works28,29 indicating the propensity of clays to mix hydration states at a mesoscale, we also discuss the implications of the hydration transitions on the observed heat capacity of clay particles.
2 Models and methods
2.1 Undrained heat capacity from molecular simulations
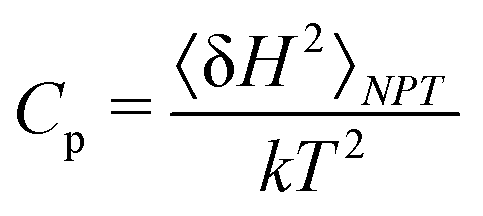
At constant volume V, the heat capacity Cv quantifies how internal energy E changes with temperature T; whilst, at constant pressure P, heat capacity Cp quantifies how the enthalpy H = E + PV changes with temperature: | (1) |
In general, the experimental determination of Cp is preferred since it is difficult to perform isochoric experiments.
In a full classical approach, both Cv and Cp can be determined from molecular simulations in canonical (NVT) and isothermal–isobaric ensemble (NPT), respectively. A basic approach consists in performing a series of simulations at various T and estimating the temperature derivatives by finite differences. A more direct way of obtaining Cv and Cp is through fluctuations formula.37 The fluctuation of a thermodynamic quantity A in a given ensemble Ens is defined as: 〈δA2〉Ens = 〈A2〉Ens − 〈A〉Ens2. In this context, Cv can be computed from a simulation in the NVT ensemble from the fluctuations of the internal energy E:37
 | (2) |
 | (3) |
Constant volume cv and constant pressure cp specific heat capacities (i.e., heat capacities per unit mass) are related according to (e.g. ref. 38):
 | (4) |
The above estimates are based on classical physics and neglect the quantification of energy that may become significant for materials with high phonon frequencies ν (hν ∼ kT, with h being the Planck's constant). When quantum effects become significant, the heat capacity becomes lower than the classical estimate, and quantum corrections are required to compute the heat capacity.39 In this respect, a semi-classical approach has been adopted by several authors to compute the heat capacity of minerals with high phonon frequencies.22,39,40 This approach considers only the vibrational contribution to the heat capacity and neglects anharmonic effects. The heat capacity is computed as the superposed contributions of the various vibrational modes weighted by their respective quantum correction:40
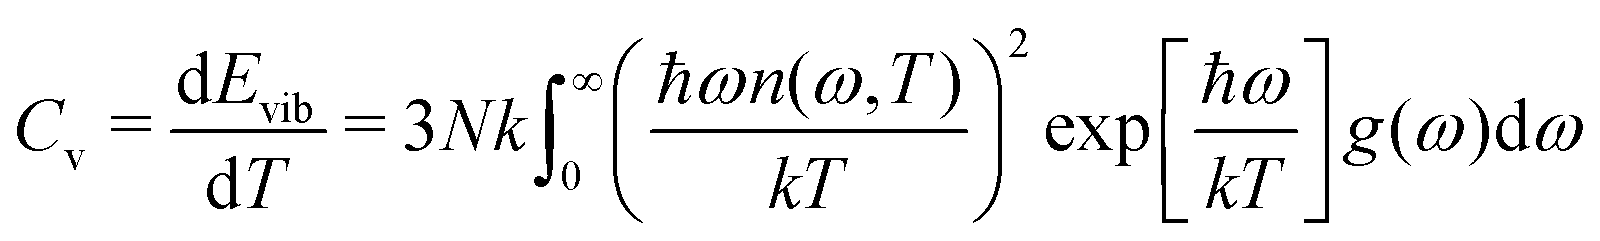 | (5) |
 is the Bose-Einstein distribution, and g (ω) is the density of the states. The approach is semi-classical because it involves classical evaluations of the density of states g (ω) from the Fourier transform of velocity auto-correlation function (see the ESI,† for details on the computation):
 | (6) |
2.2 Thermodynamics of swelling in drained conditions
In drained conditions, bound water within clay micropores is in osmotic equilibrium with an external reservoir of free water. As discussed in a previous work,28,29,41 drained conditions correspond to a mixed thermodynamic ensemble (NVT/μVT), for which equilibrium corresponds to the minimization of the Helmholtz free energy of the solid skeleton and counterions plus the grand potential of the water. This hybrid thermodynamic potential λ, reduced per unit area A, can be computed from the confining pressure isotherms P (d), with d the inter-layer distance of the clay layer: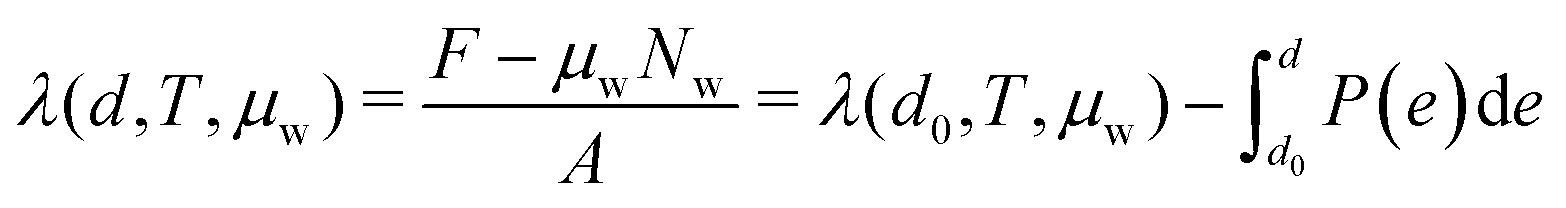 | (7) |
Due to the ordering of water adjacent to the layers in clay micropores, λ exhibits multiple wells each corresponding to a hydration state. Clay layers are generally organized in stacks (often called a clay particle). At the scale of a particle, thermodynamic equilibrium corresponds to the minimization of the convex hull of λ for an average deformation (which is, in layered materials, proportional to the average basal spacing 〈d〉) imposed on the boundary of the particle. An inter-layer distance d is stable if λ (d) it is part of the convex hull of λ, so that it is homogeneous under a given load, i.e. 〈d〉 = d. These stable spacings are associated with a specific hydration state. In Fig. 1 (left) we identify the stable hydration states of Na- and Ca-Mmt in the confining pressure isotherms and the λ energy profiles (plotted versus the inter-layer distance) according to the Grand Canonical Monte Carlo (GCMC) simulation detailed in Section 2.3. The hydration states corresponding to 0 W, 1 W, and 2 W are clearly defined on Na-Mmt; whereas only the hydration states corresponding to 0 W and 1 W are clearly defined on Ca-Mmt.
 | ||
| Fig. 1 Stable path in pressure isotherms (bottom) according to free energy λ (top) for Na- and Ca-Mmt at ambient conditions (300 K and Pw of 1 atm). The results of pressure were filtered with a Savitzky–Golay algorithm.44 The mixture of hydration states in response to a thermo-mechanical loading as discussed by Brochard et al.28 The hydration states corresponding to 0 W, 1 W, and 2 W are clearly defined on Na-Mmt isotherms (light gray rectangles); whereas only the hydration states corresponding to 0 W and 1 W are clearly defined on Ca-Mmt isotherms (light blue rectangles). The limit of the 1 W state in Ca-Mmt curves can be approximately identified considering the average diameter of a water molecule (circa 3.5 Å). | ||
For imposed deformations in-between two stable states, the system responds by linearly combining fractions of stacks in each state.29,42 This phenomenon is a proper characteristic of materials exhibiting multi-well energy profiles43 and is thermodynamically analogous to a phase transition. Fig. 1 (right) depicts a scheme of the mixing stable states in response to a given imposed displacement. Under confining pressure control, a stack of hydrated clay layers follows the stable (reversible) path indicated in Fig. 1 (left).
According to the theory presented in this section, we conclude that under drained conditions and confining pressure control:
• Some inter-layer distances (or correspondingly, deformations) of hydrated clay layers are thermodynamically unstable. So, the corresponding heat capacities at the layer scale would not be observed.
• When submitted to an average “unstable” deformation, the mechanical response of a stack of layers is to mix hydration states, as in a phase transition. The corresponding heat capacity at the scale of a stack of layers will be the linear combination of the heat capacities of the stable hydration states.
Transitions between hydration states involve large volumes of drained water which is expected to have a significant impact on the observed heat capacity of clay because of the heat of adsorption.
 | (8) |
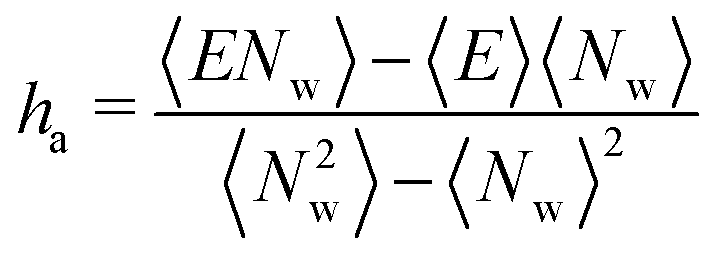 | (9) |
It should be noted that the application of this formula requires two independent simulations: one to obtain the enthalpy of the bulk fluid (e.g., liquid water for saturated clays) and one for the adsorbed fluid (in the grand canonical ensemble).
The usual definition of the isosteric heat of adsorption is for a system maintained at pressure Pw, which corresponds to the normal experimental conditions in adsorption experiments. However, in GCMC simulations the volume is fixed instead. Therefore, the heat of adsorption obtained from the fluctuation formula in eqn (9) is the heat of adsorption for isochoric conditions. As in the case of the heat capacities at constant pressure or constant volume, in condensed systems, isosteric and isochoric heats of adsorption are also expected to be similar.
In this context, the drained heat capacity at constant pressure can be determined according to:
 | (10) |
 is computed from a series of grand canonical simulations under the same imposed bulk fluid pressure Pw at different temperatures.
2.3 Molecular models and methods
In this work, we investigate montmorillonite as a particular case of swelling clay. The montmorillonite atomic structure is built from pyrophyllites through the following substitutions:46,47 one out of each eight octahedral aluminum atoms is substituted by a magnesium atom, and one out of each 32 tetrahedral silicon atoms is substituted by an aluminum atom. The substitution sites are randomly chosen but are not allowed to share the same bridging oxygen. The resulting structural formula is M. [Si62Al2]tet [Mg4Al28]octO160 (OH)32·nH2O, where M stands for the counterions in the inter-layer space. We consider sodium (Na-Mmt, M = 6Na+) and calcium (Ca-Mmt, M = 3Ca2+) saturated montmorillonite. The total surface charge density of the layers (−0.124 C m2) is exactly balanced by the counterions. The simulation supercell is obtained by replicating the layers in each direction of the unit cell. The resulting triclinic supercell has two slit pores as shown in Fig. 2. | ||
| Fig. 2 Equilibrium snapshot of Na- and Ca-Mmt at 300 K and RH = 100%. The triclinic periodic super-cell is shown according to the ac plane. Atoms are colored as follows: Na, blue; Ca, gray; Mg, pink; Si, yellow; O, red; H, white; Al, green. The in-plane dimensions obtained after equilibration are La = 20.72 Å and Lb = 17.96 Å. Various interlayer distances were tested. | ||
Non-bonded interactions between atoms are described by Lennard-Jones and Coulomb potentials. Lennard-Jones parameters and partial charges from the ClayFF force field48 are used together with the extended simple point charge (SPC/E) model for water.49 Lennard-Jones cross-parameters follow Lorentz-Berthelot mixing rules. Long-range electrostatic interactions are treated with the Ewald sum method with an accuracy in forces of 10−5. We adopt a cutoff distance of 9.0 Å for short-range dispersive interactions. Simulations were run with periodic boundary conditions. Following ClayFF, harmonic bonds are defined for hydroxyls and harmonic angles for angles between octahedral Al and hydroxyls.
Regarding water, rigid and flexible SPC/E models are considered. ClayFF provides angle and covalent bond rigidities to make water flexible, and both SPC and SPC/E models have been used with ClayFF.50 Rigid three-site water models such as SPC, SPC/E, and TIP3P are reported to best capture the experimental heat capacities of water.51 This discrepancy will be analyzed in detail in the next section by comparing rigid and flexible SPC/E waters.
Molecular dynamics simulations in NVT and NPT ensembles are performed with LAMMPS.52 In these simulations, we use a Nosé-Hoover thermostat and barostat with damping parameters of 100 and 1000 timesteps, respectively. After relaxation at 300 K and 1 atm the simulation super-cell has the ab-plane dimensions La = 20.72 Å and Lb = 17.96 Å. Note that the same system size was used in several previous studies.29,47,53–55 Of course size effects are not excluded, in particular regarding the phonon spectrum but this aspect is not explored in the present study. To compute undrained heat capacity, NVT simulations are run for 0.5 ns for classical estimates and NVE simulations (after appropriate equilibration under NVT conditions during 0.1 ns followed by 0.1 ns NVE equilibration) for semi-classical estimates. A timestep of 0.1 fs was adopted. Water molecules are constrained with the SHAKE algorithm.
The number of water molecules is a function of the inter-layer distance, temperature, and chemical potential of water (which is related to the pressure of the fluid reservoir). Here, we consider inter-layer distances ranging from 9 to 20 Å, which comprises the dehydrated up to capillary pore water states in clays.1 The water content is based on hybrid GCMC-NVT simulations detailed in the ESI.† We adopt a chemical potential corresponding to an RH of 100% (i.e. the water pressure Pw to be imposed is the liquid–vapor coexistence pressure, which is 0.01004 atm for SPC/E water at 300 K56). Fig. 3 displays the number of water molecules Nw per unit cell ([Si7.75Al0.25]tet [Mg0.5Al3.5]octO20(OH)4) as a function of inter-layer distance obtained from GCMC simulations. The water content for Na-Mmt is in agreement with previous studies using configurational bias GCMC.29
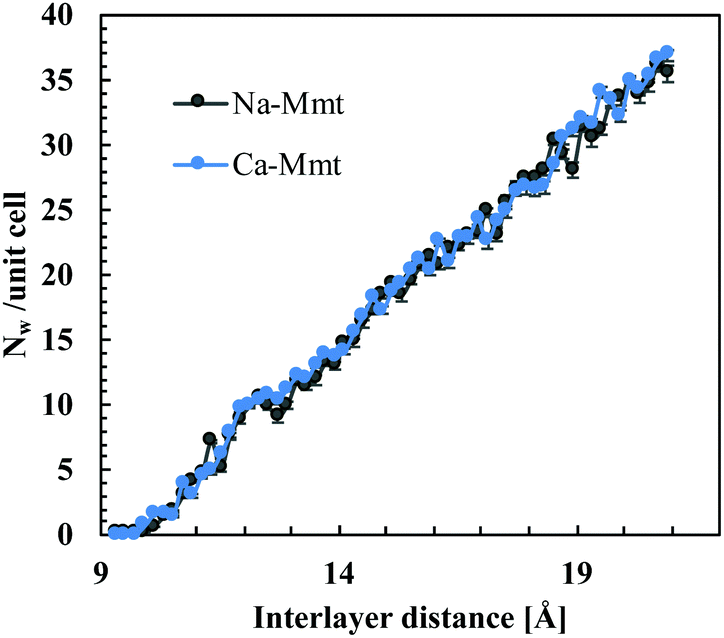 | ||
| Fig. 3 Water content in terms of the number of water molecules Nw per unit cell ([Si7.75Al0.25]tet [Mg0.5Al3.5]octO20(OH)4) as a function of the inter-layer distance obtained from GCMC simulation of Na-Mmt and Ca-Mmt. The standard deviations of Nw in the Ca-Mmt curve have the order of magnitude of the circles. | ||
The drained heat capacity is computed from GCMC simulations. First, the isosteric heat of adsorption is obtained from the fluctuations of potential energy and the number of particles. And then, the derivative  is computed from a series of grand canonical simulations at three different temperatures (290, 300, and 310 K) under the same imposed water pressure Pw = 1 atm.
3 Results and discussion
3.1 Heat capacity of bulk water
The analysis of bulk water behavior is crucial to determine the molecular model and approach better suited to capture the heat capacity of hydrated clays.Fig. 4 shows the specific heat capacity cv of bulk water as obtained from molecular simulations and experiments. Specific cv and total heat capacity Cv are related according to cv = Cv/(Nwmw), where Nw is the number of water molecules and mw is the mass of a water molecule. Experimental data on vapor show that Cv goes from (6/2) Nwk at 300 K to 6Nwk at 5000 K with the transition taking place around 2000 K. The first case ((6/2) Nwk) corresponds to the Dulong–Petit law when only kinetic contributions are accounted for, i.e., when each one of the six degrees of freedom, related to the three possible translations and three possible rotations of each water molecule, contributes with k/2. The second case (6Nwk) corresponds to the Dulong–Petit law when both kinetic degrees of freedom and internal vibrations are accounted for, the latter include bending, symmetric, and anti-symmetric stretching modes for water molecules. This transition occurring at high temperatures shows that internal vibrations in water are not contributing to the heat capacity at ambient temperature.
 | ||
| Fig. 4 Specific heat capacity cv of bulk water: comparisons of simulations results using rigid and flexible SPC/E at a constant density as a function of the temperature with experimental data from the NIST database. Dulong–Petit estimates regarding only kinetics contribution Cv = (6/2) Nwk, and both kinetics and internal vibrations (Cv = 6Nwk) are shown together with experimental measurements of water vapor as a function of the temperature. | ||
In this context, considering internal vibrations are inactive, the Cv of the condensed phase is expected to be 6Nwk, excluding anharmonicity. Experimental evidence shows, however, that the Cv of liquid water is much higher than 6Nwk, which is expected since anharmonicity is major in liquids. The semi-classical approach assumes harmonicity and provides results that cannot exceed the Dulong–Petit law. For this reason, the semi-classical approach is not applicable to liquid water.
As shown in Fig. 4, the application of the full classical approach to the rigid SPC/E water model predicts reasonably well the cv of liquid water, being, therefore, the preferred method to study this property by molecular simulation. In contrast, the classical approach applied to the flexible SPC/E water model yields estimates that far exceeds the experimental heat capacity of liquid water (Fig. 4). Flexible SPC/E overestimates significantly cv because it accounts for internal vibrations, which should not contribute at ambient temperature.
In summary, these observations show that the Dulong–Petit law does not apply to liquid water, and, that the appropriate molecular simulation method to estimate the heat capacity of liquid water is the classical approach applied to rigid models.
3.2 Heat capacity of dry clay
When only the dry mineral is considered, the classical approach yields an estimated specific heat capacity of cv = 1339 ± 27 J kg−1 K−1 = 24.2 ± 0.5 J (mol−1 K−1 for Na-Mmt and cv = 1354 ± 55 J kg−1 K−1 = 24.4 ± 0.9 J mol−1 K−1 for Ca-Mmt. This compares well with the Dulong–Petit law Cv = 3Nsk, where Ns is the number of atoms in the dry mineral, corresponding to 3 vibrations per atom, that is cv = 3R = 24.9 J mol−1 K−1. The fact that the Dulong–Petit law is recovered by the classical estimate shows that anharmonicity is negligible for the dry mineral, and the energy is mostly vibrational. Therefore, the semi-classical approach is valid for the dry mineral and can be used to evaluate whether some high-frequency vibrations should be excluded from the heat capacity estimate. The semi-classical approach applied to the dry clay yields an estimated specific heat capacity of cv = 763 ± 13 J kg−1 K−1 = 13.8 ± 0.2 J mol−1 K−1 for Na-Mmt and cv = 812 ± 2 J kg−1 K−1 = 14.7 ± 0.1 J mol−1 K−1 for Ca-Mmt (or, when the counterions are not accounted for cv = 758 ± 10 J kg−1 K−1 = 13.6 ± 0.2 J mol−1 K−1 for Na-Mmt and cv = 820 ± 1 J kg−1 K−1 = 14.6 ± 0.1 J mol−1 K−1 for Ca-Mmt), which is significantly lower than the estimation with the classical approach. Therefore a significant fraction of the vibrational modes are inactive. Fig. 5 shows the vibrational density of states (VDOS) for dry Na- and Ca-Mmt and the contribution per atom type. According to the semi-classical formula (eqn (5)), the vibrational modes with high frequencies compared to the thermal agitation energy (i.e. ħω compared to kT) do not contribute to the heat capacity. At ambient temperature, vibrations with ω larger than a hundred of THz do not contribute significantly to the heat capacity. This is the case of a significant fraction of modes in the dry clay, in particular the hydroxyl groups (Hh with ω ≈ 700 THz). The temperature associated with this energy level (so that ħω ≈ kT) exceeds 5000 K. Accordingly, a significant part of the difference between the Dulong–Petit prediction and the semi-classical estimate for the mineral can be attributed to the vibration of the hydroxyl groups. Interestingly, the counter-ion (Na or Ca) has little impact on the heat capacity and both are involved in low frequency vibrations. | ||
| Fig. 5 VDOS of dry mineral Na-Mmt (left) and Ca-Mmt (right): (A) and (B) total VDOS of the dry mineral; (C) and (D) VDOS per species. | ||
Since the difference between Cp and Cv is minor for solids, we can directly compare the experimental data with the Cv obtained from simulations. Most of the experimental studies on dehydrated swelling clays report a specific heat capacity of around 800 J kg−1 K−1 for the dry mineral: cp = 741–873 J kg−1 K−1 for Na-, Ca- and K-bentonites,57cp = 811 and 779 J kg−1 K−1 for Na- and Ca-montmorillonite, respectively,15 and 837 J kg−1 K−1 for bentonites as reported by Siebel et al. (as cited in ref. 2, this study also reports other authors obtaining almost twice the values above: cp = 1438 and 1675 J kg−1 K−1 for dry bentonites computed from the extrapolation of the results of Charm et al. and Dieckerson et al., respectively). Most available experimental results, in particular recent ones, are consistent with the molecular simulation estimates based on the semi-classical approach. Accordingly, the appropriate methodology for molecular simulation estimates is the semi-classical approach.
3.3 Undrained heat capacity of hydrated clay
The discussion of the last two sections leads to the conclusion that the good methodology to estimate the heat capacity of hydrated clays should be a mix of (i) the full classical approach combined with a rigid water model for the inter-layer fluid, and (ii) a semi-classical approach for the mineral. Note that, in this hybrid approach, the inter-layer fluid includes the water and the counter-ions, because anharmonicity is expected to become important for the counter-ions once they become hydrated. As a result, the counter-ions are excluded from the minerals. How to implement such a hybrid estimation is not so trivial. A possible strategy to obtain the inter-layer contribution is to compute the classical approach for the entire system (Cclassv-tot). Since the classical approach applied to the dry mineral yields Dulong–Petit law (Cclassv-min = 3Nsk), the contribution of the inter-layer is obtained by subtracting this quantity from the total heat classical capacity:| Cclassv-w = Cclassv-tot − 3Nsk | (11) |
Regarding the mineral contribution, one can compute the vibrational density of state for the mineral atoms only, by considering the velocity auto-correlation specifically of those atoms. This yields the semi-classical heat capacity of the mineral (Csemi-classv-min). The total heat capacity then obtained has the sum of the inter-layer and mineral contributions:
| Cv-tot = Cclassv-w + Csemi-classv-min = Cclassv-tot − 3Nsk + Csemi-classv-min | (12) |
In terms of the specific heat capacities Eq. 12 becomes:
 | (13) |
Heat capacities at a constant volume of Na- and Ca-Mmt layers in undrained conditions as a function of the inter-layer distance at 300 K are shown in Fig. 6(A) and (B). Heat capacities were computed following the hybrid approach detailed above (see the ESI,† for the details of the semi-classical computations). Heat capacities of Na- and Ca-Mmt appear similar. This is in agreement with experimental observations58 in which the heat capacity of clays is reported to be independent of the nature of the cation.
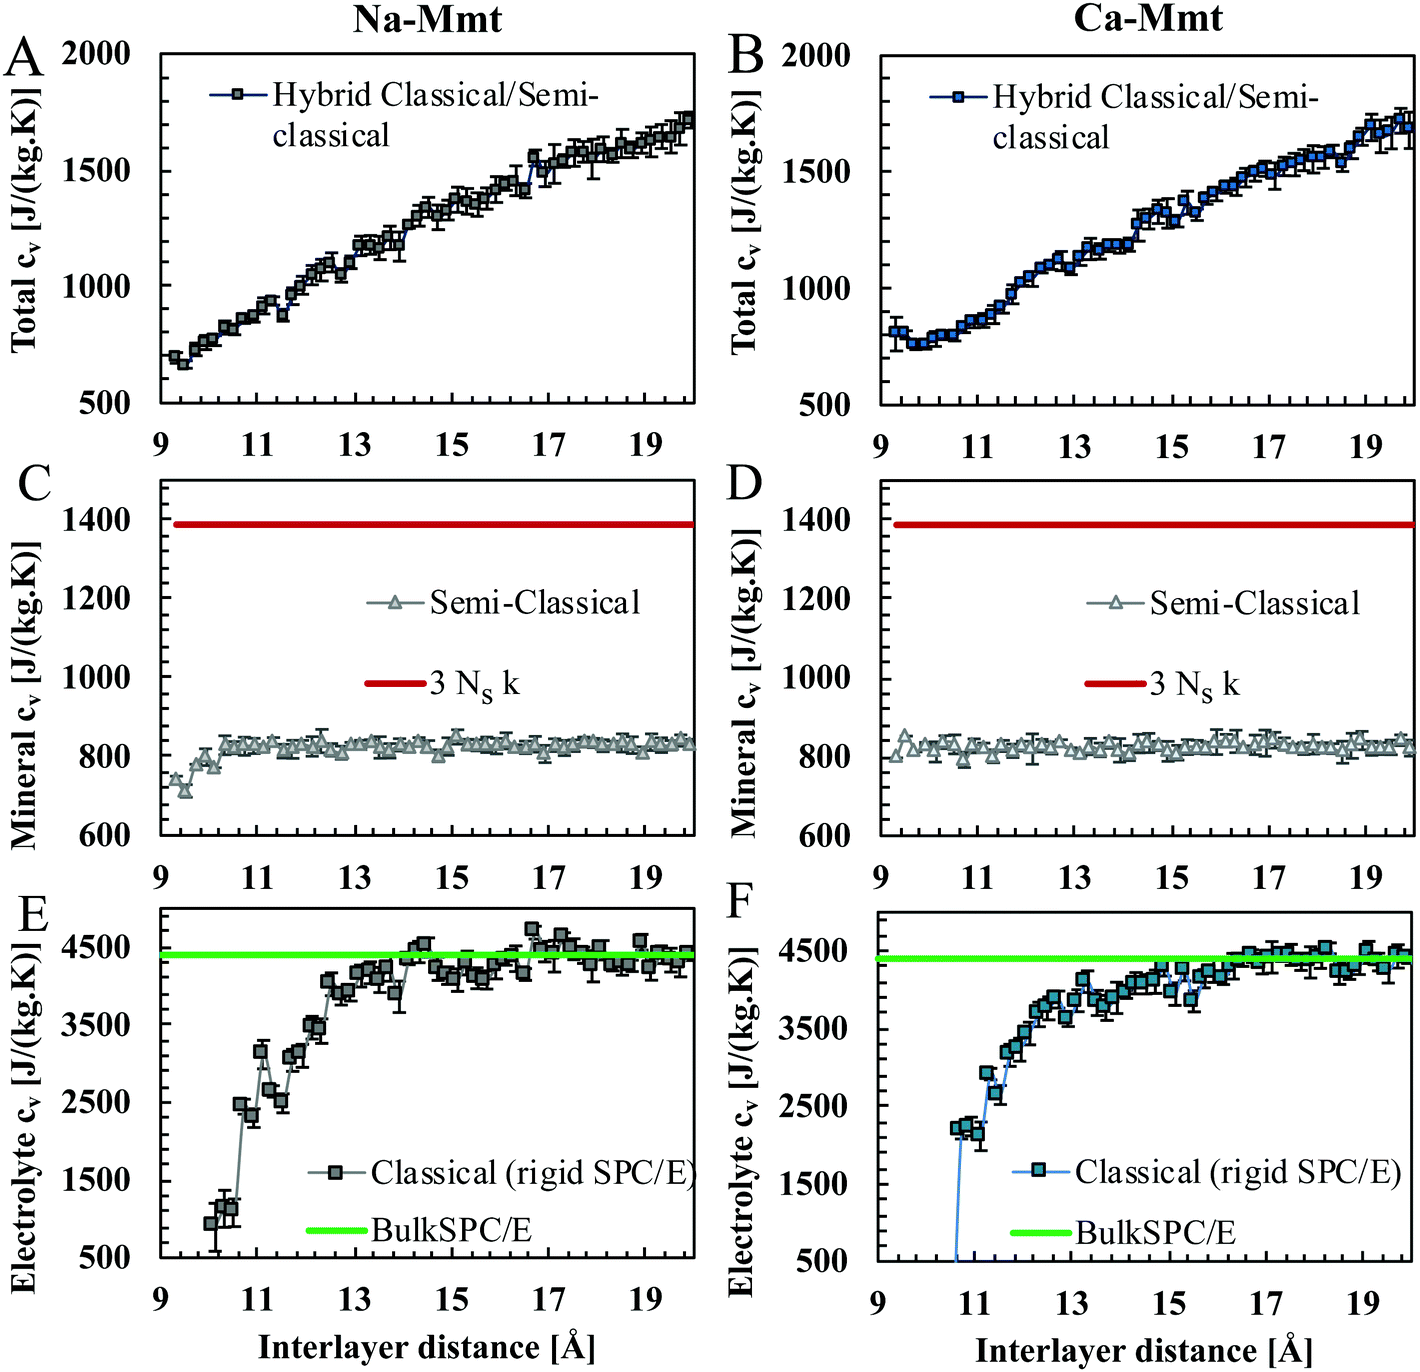 | ||
| Fig. 6 At the top, a specific heat capacity cv of (A) Na- and (B) Ca-Mmt as a function of the inter-layer distance d in undrained conditions at 300 K. At the center, specific heat capacity cv of the solid mineral, obtained by the semi-classical approach, of (C) Na- and (D) Ca-Mmt as a function of d. The red line depicts the classical approach applied to the dry mineral, that is the Dulong–Petit estimate (Cclassv-min = 3Nsk). At the bottom, the specific heat capacity of the confined electrolyte (water and counterions) in (E) Na- and (F) Ca-Mmt as a function of d: computation using the classical approach and rigid SPC/E model. The green line shows the case of bulk liquid (rigid) SPC/E water for comparison. | ||
Fig. 6(C) and (D) show the heat capacity Csemi-classv-min of the mineral (not accounting for counterions) computed using the semi-classical approach for all configurations of Na- and Ca-Mmt studied here. The Csemi-classv-min of Na-Mmt shows a dependence on the inter-layer distance for values below circa 11 Å; whereas Csemi-classv-min remains approximately constant for Ca-Mmt irrespective of the inter-layer distance. The average values of Csemi-classv-min are 821.4 ± 22.4 J kg−1 K−1 for Na-Mmt, and 824.4 ± 11.3 J kg−1 K−1 for Ca-Mmt.
Fig. 6(E) and (F) show the heat capacity Cv of confined electrolyte (water and counter-ions) for both Na- and Ca-Mmt as a function of d. The heat capacity of the confined fluid reaches a plateau for d above 13 Å, corresponding to the heat capacity of bulk water. This suggests that the effects of confinement become negligible for larger inter-layer distances. Due to confinement, fluid molecules order themselves by the surface of the clay. In other microporous materials, adsorbed water was reported to exhibit a different heat capacity compared to bulk water.22,25 Na and Ca cations are considered kosmotropes, i.e. order- or structure-makers with respect to water, in the Hofmeister series.59 In both cases, since the mobility of water molecules is constrained, the expected overall behavior would be a decrease in the heat capacity of the fluid as observed in our results.
Because of the almost linear evolution of the heat capacity with the inter-layer distance, even for small inter-layer distances, the effect of the mixing of hydration states under pressure control (as discussed in Section 2.2) is expected to be minor. A comparison of the heat capacity directly computed from MD with estimates assuming a mix of hydration states in the unstable zones is shown in the ESI† (Fig. S7).
3.4 Heat of adsorption of clays
Fig. 7(A) and (B) show the molar incremental enthalpy ha of water, which rapidly decreases with the inter-layer distance reaching the asymptotic value corresponding to the excess enthalpy of bulk liquid SPC/E water. We computed the enthalpy of bulk SPC/E and obtained −39.6 ± 1.5 kJ mol−1.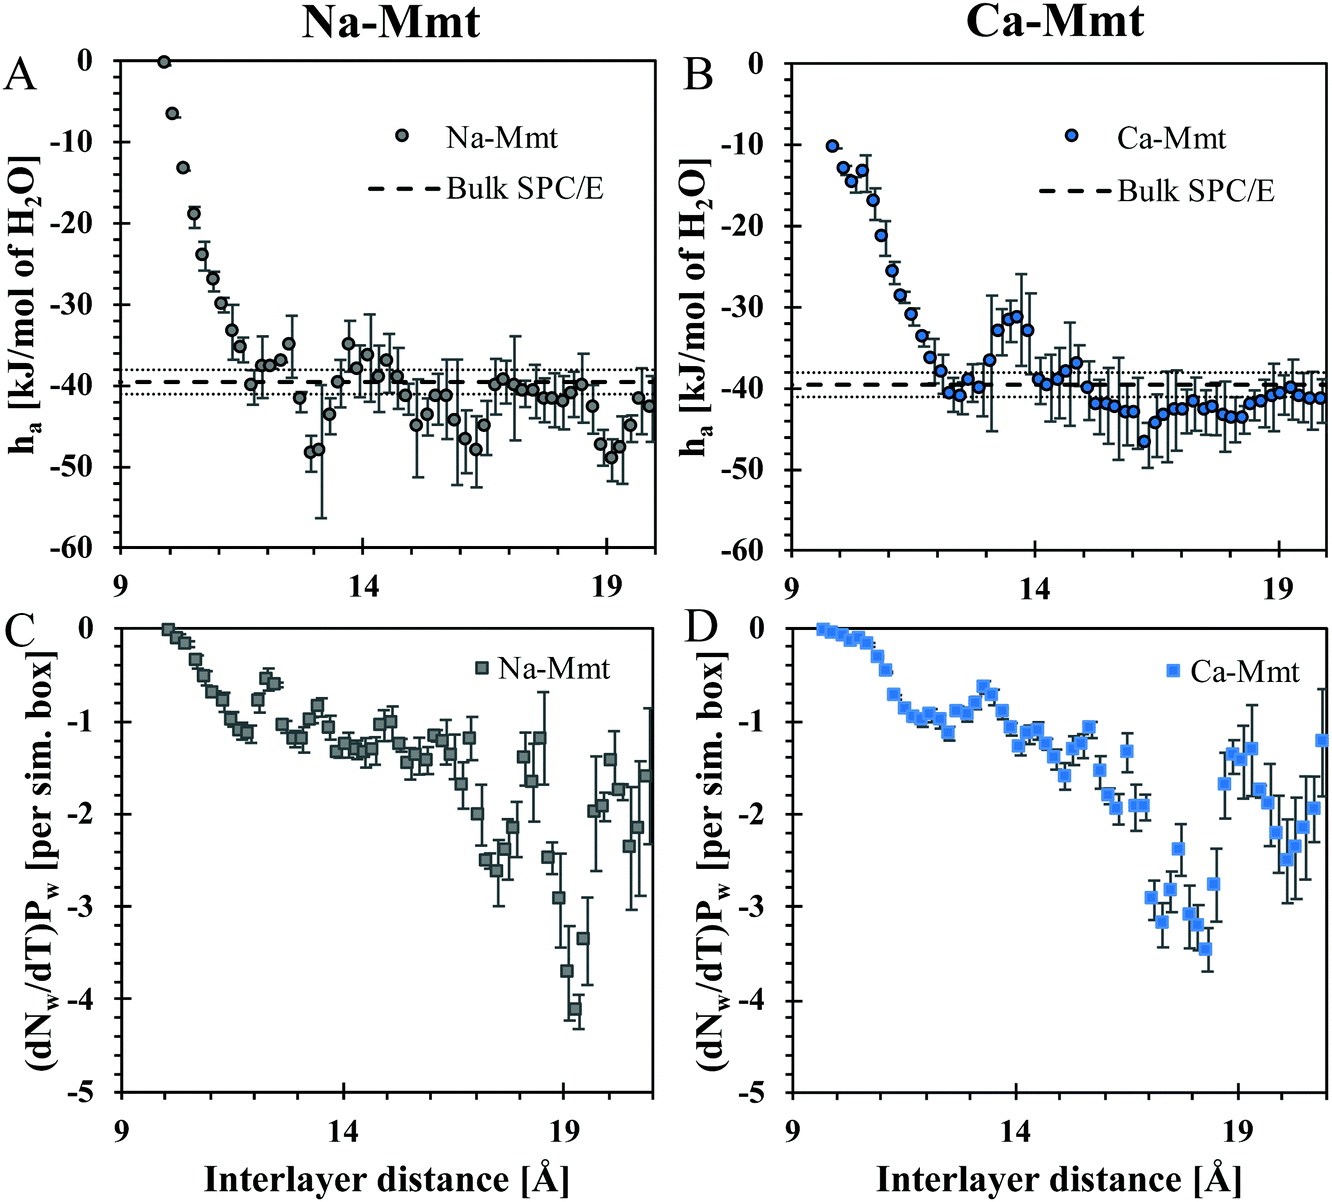 | ||
| Fig. 7 At the top, molar incremental enthalpy ha of water in (A) Na- and (B) Ca-Mmt, obtained with eqn (9) from GCMC simulations, as a function of the inter-layer distance. For comparison, we display the enthalpy of bulk liquid SPC/E water computed in this work (−39.6± 1.5 kJ mol−1, the average values are represented by the dashed line and the variability by the dotted line). At the bottom, the partial derivative of the number of water molecules Nw with respect to the temperature T under a fixed water pressure Pw for both (C) Na- and (D) Ca-Mmt. The error bars are computed through the formula of propagation of errors presented in ref. 60 for the coefficients of linear regression. In all cases, the results were filtered with the Savitzky–Golay filter. | ||
Keren and Shainberg61 reported differences between the heat of adsorption of water (hbulk − ha) in Na- and Ca-Mmt. With Na-Mmt, the first layer of water adsorbed (1 W state) releases circa 7.5 kJ mol−1, whilst the subsequent layers release about 1.5 kJ mol−1. On the other hand, for Ca-Mmt, the heat released varied roughly from 14 to 1.5 kJ mol−1 upon hydration. In Fig. 7, the heat of adsorption (hbulk − ha) appears positive precisely in the domains of stability of the hydration states (d ∼ 13 Å for the 1 W state, d ∼ 16 Å for 2 W, and d ∼ 19 Å for 3 W). In these stability domains, the magnitude of hbulk − ha is typically between 0 and 10 kJ mol−1, which is consistent with the magnitudes measured by Keren and Shainberg.61 The heat of adsorption for Ca-Mmt does not seem larger than that of Na-Mmt, unlike what is observed by the same authors. But, the accuracy of the molecular simulation results (a few kJ mol−1) is not good enough to provide a truly quantitative comparison. At this level of accuracy, the molecular simulation results are reasonably consistent with experiments.
3.5 Drained heat capacity of clays at constant volume
To compute the drained heat capacity of clays, we also provide estimates of the partial derivative of the number of water molecules Nw with respect to the temperature under a fixed water pressure Pw (Fig. 7(C) and (D)) for both Na- and Ca-Mmt. With these results and the ones in the last section, we can compute the drained heat capacity using eqn (10). In Fig. 8, the drained and undrained specific heat capacities at constant volume cv of Na- and Ca-Mmt are plotted against the water content in terms of the mass of water divided by the total mass. The drained heat capacity is calculated either using the results directly computed from MD (i.e. following the oscillatory profiles in Fig. 1) or assuming a mix of hydration states in the unstable zones (i.e. following the stable path as depicted by the dashed lines representing the convex hull in Fig. 1). As expected, the drained cv is much larger than the undrained cv. The evolution of the drained cv as a function of the water content deviates from the clear linear trend observed for the undrained cv. For both Na- and Ca-Mmt, some differences can be observed between the two estimates of the drained cv, but these remain moderate with respect to the accuracy of the results. A more pronounced difference between both cv is observed for Na-Mmt. The mixing of the hydration state yields higher values, especially for Na-mmt, because mixing the hydration state provides lower estimates of the incremental enthalpy ha.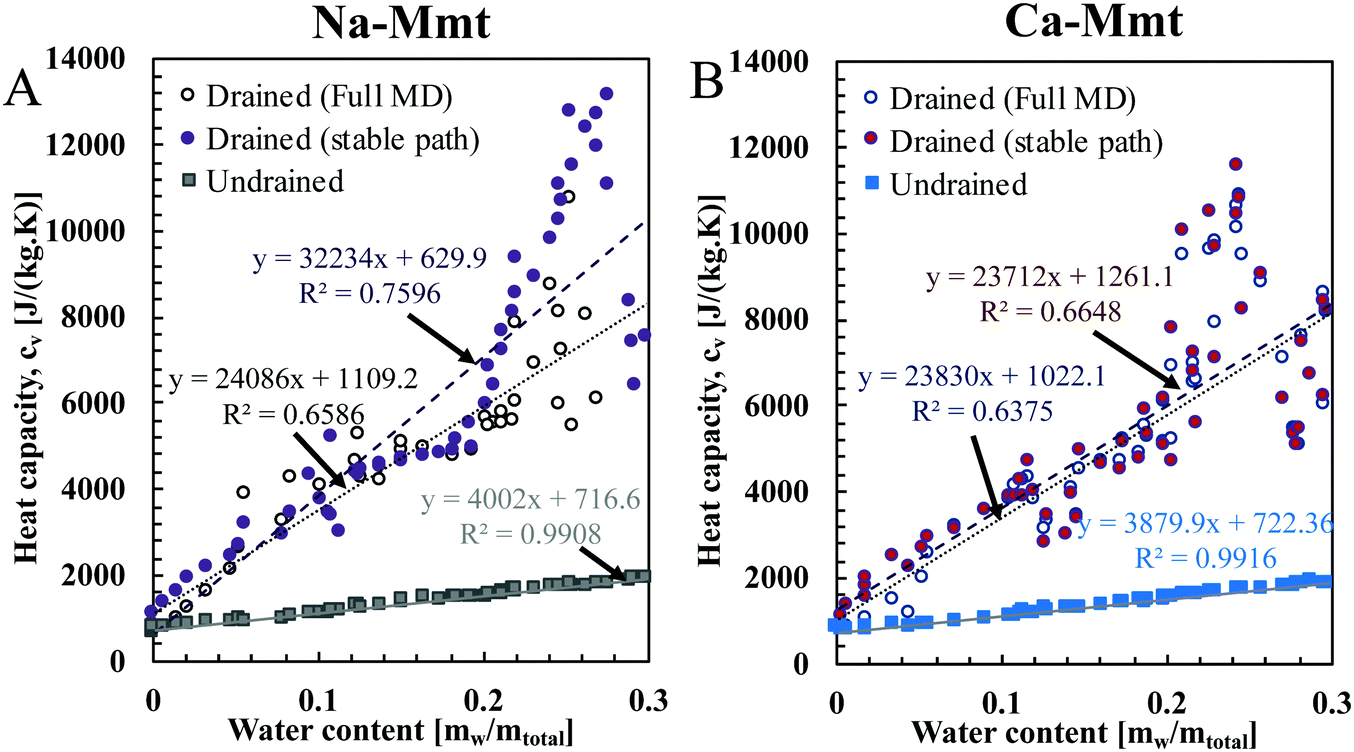 | ||
| Fig. 8 Drained (circles) and undrained (squares) specific heat capacity cv of (A) Na- and (B) Ca-Mmt as a function of water mass content mw/mtotal with mtotal = mw + ms the total mass. The undrained heat capacities at a constant volume are computed using the semi-classical approach for the mineral and the classical approach (associated with rigid SPC/E) for the electrolyte (water and counterion). The drained heat capacity is calculated from the undrained one following eqn (10) using the results directly computed from MD (i.e. following the oscillatory profiles in Fig. 1) and with estimates assuming a mix of hydration states in the unstable zones (i.e. following the stable path as depicted by the dashed lines representing the convex hull in Fig. 1). In the least-squares fitted line y = Ax + B, the coefficient B corresponds to the heat capacities of the mineral, which are similar for Na- and Ca-Mmt (717 and 722 J kg−1 K−1, respectively). | ||
3.6 Drained and undrained heat capacities of clays at constant pressure
In Fig. 9, we compare our results of specific heat capacities at constant pressure cp of Na- and Ca-Mmt with the data found in the literature for a variety of montmorillonites and bentonites.2,3,15,57,58,62,63 The cp values are computed from cv using Mayer's relationship (eqn (4)) using the full stiffness C and thermal expansion a tensors (the cp − cv values computed using the anisotropic case and the isotropic simplification are discussed in the ESI†). The drained cp is computed from the assumption that the isosteric heat of adsorption q′ is similar to qst as well as to
to  in condensed systems. So a similar “drained” contribution term
  as in eqn (10), was added to the undrained cp to obtain the drained cp.
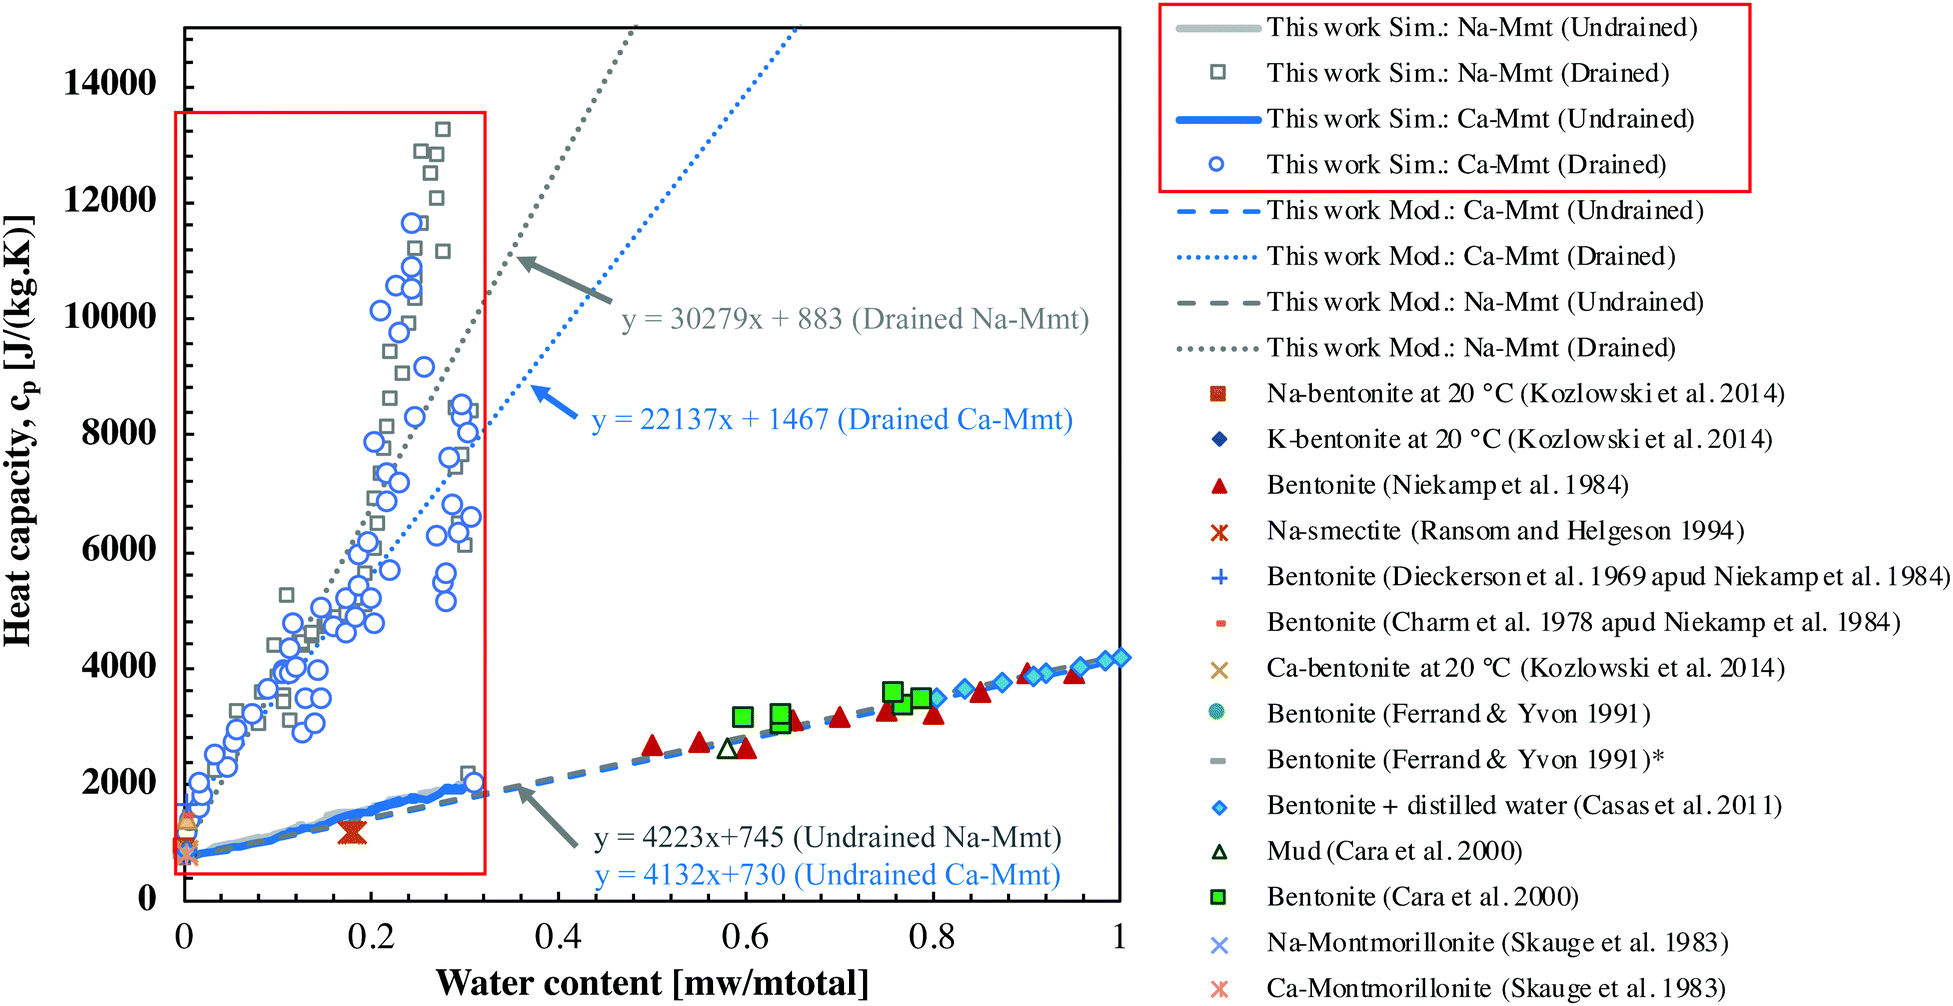 | ||
| Fig. 9 Drained and undrained specific heat capacity at constant pressure cp as a function of water content (mw/mtotal). The results obtained in this article from molecular simulations concerning Na-Mmt and Ca-Mmt are shown inside the red boxes. These results are extrapolated to larger water content following the mixing rule (dashed lines, Ca-Mmt and Na-Mmt results are superposed). Drained cp is computed considering the mixing of hydration states. | ||
Both drained and undrained specific heat capacities at constant pressure cp increase with water content as expected.5,16–19 Our results cover a range of water content little explored by experimental studies. In Ransom et al.58 a variety of Na-smectites with different isomorphic substitutions are tested considering low water contents (about 0.20 g of water per total mass of clays). These authors obtained very similar heat capacities as the ones reported here. This might indicate that the heat capacity of smectites is poorly affected by isomorphic substitutions. As pointed out by the same authors,58 we also observe that the effects of ions are negligible with respect to the heat capacity of hydrated clays.
At inter-layer distances greater than 20 Å, the water behaves almost as free water (capillary domain), so that one can reasonably assume that volume and energy become extensive thermodynamic quantities. Therefore, heat capacity can be extrapolated to larger water contents of interest by a simple rule of mixture. Following a rule of mixture,  where fi and cip are the mass fraction and heat capacity associated with a constituent phase i in the mixture. cv and cp exhibit linear evolution with the water content even at inter-layer distances lower than 20 Å, which suggests that the rule of the mixture remains approximately correct even at very small inter-layer distances. In Fig. 9, we display the extrapolations of our results to the range usually explored in experiments. The extrapolation of the drained heat capacity returns results above the experimental data, whereas the extrapolation of the undrained heat capacity shows a good agreement with the experimental data of various authors. This observation can be understood when observing that the scale of the clay layer does not capture the presence of free water at larger scales. When bound water is drained from the layer scale, it is converted into free water in larger pores, so that it is not actually drained from the material. As we have seen, the incremental molar enthalpy of bound water is quite close to the molar enthalpy of free water, so that converting bound water into free water has only a minor effect on the heat capacity.
4 Conclusions
In this paper, we determined the drained and undrained heat capacities of sodium and calcium saturated montmorillonite at the mineral layer scale from molecular simulations. The inter-layer pores of clays were filled with water by means of grand canonical simulations mimicking geomechanical drained conditions. The water chemical potential imposed falls in the liquid domain, i.e. the material is fully saturated with liquid or adsorbed water. The main findings of this work are:• The heat capacity obtained through a semi-classical approach leads to estimates of the heat capacity of the dehydrated clay systems that are consistent with experimental data. The quantum corrections reduce the estimates of heat capacity to 50–60% of the value obtained in the full classical approach. Regarding water, the proper estimation of the heat capacity requires using the classical approach with a rigid water model (SPC/E here). Flexible SPC/E would lead to an overestimation of the heat capacity of clays by ∼50% because of the high frequencies of internal vibrations. And the semi-classical approach is not applicable to liquid water because anharmonic effects cannot be neglected. An appropriate methodology to estimate the heat capacity of hydrated clay is to combine the classical approach for the electrolyte with a rigid water model and the semi-classical approach for the mineral.
• The computed undrained heat capacity of clays evolves linearly with the water content as expected,5,17–19 and its linear extrapolation to larger water content compares well with the experimental results for smectites, as well as different compositions of bentonites.2,3,15,57,62,63 This suggests that the simple mixing rule valid for free water still applies reasonably in the domain of bound water. It is noteworthy that with the consideration of a specific kind of montmorillonite (with a fixed number and location of isomorphic substitutions), it is possible to reasonably estimate the heat capacity of a large range of smectites and other clay minerals. Also, as in ref. 58, we observe that the effects of ions are negligible with respect to the heat capacity of hydrated clays. In swelling clays the heat capacity of water is reduced by confinement and only slight counterion specificity is observed. In Na- and Ca-Mmt, confined water retrieves its bulk heat capacity for small inter-layer distances (above circa 13 Å).
• At the layer scale, the drained heat capacity is much larger than the undrained one, because it is dominated by the drainage of bound water upon heating. Nevertheless, experimental measurements are consistent with the undrained estimates. A reasonable interpretation is that the inter-layer drained bound water is converted into free water in larger pores, but is not actually drained from the material.
• Multistability and mixing of hydration states are key elements to understand the thermo-mechanical behavior of clays at the layer scale.28,29,55 Under confining pressure control, only some values of heat capacity of clays when plotted against the inter-layer distance are allowed. Due to the almost linear evolution of the heat capacity of clays with the inter-layer distance, these effects of mixing of hydration states have little impact on the undrained heat capacity evolution with the pore size or water content. However, these effects are more significant to understanding the drained heat capacity since the enthalpic contributions under drained conditions are directly linked to the hydration states and associated transitions. Our results show that the drained heat capacity is ion specific.
This work leaves room for a better understanding of factors affecting the thermo-mechanical behavior of clays and other phyllosilicates (e.g. calcium silicate hydrates, chrysotile). Future work can cope with the effects of temperature on the heat capacity, provided that thermal stimulation is an important activity related to the exploration of clay-rich soils and rocks in the energy production industry.
Author contributions
Tulio Honorio: Conceptualization, formal analysis, investigation, methodology, validation, visualization, writing – original draft writing – review and editing. Laurent Brochard: funding acquisition, formal analysis, investigation, methodology, writing – original draft writing – review and editing.Conflicts of interest
There are no conflicts to declare.Acknowledgements
The financial support of the French National Research Agency (ANR) through the project TEAM2ClayDesicc (ANR-14-CE05-0023-01) is gratefully acknowledged.Notes and references
- A. Meunier, Clays, Springer Berlin Heidelberg, 2005, pp. 231–293 Search PubMed.
- A. Niekamp, K. Unklesbay, N. Unklesbay and M. Ellersieck, J. Food Sci., 1984, 49, 28–31 CrossRef.
- L. M. Casas, J. L. Legido, M. Pozo, L. Mourelle, F. Plantier and D. Bessières, Thermochim. Acta, 2011, 524, 68–73 CrossRef CAS.
- M. I. Carretero and M. Pozo, Appl. Clay Sci., 2009, 46, 73–80 CrossRef CAS.
- O. T. Farouki, Thermal Properties of Soils, Defense technical report, 1981 Search PubMed.
- C. Ortiz and M. C. Boyce, Science, 2008, 319, 1053–1054 CrossRef CAS PubMed.
- G. Hantal, L. Brochard, R. J.-M. Pellenq, F.-J. Ulm and B. Coasne, Langmuir, 2017, 43, 11457–11466 CrossRef PubMed.
- H. Le Chatelier, Bulletin de la Société Française de Minéralogie, 1887, 10, 204–207 CrossRef.
- L. Brochard and T. Honório, Int. J. Eng. Sci., 2020, 152, 103296 CrossRef.
- N. Watanabe, W. Wang, C. I. McDermott, T. Taniguchi and O. Kolditz, Comput. Mech., 2010, 45, 263 CrossRef.
- L. Laloui, M. Nuth and L. Vulliet, Int. J. Numer. Anal. Methods Geomech., 2006, 30, 763–781 CrossRef CAS.
- J. Rutqvist, Developments in Clay Science, Elsevier, 2015, vol. 6, pp. 329–355 Search PubMed.
- L. Brochard and T. Honório, Acta Geotechnica, 2021, 16, 2713–2727 CrossRef.
- M. Briffaut, F. Benboudjema, J.-M. Torrenti and G. Nahas, Eur. J. Environ. Civil Eng., 2012, 16, 589–605 CrossRef.
- A. Skauge, N. Fuller and L. G. Hepler, Thermochim. Acta, 1983, 61, 139–145 CrossRef CAS.
- B. Garitte, H. Shao, X. R. Wang, T. S. Nguyen, Z. Li, J. Rutqvist, J. Birkholzer, W. Q. Wang, O. Kolditz, P. Z. Pan, X. T. Feng, C. Lee, B. J. Graupner, K. Maekawa, C. Manepally, B. Dasgupta, S. Stothoff, G. Ofoegbu, R. Fedors and J. D. Barnichon, Environ. Earth Sci., 2017, 76, 64 CrossRef.
- J. L. Legido, C. Medina, M. Lourdes Mourelle, M. I. Carretero and M. Pozo, Appl. Clay Sci., 2007, 36, 148–160 CrossRef CAS.
- J. D. Oster and P. F. Low, Soil Sci. Soc. Am. J., 1964, 28, 605–609 CrossRef.
- P. F. Low, P. Hoekstra and D. M. Anderson, Water Resour. Res., 1968, 4, 541–544 CrossRef CAS.
- H. Gailhanou, P. Blanc, J. Rogez, G. Mikaelian, H. Kawaji, J. Olives, M. Amouric, R. Denoyel, S. Bourrelly, V. Montouillout, P. Vieillard, C. I. Fialips, N. Michau and E. C. Gaucher, Geochim. Cosmochim. Acta, 2012, 89, 279–301 CrossRef CAS.
- C. Tournassat, C. I. Steefel, I. C. Bourg and F. Bergaya, Natural and Engineered Clay Barriers, Elsevier, 2015 Search PubMed.
- M. J. A. Qomi, F.-J. Ulm and R. J.-M. Pellenq, Phys. Rev. Appl., 2015, 3, 064010 CrossRef.
- T. Honorio, F. Masara and F. Benboudjema, Cement, 2021, 100015 CrossRef.
- F. M. Etzler and P. J. White, J. Colloid Interface Sci., 1987, 120, 94–99 CrossRef CAS.
- F. M. Etzler and J. J. Conners, Langmuir, 1991, 7, 2293–2297 CrossRef CAS.
- F. M. Etzler and J. J. Conners, Langmuir, 1990, 6, 1250–1253 CrossRef CAS.
- O. Coussy, Mechanics and Physics of Porous Solids, John Wiley & Sons, Ltd, Chichester, UK, 2010 Search PubMed.
- L. Brochard, T. Honorio, M. Vandamme, M. Bornert and M. Peigney, Acta Geotechnica, 2017, 1–19 Search PubMed.
- T. Honorio, L. Brochard and M. Vandamme, Langmuir, 2017, 33, 12766–12776 CrossRef CAS PubMed.
- M. J. Abdolhosseini Qomi, L. Brochard, T. Honorio, I. Maruyama and M. Vandamme, Cem. Concr. Res., 2021, 148, 106536 CrossRef CAS.
- E. S. Boek, P. V. Coveney and N. T. Skipper, Langmuir, 1995, 11, 4629–4631 CrossRef CAS.
- M. Holmboe and I. C. Bourg, J. Phys. Chem. C, 2014, 118, 1001–1013 CrossRef CAS.
- S. L. Teich-McGoldrick, J. A. Greathouse, C. F. Jové-Colón and R. T. Cygan, J. Phys. Chem. C, 2015, 119, 20880–20891 CrossRef CAS.
- M. de Lourdes Chávez, L. de Pablo and J. J. de Pablo, Langmuir, 2004, 20, 10764–10770 CrossRef PubMed.
- R. M. Shroll and D. E. Smith, J. Chem. Phys., 1999, 111, 9025–9033 CrossRef CAS.
- T. Underwood, V. Erastova and H. C. Greenwell, Clays Clay Miner., 2016, 64, 472–487 CrossRef CAS.
- M. P. Allen and D. J. Tildesley, Computer Simulation of Liquids, Oxford University Press, New York, 1989 Search PubMed.
- D. C. Wallace, Thermodynamics of Crystals, Courier Corporation, 1998 Search PubMed.
- B. Winkler and M. T. Dove, Phys. Chem. Miner., 1992, 18, 407–415 CrossRef CAS.
- A. R. Oganov, J. P. Brodholt and G. David Price, Phys. Earth Planet. Inter., 2000, 122, 277–288 CrossRef CAS.
- T. Honorio, Langmuir, 2019, 35, 3907–3916 CrossRef CAS PubMed.
- R. D. James, J. Mech. Phys. Solids, 1986, 34, 359–394 CrossRef.
- K. Bhattacharya, Theory of martensitic microstructure and the shape-memory effect, 2003 Search PubMed.
- A. Roth, Savitzky–Golay Smoothing Filters, 2000, http://library.wolfram.com/infocenter/MathSource/789/.
- D. Nicholson, Computer simulation and the statistical mechanics of adsorption, Academic Press, 1982.
- B. Carrier, PhD Thesis, Université Paris-Est, 2013.
- B. Carrier, M. Vandamme, R. J.-M. Pellenq and H. Van Damme, J. Phys. Chem. C, 2014, 118, 8933–8943 CrossRef CAS.
- R. T. Cygan, J.-J. Liang and A. G. Kalinichev, J. Phys. Chem. B, 2004, 108, 1255–1266 CrossRef CAS.
- H. J. C. Berendsen, J. R. Grigera and T. P. Straatsma, J. Phys. Chem., 1987, 91, 6269–6271 CrossRef CAS.
- R. T. Cygan, J. A. Greathouse and A. G. Kalinichev, J. Phys. Chem. C, 2021, 125, 17573–17589 CrossRef CAS.
- Y. Mao and Y. Zhang, Chem. Phys. Lett., 2012, 542, 37–41 CrossRef CAS.
- S. Plimpton, J. Comput. Phys., 1995, 117, 1–19 CrossRef CAS.
- D. E. Smith, Langmuir, 1998, 14, 5959–5967 CrossRef CAS.
- T. J. Tambach, P. G. Bolhuis, E. J. M. Hensen and B. Smit, Langmuir, 2006, 22, 1223–1234 CrossRef CAS PubMed.
- L. Brochard, J. Phys. Chem. C, 2021, 125, 15527–15543 CrossRef CAS.
- M. Fugel and V. C. Weiss, J. Chem. Phys., 2017, 146, 064505 CrossRef PubMed.
- T. Kozlowski, A. Rusin and E. Nartowska, Appl. Clay Sci., 2014, 101, 82–89 CrossRef CAS.
- B. Ransom and H. C. Helgeson, Geochim. Cosmochim. Acta, 1994, 58, 4537–4547 CrossRef CAS.
- D. J. Tobias and J. C. Hemminger, Science, 2008, 319, 1197–1198 CrossRef CAS PubMed.
- J. Taylor, Published by University Science Books, 648 Broadway, Suite 902, New York, NY 10012, 1997 Search PubMed.
- R. Keren, Clays Clay Miner., 1975, 23, 193–200 CrossRef CAS.
- T. Ferrand and J. Yvon, Appl. Clay Sci., 1991, 6, 21–38 CrossRef.
- S. Cara, G. Carcangiu, G. Padalino, M. Palomba and M. Tamanini, Appl. Clay Sci., 2000, 16, 125–132 CrossRef CAS.
Footnote |
| † Electronic supplementary information (ESI) available:Derivation of the vibrational density of states and thermoelastic properties of Na- and Ca-montmorillonite. See DOI: https://doi.org/10.1039/d2cp01419j |
| This journal is © the Owner Societies 2022 |