 Open Access Article
Creative Commons Attribution 3.0 Unported Licence
Decarbonisation of calcium carbonate in sodium hydroxide solutions under ambient conditions: effect of residence time and mixing rates†
Marco
Simoni
 *a,
Theodore
Hanein
 *a,
Chun Long
Woo
a,
Mark
Tyrer
 b,
Magnus
Nyberg
c,
Juan-Carlos
Martinez
c,
Nestor I.
Quintero-Mora
d,
John L.
Provis
 a and
Hajime
Kinoshita
*a
aDepartment of Materials Science & Engineering, University of Sheffield, S1 3JD, Sheffield, UK. E-mail: t.hanein@sheffield.ac.uk; h.kinoshita@sheffield.ac.uk; marco.simoni.w@gmail.com
bCollegium Basilea, Institute of Advanced Study, Hochstrasse 51, 4053 Basel, Switzerland
cCEMEX Asia Research AG, Römerstrasse 13, 2555 Brügg, Switzerland
dCEMEX Operaciones Mexico, Constitution 444 pte. Monterrey, Mexico
First published on 23rd June 2022
Abstract
The decarbonisation of CaCO3 is essential for the production of lime (Ca(OH)2 and CaO), which is a commodity required in several large industries and the main precursor for cement production. CaCO3 is usually decarbonised at high temperatures, generating gaseous CO2 which will require post-process capture to minimise its release into the environment. We have developed a new process that can decarbonise CaCO3 under ambient conditions, while sequestering the CO2 as Na2CO3·H2O or Na2CO3 in the same stage. Here, the effects of increasing stirring rates and residence times on reaction efficiency of the key reaction occurring between CaCO3 and NaOH solution are studied. It is shown that the reaction is enhanced at lower stirring rates and longer residence times up to 300 seconds of contact between the reactants. The mass balance performed for Ca and CO2 revealed that up to the 95% of the process CO2 embodied in CaCO3 was sequestered, with maximum capture rate assessed at nn moles CO2 captured per second of reaction progress. A deeper insight into the precipitation of Na2CO3·H2O or Na2CO3 under different reaction conditions was gained, and SEM-EDX analysis enabled the observation of the reaction front by detection of Na migrating towards inner regions of partially-reacted limestone chalk particles.
1. Introduction
Lime (CaO) and slaked lime (Ca(OH)2) are essential components for a wide range of industries and applications worldwide,1 such as steel manufacturing, construction, water treatment, mineral processing, and others. Given its very low toxicity and mild basic properties,2,3 Ca(OH)2 is also widely used in the food industry.4 The production of Ca(OH)2 is currently performed through a two-step process, involving (1) the calcination of limestone to give lime, CaO (eqn (1) and (2))5 its subsequent hydration “slaking” (eqn (2)).1,6| CaCO3 → CaO + CO2 | (1) |
| CaO + H2O → Ca(OH)2 | (2) |
In the slaked lime manufacturing process, the calcination of limestone represents the most energy-demanding and CO2 emitting step; it is conducted in several types of firing kilns,1 and it leads to the release of the process CO2 from the decarbonisation stoichiometry (eqn (1)), and fuel-derived CO2 by combustion of fossil fuels used to heat the kiln to provide the firing temperature required (between 800 and 1200 °C).7,8 The following step 2 (eqn (2)) mainly requires electrical energy input, to handle and mix the reactants and products of this exothermic hydration process.1 Therefore, the efficiency linked to the energy usage within a given kiln plays a crucial role in defining the overall sustainability of the process; multiple factors may influence the energy input and the resulting efficiency for a given kiln type, such as the quality and the particle size of the limestone feed, the degree of conversion desired, and the moisture.9 About 1.0–1.8 kg of CO2 are emitted per kg of lime produced,1 and given the worldwide annual production (over 70 Mt in 202010![[thin space (1/6-em)]](https://www.rsc.org/images/entities/char_2009.gif) ), the lime industry is a significant emitter of greenhouse gases (GHG) which are the main contributors to global warming.
), the lime industry is a significant emitter of greenhouse gases (GHG) which are the main contributors to global warming.
Intense efforts and significant investment from this industry are needed to mitigate the emissions of CO2 to the atmosphere. Considering the calcination of limestone in a broader sense, such a process is also the basis of the Portland cement production industry; over 6 Gt of limestone are annually processed to satisfy the cement market (over 4 Gt in 201811), resulting in about 3–4 Gt of CO2 emitted from chemical and fuel contributions combined (≈4% of the total anthropogenic emissions12,13). Given the size of both the lime and cement market worldwide, the validation of a more sustainable limestone decarbonisation route would be a significant contribution to meet the goal (overall 86% CO2 emissions cut by 2050) set and agreed by the United Nations.8,14,15
Our previous work demonstrated the technical feasibility of an alternative route to decarbonisation of limestone, achieved at ambient conditions without heating.16 The process is based on the reaction between CaCO3 particles and highly concentrated NaOH solutions to produce Ca(OH)2 and Na2CO3·H2O or Na2CO3, allowing for the decarbonisation directly from the solid limestone and simultaneous sequestration of CO2 into stable mineral forms (eqn (3)).
| CaCO3 + 2NaOH + xH2O → Ca(OH)2 + Na2CO3·xH2O (x = 0, 1) | (3) |
It is well known that the overall reaction rate in heterogeneous systems would depend on the reaction rate of the involved chemical reactions and the thickness of the product surface layer,17 according to the un-reacted core model.18,19 Both the residence time and the mixing rate might affect the reaction kinetic, since a longer contact between the reactants and a higher turbulence would generally enhance the efficacy of a reaction. It is also true that a greater centrifugal force on the solid particles compared with the liquid phase may also affect the overall reactivity of the components,20 due to a separation of the phases resulting in a lower contact surface.21–23 Given that, this work aims to clarify the dependence of the system studied on the stirring rate and residence time, in order to optimise the process with a view toward its industrialisation. It must be mentioned that such a study only represents a preliminary step towards the scale-up of the process, which needs to take into account evident technical difficulties before considering industrial applicability. These issues are mainly linked to the handling of highly-corrosive NaOH solutions, the management of chlorine gas deriving from the enhanced production of the required chemical NaOH, and the adjustment of the processing conditions in accordance with the scaling-up. Although, the liquid stream from the solid chlor-alkali process is a ≈32 wt% NaOH solution (approximately 12 M),24 comparable with the concentrations used here. Moreover, the excess of chlorine gas may be water scrubbed, and the resulting solutions may be used for the production of Cl-containing cements25 for non-reinforced concrete. Considering that over the 60% of the concrete worldwide is unreinforced,26 significant proportions of the toxic chlorine gas from the chlor-alkali process might be immobilised upon cementation. Despite the title study aims to investigate the effect of crucial processing conditions, the authors are fully aware that the presented outcomes might fail in representing the system behaviour at larger scale. Although, this preliminary investigation offers that fundamental basic starting point for a more detailed investigation targeting the proper scale-up of the process.
The present study also aims to clarify the equilibrium between the species Na2CO3·H2O and Na2CO3 at the processing conditions considered, since the co-production of Ca(OH)2 and Na2CO3·H2O implies the need for a following separation of the products, crucial for their individual sale or use, not discussed here. For instance, high Na contents (above 2 wt%) would prevent the use of Ca(OH)2 for cement production,27,28 limiting the applicability of this novel technology. Since the solubility of the different species here involved would likely play a key-role for their effective separation, the present study also assessed the precipitation of the by-product Na2CO3·H2O or Na2CO3 (x = 0, 1 in eqn (3), respectively) depending on the reaction conditions used. Finally, solid particles of an industrial grade chalk are reacted to quantify the reaction progress by visual tracking of the products surface layer via SEM-EDX analyses.
2. Materials and methods
2.1. Materials
The materials used in this work included commercial grade chemicals: Sigma-Aldrich CaCO3 (≥99%) and Honeywell Fluka NaOH (≥97%). Additionally, the same industrial grade chalk used in a previous study were also considered as a source of CaCO3;16 the oxide elemental composition is reported in Table 1 below. A dry-state Particle Size Distribution (PSD) analysis was chosen for targeted samples, in order to avoid the dissolution of the solids at any extent. About 10 g of material was used for the analysis, and the value reported for each sample is an average of 10 consecutive measurements.| CaO | SiO2 | Al2O3 | Fe2O3 | K2O | MgO | Others | LOI% | |
|---|---|---|---|---|---|---|---|---|
| Wt% | 44.0 | 21.0 | 3.0 | 1.1 | 0.6 | 0.3 | <2.0% | 29.5 |
2.2. Experimental procedure
Given the high conversion extent observed in a previous study15 for the ternary system of 27.1 wt% CaCO3, 32.4 wt% NaOH, and 40.5 wt% H2O, this starting composition was considered in the following experiments to assess the effect of varying selected parameters on the reaction efficiency. First, NaOH was mixed with distilled water, resulting in a temperature increase of the system to ∼80 °C due to the exothermic dissolution reaction. The solutions were then heated to 90 °C in a PTFE beaker with a volume of 6.5 cm3, to achieve an identical initial temperature for all experimental runs; following this, 10 g of CaCO3 were introduced and no further temperature control was applied as the reaction was allowed to progress under laboratory ambient conditions (T ≈ 20 °C). To ensure mixing, a PTFE centrifugal stirrer shaft (flat propeller, diameter 4 cm) was used with a Heidolph RZR 2020 overhead mixer, rotating in the bottom centre of the PTFE beaker. The use of PTFE was essential to avoid corrosion that may be caused by the hyper-alkaline NaOH solutions used. To study the effect of the mixing rate on the reaction efficiency, a series of experiments were carried out at each of 40, 300, 500, 800 and 2000 rpm for durations of 30, 300, 720, and 1200 s. The conditions used for each sample are reported in Appendix. After the desired duration of reaction, 50 mL of methanol was added and the whole paste was stirred for 300 s to wash by dissolving any unreacted NaOH (NaOH solubility in methanol = 238 g L−129![[thin space (1/6-em)]](https://www.rsc.org/images/entities/char_2009.gif) ). The very low solubility of Ca(OH)2,3 CaCO3,30 Na2CO3·H2O,31 and Na2CO331 in methanol allows these solids to remain in the system without being lost during the washing.
). The very low solubility of Ca(OH)2,3 CaCO3,30 Na2CO3·H2O,31 and Na2CO331 in methanol allows these solids to remain in the system without being lost during the washing.
The reagent grade chalk was reacted at slightly milder mixing regime, to better preserve the condition of the products. The reaction was performed in a plastic vessel with a magnetic stirring of 300 rpm for a total residence time of 300 s. 8.4 g of NaOH were added into 12.3 g of H2O to form 17 M NaOH solution, and the solution was cooled down to room temperature before adding 2.5 g of chalk, making the initial system of H2O (54.7 wt%), NaOH (37.2 wt%) and chalk (8.1 wt%). A significantly high water-to-solid ratio was chosen to ensure a satisfactory mixing of all the reactants, with the less energetic stirring; anyway, the chosen composition has been tested on reagent grade CaCO3 already, and it led to an almost total conversion to products.16 After five minutes of reaction, 32 mL of methanol was added to the resulting paste and stirred for five minutes in order to remove any remaining NaOH.
Following their collection by vacuum filtration, all the solid products here discussed were dried in an 80 °C oven for 2 hours; following, the samples selected for TG and XRD analyses were finely ground and sieved below 63 μm. For the SEM analysis, selected samples were ground or not, to observe the targeted parameters discussed below.
2.3. Characterisation techniques
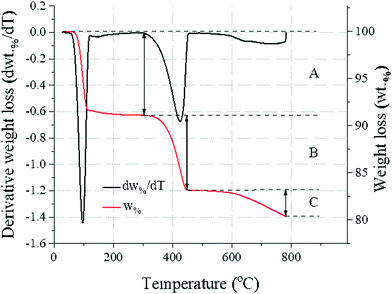
![[thin space (1/6-em)]](https://www.rsc.org/images/entities/char_2009.gif) ) and CaCO3 (560–800 °C33
) and CaCO3 (560–800 °C33![[thin space (1/6-em)]](https://www.rsc.org/images/entities/char_2009.gif) ), as reported in Fig. 1 and eqn (4).
), as reported in Fig. 1 and eqn (4).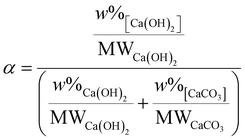 | (4) |
![[thin space (1/6-em)]](https://www.rsc.org/images/entities/char_2009.gif) (Fig. 1). The measurement was repeated 6 times for each sample to estimate the measurement error (±0.16 wt%, ±0.10 wt% and ±0.16 wt% for Na2CO3·H2O, Ca(OH)2 and CaCO3, respectively).
(Fig. 1). The measurement was repeated 6 times for each sample to estimate the measurement error (±0.16 wt%, ±0.10 wt% and ±0.16 wt% for Na2CO3·H2O, Ca(OH)2 and CaCO3, respectively).
3. Results and discussion
3.1. Reaction products
The system under consideration shows a good capability to convert CaCO3 to Ca(OH)2, Na2CO3·H2O, and Na2CO3;16 here, the series of samples mixed at 300 rpm for all the residence times considered was taken as a representative baseline. The XRD analysis (Fig. 2) showed the presence of only CaCO3, Ca(OH)2, Na2CO3·H2O and Na2CO3, with respective main reflection angles 2θ of 29.5°, 18.1°, 17.1°, and 30.2°, within the solid products.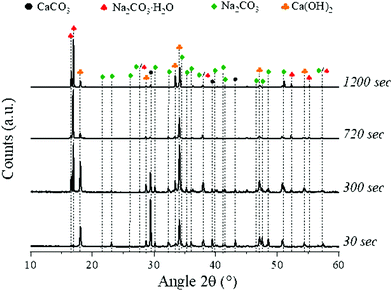 | ||
| Fig. 2 XRD patterns of the samples obtained at 300 rpm for all the residence times investigated, highlighting the peaks of all the species detected. | ||
Specifically, the intensity of the peaks linked to Ca(OH)2 and Na2CO3·H2O was increasing at longer residence times, while CaCO3 content appeared to decrease; in addition, the signals linked to Na2CO3 could be detected at residence times of up to 300 seconds, while at longer ones those were not observable. The relative proportions of Na2CO3·H2O and Na2CO3 will be discussed in detail in Section 3.3.
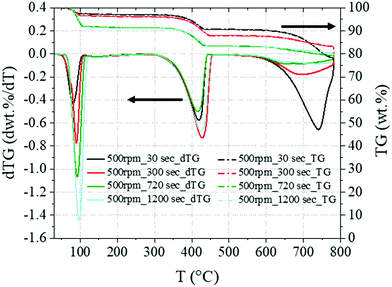
In accordance with the XRD outcomes, the TG/dTG analysis of the same baseline samples (Fig. 3) showed increasing weight losses in the temperature intervals 50–130 °C and 310–470 °C, referring to Na2CO3·H2O34 and Ca(OH)2,32 respectively, and a decreasing CaCO3 content (560–800 °C33![[thin space (1/6-em)]](https://www.rsc.org/images/entities/char_2009.gif) ) at longer residence times.
) at longer residence times.
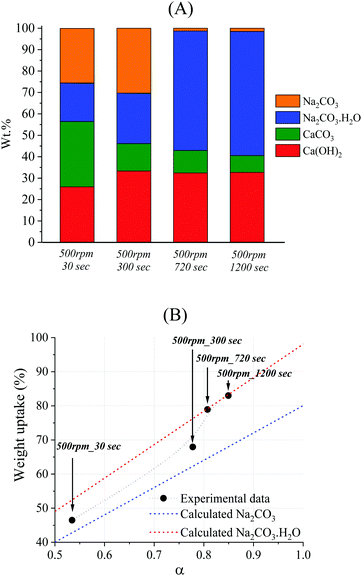
The quantification of phases from the TG analysis (Fig. 3) is reported in Fig. 4A. The amount of Na2CO3 could not be directly quantified, since its thermal decomposition would occur above 851 °C36![[thin space (1/6-em)]](https://www.rsc.org/images/entities/char_2009.gif) and the analysis was conducted up to 800 °C. However, the quantification of Na2CO3 could be performed indirectly by taking into account the difference between the total (100%) and the sum of the other phases (CaCO3, Ca(OH)2, and Na2CO3·H2O). This approach could be considered reliable, since the XRD analysis confirmed the presence of the only phases CaCO3, Ca(OH)2, Na2CO3·H2O, and Na2CO3 in the solid system (Fig. 2). The XRD analysis also suggested the absence of any amorphous phase since no raised baseline was detected in any pattern (Fig. 2). In addition, the weight uptake resulting from the incorporation of Na+ and OH− ions from the solution may be used as a further confirmation of the phases detected by XRD and their quantification by TG. This value was calculated for each system by considering the ratio between the final measured weight of the dried products and the initial weight of CaCO3. The weight uptake can represent the extent of reaction, assuming that any residual NaOH is removed from the system after washing. Such an assumption appeared to be confirmed by the absence of the NaOH characteristic peak at 2θ = 16°
and the analysis was conducted up to 800 °C. However, the quantification of Na2CO3 could be performed indirectly by taking into account the difference between the total (100%) and the sum of the other phases (CaCO3, Ca(OH)2, and Na2CO3·H2O). This approach could be considered reliable, since the XRD analysis confirmed the presence of the only phases CaCO3, Ca(OH)2, Na2CO3·H2O, and Na2CO3 in the solid system (Fig. 2). The XRD analysis also suggested the absence of any amorphous phase since no raised baseline was detected in any pattern (Fig. 2). In addition, the weight uptake resulting from the incorporation of Na+ and OH− ions from the solution may be used as a further confirmation of the phases detected by XRD and their quantification by TG. This value was calculated for each system by considering the ratio between the final measured weight of the dried products and the initial weight of CaCO3. The weight uptake can represent the extent of reaction, assuming that any residual NaOH is removed from the system after washing. Such an assumption appeared to be confirmed by the absence of the NaOH characteristic peak at 2θ = 16°![[thin space (1/6-em)]](https://www.rsc.org/images/entities/char_2009.gif) 37 in the XRD analysis reported in Fig. 2. Fig. 4B shows the experimental weights registered for the representative series of samples, together with the theoretical lines that would result from the quantitative precipitation of Na2CO3·H2O or Na2CO3.
37 in the XRD analysis reported in Fig. 2. Fig. 4B shows the experimental weights registered for the representative series of samples, together with the theoretical lines that would result from the quantitative precipitation of Na2CO3·H2O or Na2CO3.
3.2. Effect of stirring rate
The characterisation performed on all samples allowed for the determination of the effect on the reaction extent linked to the stirring rate. A Ca mass balance was performed for all the samples discussed here, in order to validate the results from TG analysis; the difference between the inbound (CaCO3) and outbound (Ca(OH)2 and CaCO3) calcareous species was considered to do that, revealing oscillations of ±0.2 g of Ca. The Ca mass balance supported the TG analysis, and the specific values for each sample discussed is reported as ESI,† alongside an overview of the samples phase compositions gained by TG analysis. The XRD analysis was qualitatively reflecting the quantification performed, considering the decreasing intensity of the main peak related to CaCO3 at 2θ = 29.5° at longer, whereas those related to the products Ca(OH)2, Na2CO3·H2O, and Na2CO3 were increasing in intensity (Fig. 5).The TG quantification reported in Fig. 6 shows the highest conversion at a stirring rate of 40 rpm, while significant efficiency drops were observed at 2000 rpm. The loss of efficiency at increased stirring rate was most notable in those samples reacted for 30 seconds, with an efficiency drop of 34.1% between 40 and 300 rpm observed for this residence time; the impact was reduced at increasing ones. Generally, the increase in reaction extent above 300 seconds was limited.
These outcomes might be justified by physical reasons, as mentioned in Section 1, linked to the significantly different density of a 45 wt% NaOH solution (1.42–1.48 kg dm−338![[thin space (1/6-em)]](https://www.rsc.org/images/entities/char_2009.gif) ) and the reagent grade CaCO3 (2.93 kg dm−339
) and the reagent grade CaCO3 (2.93 kg dm−339![[thin space (1/6-em)]](https://www.rsc.org/images/entities/char_2009.gif) ). That would be expected to cause a net separation of the liquid and solid phases within the paste at higher stirring rates due to centrifugation effects, leading to a lower contact between the reactants21–23 and a resulting hindered conversion, as shown in Fig. 7.
). That would be expected to cause a net separation of the liquid and solid phases within the paste at higher stirring rates due to centrifugation effects, leading to a lower contact between the reactants21–23 and a resulting hindered conversion, as shown in Fig. 7.
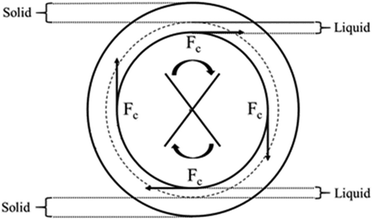 | ||
| Fig. 7 Schematic representation of the partition occurring between the solid (CaCO3) and liquid (NaOH sol.) phases at increasing centrifugal force (Fc) or stirring rate. | ||
Alternatively, the lower conversion registered at higher stirring rates may be linked to the main mechanism ruling the reaction progress; several models were considered, including diffusion, and contracting volume or surface, but a nucleation mechanism was strongly suggested. Fig. 8 shows the fitting between the whole set of experimental data reported here and the nucleation model proposed by Avrami–Erofeyev;40 it is reflected in eqn (5), where k and α identify the kinetic constant and the conversion extent of the reaction, respectively and its integrated form (eqn (6)).
 | (5) |
 | (6) |
 | ||
| Fig. 8 Fitting between the experimental data for all the samples here discussed and the Avrami–Erofeyev nucleation model represented by eqn (6); the samples were grouped according to the stirring rate used, and R2 values are highlighted for each one. | ||
Given the heterogeneous reaction taken into account here, a nucleation mechanism involves the primary formation of small crystals of the new product phase within large ones of the reactant; this process is thermodynamically unfavourable at first, given the higher free Gibbs energy ΔG41![[thin space (1/6-em)]](https://www.rsc.org/images/entities/char_2009.gif) linked to the instability of the nuclei formed.42 Upon achievement of a critical size, the nucleus assumes a more stable configuration, while expanding and incorporating other potential nuclei; nucleation continues until the progression front covers the whole surface of the solid. From here, the nucleation kinetic lowers because of the surface product layer which reduces the contact surface between the reactants.
linked to the instability of the nuclei formed.42 Upon achievement of a critical size, the nucleus assumes a more stable configuration, while expanding and incorporating other potential nuclei; nucleation continues until the progression front covers the whole surface of the solid. From here, the nucleation kinetic lowers because of the surface product layer which reduces the contact surface between the reactants.
The effect of stirring rate on the nucleation density and crystal morphology has been empirically accepted in chemical and cast metals industries,43 and the role of convection in single crystals forming has been widely discussed already.44,45 Generally, the studies report an enhanced nucleation density in dynamic conditions with respect to static ones,46 leading to shorter residence times required.47 Taking into account the high R2 values reported in Fig. 8 in correlation with the Avrami–Erofeyev model, the present study would introduce controversial outcomes at first sight. In fact, nucleation appears to be hindered at higher stirring rates, when the collisions between the reactants and the formation of surface irregularities and cracks should statistically be more frequent. Such a controversial observation might be likely explained by considering an enhanced partition of the solid and liquid bulks at higher stirring rates,22 preventing further contact and reaction progression (Fig. 7). In other words, despite the higher turbulence, the entropy of the system would lower as a consequence of the hindered contact between solid and liquid reactants, reflecting a higher ΔG at faster stirring rates. Such an effect could be furtherly increased by the eventual distorted expansion of the nuclei undergoing axial centrifugal forces Fc,48 as also outlined in Fig. 9.
 | ||
| Fig. 9 Schematic representation of the nucleation front progression (grey pattern) occurring at high (left) and low (right) stirring rates. | ||
3.3. Equilibrium between Na2CO3·H2O and Na2CO3
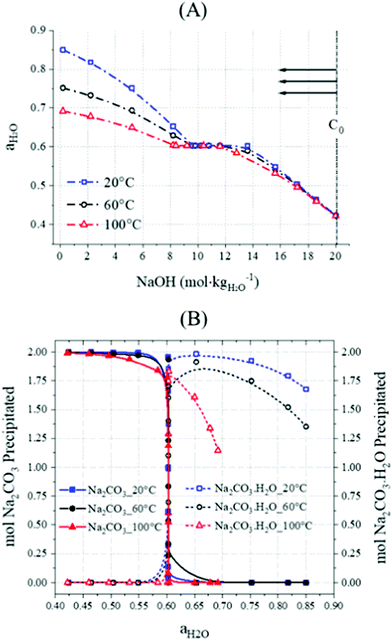
As mentioned in Section 1, an effective separation of the products will be required upon reaction, and it may likely involve their dissolution in water or solvent. The separation would likely exploit the different solubility of Ca(OH)2, Na2CO3·H2O, and Na2CO3, and the understanding of the equilibrium between Na2CO3·H2O and Na2CO3 could dictate the optimal processing conditions. The proportioning of Na2CO3·H2O and Na2CO3 at different stirring rates and residence times has been here assessed, and useful information has been provided for an eventual scale-up of the process. Together with the phase quantification performed by TG, the XRD analysis confirmed the enhanced formation of Na2CO3·H2O with respect to Na2CO3 up to a stirring rate of 800 rpm (Fig. 5) and at increasing residence times (Fig. 2). To gain further insight, the behaviour of Na2CO3·H2O and Na2CO3 in the Na2CO3–NaOH–H2O system was studied using PHREEQC – PH REdox EQuilibrium (in C language), a geochemical modelling software simulating a variety of reactions and processes at equilibrium,49 in particular focusing on the activity of water. The simulation was performed at 20, 60 and 100 °C; both Na2CO3·H2O (0.1 mol) and Na2CO3 (0.1 mol) were initially introduced into 100 mL of pure water, and NaOH was added in successive steps up to 20 M; given the high NaOH concentrations taken into account, the Pitzer model was used here.50 The Na2CO3·H2O and Na2CO3 phases were specified by the equilibria reported below in eqn (7) and (8), respectively, while the total 2 moles of NaOH additions were performed in 20 steps up to a molality of 20 (2 moles NaOH in 0.1 kg H2O).| Na2CO3 + H+ ↔ HCO3− + 2Na+ logk = 11.2 | (7) |
| Na2CO3·H2O + H+ ↔ HCO3− + 2Na+ + H2O logk = 10.9 | (8) |
Additionally, given the stoichiometry of the reaction (eqn (3)), and considering the concentration of dissolved Ca2+ to be negligible under these highly alkaline conditions due to the limited solubility of Ca(OH)2, the final OH− concentration would depend on the consumption of NaOH to convert CaCO3 to products. In other words, a higher conversion would lead to lower final OH− concentrations, as outlined by the experimental data reported in Fig. 11.
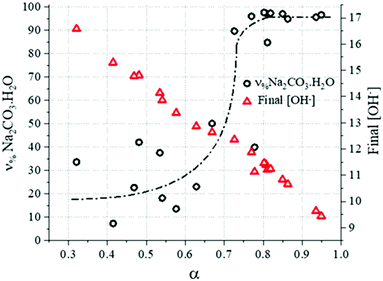 | ||
| Fig. 11 ν %Na2CO3·H2O values and final OH− concentration, experimentally determined as a function of conversion. | ||
Following the quantification of the solid phase species within the system, the molar proportion of Na2CO3·H2O formed in the binary system Na2CO3·H2O/Na2CO3 can be calculated. Doing this, it was possible to observe that Na2CO3 was dominantly forming at the early stage of the reaction (or when the progress of the reaction is limited) because of the low activity of water due to the high concentration of NaOH in the system (Fig. 11). However, as the reaction progresses, the formation of Na2CO3·H2O may have been enhanced by the rising H2O activity due to the consumption of NaOH, as shown in eqn (3). This would explain the higher contents of Na2CO3 in the systems with a limited progress of the reaction, corresponding to shorter residence times (Fig. 4A) or faster stirring rates (Fig. 5). These outcomes are in accordance with the thermodynamic trends reported in Fig. 10B.
3.4. CO2 capture
The quantification of Na2CO3·H2O and Na2CO3 also allowed to calculate the fraction of CO2 trapped out of the initial amount introduced as CaCO3, and to outline the CO2 capture rate. Eqn (9) outlines the mass balance for CO2 upon reaction, taking into account the initial CO2 introduced with CaCO3 (gCO2,Initial), the fraction of CO2 captured through precipitation of Na2CO3·H2O and Na2CO3 (gCO2,Captured), and the CO2 embodied into unreacted CaCO3 (gCO2,Unreacted). These parameters were calculated by taking into account CO2 fractions of 44.0 wt%, 35.5 wt% and 41.5 wt% for CaCO3, Na2CO3·H2O, and Na2CO3, respectively, apart from the sample-specific phase assemblage.| gCO2,Initial − gCO2,Captured = gCO2,Unreacted | (9) |
 | (10) |
![[thin space (1/6-em)]](https://www.rsc.org/images/entities/char_2009.gif) k in Fig. 12B, was decreasing for all the samples at longer residence times, in line with the limited reaction extent registered above 300 seconds (Fig. 6). The highest CO2 capture rate (2.7 × 10⁻³ molCO2 s−1) was registered for the sample reacted at 40 rpm for 30 seconds, and a 94% CO2 capture was achieved after 720 seconds of reaction progress at the same stirring rate. The high resemblance with the trends reported in Fig. 6 suggest that the precipitation of Ca(OH)2 does not affect the trapping of the process CO2 into Na2CO3·H2O nor Na2CO3, and also reflecting a high accordance to the stoichiometry depicted in eqn (3).
k in Fig. 12B, was decreasing for all the samples at longer residence times, in line with the limited reaction extent registered above 300 seconds (Fig. 6). The highest CO2 capture rate (2.7 × 10⁻³ molCO2 s−1) was registered for the sample reacted at 40 rpm for 30 seconds, and a 94% CO2 capture was achieved after 720 seconds of reaction progress at the same stirring rate. The high resemblance with the trends reported in Fig. 6 suggest that the precipitation of Ca(OH)2 does not affect the trapping of the process CO2 into Na2CO3·H2O nor Na2CO3, and also reflecting a high accordance to the stoichiometry depicted in eqn (3).
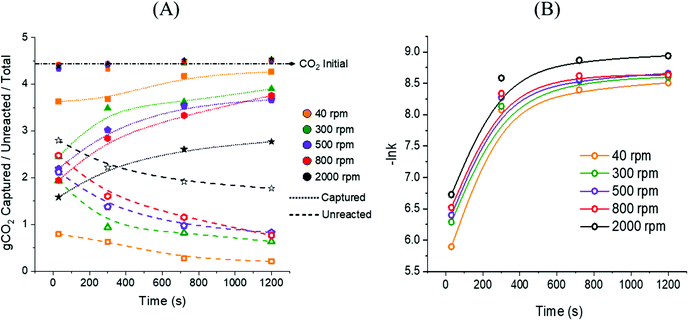 | ||
| Fig. 12 Trends of gCO2,Captured and gCO2,Unreacted at increasing residence times registered for all the samples discussed here (A); CO2 capture rate (molCO2 Captured s−1) calculated for all the samples from eqn (10) (B). | ||
3.5. Decarbonisation of industrial grade chalk
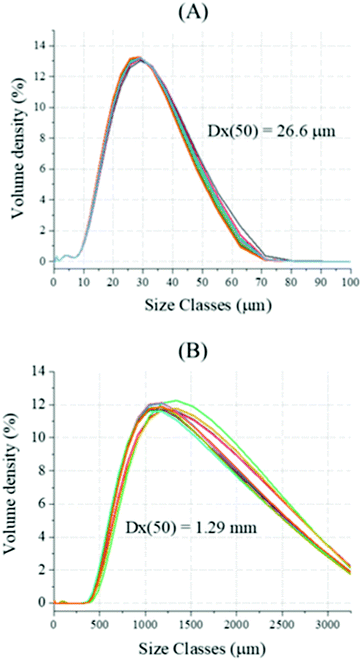
Chalk with larger particle sizes were subjected to the same reaction, and the size of the reacting solids was chosen upon sieving. The dry PSD analysis revealed a much higher mean particle diameter (Dx(50) of 1.29 mm, Fig. 13B) respect with the reagent grade CaCO3 (Dx(50) of 26.6 μm, Fig. 13A); during the analysis, weighted residual and laser obscuration of 3.25% and 2.97%, respectively, were registered. Additionally, both XRF (Table 1) and TG analyses were performed on the solids, upon fine grinding and sieving below 38 μm.Fig. 14 shows the outcomes of the XRD analysis performed on the ground products; the peaks related to the products Ca(OH)2, Na2CO3·H2O, and Na2CO3 could be observed in the reacted solids, together with a slight reduction in intensity of CaCO3.
 | ||
| Fig. 14 XRD patterns of the reacted and unreacted industrial grade chalk, with labelled phases cCaCO3 (calcite), Ca(OH)2, Na2CO3·H2O, Na2CO3 and vCaCO3 (vaterite). | ||
The TG analysis (Fig. 15) reported a total 30.6 wt% loss for the sample, and the extent of reaction α was estimated to be 0.3, given the contents of CaCO3 (53.8 wt%) and Ca(OH)2 (17.4 wt%). A 2.3 wt% loss observed in the temperature range of 50–130 °C, likely referring to the dehydration of Na2CO3·H2O, whose content was estimated to be 16 wt%.
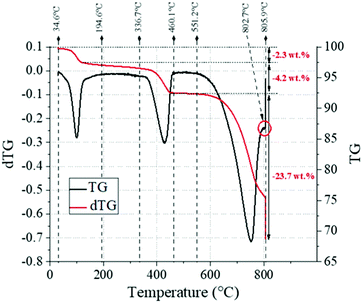 | ||
| Fig. 15 TG (black line) and DTG (red line) trends for the industrial grade chalk reacted here, highlighting the key temperature ranges and the corresponding weight losses observed. | ||
The XRD analysis could also reveal traces of Na2CO3, which could not be reliably quantified by TG (Section 3.1) because of the significant presence of impurities (Table 1); for the same reason, it was not possible to reliably assess the proportioning between Na2CO3·H2O and Na2CO3. It must be mentioned that the large particle size here would significantly affect the yield of the reaction, by largely decreasing the contact surface between the liquid and solid reactants. The DTG curve also shows a small shoulder at 802.7 °C. Based on the XRD analysis (Fig. 14), this could be assigned to the decarbonisation of vaterite, a metastable polymorph of calcite which is often observed during the synthesis of precipitated calcium carbonate,56–58 and which is seen in the XRD results for the reacted sample in Fig. 14. Fig. 16A–F show the SEM analysis performed on two representative samples taken from the reacted and unreacted chalk solid particles. As expected, Na could only be detected in the reacted particles (Fig. 16B), in line with the formation of Na2CO3·H2O or Na2CO3, and higher signals were detected towards the external sections of the solid bead; such a detail will be discussed below, where the EDX analysis of a large number of reacted solid particles is taken into account. Here, the EDX quantification of Na was performed with the software Quantax-70 by considering internal and external sections of the solid particles, chosen by taking into account the Na mapping in Fig. 16B, which highlights a sharp change in Na concentration at a depth of about 200 μm.
Specifically, sodium contents of 18.92 wt% and 7.32 wt% were detected in the external and internal sections of the reacted particle, respectively, whereas negligible sodium contents (0.01–0.06 wt%) could be observed in the unreacted chalk. In any case, the sodium peak seen in Fig. 16B and D is reflected in Fig. 16E and F, where the EDX analysis showed Na signals around 1 keV; as observed, no signals linked to Na could be detected for the unreacted particle, while a significant gap was observed between the external and internal sections of the reacted one. Moreover, rather homogeneous distribution of Ca (Fig. 17C, D and 18C, D) is observed, with slightly higher contents in the internal regions respect with the external ones. That is an expected result, since the stoichiometry of the reaction would lead to an overall weight increase given the reactant (CaCO3) and products (Ca(OH)2, Na2CO3·H2O, and Na2CO3) involved (Section 3.1 and Fig. 4B). Despite Ca should not be lost from the solid surface throughout the reaction, as outlined from the Ca mass balance in ESI,† the uptake of sodium would result in a final lower Ca proportion in those local regions where the reaction occurred more extensively. As previously mentioned, the particles undergoing SEM analysis were grouped into two sets by their size: 700 ≤ D ≤ 1000 μm and 400 μm ≤ (D) ≤ 700 μm.
In both groups, higher contents of Na could be detected in the peripheral regions of each solid particle, at the solid/liquid interface during the reaction. A significant presence of Na was detected within the particles up to a depth of 150–200 μm on average, as shown in Fig. 17B and 18B. A normalized radius DN was taken into account to display the results, and it was calculated by dividing the punctual length on the radius where the elemental quantification was performed by the total radius of the specific particle. As a DN of 0.5 identifies the centre of the particle, DN of 0 and 1 reflect its extremes; given that, the Na and Ca contents were detected at DN values of 0.0, 0.25, 0.50, 0.75 and 1.0 to better display the gradient observed at gradual depths from the surface. On average of five samples, Na contents were (wt%) of 11.1 ± 2.5 (DN = 0) and 4.2 ± 2.2 (DN = 0.5) for the larger group of particles, while 10.6 ± 2.0 (DN = 0) and 7.2 ± 2.7 (DN = 0.5) were observed for the smaller particles. Regarding Ca (Fig. 17C, D and 18C, D), slightly higher contents in the inner regions of the solids were observed; the lower local Na content would suggest limited reaction progress into these regions, consistent with the low overall extent of reaction α of 0.3.
Fig. 19 shows the SEM-EDX analysis performed on a single reacted chalk bead collected upon grinding and sieving between 150 and 250 μm. Pseudo-hexagonal shaped crystals of Na2CO3·H2O and Na2CO359 are surrounded by small-sized Ca(OH)2 crystals, showing a facetted tetrakaidekahedral morphology.60 As supported by the XRF and XRD analyses reported in Table 1 and Fig. 14, respectively, significant silica agglomerates could also be detected; in the reaction products, those were partially covered by Ca(OH)2 layers.
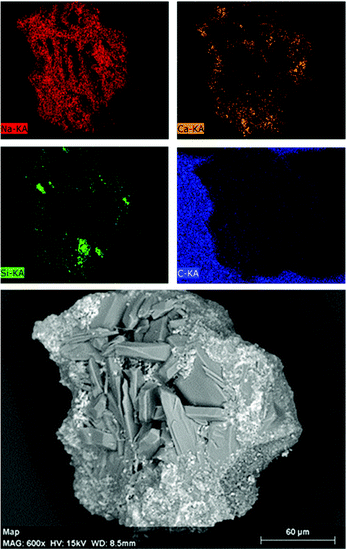 | ||
| Fig. 19 SEM images of the reaction products from the chalk upon grinding and sieving between 150 and 250 μm; the samples were attached on conductive carbon adhesive tapes. | ||
4. Conclusions
The study of the reaction of CaCO3 in NaOH solution allowed for the optimisation of processing parameters such as the residence time and the mixing rate. Close to optimum conversion could be obtained after 300 seconds of stirring, while further contact between the reactants did not lead to significant yield improvements. A low stirring rate resulted in enhancing the conversion extent. It is likely that the lower conversion achieved at high stirring rates may be linked to enhanced events of nuclei incorporation or the solid/liquid partition at higher centrifugal force. The proportioning of Na2CO3·H2O and Na2CO3 was found to be largely affected by the activity of water of the system considered; specifically, Na2CO3·H2O and Na2CO3 were the favoured species in the final systems at higher and lower water activity, respectively. However, the reaction was effectively capturing the process CO2 embodied in CaCO3, up to the 95% of the total introduced into the system. The comparison between the SEM-EDX analysis of reacted and unreacted chalk samples suggested the possibility of assessing the reaction extent by detection of Na within the solid products. Assuming so, the reaction progression could be visually observed by detection of Na, whose gradient was defined for the solid reacted particles, and whose propagation was observed up to 150 μm deep from the solid/liquid interface. The lower reaction extent obtained for larger CaCO3 solids (D ∼ 1 mm) suggested that this alternative route would require additional grinding to achieve a satisfactory decarbonisation, if compared to the average size of the raw CaCO3 feed (2–200 mm) used in a conventional lime or cement plant.1 Although, we believe that the additional emissions arising from the higher electrical consumption required for a finer CaCO3 would be negligible, if compared with the avoided combustion and process CO2.In conclusion, the chemical decarbonisation of CaCO3 allowed for the nearly total capture of the process CO2, while converting CaCO3 to the essential lime. These positive outcomes may be obtained relatively simply, given the mild mixing conditions and heating required; despite that, the use of highly-corrosive NaOH solutions requires further investigation for an eventual scale-up.
Author contributions
Theodore Hanein and Hajime Kinoshita discovered and conceptualized the technology. Theodore Hanein, Hajime Kinoshita, John L. Provis, and Marco Simoni developed the technology and designed the methodology and experiments. Theodore Hanein, Marco Simoni, and Chun Long Woo carried out experiments. Marco Simoni drafted the original manuscript. Theodore Hanein, Hajime Kinoshita, and John L. Provis acquired funding, and supervised Marco Simoni and Chun Long Woo about authorship. Theodore Hanein, Hajime Kinoshita, John Provis, Mark Tyrer, Juan-Carlos Martinez, Magnus Nyberg, Alan Maries, John Stennet and Nestor I. Quintero-Mora reviewed and edited the manuscript.Conflicts of interest
The authors declare that they have no competing interests as defined by Physical Chemistry Chemical Physics, or other interests that might be perceived to influence the interpretation of the article.Acknowledgements
This work was funded by the Engineering and Physical Science Research Council (EPSRC) and CEMEX under grant ID EP/R025959/1. The group would also express gratitude to Dr John Stennet for the support and knowledge received.References
- F. Schorcht, et al., Best available techniques (BAT) reference document for the production of cement, lime and magnesium oxide. European Commission Joint Research Centre Institute for Prospective Technological Studies (Report EUR 26129 EN), Luxembourg: Publications Office of the European Union, 2013, https://eippcb.jrc.ec.europa.eu/reference/BREF/CLM_Published_def.pdf, DOI: 10.2788/12850.
- P. C. Foreman and I. E. Barnes, A review of calcium hydroxide, Int. Endod. J., 1990, 23(6), 283–297, DOI:10.1111/j.1365-2591.1990.tb00108.x.
- A. Farhad and Z. Mohammadi, Calcium hydroxide: a review, Int. Dent. J., 2005, 55(5), 293–301, DOI:10.1111/j.1875-595X.2005.tb00326.x.
- A. Dowling, J. O'Dwyer and C. C. Adley, Lime in the limelight, J. Cleaner Prod., 2015, 92, 13–22, DOI:10.1016/j.jclepro.2014.12.047.
- G. Habert, et al., Environmental impacts and decarbonization strategies in the cement and concrete industries, Nat. Rev. Earth Environ., 2020, 1–15, DOI:10.1038/s43017-020-0093-3.
- J. A. H. Oates, Lime and limestone: chemistry and technology, production and uses, John Wiley & Sons, 2008, ISBN 3-527-29527-5 Search PubMed.
- A. S. Gutiérrez, J. B. C. Martínez and C. Vandecasteele, Energy and exergy assessments of a lime shaft kiln., Appl. Therm. Eng., 2013, 51(1–2), 273–280, DOI:10.1016/j.applthermaleng.2012.07.013.
- L. Barcelo, et al., Cement and carbon emissions, Mater. Struct., 2014, 47(6), 1055–1065, DOI:10.1617/s11527-013-0114-5.
- A. A. Boateng, Rotary kilns: transport phenomena and transport processes, Butterworth–Heinemann, 2015, ISBN 978-0-12-803780-5 Search PubMed.
- ReportLinker, Global Calcium Hydroxide Industry, October, 2020, https://www.reportlinker.com/p05956205/?utm_source=GNW.
- R. M. Andrew, Global CO2 emissions from cement production, Earth Syst. Sci. Data, 2018, 10(1), 195–217, DOI:10.5281/zenodo.831455.
- T. Stocker, Climate change 2013: the physical science basis: Working Group I contribution to the Fifth assessment report of the Intergovernmental Panel on Climate Change, Cambridge University Press, 2014 Search PubMed.
- P. Friedlingstein, et al., Global carbon budget, Earth Syst. Sci. Data, 2019, 11(4), 1783–1838, DOI:10.5194/essd-11-1783-2019.
- J. Rogelj, et al., Paris Agreement climate proposals need a boost to keep warming well below 2C, Nature, 2016, 534(7609), 631, DOI:10.1038/nature18307.
- J. Skea, P. Ekins and M. Winskel, Energy 2050: Making the transition to a secure low carbon energy system, Routledge, 2011, ISBN 978-1-84971-084-8 Search PubMed.
- T. Hanein, et al., Decarbonisation of calcium carbonate at atmospheric temperatures and pressures, with simultaneous CO2 capture, through production of sodium carbonate, Energy Environ. Sci., 2021, 14(12), 6595–6604, 10.1039/D1EE02637B17.
- P. W. M. Jacobs and F. C. Tompkins, Chemistry of the solid state, Surfaces of Solids, 1955, 91–122 Search PubMed.
- S. Homma, et al., Gas–solid reaction model for a shrinking spherical particle with unreacted shrinking core, Chem. Eng. Sci., 2005, 60(18), 4971–4980, DOI:10.1016/j.ces.2005.03.057.
- M. Castellote and C. Andrade, Modelling the carbonation of cementitious matrixes by means of the unreacted-core model, UR-CORE, Cem. Concr. Res., 2008, 38(12), 1374–1384, DOI:10.1016/j.cemconres.2008.07.004.
- S. L. Soo, Fluid dynamics of multiphase systems, Blaisdell Publishing Co., Waltham, Mass, 1967, OCLC No. 1301193 Search PubMed.
- M. I. Yudine, Physical considerations on heavy-particle diffusion, Advances in geophysics, Elsevier, 1959, pp. 185–191 DOI:10.1016/S0065-2687(08)60106-5.
- M. Micheletti, et al., Particle concentration and mixing characteristics of moderate-to-dense solid–liquid suspensions, Ind. Eng. Chem. Res., 2003, 42(24), 6236–6249, DOI:10.1021/ie0303799.
- A. Tamburini, et al., Dense solid–liquid off-bottom suspension dynamics: simulation and experiment, Chem. Eng. Res. Des., 2009, 87(4), 587–597, DOI:10.1016/j.cherd.2008.12.024.
- F. Du, et al., Sodium Hydroxide Production from Seawater Desalination Brine: Process Design and Energy Efficiency, Environ. Sci. Technol., 2018, 52(10), 5949–5958, DOI:10.1021/acs.est.8b01195.
- J. Neubauer and H. Pöllmann, Alinite—Chemical composition, solid solution and hydration behaviour, Cem. Concr. Res., 1994, 24(8), 1413–1422, DOI:10.1016/0008-8846(94)90154-6.
- K. L. Scrivener, V. M. John and E. M. Gartner, Eco-efficient cements: Potential economically viable solutions for a low-CO2 cement-based materials industry, Cem. Concr. Res., 2018, 114, 2–26, DOI:10.1016/j.cemconres.2018.03.015.
- A. Leemann and B. Lothenbach, The influence of potassium–sodium ratio in cement on concrete expansion due to alkali-aggregate reaction., Cem. Concr. Res., 2008, 38(10), 1162–1168, DOI:10.1016/j.cemconres.2008.05.004.
- E. T. Bueno, et al., A review of ground waste glass as a supplementary cementitious material: A focus on alkali–silica reaction, J. Cleaner Prod., 2020, 257, 120180, DOI:10.1016/j.jclepro.2020.120180.
- A. Seidell, Solubilities of inorganic and metal organic compounds, 1940, ISBN: 0598437002, 9780598437006 Search PubMed.
- G. W. Morey, The action of water on calcite, magnesite and dolomite, Am. Mineral., 1962, 47(11–12), 1456–1460 CAS.
- J. L. Ellingboe and J. H. Runnels, Solubilities of Sodium Carbonate and Sodium Bicarbonate in Acetone–Water and Methanol–Water Mixtures, J. Chem. Eng. Data, 1966, 11(3), 323–324 CrossRef CAS.
- J. Zelić, D. Rušić and R. Krstulović, Kinetic analysis of thermal decomposition of Ca(OH)2 formed during hydration of commercial Portland cement by DSC, J. Therm. Anal. Calorim., 2002, 67(3), 613–622, DOI:10.1023/A:1014348603686.
- P. K. Gallagher and D. W. Johnson Jr, The effects of sample size and heating rate on the kinetics of the thermal decomposition of CaCO3, Thermochim. Acta, 1973, 6(1), 67–83, DOI:10.1016/0040-6031(73)80007-3.
- M. Hartman, et al., Thermal dehydration of the sodium carbonate hydrates, Chem. Eng. Commun., 2001, 185(1), 1–16, DOI:10.1080/00986440108912851.
- K. O. Kjellsen, et al., Preparation of flat-polished specimens for SEM-backscattered electron imaging and X-ray microanalysis—importance of epoxy impregnation, Cem. Concr. Res., 2003, 33(4), 611–616, DOI:10.1016/S0008-8846(02)01029-3.
- K. Motzfeldt, The thermal decomposition. of sodium carbonate by the effusion method, J. Phys. Chem., 1955, 59(2), 139–147 CrossRef CAS.
- E. Raymundo-Pinero, et al., KOH and NaOH activation mechanisms of multiwalled carbon nanotubes with different structural organisation, Carbon, 2005, 43(4), 786–795, DOI:10.1016/j.carbon.2004.11.005.
- D. W. Green and M. Z. Marylee, Perry's chemical engineers' handbook, McGraw-Hill Education, 2019 Search PubMed.
- P. Patnaik, Handbook of inorganic chemicals, McGraw-Hill, New York, 2003, vol. 529 Search PubMed.
- A. Khawam and D. R. Flanagan, Solid-state kinetic models: basics and mathematical fundamentals, J. Phys. Chem. B, 2006, 110(35), 17315–17328, DOI:10.1021/jp062746a.
- P. G. Vekilov, Nucleation, Cryst. Growth Des., 2010, 10(12), 5007–5019, DOI:10.1021/cg1011633.
- J. J. De Yoreo and P. G. Vekilov, Principles of crystal nucleation and growth, Rev. Mineral. Geochem., 2003, 54(1), 57–93, DOI:10.2113/0540057.
- J. W. Mullin, Crystallization, Elsevier, 4th Edn, 2001 DOI:10.1021/op0101005.
- J. C. Brice, Some thermodynamic aspects of the growth of strained crystals, J. Cryst. Growth, 1975, 28(2), 249–253, DOI:10.1016/0022-0248(75)90241-9.
- J. D. Weeks and G. H. Gilmer, Dynamics of crystal growth, Adv. Chem. Phys., 1979, 40(489), 157–227 CAS.
- H. Hu, et al., Nucleation and crystal growth control for scalable solution-processed organic–inorganic hybrid perovskite solar cells, J. Mater. Chem. A, 2020, 8(4), 1578–1603, 10.1039/C9TA11245F.
- A. Kouchi, A. Tsuchiyama and I. Sunagawa, Effect of stirring on crystallization kinetics of basalt: texture and element partitioning, Contrib. Mineral. Petrol., 1986, 93(4), 429–438, DOI:10.1007/BF00371713.
- J. Garside, A. Mersmann and J. Nývlt, Measurement of crystal growth and nucleation rates, IChemE, 2002 Search PubMed.
- D. L. Parkhurst and C. A. J. Appelo, Description of input and examples for PHREEQC version 3: a computer program for speciation, batch-reaction, one-dimensional transport, and inverse geochemical calculations, US Geological Survey, 2013 DOI:10.3133/tm6A43.
- K. S. Pitzer, Ion interaction approach: theory and data correlation, Activity coefficients in electrolyte solutions, CRC Press, 2018, pp. 75–153 Search PubMed.
- O. Miyawaki, et al., Activity and activity coefficient of water in aqueous solutions and their relationships with solution structure parameters, Biosci., Biotechnol., Biochem., 1997, 61(3), 466–469, DOI:10.1271/bbb.61.466.
- J. Mazurkiewicz, P. Tomasik and J. Zapłotny, Relationships between water activity and viscosity of solutions, Food hydrocolloids, 2001, 15(1), 43–46, DOI:10.1016/S0268-005X(00)00048-5.
- R. T. Pabalan and K. S. Pitzer, Thermodynamics of NaOH (aq) in hydrothermal solutions, Geochim. Cosmochim. Acta, 1987, 51(4), 829–837, DOI:10.1016/0016-7037(87)90295-X.
- J. Balej, Water vapour partial pressures and water activities in potassium and sodium hydroxide solutions over wide concentration and temperature ranges, Int. J. Hydrogen Energy, 1985, 10(4), 233–243, DOI:10.1016/0360-3199(85)90093-X.
- J. Jiang and S. I. Sandler, A new model for the viscosity of electrolyte solutions, Ind. Eng. Chem. Res., 2003, 42(25), 6267–6272, DOI:10.1021/ie0210659.
- S. R. Kamhi, On the structure of vaterite CaCO3, Acta Crystallogr., 1963, 16(8), 770–772, DOI:10.1107/S0365110X63002000.
- J. D. Rodriguez-Blanco, S. Shaw and L. G. Benning, The kinetics and mechanisms of amorphous calcium carbonate (ACC) crystallization to calcite, via vaterite, Nanoscale, 2011, 3(1), 265–271, 10.1039/C0NR00589D.
- N. Spanos and P. G. Koutsoukos, The transformation of vaterite to calcite: effect of the conditions of the solutions in contact with the mineral phase, J. Cryst. Growth, 1998, 191(4), 783–790, DOI:10.1016/S0022-0248(98)00385-6.
- S. Yu and C. T. Oguchi, Is sodium sulphate invariably effective in destroying any type of rock?, Geol. Soc. London, Spec. Publ., 2010, 333(1), 43–58, DOI:10.1144/SP333.5.
- X. Chen, et al., Morphology prediction of portlandite: Atomistic simulations and experimental research, Appl. Surf. Sci., 2020, 502, 144296, DOI:10.1016/j.apsusc.2019.144296.
Footnote |
| † Electronic supplementary information (ESI) available. See DOI: https://doi.org/10.1039/d2cp01412b |
| This journal is © the Owner Societies 2022 |

